Development of a new sequential block finding strategy for detection of conserved sequences in riboswitches
Bioimpacts, 8(1), 13-22; DOI:10.15171/bi.2018.03
Original Research
Development of a new sequential block finding strategy for detection of conserved sequences in riboswitches
Faegheh Golabi1,2,
Mousa Shamsi1*,
Mohammad Hosein Sedaaghi1,
Abolfazl Barzegar2,3,
Mohammad Saeid Hejazi4,5*
*Corresponding authors: Mousa Shamsi, Email: shamsi@sut.ac.ir; Mohammad Saeid Hejazi, Email: msaeidhejazi@yahoo.com
Abstract
Introduction:
Some non-coding RNAs have an important role in the regulation of gene expression and consequently cellular function. Riboswitches are examples of these regulatory RNAs. Riboswitches are classified into various families according to sequential and structural similarities.
Methods:
In this study, a block finder algorithm for identification of frequently appearing sequential blocks in five families of riboswitches from Rfam 12.0 database, without the use of alignment methods, was developed.
Results:
The developed program identified 21 frequently appearing blocks in five families of riboswitches.
Conclusion:
Comparison of the results of the proposed algorithm with those of sequential alignment methods revealed that our method can recognize most of the patterns present in conserved areas of individual riboswitch families and determine them as specific blocks, implying potential of the developed program as a platform for further studies and developments.
Keywords: Riboswitch, non-coding RNA, sequential block, un-translated regions
Introduction
Since the discovery of DNA’s unique structure, lots of researches have been carried out and also many studies are still required for more understanding of the genome and its elements structure and functions. The amount of accessible genomic data is increasing rapidly and as a result, the studies of their classification, fundamental characteristics and relations need further and new computational tools. Nearly complete genomes of some eukaryotes such as human, rat, chicken and some plants together with numerous prokaryotes such as bacteria, archaea and even viruses are determined and very quickly the number of studied genome-wide sequences is increased. This creates an opportunity for all researchers to conduct various investigations such as structural and differential studies on these data, from gene elements and single genes to whole genomes. The main goal of genetics is to extract and understand the specialized functions and information latent in genomes expressed by the genes and regulatory elements. One of the main steps to achieve this goal is to detect and identify the location and characteristics of various elements of entire genome sequences such as protein coding regions and GRNs.
Thousands of various actions and reactions are performed in the cells all the time. To have an accurate procedure and to make better use of energy and available resources, each cell should regulate its functions and metabolism by adjusting the level of functional molecules continuously. Various cellular regulatory mechanisms are results of effective cooperation of different bio-molecules such as DNAs, RNAs and proteins. For a long time, proteins were assumed as the most important class of the regulatory bio-molecules, as they were responsible for a lot of structural changes, chemical interactions and cell regulations. However, later studies on the molecular biology showed that such traditional approach is defective for explanation of many biological functions, especially in complex organisms such as plants, insects and animals.1,2 Afterwards, further studies revealed that RNA molecules in addition to their established classic structural and functional role in protein synthesis play regulatory roles in gene expression. In fact, besides other molecules such as proteins, some non-coding RNAs (while do not translate into proteins) have an important role in the regulation of cellular functions.3 micro RNAs (miRNAs),4 riboregulators5 and riboswitches6-9 are examples of these regulatory RNAs. Accordingly, understanding the nature of gene regulatory mechanisms is very important for comprehending the cellular mechanisms and pathways raised from structural DNA regions. The gene regulatory network (GRN) is spread widely alongside the genome sequence. While UTRs are very rich in containing functional non-coding RNA (ncRNAs), gene prediction methods do not provide enough and quite satisfying evidence for exact location and sequence of the UTR elements. Therefore, development of new methods is in demand to provide enough and quite satisfying evidence for exact location and length of regulatory segments in UTRs.
One of the most important parts of GRNs is riboswitches, which are usually located in mRNAs' 5’UTRs.9-11 It is shown that some mRNAs directly bind to target metabolites and confer self-regulatory mechanism. This characteristic is mainly explained by mRNA secondary and tertiary structures. The part of the mRNA molecule which is called “Riboswitch”, can contribute to regulation of gene expression according to its structural function and the metabolite density. When binding with the target molecule, the structure in that area of the riboswitch changes, enabling it to perform its regulatory function. For example, a riboswitch can form a structure that blocks the ribosome binding site and eventually stops protein synthesis by the ribosome. Riboswitches are categorized into several families according to their functions, sequence conservation and also the secondary and tertiary structure similarities. This is because every riboswitch's function depends on its sequence and 2 and 3-dimentional structure. Therefore, riboswitches with similar sequence and structure perform a similar task. Considering the importance of data mining for prediction and finding riboswitches, in this study we designed an algorithm for identification of frequently appearing sequential blocks in riboswitch families without the use of alignment methods.
Materials and Methods
Preparation of the data
Five families of riboswitches including PreQ1,12,13 SAM,7,14 Purine,15,16 FMN17,18 and TPP6,19 families, containing 41, 433, 133, 144 and 115 members in each family, respectively, were selected (Table 1) and their data were used for block detection. Datasets were obtained from Rfam 12.0 database.20,21 The studied riboswitch families' sequential and secondary structure characteristics were also extracted from the same source. The riboswitches' seed sequences used in the developed program were downloaded in un-gapped FASTA format. The mean lengths and variance of lengths of the studied riboswitch families were also calculated (Table 1).
| Table 1. Five families of riboswitches which their seed data are used to detect the blocks |
|
Riboswitch family name
|
Rfam accession number
|
Number of seed data
|
Average length of members (nucleotides)
|
Variance of the length of members
|
| PreQ1 |
RF00522 |
41 |
46 |
3.45 |
| SAM |
RF00162 |
433 |
110 |
13.5 |
| Purine |
RF00167 |
133 |
101 |
1.7 |
| FMN |
RF00050 |
144 |
136 |
16.57 |
| TPP |
RF00059 |
115 |
111 |
22.44 |
|
Datasets are obtained from Rfam 12.0 database.
|
In order to evaluate the frequency of the nucleotide type in the riboswitch families, the studied families were analyzed according to their nucleotide distributions and the inter-correlation of the nucleotide frequencies between the 5 riboswitch families and their P values were calculated. Beside the riboswitch families, a set of sequences was used as control group. The number of members of the control set was the average of 5 riboswitch families (equaled to 173). The lengths of nucleotide sequences in the control group were normally distributed with the mean length of 97 (which is the weighted average of 5 families' mean lengths) and the variance of 12.91 (which is the weighted average of variances of 5 families). To reflect on any nucleotide type preference in the riboswitch families, the distribution of nucleotides in the control group was considered according to the average frequency of the nucleotide type in the studied families. In this way, the control set is statistically similar to the studied riboswitch families.
The algorithm implementation
This study aimed to develop a block finder program to search for frequent blocks in riboswitch families. The program flow for the designed algorithm is given in Fig. 1.

Fig. 1. The program flow of the proposed algorithm.
In order to have the developed program able to detect characteristic motifs of a certain riboswitch family, the program should be designed so that it could detect the motives with following three main terms:
The specific motif should be present in very high percentage of the riboswitch family members. This is in accordance with the sequence conservation of riboswitches because a sequence segment is counted as a 'conserved motif' when the segment is present in almost all of the family members.
In a high percentage of family members, the motif should be present in (or around) a specific location.
Additionally, in most of the family members, the distance among blocks should be almost constant.
In this path, the algorithm was implemented in the following steps:
Recognizing potential blocks
In order to detect the nucleotide blocks, first, the riboswitch family sequences were entered the program and preprocessed so that the excess data is omitted and pure sequences of riboswitches are extracted and stored in arrays. Then several nested iterative loops were created to search for blocks starting with the length of 3 nucleotides and continued with longer blocks. Starting with blocks having 3 nucleotides, all possible motives consisting of A, C, G and U were generated and their presences in the family members were investigated. If a high percentage of the family sequences containing a particular motif is detected, then the proposed motif is considered as a potential block. Meanwhile, the locations of the detected potential blocks in every sequence are registered in a matrix.
To search for longer blocks with the length of N nucleotides, there should exist at least one block with the length of N-1 nucleotides. To clarify the idea, let’s assume that at least one block of the length of 3 nucleotides is recorded. Therefore, the search for blocks of the length 4 could be performed. In the same way blocks with higher lengths are determined. Once no block was found with the length of N nucleotides, the search for longer blocks with the length of N+1 nucleotides is stopped.
In order to consider a motif of 3 nucleotides as a potential block, a threshold or a minimum percentage of its presence in the family members should be applied. For instance, when a threshold of 90% is applied, it means that the motif should be present in at least 90% of the family members to be considered as a potential block. In this step of the study, different values of thresholds ranging from 80%-100% were employed.
For detection of longer blocks, by increasing the motif’s length the corresponding threshold should be decreased. This is because longer blocks have a little chance of being wholly conserved in a high number of the family members. Consequently, for any single nucleotide increase in the length of the motif, the threshold was multiplied by a number less than 1. Therefore, multiplications by various values ranging between 0.85 and 0.99 were studied. For example, if the multiplication value is equal to M (e.g. 0.95) with the main threshold of T (e.g. 90%) for a motif of N nucleotide, then for the following motif with the length of N+1 to be considered as a potential block, it should be present in more than T×M (e.g. 90% × 0.95 = 85.5%) of members of the family.
Checking the blocks' locations
Having detected the potential blocks, the locations of the blocks were checked and justified using the histogram of the locations for each block. For a potential block to be considered as a conserved block, a high percentage of its presence (shown as PL) in the family members should be detected in the same location or inside a ±d distance. Therefore, on the peak point of the histogram and in its close neighborhood with ±d nucleotides distance, the frequency of the block's presence is checked. In order to find out the best value for PL, values ranging from 70% to 90% were investigated.
Eliminating the excess blocks
After recognizing all potential blocks in the family along with their locations, small blocks which are fractions of larger blocks and are detected in the same location should be removed. For example with recognition of block 'AAAACUA', smaller blocks such as 'AAA', 'AAC', 'CUA', 'AACU' and 'AAAACU' in the same location must be omitted. To achieve this, the program compared sequences and locations of the potential blocks. If the sequence of any smaller block was found inside the sequence of a longer block and the blocks were located in the same area, the smaller block would be removed.
Results
Nucleotide frequency in riboswitch families
As explained in section 2.1., in order to have a better idea about the riboswitch families' structure, they were analyzed based on their nucleotide distributions. Table 2 shows the average nucleotide frequency of each riboswitch family.
| Table 2. Nucleotide frequencies for 5 riboswitch families |
|
Riboswitch family name
|
Adenine
No. (%)
|
Cytosine
No. (%)
|
Guanine
No. (%)
|
Uracil
No. (%)
|
Adenine + Uracil
No. (%)
|
Cytosine + Guanine
No. (%)
|
| PreQ1 |
38.44 |
22.53 |
18.31 |
20.72 |
59.16 |
40.84 |
| SAM |
28.48 |
22.55 |
28.26 |
20.71 |
49.19 |
50.81 |
| Purine |
32.58 |
18.43 |
19.86 |
29.13 |
61.71 |
38.29 |
| FMN |
25.26 |
22.04 |
31.52 |
21.18 |
46.44 |
53.56 |
| TPP |
24.88 |
22.28 |
30.10 |
22.74 |
47.62 |
52.38 |
Inter-correlation of the nucleotide frequencies between the riboswitch families and their P-values were also calculated. The rows (and columns) of the matrices are related to PreQ1, SAM, Purine, FMN and TPP families, respectively.
Detected conserved blocks for riboswitches
Table 3 demonstrates the results of the developed method for 5 riboswitch families. As can be seen, our algorithm recognized and confirmed 3 blocks for the PreQ1 family including 'GGUUC', 'CCC' and 'AAAAAACUA' blocks detected in locations 9, 22 and 30, respectively. For the SAM family, 6 blocks including 'AUC', 'AGA', 'GAGGGA', 'GCCC', 'GCAACC' and 'GUGC' were recognized which are located in locations 6, 10, 19, 28, 44 and 67, respectively. Also, 2 blocks were detected for the Purine family, including 'UAUA' and 'UCUACC' recognized in locations 24, 53 and 69, respectively. For the FMN riboswitch family, 7 blocks including 'GGGC', 'GGUG', 'UCCC', 'ACCG', 'CGGU', 'CCGAC' and 'GGAUG' were recognized in locations 12, 18, 26, 31, 36, 99 and 110, respectively. Finally, 3 blocks were detected for TPP family including 'GGG', 'CUGAGA' and 'ACCUG' located in locations 12, 30 and 58, respectively.
| Table 3. Results of the proposed method for 5 riboswitch families |
|
Riboswitch family name
|
Blocks
|
Approximate Location on the sequences
|
| PreQ1 |
GGUUC |
9 |
|
CCC |
22 |
|
AAAAAACUA |
30 |
| SAM |
AUC |
6 |
|
AGA |
10 |
|
GAGGGA |
19 |
|
GCCC |
28 |
|
GCAACC |
44 |
|
GUGC |
67 |
| Purine |
UAUA |
24 |
|
UCUACC |
53 |
| FMN |
GGGC |
12 |
|
GGUG |
18 |
|
UCCC |
26 |
|
ACCG |
31 |
|
CGGU |
36 |
|
CCGAC |
99 |
|
GGAUG |
110 |
| TPP |
GGG |
12 |
|
CUGAGA |
30 |
|
ACCUG |
58 |
Analysis of control group sequences
The purpose of development of the control set is to justify the resulted blocks for the riboswitch families by showing that the blocks with the length of 3 or more nucleotides are characteristics of the riboswitch families in this method and also to rule out the efficiency of 2 nucleotide blocks as features for the classification of riboswitch families. As seen in the inter-correlation and P value matrices presented in the previous sections, there is not a significant pattern for the frequency of the inclusion of nucleotides in all of these 5 riboswitch. Therefore, to produce a control set, the nucleotides took part with the average frequency of the nucleotide type in the studied families. Consequently, a set of random sequences was used as the control group to evaluate the performance of the algorithm. The control group results demonstrated that no blocks of the length 3 or more were recognized in the random control set. Numerous blocks of the length 2 were recognized in the random control set as well as all 5 riboswitch families. This shows that blocks of the length 2 are not discriminative for the riboswitch families in this method. Accordingly, motives less than 3 nucleotides length are set aside in this study.
Discussion
The effect of nucleotide frequency in riboswitch families
As seen in Table 2, in PreQ1 family, adenine and guanine are the most and the least frequent nucleotides with 38.44% and 18.31% frequencies, respectively. This is while, despite PreQ1 family, in FMN and TPP families, guanine is the most frequent nucleotide with the frequencies of 31.52% and 30.10%, respectively. In SAM family the 4 nucleotides appear with almost equal frequencies. In purine family cytosine and uracil appear as the least frequent nucleotides with almost 19% frequency, while adenine and uracil are more frequent with the frequencies of 32.58 and 29.13, respectively.
G/C and A/U content analysis showed that in PreQ1 and Purine families, A/U content has a clear advance on G/C content with almost 60 and 40 percents, respectively. On the other hand for SAM, FMN and TPP families, A/U and G/C contents are almost equal and around 50%.
As can be seen, except for FMN and TPP families which are correlated in terms of nucleotide frequencies (with inter-correlation of 0.99 and the P value of 0.01), there is no close correlation between these 5 families.
This analysis revealed that, although every riboswitch family shows family specific nucleotide frequency, however, there is no specific pattern to which all the nucleotide frequencies in riboswitches are bound to. Therefore, there is no nucleotide preference found in all riboswitches' structures.
Adjusting the model parameters
In order to consider a nucleotide motif as a block, the motif should be present in all or some of the family members. To find out the best threshold value for any motif of 3 nucleotides to be considered as a block in a riboswitch family, a series of presence values varying between 80% and 100% were tested. Results showed that the lower values led to less frequent blocks in the family based on the conserved regions identified in Rfam database. On the other hand, the higher threshold values resulted in loosing some blocks in the family. Our results revealed that a threshold (T) of 95% is suitable for this purpose in the detection of blocks with 3 nucleotides and accordingly this primary threshold was chosen in the present study. By increasing the motif’s length, the corresponding threshold should be decreased. Based on our findings, for every single nucleotide increase in the length of the motif, the multiplication of threshold by 0.98 gives the best results.
For a segment to be considered as a conserved block, in addition to its high percentage of presence in the family members, it should exist in the same location or within a ±d distance. The frequency of the block presence was checked on the peak point of the histogram and in its close neighborhood (±d nucleotides distance). The variable "d" is determined according to the variance of the length of members in a riboswitch family (Table 1). For d to be an integer value, the variance of the members' length is rounded into its nearest integer number. Based on this, the value of d for the PreQ1, SAM, Purine, FMN and TPP riboswitch families were considered as 3, 13, 2, 17 and 22, respectively. Results revealed that in this method, among values ranging from 70%-95%, the value of 80% is the best one for PL (the percentage of the presence of any block in the same location or in its ±d neighborhood).
Discrimination of the potential blocks
Having detected the potential blocks, they were studied based on their locations. The histograms of the potential blocks detected in PreQ1, SAM, Purine, FMN and TPP riboswitch families are demonstrated in Figs. 2, 3, 4 , 5 and 6, respectively. In Fig. 2 the histograms of recognized blocks in the PreQ1 riboswitch family are shown. Fig. 2A shows the histogram of block 'GGUUC' recognized in PreQ1 family. As illustrated, this block is located at the ninth nucleotide from start in 39 out of 41 members of the family (more than 95%). Fig. 2B demonstrates the histogram of the block 'CCC' recognized in PreQ1 family. Although in just 61% (25 out of 41) of the members the block is located in location 22, in more than 95% of the members, this block is located in ±d (i.e. ±3) neighborhood of location 22. Fig. 2C shows the histogram related to the block 'AAAAAACUA' also recognized in PreQ1 family. As shown, in 36 out of 41 sequences (more than 87.8%) the recognized block is located in location 30 and its ±d (i.e. ±3) neighborhood. On the other hand, as seen in Fig. 2D related to the block 'UAA' recognized as a potential block in PreQ1 family, there is no specific location or neighborhood in which more than 80% of this motif can be detected in the family members. These results revealed that 'GGUUC', 'CCC' and 'AAAAAACUA' can be considered as conserved blocks for the PreQ1 family because of their high frequency of occurrence and almost similar position in the members' sequences. However 'UAA' cannot be counted as a block for this family.
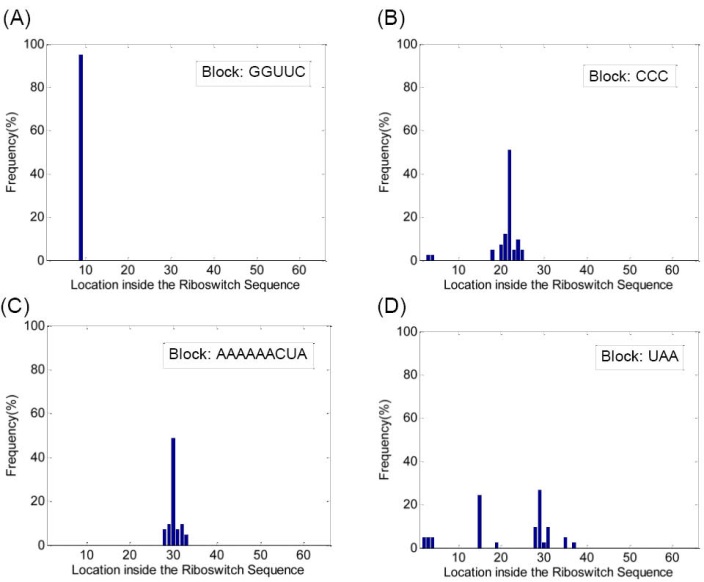
Fig. 2. (A) Histogram of locations for the block 'GGUUC', (B) histogram of locations for the block 'CCC', (C) histogram of locations for the block 'AAAAAACUA' and (D) histogram of locations for the block 'UAA', all detected in PreQ1 riboswitch family. The horizontal axis in each figure shows the location of the block inside the sequence of the riboswitch family members.

Fig. 3. (A) Histogram of locations for the block 'AUC', (B) histogram of locations for the block 'AGA', (c) histogram of locations for the block 'GAGGGA', (D) histogram of locations for the block 'GCCC', (E) histogram of locations for the block 'GCAACC', (F) histogram of locations for the block 'GUGC', (G) histogram of locations for the block 'GAU' and (H) histogram of locations for the block 'GGUG', all detected in SAM riboswitch family. The horizontal axis in each figure shows the location of the block inside the sequence of the riboswitch family members.
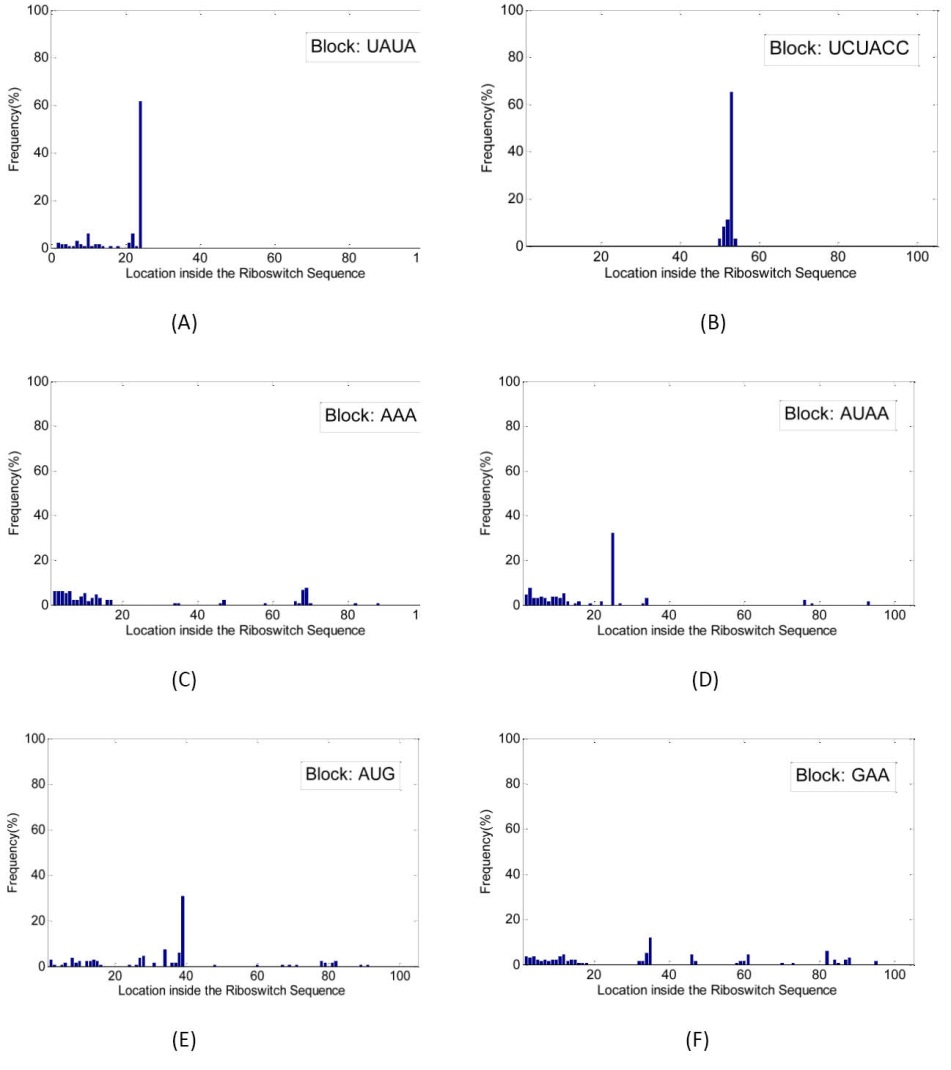
Fig. 4. (A) Histogram of locations for the block 'UAUA', (B) histogram of locations for the block 'UCUACC', (C) histogram of locations for the block 'AAA', (D) histogram of locations for the block 'AUAA', (E) histogram of locations for the block 'AUG' and (F) histogram of locations for the block 'GAA', all detected in Purine riboswitch family. The horizontal axis in each figure shows the location of the block inside the sequence of the riboswitch family members.
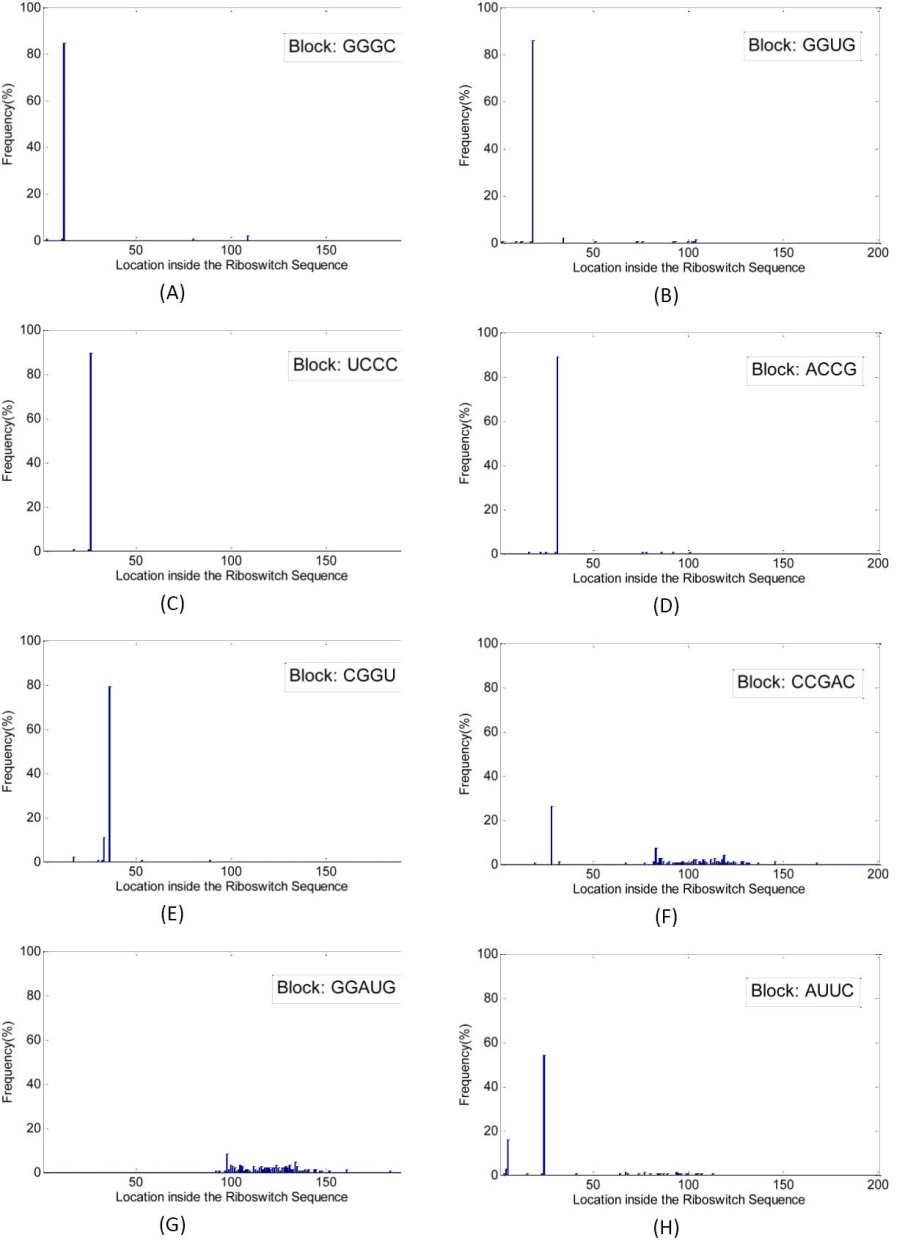
Fig. 5. (A) Histogram of locations for the block 'GGGC', (B) histogram of locations for the block 'GGUG', (C) histogram of locations for the block 'UCCC', (D) histogram of locations for the block 'ACCG', (E) histogram of locations for the block 'CGGU', (F) histogram of locations for the block 'CCGAC', (G) histogram of locations for the block 'GGAUG' and (H) histogram of locations for the block 'AUUC', all detected in FMN riboswitch family. The horizontal axis in each figure shows the location of the block inside the sequence of the riboswitch family members.

Fig. 6. (A) Histogram of locations for the block 'GGG', (B) histogram of locations for the block 'CUGAGA', (C) histogram of locations for the block 'ACCUG' and (D) histogram of locations for the block 'GAA', all detected in TPP riboswitch family. The horizontal axis in each figure shows the location of the block inside the sequence of the riboswitch family members.
Similarly, Fig. 3 shows the histograms of the potential blocks in the SAM riboswitch family. As can be seen in Fig. 3A-F, the related potential blocks, e.g., 'AUC', 'AGA', 'GAGGGA', 'GCCC', 'GCAACC' and 'GUGC' are present in a particular location or its ±13 nucleotides neighborhood in more than 80% of the family members. On the other hand for the potential blocks 'GAU' and 'GGUG' related to Fig. 3G and Fig. 3H, there is no ±13 nucleotides neighborhood in which more than 80% of the presences are detected.
For the potential blocks detected in the Purine family, the histograms are shown in Fig. 4. According to Fig. 4A, in a high percentage of the Purine family members, the block 'UAUA' is present in location 24 ± 2. Also Fig. 4B shows that the block 'UCUACC' is present in location 53 ± 2 in 88% of the family members. However, as seen in Fig. 4 (panels C, D, E and F), the potential blocks 'AAA', 'AUAA', 'AUG' and 'GAA' are not present in certain areas of the members, and as a result, are not counted as the confirmed blocks for the Purine riboswitch family.
Fig. 5 shows the histograms detected in the FMN family. Fig. 5A-E shows the histograms related to blocks 'GGGC', 'GGUG', 'UCCC', 'ACCG' and 'CGGU' which shows the high percentage of the blocks' presence in the family members in and around locations 12, 18, 26, 31 and 36, respectively. Also according to Fig. 5F and Fig. 5G, the blocks 'CCGAC' and 'GGAUG' are present in a ±17 neighborhood of locations 99 and 110, respectively. On the other hand, the block 'AUUC' is not confirmed as a block for the FMN family because according to Fig. 5H there is no ±17 neighborhood in which the presence of this block is concentrated.
Finally, Fig. 6 shows the histograms of the potential blocks detected for TPP riboswitch family. As shown in Fig. 6A, Fig. 6B and Fig. 6C, the blocks 'GGG', 'CUGAGA' and 'ACCUG' are present in and around ±22 nucleotide neighborhood of a certain location in most of the family members and so can be counted as blocks for the TPP family. Although, based on Fig. 6D, the block 'GAA' is not confirmed as a block for this family because its presence in the family members is not concentrated in a close neighborhood.
Model's validation
As can be seen in Fig. 7, comparison of the results of our block finding algorithm to the conserved regions observed in the alignment results from Rfam database, shows that all the recognized blocks fall into the highly conserved regions in the studied riboswitch families (which are shown in red). For instance, 3 blocks were detected in the members of the PreQ1 family. Fig. 7A shows that the detected blocks are located exactly in the highly conserved regions of the PreQ1 riboswitch structure. Accordingly, Fig. 7B-E show the comparison of the detected blocks for SAM, Purine, FMN and TPP riboswitches to the conserved regions of these riboswitch families, respectively.

Fig. 7. Comparison of the blocks detected by our algorithm to the conserved regions of Secondary structures of studied riboswitch families (based on the Rfam database). secondary structured diagrams are related to: (A) PreQ1, (B) SAM, (C) Purine, (D) FMN and (E) TPP riboswitches.
Conclusion
A new algorithm was developed for the detection of frequently appearing sequential blocks in riboswitch families, without the use of grammar-based or alignment methods. Comparison of the developed algorithm results with those of the sequential alignment methods revealed that the developed method can recognize most of the patterns present in conserved areas of individual riboswitch families and determine them as specific blocks. On the other hand, application of the algorithm to the random control set confirmed the accuracy of the algorithm and also the existence and recognition of conserved blocks in each riboswitch family showed the sequential correlation among the family members. As a future work, the identified blocks will be used as features to design a classifier for classification of riboswitches into their associated families.
Competing interests
There is no conflict of interests to be reported.
References
- Knight J. Gene regulation: switched on to RNA. Nature 2003;425:232-3. doi: 10.1038/425232a. [Crossref]
- Cech TR. RNA finds a simpler way. Nature 2004;428:263-4. doi: 10.1038/428263a. [Crossref]
- Moulton V. Tracking down noncoding RNAs. Proc Natl Acad Sci U S A 2005;102:2269-70. doi: 10.1073/pnas.0500129102. [Crossref]
- Bartel DP. MicroRNAs: target recognition and regulatory functions. Cell 2009;136:215-33. doi: 10.1016/j.cell.2009.01.002. [Crossref]
- Isaacs FJ, Dwyer DJ, Ding C, Pervouchine DD, Cantor CR, Collins JJ. Engineered riboregulators enable post-transcriptional control of gene expression. Nat Biotechnol 2004;22:841-7. doi: 10.1038/nbt986. [Crossref]
- Winkler W, Nahvi A, Breaker RR. Thiamine derivatives bind messenger RNAs directly to regulate bacterial gene expression. Nature 2002;419:952-6. doi: 10.1038/nature01145. [Crossref]
- Winkler WC, Nahvi A, Sudarsan N, Barrick JE, Breaker RR. An mRNA structure that controls gene expression by binding S-adenosylmethionine. Nat Struct Mol Biol. 2003;10:701-7. doi: 10.1038/nsb967. [Crossref]
- Winkler WC, Nahvi A, Roth A, Collins JA, Breaker RR. Control of gene expression by a natural metabolite-responsive ribozyme. Nature 2004;428:281-6. doi: 10.1038/nature02362. [Crossref]
- Mandal M, Breaker RR. Gene regulation by riboswitches. Nat Rev Mol Cell Biol 2004;5:451-63. doi: 10.1038/nrm1403. [Crossref]
- Aghdam EM, Barzegar A, Hejazi MS. Evolutionary Origin and Conserved Structural Building Blocks of Riboswitches and Ribosomal RNAs: Riboswitches as Probable Target Sites for Aminoglycosides Interaction. Adv Pharm Bull 2014;4:225. doi: 10.5681/apb.2014.033. [Crossref]
- Aghdam EM, Hejazi ME, Hejazi MS, Barzegar A. Riboswitches as Potential Targets for Aminoglycosides Compared with rRNA Molecules: In Silico Study. J Microb Biochem Technol 2014 S9:002. doi:10.4172/1948-5948. [Crossref]
- Roth A, Winkler WC, Regulski EE, Lee BW, Lim J, Jona I, et al. A riboswitch selective for the queuosine precursor preQ1 contains an unusually small aptamer domain. Nat Rev Mol Cell Biol 2007;14:308-17. doi: 10.1038/nsmb1224. [Crossref]
- Kang M, Peterson R, Feigon J. Structural Insights into riboswitch control of the biosynthesis of queuosine, a modified nucleotide found in the anticodon of tRNA. Mol Cell 2009;33:784-90. doi: 10.1016/j.molcel.2009.02.019. [Crossref]
- Montange RK, Batey RT. Structure of the S-adenosylmethionine riboswitch regulatory mRNA element. Nature 2006;441:1172-5. doi: 10.1038/nature04819. [Crossref]
- Serganov A, Yuan Y-R, Pikovskaya O, Polonskaia A, Malinina L, Phan AT, et al. Structural basis for discriminative regulation of gene expression by adenine-and guanine-sensing mRNAs. Chem Biol 2004;11:1729-41. doi: 10.1016/j.chembiol.2004.11.018. [Crossref]
- Singh P, Sengupta S. Phylogenetic analysis and comparative genomics of purine riboswitch distribution in prokaryotes. Evol Bioinform Online 2012;8:589. doi: 10.4137/EBO.S10048. [Crossref]
- Winkler WC, Cohen-Chalamish S, Breaker RR. An mRNA structure that controls gene expression by binding FMN. Proceedings of the National Academy of Sciences 2002; 99: 15908-13. doi: 10.1073/pnas.212628899. [Crossref]
- Serganov A, Huang L, Patel DJ. Coenzyme recognition and gene regulation by a flavin mononucleotide riboswitch. Nature 2009;458:233-7. doi: 10.1038/nature07642. [Crossref]
- Serganov A, Polonskaia A, Phan AT, Breaker RR, Patel DJ. Structural basis for gene regulation by a thiamine pyrophosphate-sensing riboswitch. Nature 2006;441:1167-71. doi: 10.1038/nature04740. [Crossref]
- Griffiths-Jones S, Moxon S, Marshall M, Khanna A, Eddy SR, Bateman A. Rfam: annotating non-coding RNAs in complete genomes. Nucleic Acids Res 2005;33:D121-D4. doi: 10.1093/nar/gki081. [Crossref]
- Nawrocki EP, Burge SW, Bateman A, Daub J, Eberhardt RY, Eddy SR, et al. Rfam 12.0: updates to the RNA families database. Nucleic Acids Res 2014;43:D130-7. doi: 10.1093/nar/gku1063. [Crossref]