Reduced graphene oxide decorated with gold nanoparticle as signal amplification element on ultra-sensitive electrochemiluminescence determination of caspase-3 activity and apoptosis using peptide based biosensor
Original Research
Reduced graphene oxide decorated with gold nanoparticle as signal amplification element on ultra-sensitive electrochemiluminescence determination of caspase-3 activity and apoptosis using peptide based biosensor
Balal Khalilzadeh1, Nasrin Shadjou2, Hadi Afsharan1, Morteza Eskandani1, Hojjatollah Nozad Charoudeh3,4, Mohammad-Reza Rashidi1,5,*
1
Research Center for Pharmaceutical Nanotechnology (RCPN), Tabriz University of Medical Sciences, Tabriz, Iran
2
Department of Nanochemistry and Nanotechnology Center, Urmia University, Urmia, Iran
3
Stem Cell Research Center, Tabriz University of Medical Sciences, Tabriz, Iran
4
Faculty of Medicine, Tabriz University of Medical Sciences, Tabriz, Iran
5
Faculty of Pharmacy, Tabriz University of Medical Sciences, Tabriz, Iran
Email: rashidi@tbzmed.ac.ir
© 2016 The Author(s). This work is published by BioImpacts as an open access article distributed under the terms of the Creative Commons Attribution License (http://creativecommons.org/licenses/by-nc/4.0). Non-commercial uses of the work are permitted, provided the original work is properly cited.
Abstract
Introduction:
Growing demands for ultrasensitive biosensing have led to the development of numerous signal amplification strategies. In this report, a novel electrochemiluminescence (ECL) method was developed for the detection and determination of caspase-3 activity based on reduced graphene oxide sheets decorated by gold nanoparticles as signal amplification element and horseradish peroxidase enzyme (HRP) as ECL intensity enhancing agent.
Methods:
The ECL intensity of the luminol was improved by using the streptavidin coated magnetic beads and HRP in the presence of hydrogen peroxide. The cleavage behavior of caspase-3 was characterized by cyclic voltammetry (CV) and electrochemical impedance spectroscopy (EIS) techniques using biotinylated peptide (DEVD containing peptide) which was coated on reduced graphene oxide decorated with gold nanoparticle. The surface modification of graphene oxide was successfully confirmed by FTIR, UV-vis and x-ray spectroscopy.
Results: ECL based biosensor showed that the linear dynamic range (LDR) and the lower limit of quantification (LLOQ) were 0.5-100 and 0.5 femtomolar (fM), respectively. Finally, the performance of the engineered peptide based biosensor was validated in the A549 cell line as real samples.
Conclusion: The prepared peptide based biosensor could be considered as an excellent candidate for early detection of apoptosis, cell turnover, and cancer related diseases.
Keywords: Caspase-3, Reduced graphene oxide, Apoptosis, Gold nanoparticle, Electrochemiluminescence, DEVD-peptide
Introduction
Nanotechnology is one of the multidisciplinary research fields that has great impact on the diagnosis, early detection, and drug delivery of cancer. Its convergence with other disciplines in general and with biology and photonics in particular has provided a promising new direction in developing increasingly sophisticated and effective nano-biosensors for monitoring and detection of atoms and molecules at very low concentrations. Nano-biosensors have remarkable ability in the sensitive detection of targeted tumor markers with limited interferences in body fluids and clinical samples. Nowadays, specific targeting of tumor cell markers and monitoring treatment efficacies have been improved by nanotechnology. Advances in nanotechnology, especially graphene based materials have led to the generation of more sensitive and non-invasive biosensors for medical diagnosis.1-6
Graphene based materials are carbon atoms in single sheet with hexagonal lattice and exhibit special features such as high surface area (~2630 m2g-1), ability for functionalization with nanoparticles such as gold nanoparticles (AuNPs) and higher amounts of biomolecules, excellent electrical and thermal conductivities, and an enhanced electron transfer rate.7 Graphene oxide (GO) is one of the graphene derivatives and its surface is full of oxygen and hydroxyl containing reactive groups which make them a suitable platform for assembling other nanoparticles.8 In addition to these advantages, GO is much cheaper than graphene. These excellent properties have made GO the most frequently employed graphene derivate used in nanobiosensor fabrications. However, electrical conductivity of GO is poor. The low electrical conductivity problem of GO can be partially improved by reduction of GO.9 On the other hand, functionalization of reduced GO (RGO) with AuNPs can enhance the loading efficiency of the biomolecules and consequently further increase the electrical conductivity of RGO. Using these two strategies, it is possible to improve electrical conductivity and function of the electrode.10 Moreover, it has been shown that agglomeration of the AuNPs can be prevented by using GO platform.11 Overall, it is expected that using the novel nanomaterials, some features of biosensors, such as response time, stability, sensitivity, and selectivity can be significantly improved.
It is also possible to achieve these attractive features through combination of the use of AuNPs-RGO platform on the biosensor surface by electrochemiluminescence systems. Electrochemiluminescence (ECL) or electrogenerated chemiluminescence is a hyphenated method to convert electrical energy to radiative energy through combination of the electrochemical and luminescent techniques. In ECL methods, reactive intermediates are produced from stable precursors at the surface of the electrode. These electrochemically generated reactive intermediates then undergo electron transfer reactions under a variety of conditions to form excited states that are able to emit light.12 Recently, ECL has been used as a more powerful analytical technique in biological, medicine, clinical analyses and food sciences.13
ECL can be generated through different mechanisms among them co-reactant ECL system is the most common type developed for biosensor fabrication. Various chemiluminescence reactions with different co-reactants can be used in ECL-based biosensors. One of the popular chemiluminescence reactions that has been served as the basis for different biosensors is the reaction between luminol and hydrogen peroxide (H2O2) catalyzed by horseradish peroxidase (HRP).14,15 Luminol (3-aminophthalhydrazide) is a popular chemical that exhibits chemiluminescence, when mixed with an appropriate oxidizing agent such as hydrogen peroxide (H2O2). In an alkaline or neutral medium, luminol is electrochemically oxidized on the electrode surface to form a dianion. Then, the luminol dianion reacts with oxygen produced from H2O2 and undergoes further oxidization to generate the excited state of 3-aminophthalate. The excited state then goes back to its initial ground state and gives the characteristic luminol emission at 425 nm. Unlike luminophores used for chemiluminescence, when the excited luminol goes back to its initial ground state it can be used repeatedly and can generate luminescence.
A lower oxidation potential for ECL makes luminal a favorable ECL system for the performance of biosensor. Altogether, due to these great features, luminol/HRP/H2O2 system has been widely used in designing a variety of biosensors. Taking the advantages of both AuNPs-RGO platform and luminol-based ECL system, in this study, we have developed a novel nanobiosensor for ultra-sensitive detection of caspase-3 activity.
Caspase-3 is a well-known cysteine protease that can catalyze the specific cleavage of many key cellular proteins. Due to its critical role at the start of programmed cell death (apoptosis) in malignant cancerous tumors, caspase-3 is considered as a well-established cellular marker of apoptosis. It is also associated with non-apoptotic functions such as differentiation, proliferation and immunity of human cells.16,17 Consequently, determination of caspase-3 activity in the evaluation of the biological function and disease progression is of great value.
Various analytical methods have been used for quantification of caspase-3 activity, such as electrochemical,18,19 optical,20,21 FACS flow cytometry22,23 and imaging.24,25 However, these methods may suffer from some disadvantages such as expensive apparatus, time-consuming, complicated pre-concentration process, multi-solvent extraction, and a need for trained technicians. It is possible to overcome to some of these limitations by appropriate combination of some methods and outweigh the drawbacks of each individual method.
In continuing our previous studies,18,26 in this report, using three strategies of loading more Aspartic acid-Glutamic acid-Valine-Aspartic acid (DEVD) modified peptide as caspase-3 substrate on the electrode surface through AuNPs-Th-GO platform, involvement of more HRP molecules in the reaction through the use of streptavidin coated magnetic beads, and finally the use of luminol/HRP/H2O2 ECL system, we could quantify caspase-3 activity with the lower limit of quantification (LLOQ) of 0.5 fM. As a protease, caspase-3 is able to cleavage DEVD, and this peptide sequence has been used by many scientists for quantification of caspase-3 activity.27 The designed ECL based biosensor is free from toxic heavy metals, and also has some special analytical features such as ultra-sensitivity, high selectivity, easy fabrication, low cost and fast response time.
Materials and methods
Apparatus
The electrochemical measurements were done on Autolab PGSTAT302N (Metrohm Autolab, Utrecht, The Netherlands) using NOVA software (version 1.8, Metrohm Autolab, Utrecht, The Netherlands). The ECL experiments were performed on the developed hyphenated system using Hamamatsu photomultiplier, R12829 (Hamamatsu, Iwata, Japan). The electrode surface images were taken by field emission scanning electron microscope (FE-SEM, MIRA-3, Tescan, Brno-Kohoutovice, Czech Republic). The X-ray diffraction (XRD) studies was performed on Siemens D 5000 (Aubrey, TX, USA) and 2Ɵ scanned between 2° to 70° (Cu Kα was used as X-ray generator with λ=0.15406 nm). FT-IR spectroscopy analysis was carried out on Shimadzu FT-IR spectrophotometer (8101M, Shimadzu, Kyoto, Japan).
Materials
GO, 3-mercaptopropyl trimethoxysilane (MPTMS), sodium borohydride, trisodium citrate, tetrachloroaurate, hydrogen peroxide (30%), 6-mercapto-1-hexanol (MCH), and luminol were purchased from Sigma-Aldrich (Sigma-Aldrich, Saint Louis, USA). The biotinylated peptide or BP (Biotin-G-D-G-D-E-V-D-G-C) was designed and obtained from Peptron Company (Peptron, Daejeon, South Korea, 98.57%, MW is 1092 g). Biotinylated HRP and streptavidin coated magnetic beads (Dynabeads® MyOne Streptavidin T1) were purchased from Invitrogen (Invitrogen, CA, USA). Phosphate buffered saline was prepared by dissolving the potassium dihydrogen phosphate, disodium hydrogen phosphate, potassium chloride, and sodium chloride; its pH was adjusted using concentrate hydrochloric acid and sodium hydroxide solutions.
Functionalization of GO
GO was functionalized using post modification method. In brief, 100 mg of GO was dispersed in 30 mL toluene and sonicated for 20 min (till reaching a completely homogenized GO flaks). Then, 2 mL of MPTMS was added to the homogenized GO sheets and the reaction mixture was refluxed at 110°C for about 12 h. At the end of this time, the product was centrifuged, washed with ethanol and dried in vacuum at room temperature. AuNPs were synthesized with modified Turkevich method.28 The overall size of them was about 30 nm. Decoration of thiol-functionalized GO (Th-GO) with AuNPs was performed in ethanol at reflux condition (6 h, 80°C). Final product was washed, centrifuged and dried. The GO and modification steps (Th-GO and AuNPs-Th-GO) were characterized by FTIR and XRD techniques.
Cell culture
For better evaluation and validation of the proposed biosensor, the third passage of A549 epithelial cell line obtained from Pasteur institute (Tehran, Iran) was used as real sample. The cells were cultured in RPMI supplemented with fetal bovine serum (10%) and penicillin/streptomycin (complete media) in the humidified incubator (95% air/5% CO2) at 37°C. The seeding density of the cells were 1×10⁶cells per well.
Apoptosis induction process
When the cells confluency reached around 50-60%, the induction of apoptosis was done by treating of the cells with different concentrations of doxorubicin which was diluted in complete media. After 48 h, the total proteins of the cells were extracted and used for biosensor analysis for detection of caspase-3 activity. The protein extraction process has been explained as described elsewhere.18
Biosensor preparation steps
Physical and electrochemical cleaning of the electrode
First, the physically cleaning of glassy carbon electrode (GCE) was done in three steps: polishing with alumina powder on polishing pad, sonication in ethanol and then in distillated water, and finally drying with nitrogen stream. Then, the electrochemical cleaning of GCE was performed at two steps: negative sweep by cycling in basic condition followed by positive sweep by cycling in acidic condition till reaching a repetitive cycles and lastly dried with an inert gas.
Modification steps
The gold nanoparticle decorated thiol-functionalized graphene oxide (AuNPs-Th-GO) was electrodeposited on the pre-cleaned GCE. Briefly, 30 mg of AuNPs-Th-GO was dispersed in 10 mL of 0.1 M lithium perchlorate ethanolic solution, followed by sonication for 15 min, the homogenized suspension was transferred to electrochemical cell. The CV technique was used for electrodeposition of AuNPs-Th-GO on the pre-cleaned GCE. Thirty cycles (-1.5 V to 0.6 V, scan rate 25 mV/s) were applied to the electrode surface. Therefore, AuNPs-Th-RGO was deposited on the GCE with reduction process. The AuNPs-Th-RGO modified glassy carbon electrode (AuNPs-Th-RGO-GCE) was used for post modification. Further modifications (biotinylated peptide (BP), MCH, streptavidin-coated magnetic beads (MB) and biotinylated HRP) on the AuNPs-Th-RGO-GCE were carried out and followed as described before.18 The final prepared electrode was HRP-MB-MCH-BP-AuNPs-Th-RGO-GCE and used as ECL based biosensor for quantification of caspase-3 activity. The electrode preparation steps and self-assembly of BP, MCH, MB, and HRP on the AuNPs-Th-RGO-GCE were investigated by CV and EIS techniques. Based on the results obtained from CV and EIS, the Nyquist plot with the smallest radius of semicircle in the lowest frequency region is related to the bare GC electrode which has the highest electron transfer or the minimum resistance (Figs. 1A and B). After modification with AuNPs-Th-RGO-GCE, at the same frequency region, the radius of semicircle slightly increased, which may be due to the presence of hydrocarbons resulting from the thiolation process and also due to a defect in complete reduction of AuNPs-Th-GO with electrochemical reduction process. After self-assembly of BP on the AuNPs-Th-RGO-GCE via nano-conjugation of N-terminal of the designed peptide with AuNPs, the radius of semicircle partially increased. This phenomenon can be attributed to the existence of insulator groups (amino acids) in the peptide structure. For the elimination of unreacted AuNPs, they were blocked by MCH, consequently, the radius of semicircle was slightly enhanced because of insulation effect of MCH. At the final step, the modification was done with the optimum ratio of MB and HRP molecules. As a result, due to the magnetic effect of MBs and HRP molecules, the radius of semicircle decreased and the conductivity was amplified. When the final modified electrode was exposed to caspase-3 active form at 37°C in the incubator for 1 h, or after cleavage step, the radius of its semicircle was enhanced more than other modification steps. The results of EIS study were individually confirmed by CV.
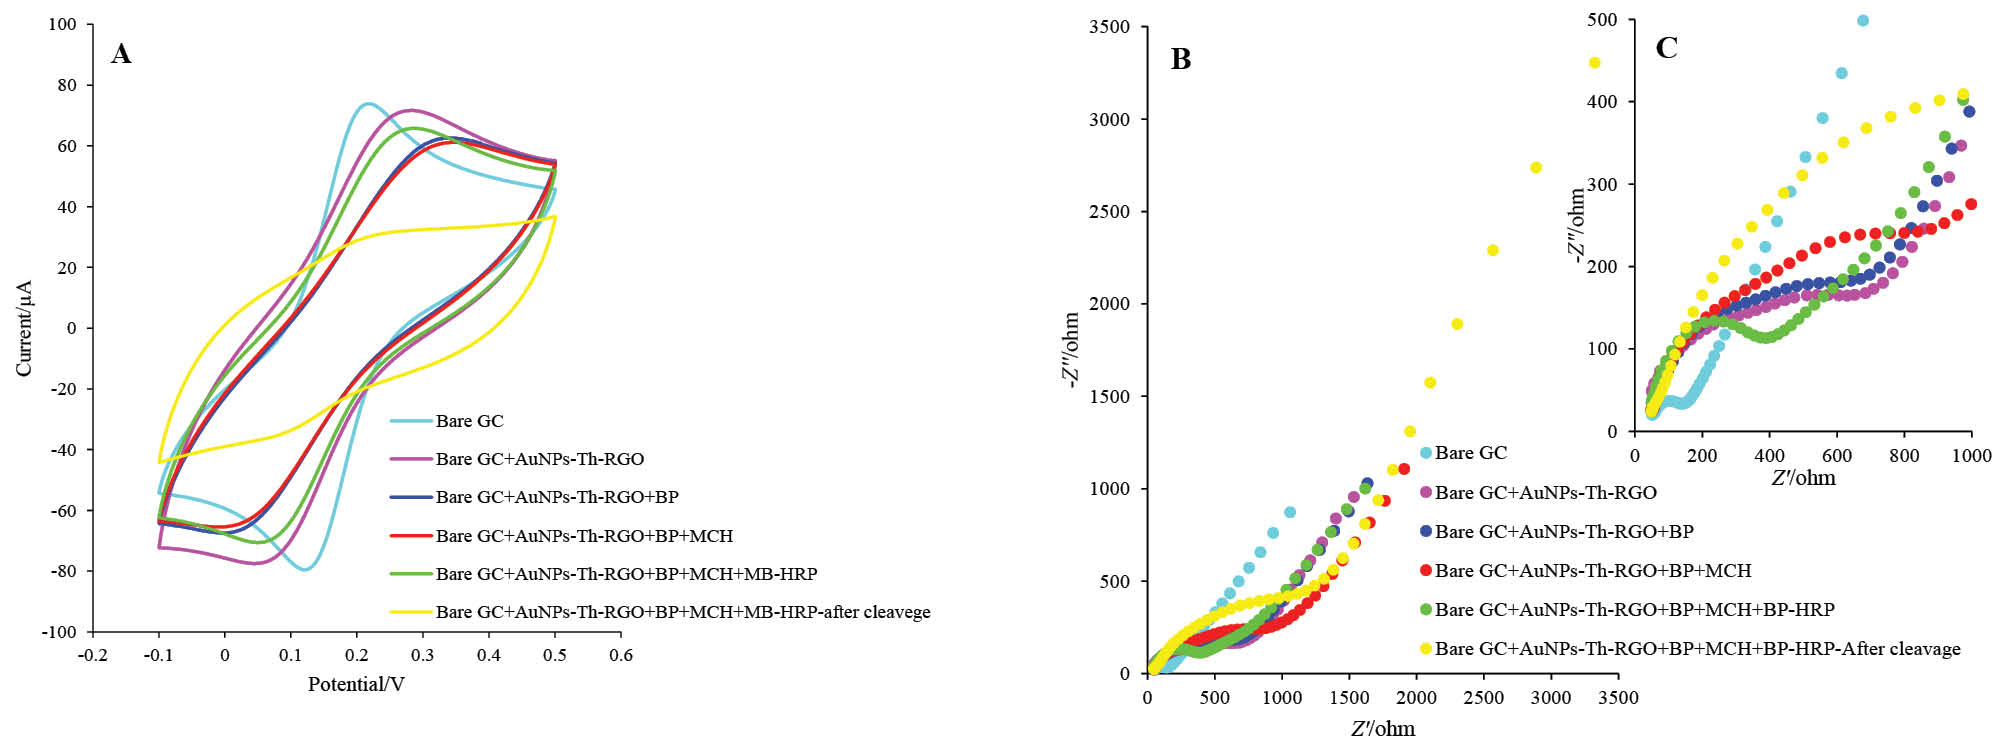
Fig. 1. (A) Cyclic voltammograms, (B) Nyquist curves, and (C) The enlarged part of EIS in presence of 5 mM K4[Fe(CN)6] and K3[Fe(CN)6] and 0.5 M KCl at Bare GC, Bare GC+AuNPs-Th-RGO, Bare GC+AuNPs-Th-RGO+BP, Bare GC+AuNPs-Th-RGO+BP+MCH, Bare GC+AuNPs-Th-RGO+BP+MCH+MB-HRP, and after cleavage with active caspae-3 protein Bare GC+AuNPs-Th-RGO+BP+MCH+MBHRP.
Results
Structural characterization of GO, Th-GO, and AuNPs-Th-GO
Fourier-transform infrared (FT-IR) of GO, Th-GO and AuNPs-Th-GO
FT-IR spectra of GO, Th-GO and AuNPs-Th-GO have been illustrated in Fig. 2A. Characteristic stretching vibrations peaks of pure GO for C=O, O–H and C-OH (carboxylic group) appeared at 1731, 3525 and 1465 cm-1, respectively. Also, stretching vibrations peaks of C-O (epoxy group) were observed at 1346 cm-1.29,30 Thiolation of GO was performed using silane coupling agent (MPTMS). A weak stretching vibration peak appeared at 2696 cm-1 and assigned to –SH group which confirms the thiolation step of GO (Fig. 2B). Decoration of Th-GO with AuNPs was confirmed by decrease in the intensity or removing the –SH peak at about 2700 cm-1. The FT-IR results were confirmed by XRD.
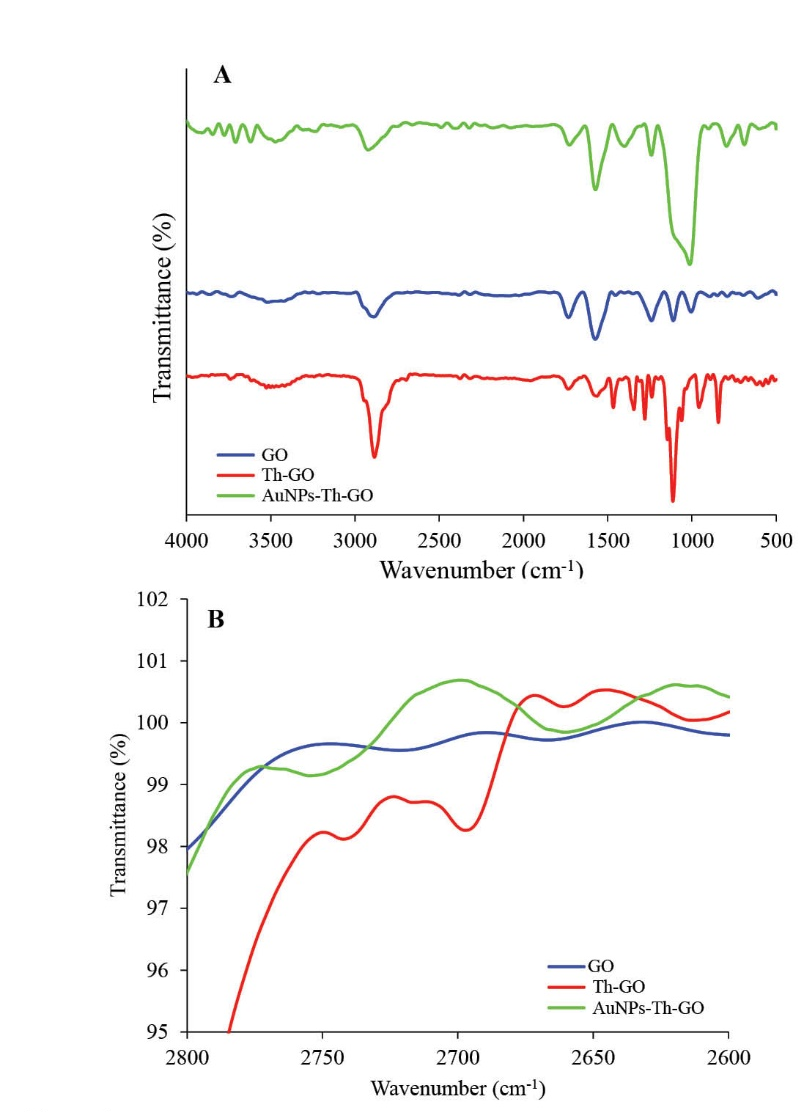
Fig. 2. FTIR of graphene oxide (GO), thiol-functionalized GO (Th-GO), and AuNPs-Th-GO; B) Comparison of GO, Th-GO and AuNPs-Th-GO around 2700 cm-1.
X-Ray diffraction (XRD) of GO, Th-GO and AuNPs-Th-GO
The powder XRD patterns of pure GO, Th-GO and AuNPs-Th-GO have been shown in Fig. 3. A small peak at 2Ɵ = 15.28° and a sharp peak at 2Ɵ = 23.56° were observed which are related to the specific peaks of GO.31 After modification with SH groups, the crystallinity of the GO decreased and the above mentioned peaks decreased and merged together and made a broad peak at 2Ɵ = 18.64°; these results confirm that the thiol modification step has been performed completely. Finally, after decoration of Th-GO with AuNPs, the characteristic peaks of AuNPs-Th-GO appeared at 2Ɵ = 38.56°, 66.6° and 77.44°. The XRD results were further confirmed by SEM and EDX.32
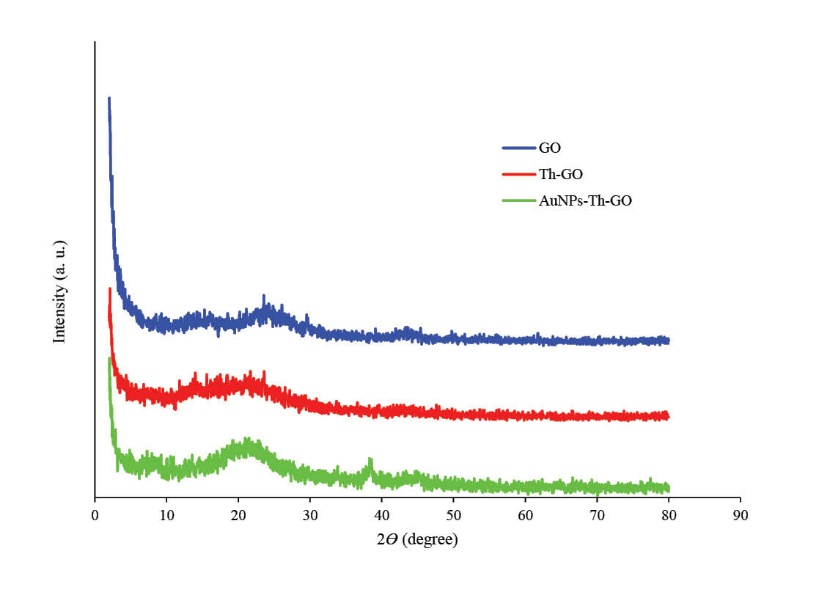
Fig. 3. The X-ray diffraction patterns of GO, Th-GO and AuNPs-Th-GO (2<2Ɵ<80).
Ultraviolet-visible spectrophotometry (UV-vis) of AuNPs and AuNPs-Th-GO
Fig. 4 shows the UV-vis absorption spectra of AuNPs and Th-GO decorated with AuNPs. The peak at the 527.5 nm can be attributed to the presence of AuNPs. The peaks at about 230 and 300 nm belong to GO,33 the first peak is related to π to π* transition of the aromatic carbons and the second peak arises from the n to π* transition of the carbonyl group. To monitor the decoration efficiency of Th-GO, the UV-vis spectra of AuNPs-Th-GO was studied. Further confirmation of the attachment of AuNPs on the Th-GO was achieved by spectroscopic study of the addition of free AuNPs to the suspension of AuNPs-Th-GO. Based on the illustrated absorption spectra of AuNPs-Th-GO, there is no free AuNPs, therefore, almost all of the AuNPs were attached to the Th-GO.34 In addition, comparison between the low and high concentrations of AuNPs-Th-GO indicates that a more clear shoulder peak appears at about 300 nm at the higher concentration of the nanoparticles.
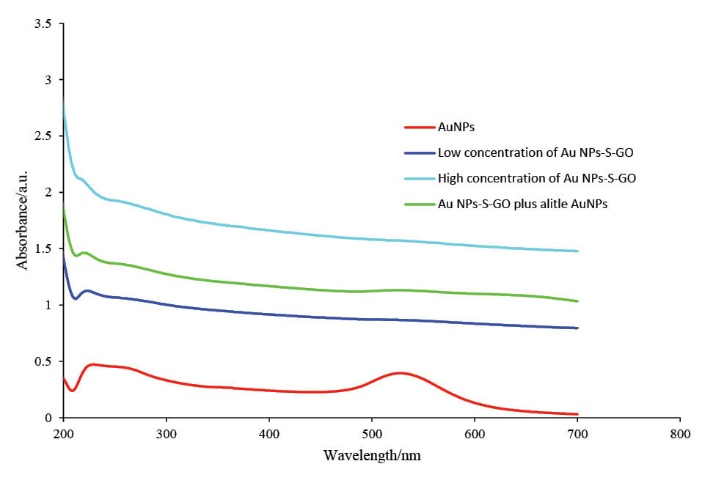
Fig. 4. The UV-vis spectra of AuNPs, low concentration of AuNPs-Th-GO, high concentration of AuNPs-Th-GO, and low concentration of AuNPs-Th-GO plus a little AuNPs (200 to 700nm).
Scanning electron microscopy (SEM) and energy dispersive X-ray spectroscopy (EDX)
After electrochemical deposition of AuNPs-Th-GO on the GCE, the AuNPs-Th-RGO-GCE was employed for taking SEM images for monitoring the distribution of AuNPs and morphology of the engineered electrode surface. The SEM images of the engineered electrode surface have been shown in Fig. 5A at different magnitudes. The white dots are related to the AuNPs attached on the AuNPs-Th-RGO-GCE; meanwhile the figure shows that some of AuNPs have been aggregated. The overall size of AuNPs was found to be about 30 nm. The AuNPs were well dispersed on the electrode surface. In addition, the chemical composition of the AuNPs-Th-RGO-GCE was measured by point energy dispersive x-ray spectroscopy (EDX). The EDX result has been presented in Fig. 5B. The EDX graph shows that the nanocomposite consists of only Au and C elements. It also confirms the attachment of AuNPs on the GO. The weight percent of Au and carbon (C) were 78.44% and 21.56%, respectively in point EDX measurements.
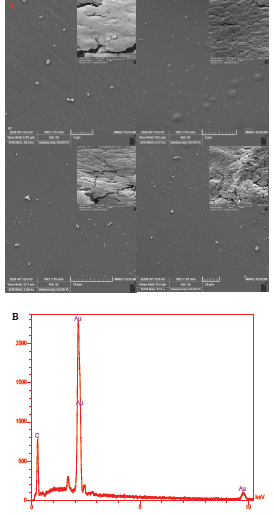
Fig. 5. A) The SEM images of electrodeposited AuNPs-Th-RGOGCE in different magnitudes (1, 5, 10 and 20 μm); B) The EDX graph of AuNPs-Th-RGO-GCE nanocomposite.
Optimization of operation parameters
The electrodeposition condition
Electrodeposition has an important role on the morphology, distribution and thickness of AuNPs-Th-GO nanocomposite on the GCE. In the present study, the electrodeposition was controlled by the number of repetitive cycles applied by CV. The electrochemical activity of the electrodeposited nanocomposite was examined in the range of 10-50 cycles with the same scan rates. CV and EIS techniques were used for optimization of the electrodeposition process. The CV and EIS results have been illustrated in Figs. 6A and B, respectively. Based on these results, 30 repetitive cycles was selected as optimum number of cycles. To improve the electrical conductivity of the GO, AuNPs were used in this study. For further enhancement of the electrical conductivity, RGO which was produced from GO via electrochemical reduction of GO on the electrode surface was used. In the proposed nanocomposite, AuNPs were used as electrical conductivity enhancing agent and also as nano-conjugating agent between N-terminals of BP and themselves.
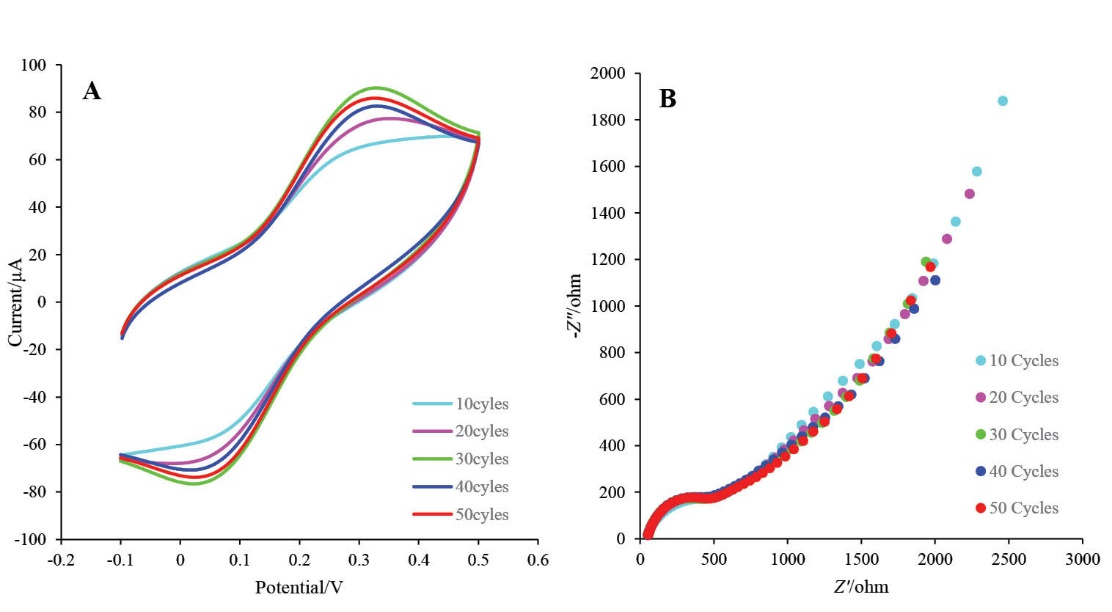
Fig. 6. A) The CV voltammograms of GCE at different numbers of cycles (10, 20, 30, 40, and 50) in ethanolic solution of AuNPs-Th-GO with lithium perchlorate as a supporting electrolyte at the scan rate of 25 mV/s; B) Niquist plots of corresponded CV at different numbers of cycles in 5 mMK4[Fe(CN)6] and K3[Fe(CN)6] and 0.5 M KCl.
The pH effect
The components of the designed ECL based biosensor such as HRP and luminol are pH sensitive compounds.35 Therefore, the effect of pH of the supporting electrolyte (PBS) on the ECL intensity of the engineered biosensor was investigated in the pH range of 7.4 to 11. As demonstrated in Fig. 7, the maximum ECL intensity of the modified electrode was obtained at pH 9.5 which is consistent with the behavior of luminal in alkaline solutions reported by others.36,37 Therefore, this pH was selected as an optimum pH for the next optimization steps.
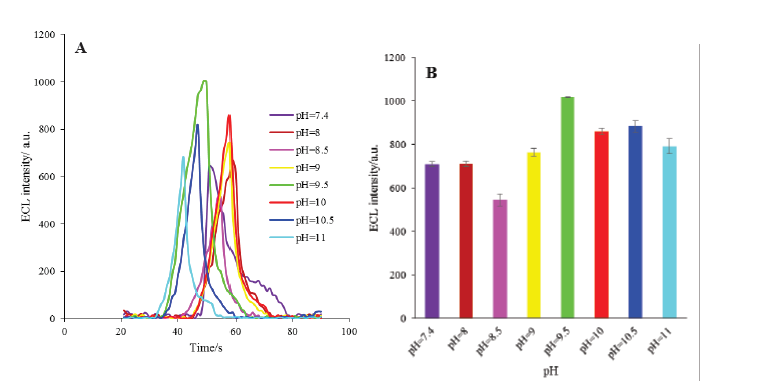
Fig. 7. A) The ECL spectra of HRP-MB-MCH-BP-AuNPs-Th-RGO-GCE electrode in different pH of buffer solution (7.4, 8, 8.5, 9, 9.5, 10, 10.5 and 11); B) Variations of ECL intensity versus different pH.
Luminol concentrations
The ECL intensity of luminol-based ECL biosensors is highly dependent on the luminol concentrations in the ECL cell. Therefore, the effect of luminol concentration was investigated in the presence of 2 mM H2O2. The ECL intensity was raised as the concentration of luminol increased from 0 mM to 0.5 mM, then, the intensity reached a plateau (Figs. 8A and B). Thus, the 0.5 mM was selected as the optimum luminol concentration.
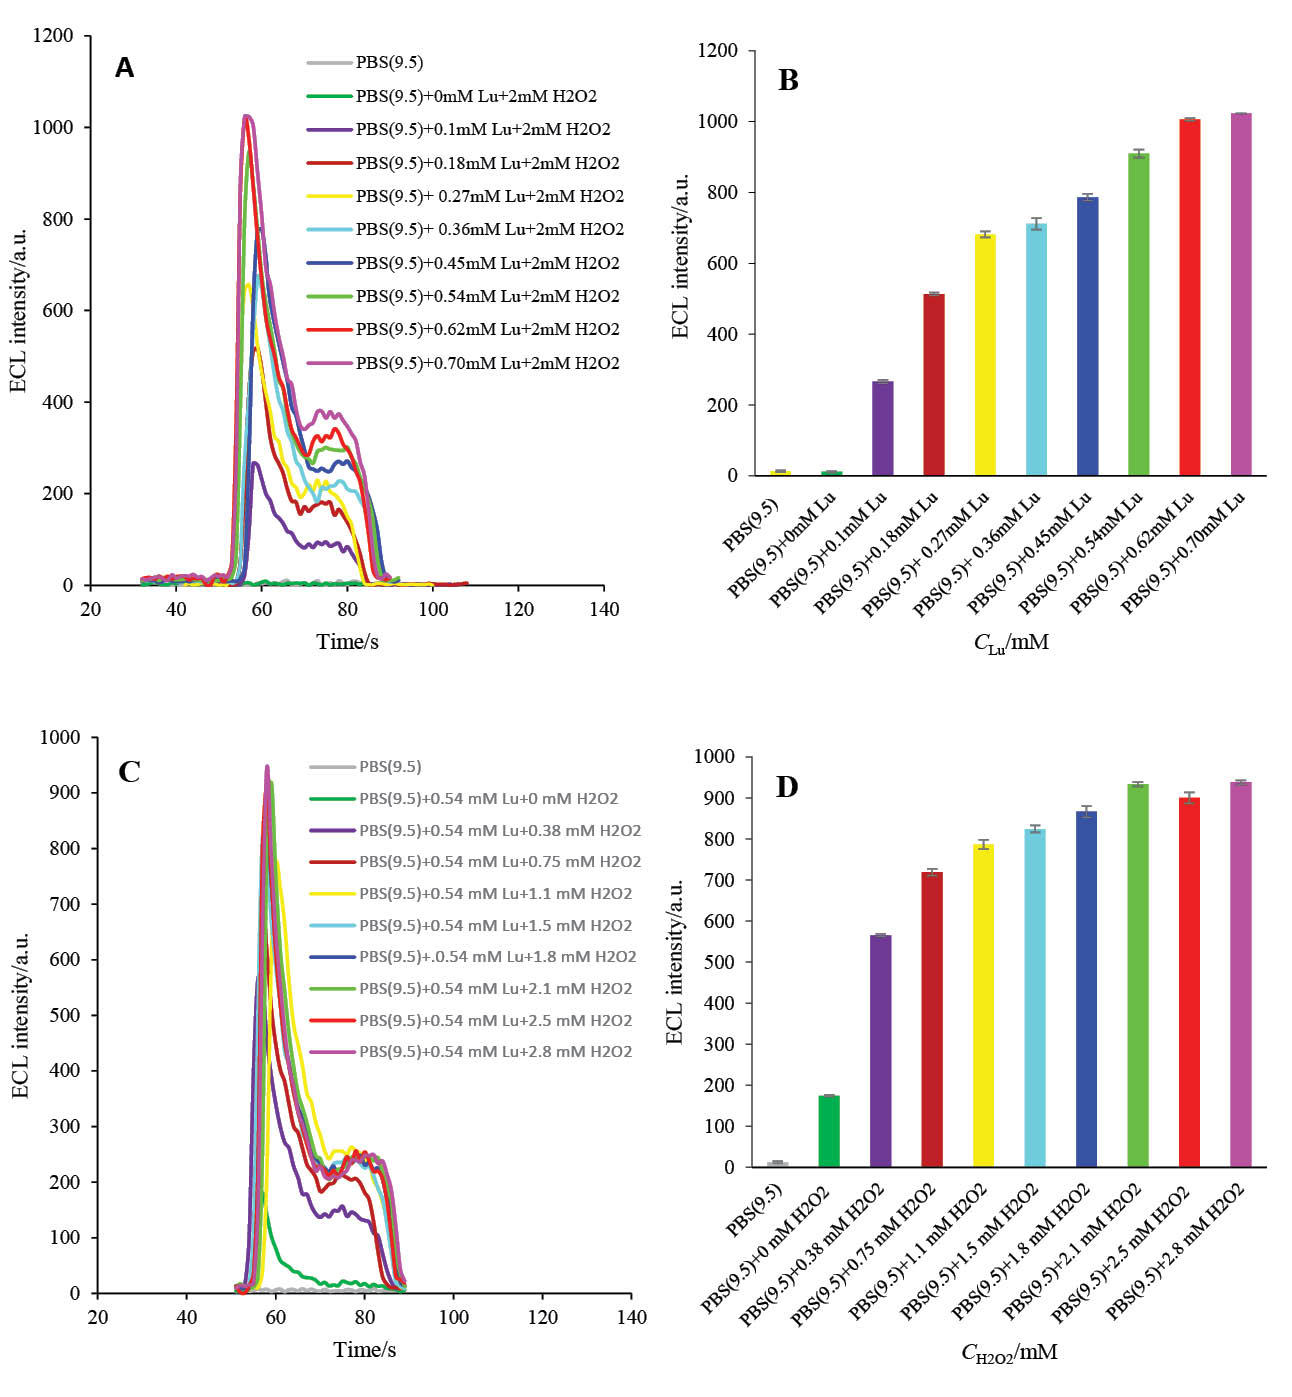
Fig. 8. A) The ECL spectra of HRP-MB-MCH-BP-AuNPs-Th-RGO-GCE in different concentrations of luminol in the presence of 2 mM H2O2; B) Variations of ECL intensity versus luminol concentrations; C) The ECL spectra of HRP-MB-MCH-BP-AuNPs-Th-RGO-GCE in different concentrations of H2O2 in the presence of 0.54 mM luminol; D) Variations of ECL intensity versus H2O2 concentrations.
Hydrogen peroxide concentrations
As illustrated in Figs. 8C and D, and also reported by others,38 hydrogen peroxide has an important role in the activation of HRP enzyme, and accordingly, on the electrooxidation of luminol and finally on the ECL efficacy of engineered biosensor. The concentration of H2O2 effect on the ECL efficacy was, therefore, studied in the presence of 0.5 mM luminol. It can be seen in Figs. 8C and D that the ECL intensity of the designed biosensor increases with increasing H2O2 concentration until reaching its maximum value at 2.1 mM and then it almost levels off. Therefore, 2 mM was chosen as the optimum H2O2 concentration for the next optimization steps.
ECL characterization of the engineered biosensor
The ECL characterization of developed biosensor was investigated in the absence and presence of applied electrochemical potential with CV. Moreover, it was examined before and after cleaving with active caspase-3 protein. As demonstrated in Fig. 9A, no ECL activity was detected in the absence of applied electrochemical potential; but, immediately after applying electrochemical potential, the ECL activity of luminol was increased. These experiments were also carried out in the presence and absence of H2O2 molecule. In the presence of H2O2, the ECL intensity of luminol was enhanced; this enhancement is due to the electrocatalytic activity of the HRP molecule. The electrode construction and electrochemical activity of the assembled HRP molecule on the engineered biosensor was evaluated by comparison of the enhancement in the ECL intensity in the presence and absence of the applied electrochemical potential and H2O2.
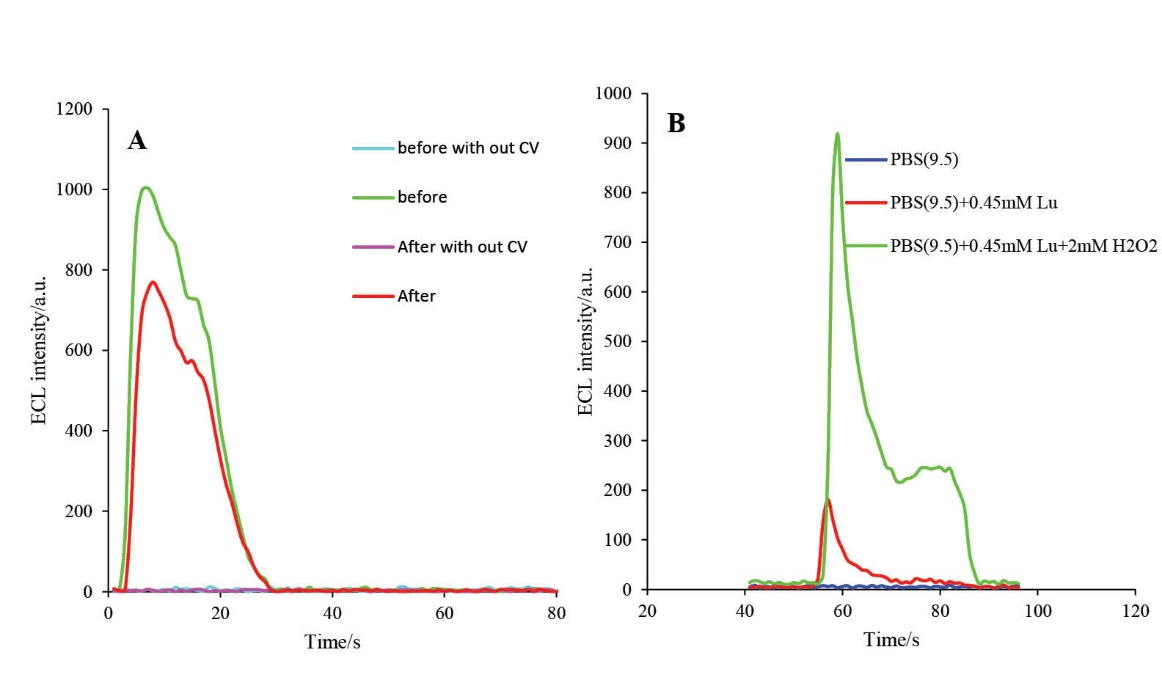
Fig. 9. A) The ECL spectra of HRP-MB-MCH-BP-AuNPs-Th-RGO-GCE in presence of 0.5 mM luminol + 2 mM H2O2 in the absence and presence of applying CV and cleavage with active caspase-3 protein; B) The CEL spectra of HRP-MB-MCH-BP-AuNPs-Th-RGO-GCE in PBS (pH=9.5), PBS (pH=9.5)+0.45 mM luminol, and PBS (pH=9.5)+0.45 mM luminol+2 mM H2O2.
Incubation time
The effect of the incubation time of the engineered biosensor on the ECL intensity was studied at 37ºC in the presence of active caspase-3 extracted from A549 cells. The ECL performance of the HRP-MB-MCH-BP-AuNPs-Th-RGO-GCE was studied at different incubation times (Figs. 10A and B). It can be seen that the ECL intensity of the engineered biosensor decreases with an increase in the incubation time and after 60 min, it levels off. Accordingly, 60 min was selected as the optimum incubation time for other optimization steps.
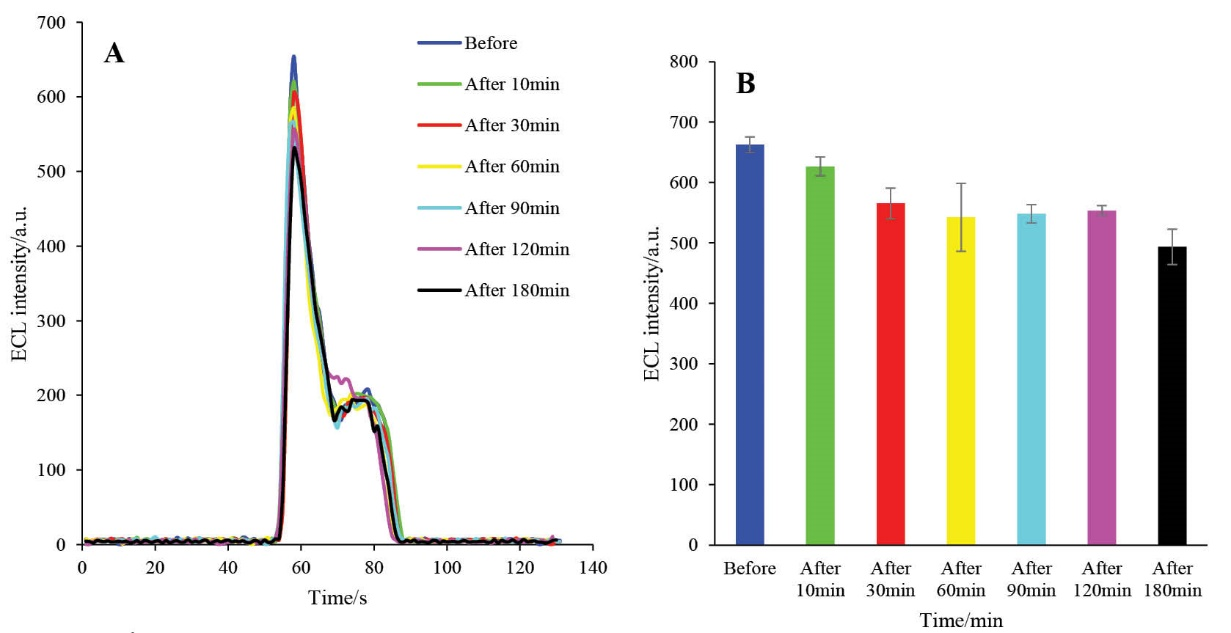
Fig. 10. A) The ECL spectra of HRP-MB-MCH-BP-AuNPs-Th-RGO-GCE in the presence of 0.35 mM luminol and 1.3 mM H2O2 in different incubation times (before 10, 30, 60, 90, 120, and 180 s); B) Variations of ECL intensity versus incubation time (s).
Electrochemical behavior
Electrochemical characterization of the prepared biosensor was investigated by CV and kinetic study was done on the optimized conditions.
Scan rate effect
The scan rate effect on the electrochemical behavior of the HRP-MB-MCH-BP-AuNPs-Th-RGO-GCE was studied in the presence of 1 mM luminol and 4 mM H2O2. The scan rate was swept up between 2 to 50 mV s-1 (their voltammograms are illustrated in Fig. 11A). As shown in the Fig. 11A, the irreversible oxidation peak of the luminol was appeared at about 0.26 V and the peak current was relatively raised with scan rate.
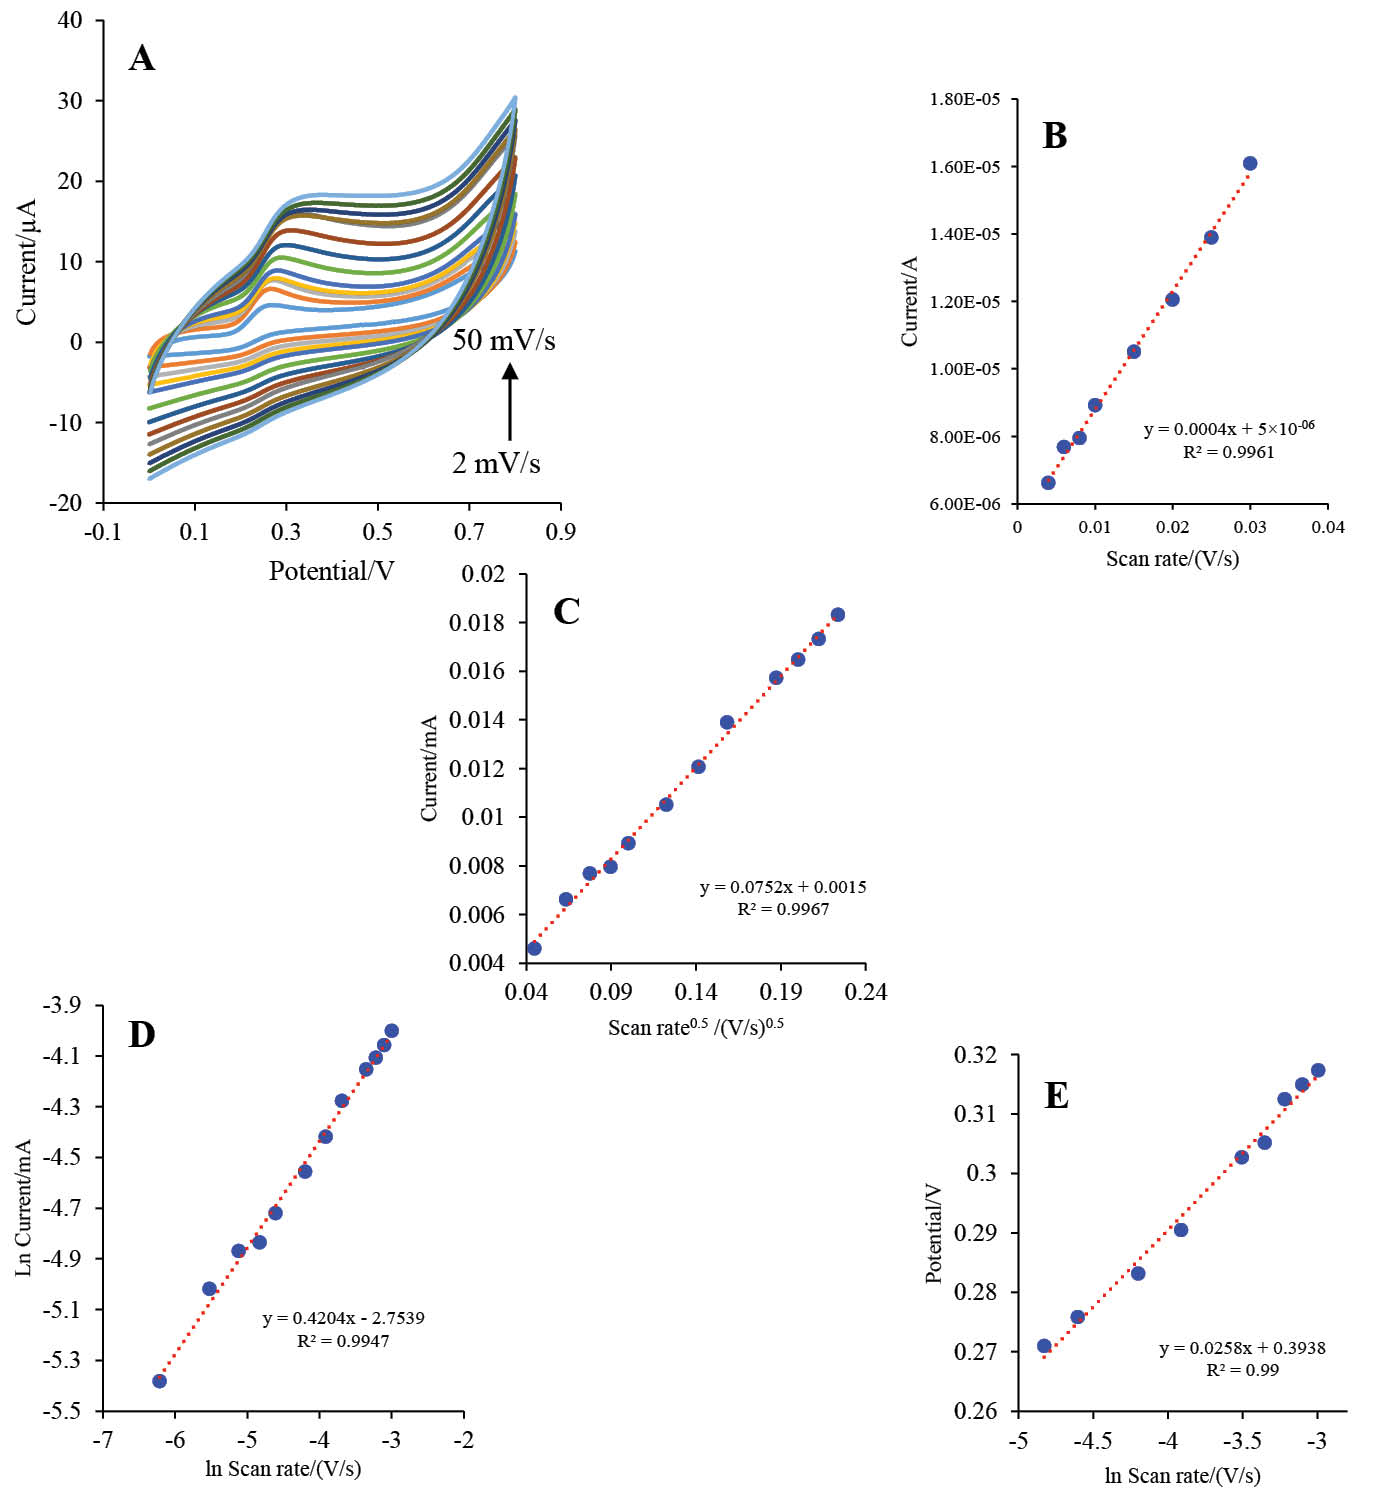
Fig. 11. A) The CVs of HRP-MB-MCH-BP-AuNPs-Th-RGO-GCE in the presence of 1 mM luminol and 4 mM H2O2 at different scan rates (2, 4, 6, 8, 10, 15, 20, 25, 30, 35, 40, 45, and 50 mV s-1); B) Variations of oxidation peak currents (A) versus scan rate (V s-1); C) Variations of oxidation peak currents (mA) versus square root of scan rate (V s-1)0.5; D) Variations of the natural logarithm of oxidation peak currents (mA) versus the natural logarithm of scan rate (V s-1); E) The plot of variations of peak potential (V) versus the natural logarithm of scan rate (V s-1).
Special surface coverage
The special surface coverage (Г*) of the HRP-MB-MCH-BP-AuNPs-Th-RGO-GCE was calculated using the study of the effect of scan rate (V s-1) on the oxidation peak of the luminol and the electrode response. As presented in Fig. 11B, there is a linear relation between the oxidation peak of the luminol (A) and scan rate (V s-1) at low scan rates indicating the electrocatalytic feature of the engineered system.39 The slope of the diagram and the value of Г* were calculated as 0.0004 and 1.35×10⁻⁸mol cm-2, respectively, using Eq. 140:
\[Ip = \left( {\frac{{{n^2}{F^2}}}{{4RT}}} \right)\nu A\Gamma *\] (Eq. 1)
where, Ip, n, F, R, T, υ, A and Г* are the oxidation peak current of luminol, total transferred electron, Faraday’s constant (96486, A.s.mol-1), gas constant (8.314, JK-1mol-1), temperature (298 K), potential sweep rate (V s-1), total electrode surface (cm2), and special surface (mol cm-2) covered with HRP-MB-BP-MCH-AuNPs-Th-RGO-GCE, respectively.
As expected, the surface area of the GO was higher (approximately 2 fold) than other materials (including MCM-41) and it was, therefore, used as the electrode base.
The mass transfer mechanism
The mass transfer mechanism was investigated through drawing the oxidation peak current (mA) versus square root of scan rate $(\sqrt {\left( {\frac{v}{s}} \right)} )$ (the graph presented as Fig. 11C). According to this figure, the intercept of the plot was obtained as 0.0015, which is very low (almost zero). Therefore, it could be concluded that the mass transfer is controlled by diffusion which makes the fabricated biosensor appropriate for quantitative analysis.41 Furthermore, the mass transfer mechanism was studied by another method as follows: the natural logarithm of peak current (mA) was plotted versus the natural logarithm of scan rate (V s-1). If the slope of this plot is close to 0.5, the mass transfer is controlled by diffusion; if the slope of the plot is close to 1, the mass transfer is controlled by adsorption.40 This plot is shown in Fig. 11D. Based on this plot, the slope was calculated 0.4204, which gives further evidence for controlling the mass transfer by diffusion.
Electron transfer coefficient
Electron transfer coefficient (α) is another kinetic parameter which is used for judgment about the mechanism of the mass transfer process. This kinetic parameter can be calculated by Eq. 240:
\[Ep = \left( {\frac{{RT}}{{2\alpha F}}} \right)\ln \nu + cons\tan t\] (Eq. 2)
where Ep, R, T, F, and υ are the peak potential (V), gas constant (8.314, J K-1mol-1), temperature (298 K), Faraday’s constant (96486, A.s.mol-1), and potential sweep rate (V s-1), respectively. The plot of the peak potential (V) versus natural logarithm of the scan rate (V s-1) has been illustrated in Fig. 11E with a slope of 0.0258. The electron transfer coefficient was calculated as 0.497. As this value is very close to 0.5, electron transfer coefficient calculation also supports the control of the mass transfer mechanism by diffusion.
Analytical approach
The HRP-MB-MCH-BP-AuNPs-Th-RGO-GCE was used for setting calibration curve. For this purpose, the prepared biosensor was exposed to different concentrations of active caspase-3 and the ECL of each concentration was recorded. Then, the calibration curve was drawn by plotting the intensity of ECL against Neperian logarithm of each concentration (1 h at 37°C). The calibration curve is shown in Figs. 12A and B. The linear dynamic range (LDR) and the lower limit of quantification (LLOQ) of the engineered biosensor were obtained as 0.5-100 fM and 0.5 fM, respectively. The repeatability (which is an assessment of the precision) of the designed biosensor was studied with recording 15 repetitive analyses in the same condition. The repeatability graph is demonstrated in Fig. 13. The relative standard deviation (RSD) of the HRP-MB-MCH-BP-AuNPs-Th-RGO electrode was also obtained 1.42%. Comparison of the analytical parameters between the reported biosensors for quantification of caspase-3 activity is presented in Table 1.
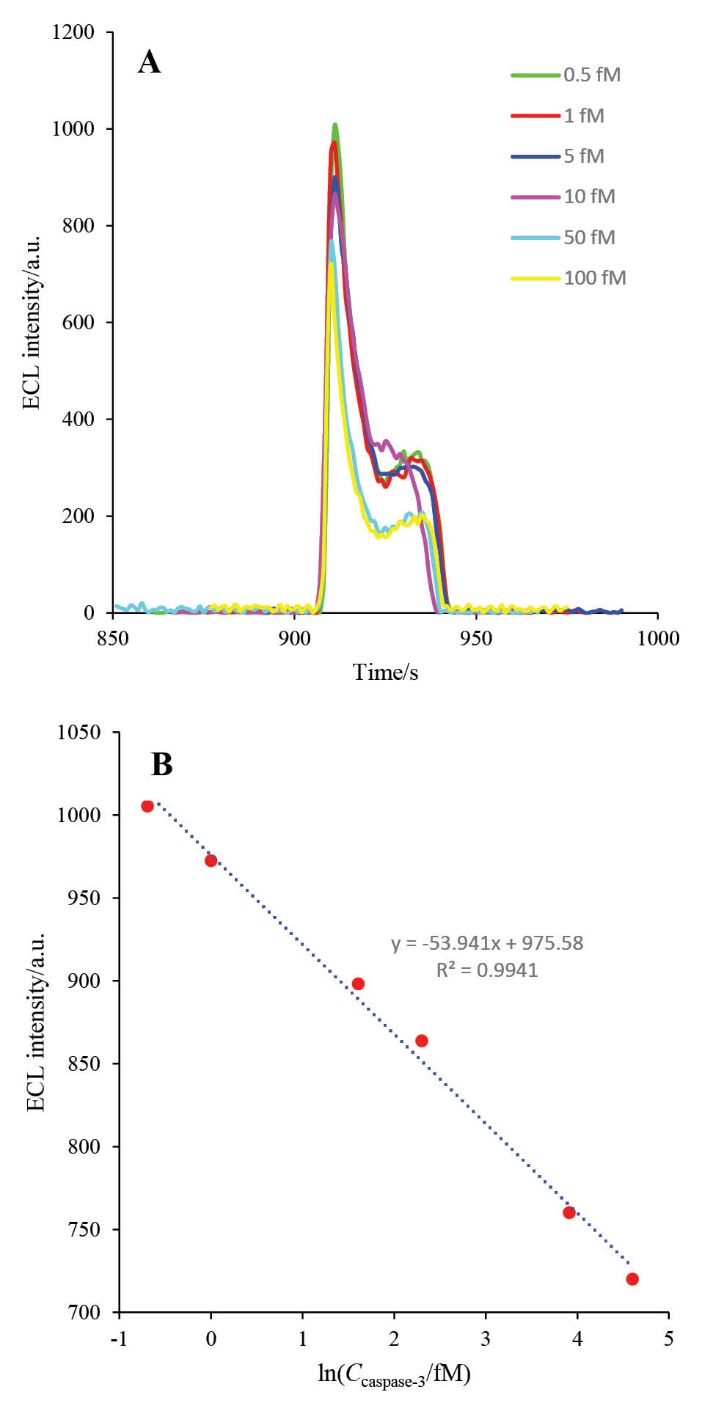
Fig. 12. A) The ECL spectra of HRP-MB-MCH-BP-AuNPs-Th-RGO-GCE in the presence of 0.5 mMluminol and 2 mM H2O2 in different concentrations of caspase-3 (0.5, 1, 5, 10, 50, and 100 fM); B) The calibration curve of caspase-3.

Fig. 13. The ECL spectra of 15 repetitive analysis of HRP-MBMCH-BP-AuNPs-Th-RGO-GCE in the presence of 0.18 mM luminol and 0.67 mM H2O2.
|
Table 1. Comparison of the designed biosensors for quantification of caspase-3 activity and this work
|
|
Method
|
LDR
|
LOD
|
Ref.
|
| DPV |
0.1–10 nM |
0.1 nM |
19
|
| Colorimetric |
0.18–7.2 nM |
0.18 nM |
20
|
| Fluorescence |
0.4–21.3 nM |
0.4 nM |
46
|
| SWV |
100 pM to 1 nM |
100 pM |
18
|
| Chemiluminescence |
Not reported |
1.3 pM |
47
|
| Surface plasmon resonance |
Not reported |
1 pM |
48
|
| SWV |
10 fM-10 nM |
5 fM |
26
|
| Electrochemiluminescence |
0.5-100 fM |
0.5 fM |
This work |
|
LOD: limit of detection, LDR: linear dynamic range, DPV: differential pulse voltammetry, SWV: square wave voltammetry
|
Real sample analysis
First, the A549 cells were treated with different concentrations of DOX (0.0, 0.25, 0.5, 1, 2 and 4 nM) and, then, the total protein of each treated group was extracted. Finally, HRP-MB-BP-MCH-AuNPs-Th-RGO-GCE was exposed to the extracted total proteins at the optimum conditions. The ECL results of the engineered biosensor exposed to the mentioned groups are presented in Figs. 14A and B. It is worthwhile to point out that the caspase-3 activity was detected not only in all groups treated with DOX, but also in the negative control group (i.e. in the normal cell line).
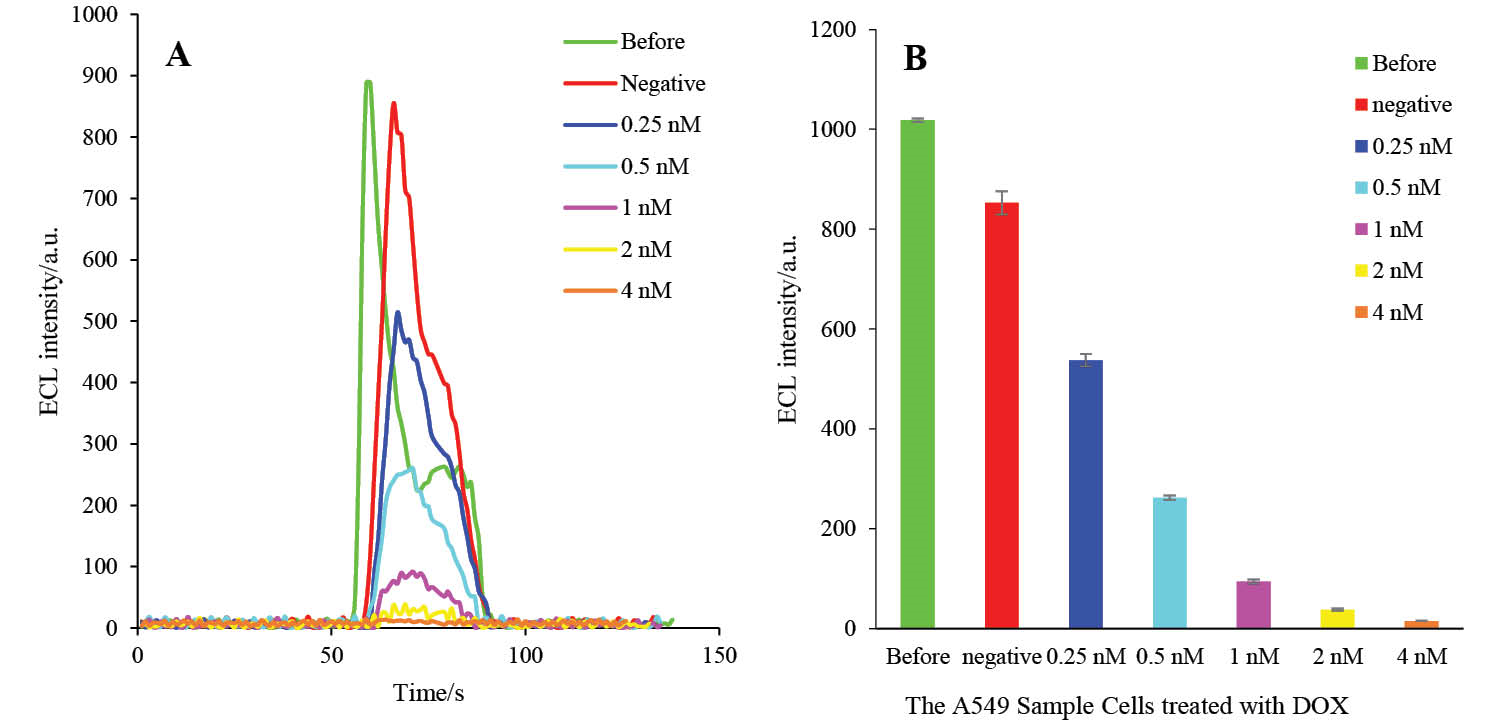
Fig. 14. A) The ECL spectra of HRP-MB-MCH-BP-AuNPs-Th-RGO-GCE in the presence of 0.5 mMluminol and 2 mM H2O2 on the total proteins of A549 cells which were treated by different concentrations of DOX (negative, 0.25, 0.5, 1, 2, and 4 nM); B) The variations of ECL intensity versus A549 cell groups.
Discussion
According to obtained results by CV and ECL, it is figured out that AuNPs could improve the electrical conductivity of the GO. Therefore, in the proposed nanocomposite, AuNPs were used as electrical conductivity enhancing agents and also as nano-conjugating agents between N-terminals of BP and themselves. Moreover, the surface area of the GO was wider (approximately 2 fold) than other materials (including MCM-41) and it was, therefore, used as the electrode base. Furthermore, for more enhancing the electrical conductivity of the GO, the GO decorated AuNPs were electrochemically (a reduction process using CV technique) deposited on the GCE and as it is presented in the literature, the conductivity of the RGO is better than that of GO. In addition, it is concluded that the mass transfer is controlled by diffusion which makes the fabricated biosensor appropriate for quantitative analysis.41 Based on kinetic results, the mass transfer is controlled by diffusion.40
The proposed luminol-based ECL biosensor’s analytical data is comparable with all single methods (optical, electrochemical and electroluminescence methods) reported by others. For example, The LOD is the lowest. According to the analytical results of the present assay for the quantification of the caspase-3 activity, it is found that the analytical data of the hyphenated methods are better than those of the single methods. Based on the obtained desired statistical data of DEVD-based biosensor, the precision of the proposed assay is very high than that of other reported assays.19 The repeatability of this ECL-based biosensor may be because of the blocking of active sites of the electrode, which may conflict on the ECL signals, using MCH compound. The MCH material for its small size penetrates the nano-conjugated DEVD peptides on the AuNPs and reacts with remained active AuNPs, blocks them and so finally, the obtained repeatable ECL signal is only due to the ECL activity of the luminol in the presence of HRP and H2O2.
Interestingly, at the real sample analysis section, the A549 cells were treated by the ultra-low concentration of DOX in comparison with the reported papers.18 More importantly, the caspase-3 activity and apoptosis was confidently determined in the normal cell turnover and very low treated groups in comparison with those reported by others.19,42,43 Additionally, in some cases, the concentration of the apoptosis inducing agent was not reported.44,45 Some of the proposed DEVD-based biosensors were used toxic and explosive materials in the preparation steps of the proposed biosensors.19,44,45 But, the designed luminol based-ECL note only is free from these defects but also it has many favorable features like; user-friendly, eco-friendly, and especially low cast and very short response time. Notably, the sensitivity and the selectivity of the presented luminol-based ECL assay for detection of caspase-3 activity and apoptosis was improved by merging the electrochemical and luminescent methods. Generally, hyphenated methods are more sensitive than single methods.12
The LOD of the proposed luminol-based ECL assay is about 10 folds lower than that in our previously published article.26 The reason of this approach is high surface area and electrical conductivity of RGO than MCM-41 and merging of both electrochemical and luminescence methods. Additionally, both amplification strategies for signal enhancing were used in this luminol-based ECL assay (reporter amplification using streptavidin coated magnetic beads and electrode modifier amplification mode by AuNPs-RGO). In the reporter amplification mode, the HRP enzyme as ECL reporter, were densely loaded on the magnetic beads. Furthermore, in this amplification strategy, the DEVD peptide was densely loaded on the AuNPs-RGO. Therefore, the ECL reporter and the number of DEVD peptide in this luminol-based assay were highly enhanced. Merging the electrochemical and luminescence methods also caused the obtained LOD to be dramatically reduced to 0.5 FM.
Conclusion
A novel ultra-sensitive hyphenated method ECL system was developed for detection of caspase-3 activity. The engineered biosensor was fabricated using AuNPs and RGO nanocomposite as electrode cushioning agent (AuNPs-Th-RGO), and HRP enzyme as an electro-catalytic agent for determination of caspase-3 activity. At optimum condition, the designed biosensor exhibited high sensitivity (LLOQ=0.5 fM) and good repeatability for determination of caspase-3 activity in the A549 cell line as a real sample. Based on these results, the proposed peptide-based biosensor could be considered as an efficient analytical method for the early detection of apoptosis in biological and pathological processes.
Ethical approval
Tere is none to be declared.
Competing interests
Tere is none to be declared.
Acknowledgments
This study was financially supported by Research Center for Pharmaceutical Nanotechnology (RCPN) at Tabriz University of Medical Sciences. The project was also a part of PhD thesis (No. 92/014/125/3) and its grant number was 92001.
Research Highlights
What is current knowledge?
√ Graphene oxide (GO) decorated with gold nanoparticles
(AuNPs) was used as electrode base for the construction of
DEVD modified peptide biosensor.
√ Using nano composition of the RGO with AuNPs, the
surface area of the electrode was dramatically enhanced
What is new here?
√ A high sensitive luminol-based ECL biosensor was able to detect caspase-3 activity as low as 0.5 fM.
√ The designed ECL-based biosensor was successfully evaluated in A549 cell line in which the apoptosis was induced by ultra-low concentrations of doxorubicin.
References
- Farrell D, Alper J, Ptak K, Panaro NJ, Grodzinski P, Barker AD. Recent Advances from the National Cancer Institute Alliance for Nanotechnology in Cancer. ACS Nano 2010; 4: 589-94. doi:10.1021/nn100073g. [Crossref]
- Ferrari M. Cancer nanotechnology: opportunities and challenges. Nat Rev Cancer 2005; 5: 161-71.
- Mertens J, Rogero C, Calleja M, Ramos D, Martin-Gago JA, Briones C, et al. Label-free detection of DNA hybridization based on hydration-induced tension in nucleic acid films. Nat Nano 2008; 3: 301-7.
- Sengupta S, Sasisekharan R. Exploiting nanotechnology to target cancer. Br J Cancer 2007; 96: 1315-9. [PubMed] [PubMed Central]
- Balal K, Mohammad H, Bahareh B, Ali B, Maryam H, Mozhgan Z. Zeolite Nanoparticle Modified Carbon Paste Electrode as a Biosensor for Simultaneous Determination of Dopamine and Tryptophan. Journal of the Chinese Chemical Society 2009; 56: 789-96. doi:10.1002/jccs.200900117. [Crossref]
- Jaymand M, Hatamzadeh M, Omidi Y. Modification of polythiophene by the incorporation of processable polymeric chains: Recent progress in synthesis and applications. Progress in Polymer Science 2015; 47: 26-69. doi:10.1016/j.progpolymsci.2014.11.004. [Crossref]
- Park S, Ruoff RS. Chemical methods for the production of graphenes. Nat Nano 2009; 4: 217-24.
- Yang Y, Asiri AM, Du D, Lin Y. Acetylcholinesterase biosensor based on a gold nanoparticle-polypyrrole-reduced graphene oxide nanocomposite modified electrode for the amperometric detection of organophosphorus pesticides. Analyst 2014; 139: 3055-60. doi:10.1039/C4AN00068D. [Crossref]
- Wen-Shuo W, Da-Wei H, Ji-Hong W, Jia-Hua D, Hong-Shang P, Hong-Peng W, et al. An optimized, sensitive and stable reduced graphene oxide–gold nanoparticle-luminol-H 2 O 2 chemiluminescence system and its potential analytical application. Chinese Physics B 2014; 23: 048103.
- Gao H, Xiao F, Ching CB, Duan H. One-Step Electrochemical Synthesis of PtNi Nanoparticle-Graphene Nanocomposites for Nonenzymatic Amperometric Glucose Detection. ACS Applied Materials & Interfaces 2011; 3: 3049-57. doi:10.1021/am200563f. [Crossref]
- Shi Q, Diao G, Mu S. Electrochemical oxidation of glucose on gold nanoparticle-modified reduced graphene oxide electrodes in alkaline solutions. Functional Materials Letters 2015; 08: 1540004. doi:10.1142/S1793604715400044. [Crossref]
- Richter MM. Electrochemiluminescence (ECL). Chem Rev 2004; 104: 3003-36. doi:10.1021/cr020373d. [Crossref]
- Afsharan H, Navaeipour F, Khalilzadeh B, Tajalli H, Mollabashi M, Ahar MJ, et al. Highly sensitive electrochemiluminescence detection of p53 protein using functionalized Ru–silica nanoporous@gold nanocomposite. Biosens Bioelectron 2016; 80: 146-53. doi:10.1016/j.bios.2016.01.030. [Crossref]
- Marquette C, Blum L. Applications of the luminol chemiluminescent reaction in analytical chemistry. Anal Bioanal Chem 2006; 385: 546-54. doi:10.1007/s00216-006-0439-9. [Crossref]
- Miao W. Electrogenerated Chemiluminescence and Its Biorelated Applications. Chem Rev 2008; 108: 2506-53. doi:10.1021/cr068083a. [Crossref]
- Fuchs Y, Steller H. Programmed cell death in animal development and disease. Cell 2011; 147: 1640. doi:10.1016/j.cell.2011.11.045. [Crossref]
- Hengartner MO. The biochemistry of apoptosis. Nature 2000; 407: 770-6.
- Khalilzadeh B, Shadjou N, Eskandani M, Charoudeh HN, Omidi Y, Rashidi MR. A reliable self-assembled peptide based electrochemical biosensor for detection of caspase 3 activity and apoptosis. RSC Adv 2015; 5: 58316-26. doi:10.1039/C5RA08561F. [Crossref]
- Takano S, Shiomoto S, Inoue KY, Ino K, Shiku H, Matsue T. Electrochemical approach for the development of a simple method for detecting cell apoptosis based on caspase-3 activity. Anal Chem 2014; 86: 4723-8. doi:10.1021/ac403394z. [Crossref]
- Pan Y, Guo M, Nie Z, Huang Y, Peng Y, Liu A, et al. Colorimetric detection of apoptosis based on caspase-3 activity assay using unmodified gold nanoparticles. Chem Commun (Camb) 2012; 48: 997-9. doi:10.1039/C1CC15407A. [Crossref]
- Prasuhn DE, Feltz A, Blanco-Canosa JB, Susumu K, Stewart MH, Mei BC, et al. Quantum dot peptide biosensors for monitoring caspase 3 proteolysis and calcium ions. ACS Nano 2010; 4: 5487-97. doi:10.1021/nn1016132. [Crossref]
- Belloc F, Belaud-Rotureau MA, Lavignolle V, Bascans E, Braz-Pereira E, Durrieu F, et al. Flow cytometry detection of caspase 3 activation in preapoptotic leukemic cells. Cytometry 2000; 40: 151-60.
- Fox R, Aubert M. Flow Cytometric Detection of Activated Caspase-3. In: Mor G, A Alvero, eds. Apoptosis and Cancer.Humana Press; 2008. p. 47-56.
- Jun YW, Sheikholeslami S, Hostetter DR, Tajon C, Craik CS, Alivisatos AP. Continuous imaging of plasmon rulers in live cells reveals early-stage caspase-3 activation at the single-molecule level. Proceedings of the National Academy of Sciences 2009; 106: 17735-40. doi:10.1073/pnas.0907367106. [PubMed] [PubMed Central] [Crossref]
- Kim K, Lee M, Park H, Kim JH, Kim S, Chung H, et al. Cell-permeable and biocompatible polymeric nanoparticles for apoptosis imaging. J Am Chem Soc 2006; 128: 3490-1. doi:10.1021/ja057712f. [Crossref]
- Khalilzadeh B, Charoudeh HN, Shadjou N, Mohammad-Rezaei R, Omidi Y, Velaei K, et al. Ultrasensitive caspase-3 activity detection using an electrochemical biosensor engineered by gold nanoparticle functionalized MCM-41: Its application during stem cell differentiation. Sensors and Actuators B: Chemical 2016; 231: 561-75. doi:10.1016/j.snb.2016.03.043. [Crossref]
- McStay GP, Salvesen GS, Green DR. Overlapping cleavage motif selectivity of caspases: implications for analysis of apoptotic pathways. Cell Death Differ 2007; 15: 322-31.
- Turkevich J, Stevenson PC, Hillier J. A study of the nucleation and growth processes in the synthesis of colloidal gold. Discuss Faraday Soc 1951; 11: 55-75. doi:10.1039/DF9511100055. [Crossref]
- Liu Y, Huang Z, Xie Q, Sun L, Gu T, Li Z, et al. Electrodeposition of electroreduced graphene oxide-Au nanoparticles composite film at glassy carbon electrode for anodic stripping voltammetric analysis of trace arsenic(III). Sensors and Actuators B: Chemical 2013; 188: 894-901. doi:10.1016/j.snb.2013.07.113. [Crossref]
- Zhang Z, Chen H, Xing C, Guo M, Xu F, Wang X, et al. Sodium citrate: A universal reducing agent for reduction/decoration of graphene oxide with au nanoparticles. Nano Res 2011; 4: 599-611. doi:10.1007/s12274-011-0116-y. [Crossref]
- Park S, An J, Jung I, Piner RD, An SJ, Li X, et al. Colloidal suspensions of highly reduced graphene oxide in a wide variety of organic solvents. Nano Lett 2009; 9: 1593-7. doi:10.1021/nl803798y. [Crossref]
- Lingappan N, Kim JH, Gal YS, Lim KT. Preparation of highly dispersed gold nanoparticles on organosilane modified graphene nanosheets. Molecular Crystals and Liquid Crystals 2014; 602: 126-33. doi:10.1080/15421406.2014.944750. [Crossref]
- Li J, Liu C-y, Liu Y. Au/graphene hydrogel: synthesis, characterization and its use for catalytic reduction of 4-nitrophenol. J Mater Chem 2012; 22: 8426-30. doi:10.1039/C2JM16386A. [Crossref]
- He FA, Fan JT, Song F, Zhang LM, Lai-Wa Chan H. Fabrication of hybrids based on graphene and metal nanoparticles by in situ and self-assembled methods. Nanoscale 2011; 3: 1182-8. doi:10.1039/C0NR00672F. [Crossref]
- Shourian M, Ghourchian H, Boutorabi M. Ultra-sensitive immunosensor for detection of hepatitis B surface antigen using multi-functionalized gold nanoparticles. Anal Chim Acta 2015; 895: 1-11. doi:10.1016/j.aca.2015.07.013. [Crossref]
- Liu X, Niu W, Li H, Han S, Hu L, Xu G. Glucose biosensor based on gold nanoparticle-catalyzed luminol electrochemiluminescence on a three-dimensional sol–gel network. Electrochem commun. 2008; 10: 1250-3. doi:10.1016/j.elecom.2008.06.009. [Crossref]
- Qiu B, Lin Z, Wang J, Chen Z, Chen J, Chen G. An electrochemiluminescent biosensor for glucose based on the electrochemiluminescence of luminol on the nafion/glucose oxidase/poly(nickel(II)tetrasulfophthalocyanine)/multi-walled carbon nanotubes modified electrode. Talanta 2009; 78: 76-80. doi:10.1016/j.talanta.2008.10.067. [Crossref]
- Alpeeva IS, Sakharov IY. Soybean Peroxidase-Catalyzed Oxidation of Luminol by Hydrogen Peroxide. J Agric Food Chem 2005; 53: 5784-8. doi:10.1021/jf0506075. [Crossref]
- Chiang Lin K, Yu Lai S, Ming Chen S. A highly sensitive NADH sensor based on a mycelium-like nanocomposite using graphene oxide and multi-walled carbon nanotubes to co-immobilize poly(luminol) and poly(neutral red) hybrid films. Analyst 2014; 139: 3991-8. doi:10.1039/C4AN00536H. [Crossref]
- Bard AJ, Faulkner LR. Electrochemical methods: fundamentals and applications. 2nd. Hoboken: Wiley and Sons; 2001.
- Goyal RN, Gupta VK, Oyama M, Bachheti N. Gold nanoparticles modified indium tin oxide electrode for the simultaneous determination of dopamine and serotonin: application in pharmaceutical formulations and biological fluids. Talanta 2007; 72: 976-83. doi:10.1016/j.talanta.2006.12.029. [Crossref]
- Maxwell D, Chang Q, Zhang X, Barnett EM, Piwnica-Worms D. An Improved cell-penetrating, caspase-activatable, near-infrared fluorescent peptide for apoptosis imaging. Bioconjug Chem 2009; 20: 702-9. doi:10.1021/bc800516n. [PubMed] [PubMed Central] [Crossref]
- Torkzadeh-Mahani M, Ataei F, Nikkhah M, Hosseinkhani S. Design and development of a whole-cell luminescent biosensor for detection of early-stage of apoptosis. Biosens Bioelectron 2012; 38: 362-8. doi:10.1016/j.bios.2012.06.034. [Crossref]
- Xiao H, Liu L, Meng F, Huang J, Li G. Electrochemical Approach To Detect Apoptosis. Anal Chem 2008; 80: 5272-5. doi:10.1021/ac8005268. [Crossref]
- Zhou Z, Peng L, Wang X, Xiang Y, Tong A. A new colorimetric strategy for monitoring caspase 3 activity by HRP-mimicking DNAzyme-peptide conjugates. Analyst 2014; 139: 1178-83. doi:10.1039/C3AN02028B. [Crossref]
- Wang H, Zhang Q, Chu X, Chen T, Ge J, Yu R. Graphene Oxide–Peptide Conjugate as an Intracellular Protease Sensor for Caspase-3 Activation Imaging in Live Cells. Angewandte Chemie International Edition 2011; 50: 7065-9. doi:10.1002/anie.201101351. [Crossref]
- Richard JA, Jean L, Romieu A, Massonneau M, Noack-Fraissignes P, Renard PY. Chemiluminescent Probe for the in Vitro Detection of Protease Activity. Org Lett 2007; 9: 4853-5. doi:10.1021/ol702190y. [Crossref]
- Chen H, Mei Q, Hou Y, Zhu X, Koh K, Li X, et al. Fabrication of a protease sensor for caspase-3 activity detection based on surface plasmon resonance. Analyst 2013; 138: 5757-61. doi:10.1039/C3AN01137B. [Crossref]