Spectrophotometric analysis of thrombolytic activity: SATA assay
Bioimpacts, 8(1), 31-38; DOI:10.15171/bi.2018.05
Original Research
Spectrophotometric analysis of thrombolytic activity: SATA assay
Masumeh Zamanlu1,
Morteza Eskandani2*,
Reza Mohammadian1,
Nazila Entekhabi3,
Mohammad Rafi4,
Mehdi Farhoudi1*
*Corresponding authors: Morteza Eskandani, Email: eskandanim@tbzmed.ac.ir; Mehdi Farhoudi, Email: farhoudi_m@yahoo.com
Abstract
Introduction:
Measurement of thrombolytic activity is crucial for research and development of novel thrombolytics. It is a key factor in the assessment of the effectiveness of conventionally used thrombolytic therapies in the clinic. Previous methods used for the assessment of thrombolytic activity are often associated with some drawbacks such as being costly, time-consuming, complex with low accuracy. Here, we introduce a simple, economic, relatively accurate and fast method of spectrophotometric analysis of thrombolytic activity (SATA) assay, standardized by tissue plasminogen activator (tPA), which can quantitatively measure in vitro thrombolytic activity.
Methods:
Blood clots were formed, uniformly, by mixing citrated whole blood with partial thromboplastin time (PTT) reagent, together with calcium chloride. Then, designated concentrations of tPA were added to the samples, and the released red blood cells from each clot were quantified using spectrophotometry (λmax=405nm) as an indicator of thrombolytic activity. The accuracy of the method was tested by assessment of dose-responsibility against R2 value obtained by linear equation and measurement of the limit of detection (LOD) and limit of quantification (LOQ). The SATA assay was validated in comparison with some currently used techniques.
Results:
A linear relationship was obtained between different concentrations of tPA versus the spectrophotometric absorbance of the related dilutions of lysed clots, at λmax=405nm. Calculated R2 values were greater than 0.9; with LOD of 0.90 µg/mL of tPA (436.50IU) and LOQ of 2.99 µg/mL of tPA (1450.15IU).
Conclusions:
Conclusively, the SATA assay is a very simple quantitative method with repeatable and reproducible results for estimating the potency of an unknown thrombolytic agent, and calculating the activity as delicate as 1 µg/mL of tPA (485 IU/mL of thrombolytic dose).
Keywords: Clot lysis, Thrombolytic agent, In vitro thrombolysis, Thrombolytic therapy, Fibrinolysis
Introduction
Thrombolytic therapy is the only effective medication for the myocardial infarction (MI) and brain ischemic stroke, which are known as the leading causes of mortality and disability worldwide.1-6 The first thrombolytic agent was discovered in 1933,7 and then two thrombolytic therapies were reported in 1949 and 1950.8,9
Numerous thrombolytic agents, comprising of streptokinase (EC: 3.4.24.29) and tissue plasminogen activator/s (tPAs; EC 3.4.21.68) have been introduced for the clinical uses, which may be categorized as different generations together with various agents, extracts, technologies and de novo advanced systems.7,10,11 Bioactivity of a thrombolytic agent is not only an important parameter indicating its potential outcomes in experimental investigations, but also a vital measure for the clinical success in critical situations (e.g., cardiac or brain vascular interventions or thrombolytic therapies). Thrombolytic agents are usually enzymes whose functions may be affected by various factors, including pH, temperature, circumstance and time of maintenance. Such issues may influence the final clinical outcomes of pharmacotherapy, especially during vital vascular interventions.
Historically, in 1794, the phenomenon of fibrinolysis was introduced as “the blood-deprived of its coagulation power”.12 For the first time in the 1950s, euglobulin lysis assay was developed to measure the natural fibrinolysis.13-15 Subsequently, a variety of methods were developed to measure the potency of thrombolytic agents for possible clinical administration. However, the methods in some cases appeared to be dependent on costly materials and agents. For instances, a relatively expensive D-dimer measurement was incorporated in the quantification of the fibrin degraded particles after lysis.16 Further, fibrin agarose plate assay (FAPA) needs fibrin, fibrinogen, and thrombin to be mixed with agarose.17-20 The occluded tube model needs thrombin to be mixed with the blood sample,21,22 and the heparin modulated clot lytic activity needs thrombin together with plasminogen.23 Moreover, the other un-official methods utilize thrombin.24,25 The time required for the assessment of thrombolytic enzymes’ activity is a very important factor in the case of emergency needs in the clinic. Thus, taken all, time is a limiting factor in these types of experiments.23,26,27 In a method, whole blood was recruited freshly and incubated at 37°C for 24 hours to form clots spontaneously.28 Although the method is economic, it is rather time consuming and laborious, which makes it even more complicated to discriminate the spontaneous lysis of clot from lysing effect of the thrombolytic agent. The other problem in the previously developed methods is that the formed clots always are irregular along with some un-clotted residues that should be “aspirated out” or “washed with saline”.26,28
In the present investigation, spectrophotometric analysis of thrombolytic activity (SATA) assay, that is actually designed for the measurement of clot lysis, was developed using partial thromboplastin time (PTT) reagent together with calcium chloride for the induction of a uniform and precisely equal clot formation. These reagents are inexpensive and easy to access, and when used properly, induce rapid (within several minutes) regular complete clots from plasma or whole blood samples. Here, this assay is introduced for the first time as a simple and non-expensive method for the analysis of thrombolytic activity in vitro, which could be performed in any laboratory equipped with a spectrophotometer, even in a hospital. The method has been established based on the UV/Vis absorbance of hemoglobin of red blood cells (RBCs) released from a clot; standardized by concentrations of standard tissue plasminogen activator (tPA). Performing the method by visualizing the red color, instead of the spectrophotometric absorbance of hemoglobin, makes it possible to have a rough estimate of the activity of thrombolytic drugs in a clinical setting.
Materials and Methods
Materials and equipment
Buffered sodium citrated tube was purchased from Persian Lab (Tehran, Iran), sterile water for injection and normal saline serum as diluent were obtained from the Iranian Parenteral and Pharmaceutical Company (Tehran, Iran). Insulin syringe was prepared from SUPA Medical Devices (Tehran, Iran). The activated partial thromboplastin time (APTT) reagent was purchased from the Pacific HemostasisTM Fisher Scientific (Massachusetts, USA). Calcium chloride was acquired from Bahar Afshan (Tehran, Iran). The tissue plasminogen activator (tPA), Actilyse® (Alteplase), was bought from Boehringer Ingelheim (Ingelheim am Rhein, Germany).
Blood samples
Human whole blood was collected from cubital vein of adult volunteers by sterile venipuncture, transferred into buffered sodium citrate tubes and refrigerated until use. All volunteers were healthy, without current or previous hematologic, coagulative or bleeding disorders or recent abortion; they were not pregnant or on any hormonal therapy or contraception. The study was conducted as approved by the Ethics Committee of Tabriz University of Medical Sciences, and an informed consent was obtained from volunteers.
Production of blood clots
Clots were formed using 300 µL of citrated whole blood mixed with 200 µL of PTT reagent and 200 µL CaCl2. Clot formation was completed in 5-10 minutes. For prevention of the spontaneous thrombolysis of clots, all reactions were performed on ice before conducting the SATA assay.
Thrombolytic agent
Commercially available lyophilized tissue plasminogen activator (tPA) was used as the standard thrombolytic agent during SATA development. The vial was reconstituted with sterile water for injection as instructed by the manufacturer; hence the resulted solution of tPA (1 mg/mL) was used as a stock. The stock was aliquoted and stored at -80°C until use. According to previous reports, reconstituted tPA preserves its activity for several months or a year at -30°C and for long-term (several years) at -80°C.29-32 Appropriate dilutions were prepared by mixing volumes of the stock with normal saline (N/S) as needed in the experiments. Dilutions were made freshly prior to the experiments and kept at 0-4°C during the experiments.
The tPA activity in terms of international units per nanogram (IU/ng) was also determined by active human tPA assay ELISA kit (Oxford Biomedical Research, Avon Industrial Park, Avon, MA, USA) following the manufacturer instruction. The assay incorporates plasminogen activator inhibitor-1 (PAI-1) specific for human tPA to capture active tPAs and an HRP conjugated secondary antibody for detection. Briefly, reconstituted biotinylated PAI-1 was added to 96 wells and the plate was shaken to ensure mixing. The wells were washed (3×) with wash buffer, and the standards and samples were added to the wells in duplicate, and the plate was shaken again. Following, the plate was washed (3×) with wash buffer, and the primary antibody was added to the wells and the plate was shaken. Then, the wells were washed and the secondary antibody was included. Finally, 3,3′,5,5′-Tetramethylbenzidine (TMB) substrate was added and the plate was shaken for 2-10 minutes. The reaction was stopped by adding sulfuric acid, and the plate was read at 450 nm. All shakings were performed at 300 rpm at room temperature for 30 minutes, except the last shaking which was for 2-10 minutes.
The procedure of SATA assay
Designated dilutions (0, 0.5, 1, 2, 2.5, 5 and 7.5 µg/mL; equal to 0-3637.5 IU/mL) of tPA were prepared in normal saline. Then, 100 µL of each dilution was added to the clots in glass tubes and incubated at 37°C for different time periods for optimization of incubation (5-20 minutes). Then, 1 mL of normal saline was carefully added to the mixture (without destroying the residue clots) to suspend the liquid lysed clot containing RBCs carrying their hemoglobin. The suspension was diluted 25 times with normal saline and the absorbance of the suspension against the diluent blank was measured at the λmax of 405 nm (the peak absorption of hemoglobin). Finally, the corresponding standard curve was plotted for different dilutions using corresponded optical densities.
Precision assessment of SATA assay
Thrombolytic activity based on the percentages of digested clot (% DC) was assessed,26 with some modifications during the procedure of blood clots production and preparation of dilutions and control sample. Standard dilutions (0-3637.5 IU/mL) of tPA were prepared, and 100 µL of each dilution was added to the clots. The mixtures, in the labeled pre-weighed microtubes, were incubated at 37°C for 20 minutes. The weight of the primary clots and the residue clots after the clot lysis were measured and used to calculate the percentages of the digested clots (reduction in clot weight) according to the equation (1)26:
(Eq. 1)
Moreover, the occluded tube model was used for the analysis of the thrombolytic activity of tPA as reported previously.21,22 A transparent tube with a piston and internal diameter (ID) of 0.5 cm and length of 8 cm (an insulin syringe), was used for the model development. The mixture of citrated whole blood, CaCl2, and PTT reagent were added into the developed tube while the piston was in the middle, to form the clot in a fixed position along the tube. After completion of the clot formation, the piston was detached carefully and a clot which was formed homogenously without internal void volumes or loose adhesion inside the tube was used as a proper occluded tube model to mimic the clotting process in the blood vessels. One side of the occluded tube was filled with normal saline and the other side was filled with 300 µL of different concentrations of the thrombolytic agent. The two ends of the tube were properly sealed, and the tube was incubated at 37°C for different time periods. The appearance of a red color induced by the lysed clot at the clot surface exposed to normal saline was considered as the lysis time, while the recanalization time was measured in the case of formation of a visible channel along the clot.
Troubleshooting and important hints
When the suspension of the lysed clot is being diluted, the final volume should be set due to the volume needed to fill the cuvette of the spectrophotometer.
The dilutions of the suspension of the liquid lysed clot were adjusted so that the absorbance would be in the range (OD ~ 0.5 to 1.7). In the case of low/high absorbance for any reason (e.g., modifications in the agent, concentrations, time, etc) dilutions would better be less/more, respectively.
After the reconstitution of tPA, it is deactivated after several hours at room temperature and 24 hours at 4°C. Therefore, dilutions would better be made freshly prior to experiments and be kept at 4°C during the experiments.
When the clots are formed, they show some spontaneous thrombolytic activity. To reduce spontaneous thrombolysis, clots should be kept on ice or refrigerator before and after the experiments. At the experimenting time, all clots with their thrombolytic agent should be incubated at 37°C, and taken from it at the same time.
The differences of thrombolytic activity induced by various concentrations of tPA are rather insignificant during the first few minutes and also after long times when high concentrations of tPA have lysed the clots completely. The optimum time for finding the significant difference of concentrations in this range is 15-20 minutes. For continuance of the thrombolysis process for a longer period, the size of clots should be larger.
Clot formation by the current method should be completed without any residue. Also, the final volume of all clots (sum of whole blood and reagents) should be equal in different samples. In the case of incomplete clot formation, the quantity/quality of reagents should be checked. Moreover, the blood should be used during several days after collection, with normal coagulation (at least with normal international normalized ratio-INR) and mixed with a correct proportion of citrate. If necessary, the amount of reagents could be increased to complete the clot formation. However, it is recommended that other mentioned probable problems to be checked first.
Sterile water for injection could be used for the reconstitution of tPA, but not for the dilution or as the control versus the thrombolytic agents because low osmolality destructs the clot without activating thrombolysis. Therefore, we used normal saline as the diluent in all steps (diluting thrombolytic agent or the lysed clot).
The clot residues are very delicate and could be disrupted easily, therefore the first dilution of the lysed clot must be done as gentle and fast as possible.
Statistical analysis
For statistical analysis, one-way analysis of variance (ANOVA) and independent Student’s t-test were applied to compare mean differences of ODs. A P value less than 0.5 was considered statistically significant.
Results
SATA assay
As thrombolysis continues, RBCs are released from the clot. The thrombolytic activity of various concentrations of tPA, in the range of 0-7.5 µg/mL (equal to 0-3637.5 IU/mL), was measured by spectrophotometry of hemoglobin released from the lysing clot. A standard curve was plotted for the resulted absorbance values, and the equation together with R square value was calculated. The limit of detection (LOD) and limit of quantification (LOQ) of the method were calculated as well, and the results were compared with other methods previously introduced for the measurement of thrombolysis. The ODs obtained from clots lysed by tPA concentrations are presented in Fig. 1.
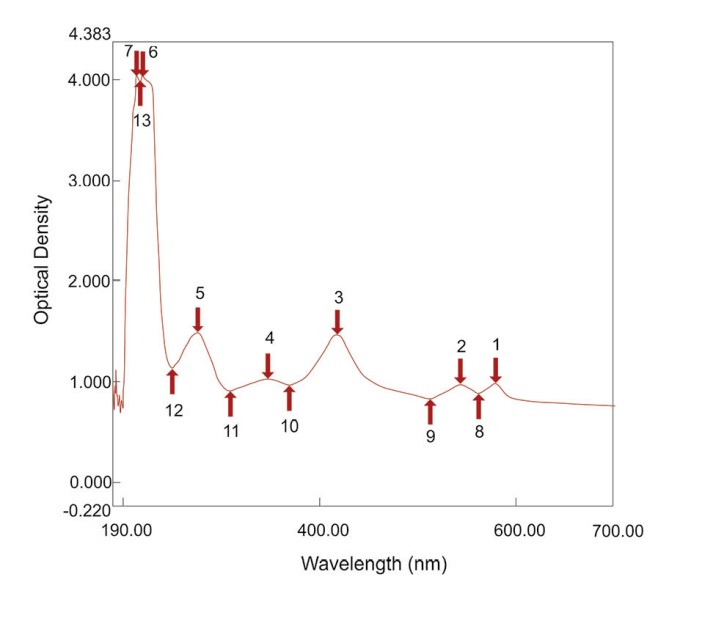
Fig. 1. The optical density of clots lysed by different concentrations of tPA representative of their thrombolytic activity.
A linear relationship was obtained between different concentrations of tPA and the spectrophotometric absorbance of the related dilutions of lysed clots, at λmax = 405 nm. Calculated R square values were more than 0.9. LOD and LOQ are important characteristics in the method validation. They are used to describe the smallest concentration of an analyte that can be reliably measured by an analytical procedure.33 The mixture and absorption measurement of the lowest concentration of tPA were repeated at least 3 times. LOD and LOQ were calculated as follows:
(Eq. 2)
(Eq. 3)
As calculated for the SATA assay, the LOD was 0.90 µg/mL of active tPA (436.50 IU) and LOQ 2.99 µg/mL of active tPA (1450.15 IU). The difference of optical densities induced by various concentrations of tPA was statistically significant (P < 0.05). The spectrophotometric absorbance at a spectrum of 190-700 nm for a dilution of lysed clot induced by one of the concentrations of tPA was obtained (Fig. 2). The mentioned linear relationship was in the corresponding wavelength (Fig. 2, peak no. 3) which is the peak absorption of hemoglobin. In addition, the differences in the red color of the diluted lysed clots could be visualized macroscopically, as shown in Fig. 3.
Fig. 2. Spectrum absorbance of a dilution of lysed clot induced by one of the concentrations of tPA.
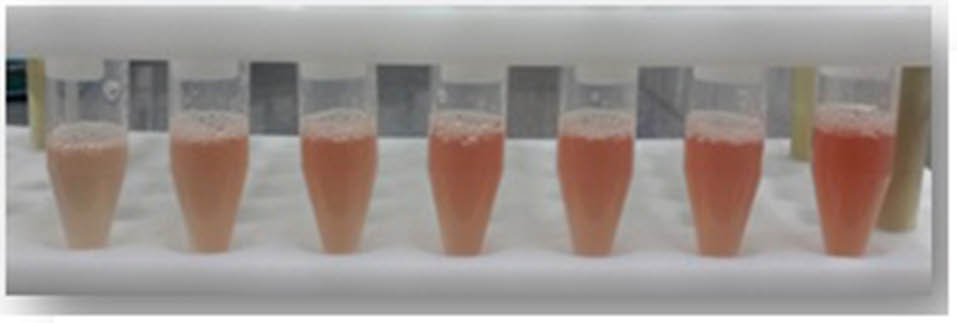
Fig. 3. Significant macroscopic differences of lysed clots by various concentrations of tPA.
Precision assessment of SATA assay
To confirm the results obtained from the SATA assay, thrombolytic activity of different concentrations of tPA was also measured using conventional measurement of percent of digested clot. A linear relationship was obtained for different concentrations of active tPA plotted versus the related percentages of the digested clots. The standard curve of the percentages of digested clot is shown in Fig. 4. Although different concentrations of tPA caused different percentages of DC, these differences were not statistically significant.
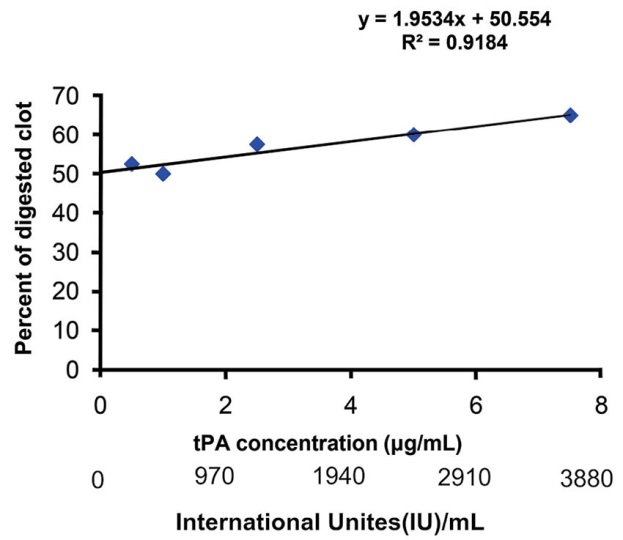
Fig. 4. Percentages of the digested clot by various concentrations of tPA representative of their thrombolytic activity.
Besides, for further justification of effectiveness of the SATA assay, the occluded tube model was carried out as described previously.20,21 Fig. 5 shows different steps of the developed model. The model at the beginning of the experiment is shown in Fig. 5A. Various concentrations of tPA could induce complete lysis of the occluding clot; even the control sample (normal saline free of tPA) induced complete lysis after nearly 4 hours (Fig. 5D). Table 1 shows the time of the clot lysis as well as the recanalization and complete lysis induced by various concentrations of tPA. The low concentrations of tPA, in the range of 0-10 µg/mL (0-4850.00 IU), showed a clot lysis pattern similar to the control. Therefore, higher tPA concentrations were applied as 50, 150 and 200 µg/mL (24250, 72750 and 97000 IU, respectively).

Fig. 5. The occluded tube model. Panels A, B, C, and D represent the starting point of the model, the initiation of clot lysis, the recanalization and completion of the thrombolysis process, respectively.
| Table 1. Time points for the clot lysis, recanalization, and completion by various concentrations of tPA in the occluded tube model |
|
tPA concentration (µg/mL)
|
tPA activity (IU/mL)
|
Clot lysis time (min)
|
Re-canalization time (min)
|
Complete lysis time (min)
|
| Control (0) |
0 |
36 |
70 |
~180-240 |
| 50 |
24250 |
6 |
11 |
134 |
| 150 |
72750 |
3 |
11 |
70 |
| 200 |
97000 |
3 |
12 |
90 |
The activity of the standard concentrations of tPA was measured by the ELISA method (Fig. 6). The activity of the drug used in this investigation was about 0.485 IU/ng, which was utilized for IUs calculation of the tPA used.
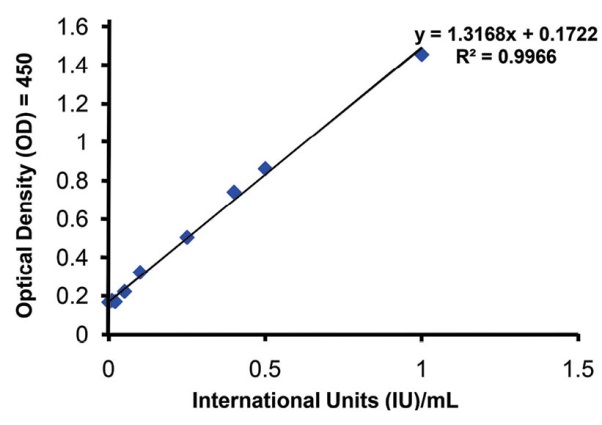
Fig. 6. The activity of the standard concentrations of tPA measured by ELISA method.
Discussion
Analysis of the thrombolytic activity of thrombolytic agents, that is actually a measurement of clot lysis, is crucial not only for the research but also for the clinical applications, including thrombolytic therapies for MI or ischemic stroke. Methods previously introduced for the measurement of thrombolytic activity appear to be associated with some limitations such as being costly, time-consuming and complex and often with low accuracy. The measurement of thrombolytic activity by fibrin agarose plates have already been introduced however, it demands expensive materials and is not an exact quantitative analysis.19 The concentration of fibrin degraded particles released after clot lysis has been measured by D-dimer assay which is highly accurate, but it is an expensive approach.16 The occluded tube model, which simulates the obstruction of a vessel by a clot, was shown to be unable of discriminating the lower doses of thrombolytic agents while requiring expensive materials.21,22 Some economic methods have also been developed, including the measurement of percentage of digested clot26 and RBC release from tiny clots.28 These approaches are often inaccurate and time-consuming, while some other methods incorporate complex instruments or expensive agents.24,25,34
The current investigation introduces the SATA assay, which provides a simple, economical, relatively accurate and fast method for quantitative analysis of the thrombolytic activity. The assay records the optical density (OD) of the dilutions of the lysed clot at 405 nm, by simple UV/Vis spectrophotometry. This wavelength is the peak absorption of the hemoglobin, and it could be a mean to detect the RBCs which are released from the clot, as thrombolysis continues. The SATA can be used both for estimation and comparison of the thrombolytic activities as well as for quantification of the concentration of a standard thrombolytic agent (e.g., tPA, streptokinase and urokinase), which could induce similar thrombolysis as an unknown agent does. The resultant data from the SATA method showed that the equation calculated for the linear relationship of ODs versus tPA standard concentrations displayed a coefficient of determination greater than 0.9 with precise discriminative LOD and LOQ values. These two values are used to describe the smallest concentration of analytes that can be reliably measured by an analytical procedure.33 In this investigation, the LOD and LOQ values were respectively 0.90 µg/mL and 2.99 µg/mL for active tPA ( 436.50 IU and 1450.15 IU, respectively). The current experiment was performed by 0-7.5 µg/mL of active tPA (0-3637.5 IU/mL). The discrimination power of SATA assay is well beyond the clinical dose of tPA infusion. For further comparison with other thrombolytic agents such as streptokinase, the IUs of thrombolytic agents could be used. Various potencies of commercial tPA have been reported as much as 1000-580000 IU/mg. The company which manufactured the tPA utilized in this experiment reported the potency of 580000 IU/mg; however, a study in 1990 reported the potency of marketed tPAs only about 492000 IU/mg.35 The range of IUs discriminated in the current study is five times smaller than the range reported previously,26 whose model did not show any significant difference between three dilutions of streptokinase used. They only reported the difference between water as the negative control and dilutions of the thrombolytic agent. Similarly, we found no significant difference between percentages of the digested clots by various concentrations of active tPA. However similar to the SATA assay, the digested clot experiment could give a standard curve by linear correlation between the percentages of DC versus the concentrations of active tPA. However, the differences between results obtained by the minimum and maximum concentrations of active tPA is not significant regarding to the digested clot method (Fig. 4), while these differences appeared to be substantially significant in the developed SATA assay (Fig. 1), indicating the accuracy of data obtained by SATA in comparison with the digested clot method.
In addition to the fairly high quantitative and accuracy capacity, the SATA assay offers some other advantages as well. First, the clot formation in this assay is completed within several minutes, while in the other methods this step is somewhat time-consuming (4-24 hours).23,26,27 Second, the clot formation is literally completed without any residue, and the volume of the formed clot is predictable and manageable. Third, the SATA method incorporates citrated blood, which could be refrigerated for later use, while most of the other methods require fresh blood with its immediate natural clotting capacity.26,28 Overall, the experiment could be started and terminated at most in several hours. Based on these findings, the SATA assay appears to be an economical method that can be executed using inexpensive reagents and small amounts of the thrombolytic agent in low concentrations.
Further, the SATA assay could discriminate very low concentrations of active tPA (<10 μg/mL), while the occluded tube model could differentiate the concentrations higher than 50 μg/mL. However, as a model simulating the in vivo vascular obstruction and recanalization, the occluded tube model reserves the value of farther translational interpretation of in vitro thrombolytic activities to clinical outcomes in thrombolytic therapies of MI or ischemic stroke. Ultimately, the measurement of tPA activity by ELISA was actually performed as the gold standard. ELISA method is extremely accurate and could discriminate active tPA concentrations as low as 0.01 ng/mL. As instructed by the manufacturer of the ELISA kit, the standard concentrations were prepared according to IU/mL of tPA (i.e., 0-1 IU/mL equal to 0-1.77 ng/mL). Despite this high accuracy, there is no doubt that ELSA, especially for this purpose, possesses many limitations, including significant time consumption, high cost, complexity while many facilities are needed. Moreover, this method directly assesses the concentration of active enzymes and not an ultimate output of thrombolysis.
Historically, fibrinolysis was discovered through many observations including the fact that blood collected by wet-cupping (several milliliters) might be clotted and then spontaneously dissolved in 12-24 hours.36 Whole blood certainly possesses potency of lysing clot per se, and this potency originates from the natural blood thrombolytic agents. Thus, it is not of surprise that the control samples with zero concentration of active tPA exhibit clot lysis to some extents in all methods developed for thrombolytic activity measurement, including the developed SATA assay and the digested clot method. However, it is of wonder that, to the best of our knowledge, in the previously described methods spontaneous thrombolysis in control sample was rarely mentioned.
Comparison of SATA with other methods developed previously is summarized in Table 2 and Table 3.
| Table 2. Various methods for measurement of thrombolytic activity, advantages and disadvantages, a qualitative comparison |
|
Method
|
Cost
|
Time consumption
|
Complexity
|
Accuracy
|
Ref
|
| SATA assay |
Low |
Low |
Low |
High |
Cuurent study |
| Percent of digested clot |
Low |
High |
Low |
Medium |
26
|
| Occlusive tube model |
Medium |
Medium |
Medium |
Low |
21,22
|
| RBC release from tiny clots |
Low |
High |
Low |
Medium |
28
|
| D-Dimer assessment |
High |
Unknown |
Medium |
Very high |
23
|
| Heparin modulated clot lytic activity |
Medium |
High |
High |
Unknown |
16
|
| ELISA |
High |
High |
High |
Very high |
Oxford Biomedical Research |
| Table 3. Various methods for measurement of thrombolytic activity in terms of time-effectiveness and accuracy, a quantitative comparison |
|
Method
|
Time consumption (h)
|
LOD, LOQ
respectively
|
Ref
|
| SATA assay |
Precise: 3-4
Bedside estimate: <1 |
0.90, 2.99 µg/mL tPA (436.50, 1450.15IU) |
Current study |
| Percent of digested clot |
Previously reported: ~ 6
Modified in this study: 2-3 |
Previously not reported
In this study: 25.02, 83.42 µg/mL tPA (12134.70, 40458.70 IU) |
26
|
| Occluded tube model |
Previously not reported
In this study 4-8 |
Previously not reported
In this study > 50 µg/mL tPA (24250 IU) |
21,22
|
| RBC release from tiny clots |
> 24 |
Not reported |
28
|
| D-Dimer assessment |
> 6 |
103.5, 345 IU (calculated by the reported data) |
16
|
| ELISA |
6-7 |
Reported 0.006 IU (0-1.77 ng/mL tPA)
In this study: 0.008, 0.027 IU |
Oxford Biomedical Research |
| Abbreviations: LOD, limit of detection; LOQ, limit of quantification. |
The SATA assay is a simple approach that can be performed for clarifying the tPA activity prior to clinical administration (bedside) in thrombolytic therapies of MI or ischemic stroke, by simple instruments and visualization of the difference of red color in dilutions even though with some degree of lower accuracy. However, such utility of the SATA assay in a clinical setting is just for further confirmation of thrombolytic activity of a drug with a rough estimation. Nevertheless, the SATA assay, if performed in hospital laboratories equipped with spectrophotometry, can provide a quite accurate thrombolytic activity value of clinically used drugs.
Conclusion
The established SATA assay is a simple and cost-effective method with high precision and accuracy that can be conducted quantitatively and fast for in vitro measurement of thrombolytic agents’ activity. This method is able to discriminate less than 10 µg/mL of active tPA (4850 IUs), which is thousands of times less than the clinical dose of tPA. The method could be used for comparing the thrombolytic activities of thrombolytic agents and measurement of the potency of unknown thrombolytic agents with some degree of high accuracy for investigations and clinical assessments.
Competing interests
None to be declared.
Ethical approval
The study was conducted as approved by the Ethics Committee of Tabriz University of Medical Sciences, and an informed consent was obtained from volunteers.
Acknowledgment
This study was a part of the Ph.D. thesis (grant No: 92-103-2), Tabriz University of Medical Sciences and supported by Neurosciences Research Center and Research Center for Pharmaceutical Nanotechnology at Tabriz University of Medical Sciences, Tabriz, Iran. We wish to sincerely thank the colleagues who donated their blood for this study.
References
- Donnan GA, Fisher M, Macleod M, Davis SM. Stroke. Lancet 2008;371:1612-23. doi: 10.1016/s0140-6736(08)60694-7. [Crossref]
- Verstraete M, Bernard R, Bory M, Brower RW, Collen D, de Bono DP, et al. Randomised trial of intravenous recombinant tissue-type plasminogen activator versus intravenous streptokinase in acute myocardial infarction. Report from the European Cooperative Study Group for Recombinant Tissue-type Plasminogen Activator. Lancet 1985;1:842-7. doi: 10.1016/S0140-6736(85)92208-1. [Crossref]
- Wardlaw JM, Murray V, Berge E, del Zoppo G, Sandercock P, Lindley RL, et al. Recombinant tissue plasminogen activator for acute ischaemic stroke:an updated systematic review and meta-analysis. Lancet 2012;379:2364-72. doi: 10.1016/s0140-6736(12)60738-7. [Crossref]
- Collen D, Bounameaux H. Coronary thrombolysis with clot-selective plasminogen activators. Herz 1986;11:9-15.
- Collen D, Gold HK. New developments in thrombolytic therapy. Adv Exp Med Biol 1990;281:333-54. doi: 10.1016/0049-3848(90)90384-O. [Crossref]
- Collen D, Lijnen HR. The tissue-type plasminogen activator story. Arterioscler Thromb Vasc Biol 2009;29:1151-5. doi: 10.1161/ATVBAHA.108.179655. [Crossref]
- Kunadian V, Gibson CM. Thrombolytics and myocardial infarction. Cardiovasc Ther 2012;30:e81-e8. doi: 10.1111/j.1755-5922.2010.00239.x. [Crossref]
- Sherry S. The origin of thrombolytic therapy. J Am Coll Cardiol 1989;14:1085-92. doi: 10.1016/0735-1097(89)90493-2. [Crossref]
- Sherry S, Tillett W, Read CT. The use of streptokinase-streptodornase in the treatment of hemothorax. J Thorac Surg 1950;20:393.
- Greineder CF, Howard MD, Carnemolla R, Cines DB, Muzykantov VR. Advanced drug delivery systems for antithrombotic agents. Blood 2013;122:1565-75. doi: 10.1182/blood-2013-03-453498. [Crossref]
- Kumar A, Pulicherla K, Ram KS, Rao K. Evolutionary trend of thrombolytics. International Journal of Bio-Science and Bio-Technology 2010;2:51-68.
- Hunter J. A treatise on the blood, inflammation, and gun-shot wounds. In: Palmer J, Ed. The Works of John Hunter, F.R.S.: With Notes (Cambridge Library Collection - History of Medicine, pp. Vii-Viii). Cambridge: Cambridge University Press; 2015. doi: 10.1017/CBO9781316034828.002. [Crossref]
- Buckell M. The effect of citrate on euglobulin methods of estimating fibrinolytic activity. J Clin Pathol 1958;11:403-5.
- Kowalski E, Kopeć M, Niewiarowski S. An evaluation of the euglobulin method for the determination of fibrinolysis. J Clin Pathol 1959;12:215.
- Smith AA, Jacobson LJ, Miller BI, Hathaway WE, Manco-Johnson MJ. A new euglobulin clot lysis assay for global fibrinolysis. Thromb Res 2003;112:329-37. doi: 10.1016/j.thromres.2004.01.001. [Crossref]
- Elnager A, Abdullah WZ, Hassan R, Idris Z, Wan Arfah N, Sulaiman S, et al. In vitro whole blood clot lysis for fibrinolytic activity study using D-dimer and confocal microscopy. Adv Hematol 2014;2014: 814684. doi: 10.1155/2014/814684. [Crossref]
- Astrup T, Müllertz S. The fibrin plate method for estimating fibrinolytic activity. Arch Biochem Biophys 1952;40:346-51. doi: 10.1016/0003-9861(52)90121-5. [Crossref]
- Walton P. An improved fibrin plate method for the assay of plasminogen activators. Clinica Chimica Acta 1966;13:680-4. doi: 10.1016/0009-8981(66)90177-X. [Crossref]
- Wang M, Yang W, Wu Q, Gu H. Modeling of the fibrin agarose plate assay and its application for thrombolytic analysis. Chin Sci Bull 2012;57:3233-8. doi: 10.1007/s11434-012-5297-6. [Crossref]
- Wang M, Zhang J, Yuan Z, Yang W, Wu Q, Gu H. Targeted thrombolysis by using of magnetic mesoporous silica nanoparticles. J Biomed Nanotechnol 2012;8:624-32. doi: 10.1166/jbn.2012.1416. [Crossref]
- Chung TW, Wang SS, Tsai WJ. Accelerating thrombolysis with chitosan-coated plasminogen activators encapsulated in poly-(lactide-co-glycolide) (PLGA) nanoparticles. Biomaterials 2008;29:228-37. doi: 10.1016/j.biomaterials.2007.09.027. [Crossref]
- Wang SS, Chou NK, Chung TW. The t-PA-encapsulated PLGA nanoparticles shelled with CS or CS-GRGD alter both permeation through and dissolving patterns of blood clots compared with t-PA solution:an in vitro thrombolysis study. J Biomed Mater Res A 2009;91:753-61. doi: 10.1002/jbm.a.32234. [Crossref]
- Absar S, Choi S, Ahsan F, Cobos E, Yang VC, Kwon YM. Preparation and characterization of anionic oligopeptide-modified tissue plasminogen activator for triggered delivery:an approach for localized thrombolysis. Thromb Res 2013;131:e91-9. doi: 10.1016/j.thromres.2012.11.030. [Crossref]
- Chen JP, Yang PC, Ma YH, Tu SJ, Lu YJ. Targeted delivery of tissue plasminogen activator by binding to silica-coated magnetic nanoparticle. Int J Nanomedicine. 2012;7:5137-49. doi: 10.2147/ijn.s36197. [Crossref]
- Chen J-P, Yang P-C, Ma Y-H, Wu T. Characterization of chitosan magnetic nanoparticles for in situ delivery of tissue plasminogen activator. Carbohydr Polym 2011;84:364-72. doi: 10.1016/j.carbpol.2010.11.052. [Crossref]
- Prasad S, Kashyap RS, Deopujari JY, Purohit HJ, Taori GM, Daginawala HF. Development of an in vitro model to study clot lysis activity of thrombolytic drugs. Thromb J 2006;4:1-4. doi: 10.1186/1477-9560-4-14. [Crossref]
- Shaw GJ, Meunier JM, Huang S-L, Lindsell CJ, McPherson DD, Holland CK. Ultrasound-enhanced thrombolysis with tPA-loaded echogenic liposomes. Thromb Res 2009;124:306-10. doi: 10.1016/j.thromres.2009.01.008. [Crossref]
- Yang HW, Hua MY, Lin KJ, Wey SP, Tsai RY, Wu SY, et al. Bioconjugation of recombinant tissue plasminogen activator to magnetic nanocarriers for targeted thrombolysis. Int J Nanomedicine 2012;7:5159-73. doi: 10.2147/ijn.s32939. [Crossref]
- Alkatheri A. Stability of Recombinant Tissue Plasminogen Activator at -30 degrees C over One Year. Pharmaceuticals (Basel) 2013;6:25-31. doi: 10.3390/ph6010025. [Crossref]
- Jaffe GJ, Green GD, Abrams GW. Stability of recombinant tissue plasminogen activator. Am J Ophthalmol 1989;108:90-1. doi: 10.3390/ph6010025. [Crossref]
- Shaw GJ, Sperling M, Meunier JM. Long-term stability of recombinant tissue plasminogen activator at -80 C. BMC Res Notes 2009;2:117. doi: 10.1186/1756-0500-2-117. [Crossref]
- Wiernikowski JT, Crowther M, Clase CM, Ingram A, Andrew M, Chan AK. Stability and sterility of recombinant tissue plasminogen activator at -30 degrees C. Lancet 2000;355:2221-2. doi: 10.1016/s0140-6736(00)02411-9. [Crossref]
- Shrivastava A, Gupta V. Methods for the determination of limit of detection and limit of quantitation of the analytical methods. Chronicles of Young Scientists 2011;2:21-5. doi: 10.4103/2229-5186.79345. [Crossref]
- Mahmoodi M, Khosroshahi M, Atyabi F. Early experimental results of thrombolysis using controlled release of tissue plasminogen activator encapsulated by PLGA/CS nanoparticles delivered by pulse 532 nm laser. Digest Journal of Nanomaterials & Biostructures (DJNB) 2011;6.
- Christodoulides M, Boucher D. The potency of tissue-type plasminogen activator (TPA) determined with chromogen and clot-lysis assays. Biologicals 1990;18:103-11. doi: 10.1016/1045-1056(90)90019-V. [Crossref]
- Kwaan HC, editor. From fibrinolysis to the plasminogen–plasmin system and beyond: a remarkable growth of knowledge, with personal observations on the history of fibrinolysis. Semin Thromb Hemost 2014; 40: 585-591. doi: 10.1055/s-0034-1383545. [Crossref]