Bioimpacts. 13(1):43-50. doi: 10.34172/bi.2022.22183Original Article
Type 2 diabetes mellitus induced autophagic response within pulmonary tissue in the rat model
Mohammad Ghader Bayazidi 1, Reza Rahbarghazi 2, 3 , Aysa Rezabakhsh 4, Jafar Rezaie 5, Mehdi Hassanpour 2, Mahdi Ahmadi 2, 1, *
1Department of Physiology, Faculty of Medicine, Tabriz University of Medical Sciences, Tabriz, Iran
2Stem Cell Research Center, Tabriz University of Medical Sciences, Tabriz, Iran
3Department of Applied Cell Sciences, Faculty of Advanced Medical Sciences, Tabriz University of Medical Sciences, Tabriz, Iran
4Cardiovascular Research Center, Tabriz University of Medical Sciences, Tabriz, Iran
5Solid Tumor Research Center, Research Institute for Cellular and Molecular Medicine, Urmia University of Medical Sciences, Urmia, Iran
*Corresponding author: Mahdi Ahmadi, Email: mahdi59866@gmail.com
Abstract
Introduction:
The current experiment aimed to address the impact of type 2 diabetes mellitus on autophagy status in the rat pulmonary tissue.
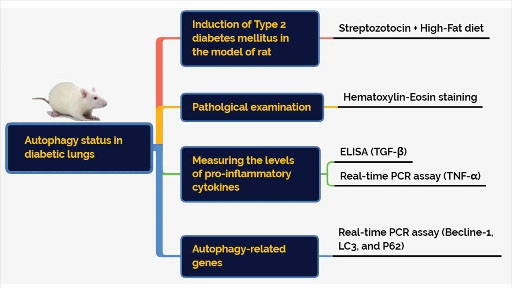
Methods: In this study, 20 male Wistar rats were randomly allocated into two groups as follows: control and diabetic groups. To induce type 2 diabetes mellitus, rats received a combination of streptozotocin (STZ) and a high-fat diet. After confirmation of diabetic condition, rats were maintained for 8 weeks and euthanized for further analyses. The pathological changes were assessed using H&E staining. We also measured transforming growth factor-β (TGF-β), bronchoalveolar lavage fluid (BALF), and tumor necrosis factor-α (TNF-α) in the lungs using ELISA and real-time PCR analyses, respectively. Malondialdehyde (MDA) and superoxide dismutase (SOD) levels were monitored in diabetic lungs to assess oxidative status. We also measured the expression of becline-1, LC3, and P62 to show autophagic response under diabetic conditions. Using immunofluorescence staining, protein levels of LC3 was also monitored.
Results: H&E staining showed pathological changes in diabetic rats coincided with the increase of TNF-α (~1.4-fold) and TGF-β (~1.3-fold) compared to those in the normal rats (P<0.05). The levels of MDA (5.6 ± 0.4 versus 6.4 ± 0.27 nM/mg protein) were increased while SOD (4.2 ± 0.28 versus 3.8 ± 0.13 U/mL) activity decreased in the diabetic rats (P<0.05). Real-time polymerase chain reaction (PCR) analysis showed the up-regulation of Becline-1 (~1.35-fold) and LC3 (~2-fold) and down-regulation of P62 (~0.8-fold) (P<0.05), showing incomplete autophagic flux. We noted the increase of LC3+ cells in diabetic condition compared to that in the control samples.
Conclusion: The prolonged diabetic condition could inhibit the normal activity of autophagy flux, thereby increasing pathological outcomes.
Keywords: Autophagy, Inflammation, Pulmonary tissue, Type 2 diabetes mellitus
Copyright
© 2023 The Author(s).
This work is published by BioImpacts as an open access article distributed under the terms of the Creative Commons Attribution Non-Commercial License (
http://creativecommons.org/licenses/by-nc/4.0/). Non-commercial uses of the work are permitted, provided the original work is properly cited.
Introduction
The term type 2 diabetes (T2D) is generally devoted to a devastating chronic metabolic disease with high levels of systemic glucose, accounting for 90% to 95% of all diagnosed diabetes cases with a heavy socio-economical burden.1 Irrespective of clinical outcomes, it is well established that impaired beta-cell function and deterioration of insulin action in the target cells lead to uncontrolled hyperglycemia and the onset of metabolic disorders in multiple tissues.2,3 Up to the present time, the main body of previous experiments has focused on the discovery of T2D effects on cardiovascular tissues, retina vessels, brain, liver, and testicular tissue.4-7 Unfortunately, common belief ignores the lung tissue as a possible specific organ for diabetes. Due to the existence of great vascularization, and abundant collagen and elastin fibers, it is mighty to propose the lungs as a good candidate for the same histological and physiologic disturbances.3,8 The importance of this issue becomes even greater when some clinical and experimental data showed reduced pulmonary function and histological changes in diabetic patients. For example, prominent fibrosis, collagen deposition, basement membrane thickening, decreased alveolar space, emphysema, and microangiopathy have been reported in type 1 and 2 diabetic subjects. Despite these data, the precise underlying mechanisms contributing to pulmonary dysfunction remain largely ambiguous. However, pieces of evidence implicated that several signaling pathways participate in the promotion of diabetes-related injuries after induction of hyperglycemia. For example, mitochondrial dysfunction, accumulation of reactive oxygen species, non-enzymatic protein glycosylation, activation of the polyol pathway, and NF-κB signaling pathways, as well as protein kinase C play a key role in the etiopathogenesis of the diabetic lungs.9,10 Some experiments showed the cytotoxicity in pulmonary cells under diabetic conditions driven by apoptotic and necrotic changes.11 Among these mechanisms leading to cell injury, the role of autophagy has not been carefully addressed in the pulmonary tissue of diabetic patients. Autophagy is a highly conserved intracellular mechanism that participates in the turnover and recycling of worn-out cellular constituents as well as the maintenance of cellular homeostasisin normal and pathological conditions.12,13 Autophagy axis consists of different signaling transduction pathways which have cross-talk with other effectors. For example, it has been elucidated that mTOR is a central factor to the autophagy progression. The inhibition of these factors happens in response to different factors that affect the phosphorylation of AMPK. In line with changes, the inhibition of mTOR could trigger the activity of different ATGs with the ability to pack the injured organelles, biomolecules into autophagolysosomes which in turn excrete to the outside the cells (). It has been elucidated that diabetic condition could result in diverse basal activity of autophagy signaling in different organs.14 For example, autophagy is activated in hepatic tissues while simultaneously inhabited in kidneys of streptozotocin (STZ)-induced diabetic rats.15,16 The different activity of autophagy in multiple cells may correlate with the sensitivity and resistance of each cell to injury. Even though some experiments showed different autophagic responses are induced by T1D and T2D on cardiomyocytes.14 Regarding the potency of diabetic conditions in the induction of different autophagic responses in various tissues, we, hereby, aimed to address the impact of the prolonged diabetic condition on the autophagic response in pulmonary tissue and its correlation with oxidative status and pro-inflammatory cytokines in the experimental animal model of T2D.
Fig. 1.
Illustration of the simplified autophagy pathway.
Methods and Materials
Chemicals and Materials
The materials and chemicals were purchased from different companies as follows; STZ (Sigma Aldrich; Steinheim; Germany), transforming growth factor-β (TGF-β) ELISA kits (Sigma-Aldrich; St. Louis; MO; USA), SYBR Green Master Mix (Yekta Tajhiz company, Tehran, Iran), RNA extraction and cDNA synthesis kits (Yekta Tajhiz company, Tehran, Iran); OCT compound (Scigen; Melbourne; Australia); DAPI (Sigma-Aldrich; St. Louis; MO; USA); FITIC-conjugated goat anti-rabbit secondary antibody (Cat no: ab6717; Abcam; Cambridge; UK); rabbit anti-LC3 antibody (Cell Signaling; Danvers; MA; USA); OCT compound (Scigen; Melbourne; Australia); superoxide dismutase (SOD) (Randox Laboratories; UK); and malondialdehyde (MDA) (Merck; Germany). Primers were purchased from Takapouzist Company (Tehran; Iran).
Experimental design
Twenty male Wistar rats (8–10 weeks old, initially weighing 190–210 g) were subjected to the current experiment. After a two-week inhabitation period, rats were equally divided into two experimental groups (10 rats in each group) as follows: I: control group: healthy rats received standard food and water, and II: diabetic group: diabetic rats received high-fat diets (HFD) and a low dose of STZ.
HFD/STZ rat model of type 2 diabetes mellitus
T2D was induced using a combination of HFD (32% fat, 48% carbohydrate, and 20% protein) and a low dose of STZ. Shortly, 4 weeks after dietary manipulation, 35 mg/kg STZ was injected intraperitoneally.17 One week after STZ injection, blood samples were obtained from the tail vein after overnight fasting, and glucose levels were measured using a digital glucometer (Norditalia Elettromedicali S.r.I., Italy). Rats serum glucose levels over 150 mg/dL were considered as diabetic animals.18 In the diabetic group, HFD was continued for the next two mounts.18 Serum levels of fasting glucose were measured every 2 weeks. Thereafter, all animals were sacrificed (8 weeks after T2D confirmation (for molecular and histological assessmentof lung tissue. Serum levels of fasting glucose were measured every 2 weeks. Eight weeks after T2D confirmation, all animals were humanely sacrificed for molecular analyses and histological examination.
Bronchoalveolar lavage fluid (BALF) sampling
At the end of the study period, all animals were anesthetized intraperitoneally with a ketamine (75 mg/kg) and xylazine (3 mg/kg) solution.19,20 By using the surgical approach, the trachea was exposed and BALF was immediately collected by 3 consecutive 2-mL instillations of normal saline (total volume 6 mL) using a catheter connected previously to each trachea. Samples were centrifuged at 2500 g for 4°C at 10 minutes and supernatants were used to analyze MDA and TGF-β levels in each group.21
Determination of MDA and SOD in BALF
To monitor the effect of T2D on oxidative stress in lung tissue, we measured the level of MDA and SOD activities in BALF.22
MDA measurement
The levels of MDA were measured using the TBARS method as previously described.23 To this end, different dilutions of MDA were prepared for the comparison of MDA samples with a standard curve. The BALF samples were centrifuged at 2500 g for 5 minutes. About 500 µL of BALFs were mixed with 2-3 mL of 1% phosphoric acid. The samples were vortexed roughly. In the next step, 2 mL of 0.67% 2-thiobarbituric acid was added to each solution and maintained at 100°C for 40 minutes. Then, the samples were chilled and 3 mL N-butanol was added. We centrifuged the samples at 2500 g for 5 minutes to yield a clear supernatant solution. The OD of supernatants was read at 532 nm and values were calculated according to the standard levels. MDA levels were expressed as nM per gram of sample protein.
SOD measurement
For the measurement of SOD activity, we used Ransod colorimetric assay with standard solutions for the evaluation of SOD. For this purpose, BALFs were centrifuged at 2500 g for 5 minutes to exclude cell content and debris. In Ransol colorimetric assay, tetrazolium salt is used for the detection of total superoxide radicals generated by xanthine oxidase and hypoxanthine. The activity of total SOD was determinedby astandard curveandexpressedasU/mLreagent.
Measurement of TGF-β level in BALF by ELISA method
TGF-β level was measured in BALF using rat ELISA kits according to the manufacturer’s instructions.
Real-time polymerase chain reaction analysis
The transcription levels of TNF-α, Beclin-1, LC3, and p62were determined by quantitative real-time polymerase chain reaction (PCR) assay.19,24 In brief, to run gene expression analysis, a part of left lung tissue from rats was detached and frozen immediately in liquid nitrogen fortotal RNA isolation using YTA total RNA extraction kit according to the kit manufacturer’s instructions. The purity of RNA samples was detected by a Nanodrop spectrophotometer (NanoDrop-1000, Thermo Scientific, Wilmington DE 19810 USA). RNAs were reverse-transcribed into cDNA using the cDNA Synthesis kit. Quantitative real-time PCR was done using the SYBR Green Master Mix and Rotor-Gene 6000 apparatus (Corbett Life Science, Australia). The expression level of each target gene was normalized to control housekeeping gene β-actin and the relative fold changes were achieved using the 2-∆∆CT method. Primers were designed by Oligo 7 software (version 7.60) and outlined in Table 1.
Table 1.
The list of primers used for real-time PCR analysis
|
Gene
|
Primer sequence (5'-3')
|
Accession No.
|
|
Forward
|
Reverse
|
| TNF-α | GACCCTCACACTCAGATCATCTTCT | TGCTACGACGTGGGCTACG | NM_012675.3 |
| P62 | GGAAGCTGAAACATGGGCAC | CAAACACCAGCCTTACCCGA | NM_181550.1 |
| LC3 | CATGCCGTCCGAGAAGACCT | GATGAGCCGGACATCTTCCACT | NM_022867.2 |
| Beclin-1 | TTGGCCAATAAGATGGGTCTGAA | TGTCAGGGACTCCAGATACGAGTG | NM_001034117.1 |
| β-actin | CTAAGGCCAACCGTGAAAAG | TACATGGCTGGGGTGTTGA | NM_031144.3 |
Histological evaluation
To explore the pathological effect of T2D on the pulmonary niche, the right lung of each rat was sampled and fixed in neutral buffered formalin (10% w/v). Thereafter, samples were embedded in paraffin blocks and cut into 4-µm thick sections using Leica microtome. Slides were stained with hematoxylin and eosin (H&E) solution and finally visualized under a light microscopy (Model: BX41; Olympus; Japan) as described previously.20 The existence of tissue damage such as mild interstitial pneumonitis and bronchiolar epithelium degeneration was investigated by an expert pathologist.
Immunofluorescence (IF) staining
To monitor the existence of autophagic protein in the pulmonary tissue, we performed IF staining. In brief, the samples were embedded in OCT compound and 5-μm thick slides. After a three-time PBS wash, the tissues were exposed to 1% FBS for 30 minutes and incubated with a rabbit anti-LC3 antibody according to the manufacturer's instructions. Then, the slides were washed twice with PBS and incubated with FITIC-conjugated goat anti-rabbit secondary antibody for 1 hour at room temperature. Finally, slides were incubated with 1 μg/mL DAPI solution for nuclear staining.
Data analysis
All quantitative results were analyzed using a student t-test and presented as mean ± SEM. P< 0.05 was accepted as a significance level between the groups.
Results
Fasting serum glucose concentrations confirmed diabetic changes
We measured FBS levels one week after STZ injection and every 2 weeks to confirm diabetic changes. Based on our data, FBS levels were increased in diabetic rats compared to the control group (). We recorded FBS values closed 400 mg/dL in diabetic rats. The pattern of FBS levels approved the efficiency of our protocol in the induction of T2D in the rat model.
Fig. 2.
FBS levels in control and diabetic groups during the experiment (n = 10). Bars represent the mean ± SEM
MDA levels and SOD activity were changed in BALF of the T2D group
Levels of MDA and SOD activity in BALF showed the drastic difference in diabetic rats in comparison with the control rats. In detail, levels of MDA increased significantly (P= 0.043), whereas SOD activity diminished simultaneously (P= 0.043 and 0.036 respectively; ). Our data could reflect the induction of oxidative stress coincided with the suppression of antioxidant enzymes in diabetic lung tissues.
Fig. 3.
MDA levels (a) and SOD activities (b) in BALF of control and diabetic groups (n = 10). Bars represent the mean ± SEM. Statistical differences between control and diabetic group: +P<0.05.
T2D condition increased the BALF level of TGF-β1
ELISA showed that the BALF level of TGF-β1 was drastically different in the diabetic group in comparison with the control rats (P=0.029; ).
Fig. 4.
MTGF-β1 levels in BALF of control and diabetic rats (n = 10). Bars represent the mean ± SEM. Statistical differences between control and diabetic groups: +P<0.05.
T2D condition increased the expression level of TNF-α in lung tissue
The expression levels of TNF-α in the diabetic lungs were significantly higher than that in healthy lungs (P=0.041; ). The increase of TNF-α in diabetic conditions confirmed the occurrence of a pro-inflammatory condition compared to the normal status. These data showed that hyperglycemic condition induces inflammation by increasing the cytokines such as TNF-α.
Fig. 5.
Measuring the transcription of TNFα (a), Beclin-1(b) LC3(c), and p62 (d) mRNA in the lung tissues of control and diabetic rats (n = 10). Bars represent the mean ± SEM. Statistical differences between control and diabetic group: +P<0.05 and +++ P<0.001.
Expression of autophagy-related genes was changed in lung tissues of the T2D group
The expression levels of Beclin-1, LC3, and p62 showed a drastic difference in the diabetic group in comparison with the control rats. In detail, levels of Beclin-1 and LC3 increased significantly (P=0.034 and 0.0001 respectively; ), whereas p62 diminished simultaneously (P=0.038; ). These data showed that the autophagic response is induced under hyperglycemic conditions within the pulmonary tissue. However, it is noteworthy to say that the induction of autophagy effectors did not fulfill the exocytosis procedure due to the concurrent decrease of P62. These data showed that the hyperglycemic condition promotes an aberrant autophagic response inside the pulmonary niche.
Pulmonary pathological changes were achieved in the presence of a prolonged diabetic condition
Bright-field microscopic imaging revealed a mild interstitial pneumonitis, bronchiolar epithelium degeneration, and emphysematous appearance in the lungs of diabetic rats compared to the control group. The pattern of chronic pathological changes in diabetic rats confirmed the pathological effect of T2D on a pulmonary niche ().
Fig. 6.
Bright-field images from pulmonary sections stained with H&E solution. Diabetic lungs are evident with mild interstitial pneumonitis (black arrows) and bronchiolar epithelium degeneration (red arrows) and massive emphysematous appearance (green arrows). These data show chronic structural changes in diabetic rats.
Diabetic condition increased the intracellular levels of LC3
According to our data, IF staining showed that the promotion of diabetic conditions in the rat model increased the intracellular levels of LC3 compared to the non-treated control rats (). The positive cells exhibited an intracellular green cytoplasmic appearance while the intensity and amount of green color were less in the control group (). These data showed that the promotion of a hyperglycemic condition could increase the intracellular level of LC3 in the pulmonary cells.
Fig. 7.
Immunofluorescence imaging of LC3 in diabetic lungs. Data showed that diabetic conditions promoted the synthesis and accumulation of intracellular LC3 indicated by double green-blue cells (White arrows). The number of LC3-positive cells was increased in diabetic lungs compared to the normal condition.
Discussion
Both clinical observation and animal model studies revealed the existence of pulmonary dysfunction in hyperglycemic conditions.3,25 More than a decade, studies have suggested that different signaling pathways, such as autophagy, are involved in the pathogenesis of different diseases.26 Despite pathological outcomes, the critical role of autophagy has not been addressed carefully in the context of pulmonary tissues under diabetic conditions. In this regard, there are conflicting results on the impact of autophagy on diabetic tissues. For example, some experiments have highlighted diminished autophagy while other studies have shown an increased autophagic response in the diabetic heart tissue.27 The present study was designed to determine the effect of T2D on autophagy status in the lung tissue of the experimental rat model. Based on the data from the current experiment, our protocol was successful in the induction of T2D indicated by elevated serum glucose concentrations by the combination of STZ and HFD regime. We further noted the promotion of pathological changes in the pulmonary tissues of diabetic rats compared to the control healthy group. These data demonstrated that STZ injection to HFD-fed animals could promote the injury of the lungs after 8 weeks. Due to the chronic entity of T2D in human, one could propose that a similar condition would happen in the pulmonary tissue.
Based on previous data, it has been shown that different factors could promote certain tissue injury under diabetic conditions.25 In this regard, we proved the induction of oxidative stress and the reduction of antioxidant capacity in the BALF of diabetic animals. Therefore, it is logical to say that the increase of reactive oxygen species and deficiency of scavenger activity like SOD exacerbate T2D-related pathologies.28 Along with these changes, the accumulation of lipid byproducts such as MDA potentiates the harmful activity of reactive oxygen species.29-32 The inflammation process is one of the hallmarks of T2D pathogenesis, resulting in diabetic complications.33 Another important finding in this study was the production of TNF-α and TGF-β1, indicating the activation of acute-phase proteins and inflammatory response in diabetic lung tissues.34 Some previous experiments have shown that inflammatory mediators,notably TNF-α and TGF-β1, could activate autophagic response vice versa, showing a close relationship between inflammation and autophagy.35,36
According to our findings, the expression of autophagy modulators such as Beclin-1 and LC3 was up-regulated while the transcription of P62, as a scaffold protein, down-regulated under diabetic conditions. Data from IF staining confirmed the intracellular levels of LC3 upon the initiation of the diabetic condition in the rat model. These data showed the induction of early-stage autophagic response while the promotion of diabetic condition inhibited the termination of autophagic flux in the pulmonary tissue. The reduction of P62 expression showed that stimulation of autophagy in diabetic lung cells could not release damaged cargoes to the outside of cells. A large body of evidence has shown that autophagic flux was dysregulated in diabetic conditions.37 These data showed that the hyperglycemic condition promotes an aberrant autophagic response inside the pulmonary niche. In support of our data, Munasinghe et alvalidated that autophagy response was up-regulated in cardiac tissue under T2D condition, but the activation of autophagy could not per se diminish the occurrence of T2D-associated pathology.27 They also noted the expression of Beclin-1 and LC3 and suppression of P62. Therefore, the decrease of P62 expression aborts the active machinery of autophagic response despite early-step autophagy modulators stimulation. In a better word, the activation of autophagy signaling without efficient flux contributes to the accumulation of injured organelles inside the diabetic cells. These features intensify the extent of diabetic injury in the pulmonary tissues.27 Fetterman et alreported that inadequate autophagy as a result of diabetic status contributes to the endothelial dysfunction in patients with T2D.38 To be specific, autophagy exploits some common pathways along with other excretory mechanisms such as exosomes, vacuoles to release and efflux the exhausted byproducts.39 Therefore, it is logical to hypothesize that the disorder of the secretory pathway could affect different excretory mechanisms. For example, it was reported that the treatment of stem cells with diabetic sera decreased exosomes biogenesis and excretion capacity.40,41 Regardless of the activation of the cellular defense mechanism such as autophagy signaling under pathological condition, disruption or deficiency in the subsequent steps could intensify the degree of injury.
There are some limitations related to the current experiment. Here, we did not measure the protein levels of autophagy modulators and suggest that future studies must evaluate the protein levels of autophagy effectors in pulmonary tissue under diabetic conditions.
Conclusion
These data show that the induction of T2D induces the autophagic response and inflammation within the pulmonary tissue. It seems that prolonged diabetic conditions could inhibit the normal function of autophagy which exacerbates the pathological outcomes.
Research Highlights
What is the current knowledge?
√ D2M induced different pathologies in the multiple organs.
√ Pulmonary tissue injury has been proved during diabetic change.
√ The main mechanism of injury has not been shown in the pulmonary tissue after the onset of D2M.
What is new here?
√ The promotion of oxidative stress and cytokines production contribute to the autophagic response.
√ D2M induced abnormal autophagic response within diabetic lungs.
Acknowledgments
Authors wish to thank the personnel of Stem Cell Research Center of Tabriz University of medical sciences for guidance and help.
Author's contribution
MGB and MH induced type 2 diabetes mellitus in the rat model. RR, AR, JR performed different assays. MA supervised the study.
Funding sources
This study was approved and supported by a grant from the Stem Cell Research Center of Tabriz University of medical sciences (No: IR.TBZMED.VCR.REC.1398.243).
Ethical statement
Ethics approval for the study was acquired from the Research Ethics Committee of Tabriz University of Medical Sciences (No: IR.TBZMED.VCR.REC.1398.243). All animal care and surgical procedures were conducted following guidelines suggested for the Care and Use of Laboratory Animals (NIH Publication No. 85- 23, revised 1996).
Competing interests
Authors declared no conflict of interests.
References
- Epidemiology of diabetes and diabetes-related complications. PhyTher 2008; 88:1254-64. doi: 10.2522/ptj.20080020 [Crossref]
- Novel directions for diabetes mellitus drug discovery. Expert Opin Drug Discov 2013; 8:35-48. doi: 10.1517/17460441.2013.736485 [Crossref]
- Pulmonary function and sleep breathing: two new targets for type 2 diabetes care. Endocr Rev 2017; 38:550-73. doi: 10.1210/er.2017-00173 [Crossref]
- The effect of 2-month bromocriptine treatment on the activity of the adenylyl cyclase signaling system in the myocardium and testes of rats with type 2 diabetes. Cell Tissue Biol 2015; 9:395-405. doi: 10.1134/S1990519X15050041 [Crossref]
- Diabetic central neuropathy: CNS damage related to hyperglycemia. Diabetes 2016; 65:355-7. doi: 10.2337/dbi15-0034 [Crossref]
- Diabetes and chronic liver disease: Etiology and pitfalls in monitoring. Clin Diabetes 2010; 28:139-44. doi: 10.2337/diaclin.28.4.139 [Crossref]
- Diabetic retinopathy-ocular complications of diabetes mellitus. World J Diabetes 2015; 6:489. doi: 10.4239/wjd.v6.i3.489 [Crossref]
- Type 2 diabetes and the lung: a bidirectional relationship. Endocrinol Nutr 2012; 2:95-7. doi: 10.1016/j.endonu.2011.12.003 [Crossref]
- Therapeutic options targeting oxidative stress, mitochondrial dysfunction and inflammation to hinder the progression of vascular complications of diabetes. Front Physiol 2019; 9:1857. doi: 10.3389/fphys.2018.01857 [Crossref]
- Targeting mitochondrial dysfunction for the treatment of diabetic complications: Pharmacological interventions through natural products. Pharmacogn Rev 2017; 11:128. doi: 10.4103/phrev.phrev_41_16 [Crossref]
- Genistein preserves the lungs of ovariectomized diabetic rats: addition to apoptotic and inflammatory markers in the lung. Iran J Basic Med Sci 2017; 20:1312. doi: 10.22038/IJBMS.2017.9599 [Crossref]
- Is autophagy associated with diabetes mellitus and its complications? A review. EXCLI J 2018; 17:709. doi: 10.17179/excli2018-1353 [Crossref]
- Role of autophagy in atherosclerosis: foe or friend?. J Inflam(Lond) 2019; 16:8. doi: 10.1186/s12950-019-0212-4 [Crossref]
- Suppression of autophagy is protective in high glucose-induced cardiomyocyte injury. Autophagy 2012; 8:577-92. doi: 10.4161/auto.18980 [Crossref]
- Stimulation of autophagy in the liver by lipopolysaccharide-induced systemic inflammation in a rat model of diabetes mellitus. Biomed Res 2010; 31:263-71. doi: 10.2220/biomedres.31.263 [Crossref]
- Inhibition and restimulation by insulin of cellular autophagy in distal tubular cells of the kidney in early diabetic rats. Kidney Blood Press Res 1997; 20:258-63. doi: 10.1159/000174155 [Crossref]
- Swim training improves HOMA-IR in type 2 diabetes induced by high fat diet and low dose of streptozotocin in male rats. Adv Pharm Bull 2015; 5:379. doi: 10.15171/apb.2015.052 [Crossref]
- Effects of long-term nitrate supplementation on carbohydrate metabolism, lipid profiles, oxidative stress, and inflammation in male obese type 2 diabetic rats. Nitric Oxide 2018; 75:27-41. doi: 10.1016/j.niox.2018.02.002 [Crossref]
- Systemic transplantation of mesenchymal stem cells modulates endothelial cell adhesion molecules induced by ovalbumin in rat model of asthma. Inflammation 2018; 41:2236-45. doi: 10.1007/s10753-018-0866-8 [Crossref]
- Bone marrow mesenchymal stem cells and condition media diminish inflammatory adhesion molecules of pulmonary endothelial cells in an ovalbumin-induced asthmatic rat model. Microvasc Res 2019; 121:63-70. doi: 10.1016/j.mvr.2018.10.005 [Crossref]
- Contributory anti-inflammatory effects of mesenchymal stem cells, not conditioned media, on ovalbumin-induced asthmatic changes in male rats. Inflammation 2016; 39:1960-71. doi: 10.1007/s10753-016-0431-2 [Crossref]
- Curcumin ameliorated myocardial infarction by inhibition of cardiotoxicity in the rat model. J Cell Biochem 2019; 120:11965-72. doi: 10.1002/jcb.28480 [Crossref]
- Paraquat Exposure Up-regulates Cyclooxygenase-2 in the Lungs, Liver and Kidneys in Rats. Iran J Pharm Res 2013; 12:887-96. doi: 10.22037/IJPR.2013.1358 [Crossref]
- High glucose condition limited the angiogenic/cardiogenic capacity of murine cardiac progenitor cells in in vitro and in vivo milieu. Cell BiochemFunct 2018; 36:346-56. doi: 10.1002/cbf.3354 [Crossref]
- Diabetes induces fibrotic changes in the lung through the activation of TGF-β signaling pathways. Sci Rep 2018; 8:11920. doi: 10.1038/s41598-018-30449-y [Crossref]
- Type 2 diabetes inhibited human mesenchymal stem cells angiogenic response by over‐activity of the autophagic pathway. J Cell Biochem 2017; 118:1518-30. doi: 10.1002/jcb.25814 [Crossref]
- Type-2 diabetes increases autophagy in the human heart through promotion of Beclin-1 mediated pathway. Int J Cardiol 2016; 202:13-20. doi: 10.1016/j.ijcard.2015.08.111 [Crossref]
- Antioxidant enzymes and lipid peroxidation in type 2 diabetes mellitus patients with and without nephropathy. N Am J Med Sci 2013; 5:213. doi: 10.4103/1947-2714.109193 [Crossref]
- Effect of hydroxychloroquine on antiphospholipid antibody‐induced changes in first trimester trophoblast function. Am J Reprod Immunol 2014; 71:154-64. doi: 10.1111/aji.12184 [Crossref]
- Lamers ML, Almeida ME, Vicente-Manzanares M, Horwitz AF, Santos MF. High glucose-mediated oxidative stress impairs cell migration. PloS One. 2011; 6. 10.1371/journal.pone.0022865.
- Reactive oxygen species, lipid peroxidation and antioxidative defense mechanism. NotulaeBotanicaeHortiAgrobotanici Cluj-Napoca 2013; 41:44-57. doi: 10.15835/nbha4118929 [Crossref]
- Chronic diabetic nephropathy: role of inducible nitric oxide synthase. Pediatr Nephrol 2002; 17:20-9. doi: 10.1007/s004670200004 [Crossref]
- The role of inflammation in diabetes: current concepts and future perspectives. Eur Cardiol 2019; 14:50. doi: 10.15420/ecr.2018.33.1 [Crossref]
- Metformin use mitigates the adverse prognostic effect of diabetes mellitus in chronic obstructive pulmonary disease. Respir Res 2019; 20:69. doi: 10.1186/s12931-019-1035-9 [Crossref]
- Regulation of autophagy by transforming growth factor-β (TGF-β) signaling. Autophagy 2010; 6:645-7. doi: 10.4161/auto.6.5.12046 [Crossref]
- TNF-α induces autophagy through ERK1/2 pathway to regulate apoptosis in neonatal necrotizing enterocolitis model cells IEC-6. Cell Cycle 2018; 17:1390-402. doi: 10.1080/15384101 [Crossref]
- Rapamycin inhibits oxidative/nitrosative stress and enhances angiogenesis in high glucose-treated human umbilical vein endothelial cells: role of autophagy. Biomed Pharmacother 2017; 93:885-94. doi: 10.1016/j.biopha.2017.07.044 [Crossref]
- Restoration of autophagy in endothelial cells from patients with diabetes mellitus improves nitric oxide signaling. Atherosclerosis 2016; 247:207-17. doi: 10.1016/j.atherosclerosis.2016.01.043 [Crossref]
- The interplay between exosomes and autophagy – partners in crime. J Cell Sci 2018; 131:jcs215210. doi: 10.1242/jcs.215210 [Crossref]
- Diabetic sera disrupted the normal exosome signaling pathway in human mesenchymal stem cells in vitro. Cell Tissue Res 2018; 374:555-65. doi: 10.1007/s00441-018-2895-x [Crossref]
- Chronic Exposure of Human Endothelial Progenitor Cells to Diabetic Condition Abolished the Regulated Kinetics Activity of Exosomes. Iran J Pharml Res 2018; 17:1068-80. doi: 10.22037/IJPR.2018.2258 [Crossref]