BioImpacts. 6(4):195-201.
doi: 10.15171/bi.2016.26
Original Research
Filgrastim (G-CSF) loaded liposomes: mathematical modeling and optimization of encapsulation efficiency and particle size
Farhad Kiafar 1, Mohammad Reza Siahi Shadbad 1, Hadi Valizadeh 1, 2, *
Author information:
1Faculty of Pharmacy, Tabriz University of Medical Sciences, Tabriz, Iran
2Drug Applied Research Center, Tabriz University of Medical Sciences, Tabriz, Iran
Abstract
Introduction:
Optimization of filgrastim (G-CSF) (granulocyte colony stimulating factor) liposomes formulation prepared by the method of film hydration was the aim of this research.
Methods:
To study the independent variables effects in the development of filgrastim (G-CSF) liposomes, method of factorial design was applied. The molar ratio of dipalmitoyl phophatidylcholine (DPPC) per cholesterol (Chol.) and hydration time were chosen as two independent factors. The dependent variables were encapsulation efficiency percent (EE %) and particle size (PS). Ultrafiltration method was applied for separation of un-encapsulated protein. RP-HPLC method was employed for analysis of G-CSF.
Results:
Application of response surface methodology (RSM) in formulation of filgrastim liposomes and the obtained results for responses including particle size and EE % showed that the main effective independent variable was DPPC/Chol molar ratio. Different impacts of influencing parameters including interaction and individual effects were checked employing a mathematical method for obtaining desired liposomes. Optimum liposomal formulations were established using this method for enhancing their characteristics. Average percent errors (APEs) were 3.86% and 3.27% for predicting EE % and PS, respectively which reflect high model ability in this regard.
Conclusion:
It is concluded that observed and predicted values regarding PS and EE % were consistent and this model is efficient enough in prediction of the mentioned characteristics while preparing filgrastim (G-CSF) liposomes.
Keywords: Central composite design, Filgrastim (G-CSF), Liposomes, Response surface methodology
Copyright and License Information
© 2016 The Author(s)
This work is published by BioImpacts as an open access article distributed under the terms of the Creative Commons Attribution License (
http://creativecommons.org/licenses/by-nc/4.0/). Non-commercial uses of the work are permitted, provided the original work is properly cited.
Introduction
Granulocyte colony stimulating factor (G-CSF) is a protein (poly peptide chain) consisting of 174 amino acids with O-glycosilation at the treonine end which acts via attachment to a specific membrane receptor called G-CSF receptor. This receptor which is expressed on blood cells such as stem cells, multipotent precursors, myeloid precursors, neutrophils and monocytes, belongs to the first class of cytokine receptors family.
1,2
Due to the key role of G-CSF in the differentiation and growth of neutrophils and their precursors, it is essential for the function of neutrophil-type immune system. The formation of neutrophils could be suppressed by cancer chemotherapies which in turn could cause infections in patients and consequently might threaten their lives.
3-6
Cancer patients who undergo the chemotherapy with high doses have been widely treated by G-CSF. Moreover, in patients suffering from diabetic foot infections, pneumonia, HIV, febrile neutropenia and leukemia, the immune system could be supported using G-CSF.
7-10
According to these sufficient clinical applications, production of human recombinant G-CSF was performed using genetically modified Escherichia coli. In 1991, the United States Food and Drug Administration (US FDA) approved the protein for the treatment of neutropenia caused by chemotherapy.
11-13
G-CSF is available in two forms clinically: (1) Lenograstim: in glycosylated form, expressed, and produced in mammalian cells, and (2) Filgrastim: in non-glycosylated form, expressed, and produced in E. coli.
14
Liposomes consist of cholesterol and phospholipids which are converted into a bilayer for encapsulation of an aqueous inner. The transition temperature of phospholipids is the required temperature for inducing the change of physical state of phospholipids from the gel phase which is ordered to the liquid crystalline phase which is disordered. Encapsulation of the drugs inside liposomes could improve their stability. Despite that liposome technology was revealed so many years ago, the number of liposomal formulations in the drug market is not that much. The development and industrial manufacture of liposomes are limited due to some problems such as stability issues, sterilization challenges, less drug encapsulation, and weak batch-to-batch consistency. A lot of activities have been performed to overcome such problems; for example, improving the preparation processes and also incorporating diverse lipids to improve their stability and entrapment efficiency.
15-20
During dosage forms development, there have been so many influencing factors on the product characteristics. Therefore, to develop a specific product, time-consuming and even costly studies on the formulation are absolutely essential. Experimental design methodologies are strategies for employing very less quantity of experiments and avoiding unnecessary experiments in order to obtain the desired results faster and spend fewer costs.
21-24
Among many studies on different molecules in regard to modeling of their formulation, some studies have been done regarding modeling of peptides or protein loaded nanoparticles. One of those peptides is cyclosporine A, which effects of preparation factors were investigated on its release, zeta potential, and size for prepared nanoparticles.
21
In another study, the design of experiments was also applied to optimize encapsulation efficiency in the liposomal formulations of Print 3G peptide, an agent reducing the angiogenesis in breast cancer.
22
Applying response surface method for developing and optimizing liposomal formulations of sirolimus, an immunosuppressive peptide was also reported.
25
In the recent investigation, the effects of liposome composition and preparation parameters including molar ratio of lipids and hydration time were evaluated on the encapsulation efficiency and liposome size using a full factorial design. More studies were performed applying response surface methodology (RSM) through the approach of central composite designs (CCD). Desired particle size and EE% for filgrastim (G-CSF) liposomes were acquired by the application of optimization procedure.
Materials and methods
Materials
Filgrastim (G-CSF) was supplied by Intas Biopharmaceuticals Ltd. Company (Gujarat, India). Cholesterol and dipalmitoyl phophatidylcholine (DPPC) were procured from Merck (Darmstadt, Germany) and Lipoid GMBH (Ludwigshafen, Germany), respectively. Reference standard for filgrastim (G-CSF) was from European Directorate for Quality of Medicines (EDQM, Strasbourg, France). Reagents and solvents were purchased from Merck (Darmstadt, Germany) and were of analytical and HPLC grade, respectively.
Methods
Preparation of liposomes
In this investigation, DPPC was used for preparation of liposomes. Cholesterol was also another component in the formulation in different molar ratios as a fluidity buffer. A modified technique of thin layer film hydration was employed for preparation of filgrastim (G-CSF) liposomes. This method is considered as the most used one for preparing protein loaded liposomes. Different phospholipids per cholesterol ratios were dissolved in chloroform while the concentration of total lipids was 30 mM. Organic solution of two lipids was placed in a rotary evaporator (Buchi, Zurich, Switzerland) for 2 h at a temperature of 45ºC and stirring speed of 150 rpm under 300 mm Hg of vacuum to be evaporated. The formed and dried thin film was hydrated with Filgrastim (G-CSF) having concentration of 1 mg/mL in PBS (Phosphate Buffered Saline) at 45ºC (above transition temperature of phospholipid which is 41ºC). Rotary evaporator was employed to keep the obtained mixture at the temperature of 45ºC and stirring speed of 150 rpm for hydration. Then, the prepared mixture was sonicated for 10 min followed by subjection to 5 cycles of freeze (dry ice) and thaw (37ºC). Three different hydration times including 30, 60, and 90 min were applied.
Measurement of liposomes particle size
Dynamic light scattering (DLS) technique was applied for measurements (triplicate) of liposomes mean vesicle size and distribution profile by means of Zetasizer Nano ZS (Malvern Instruments Limited, Malvern, Worcestershire, UK).
Encapsulation efficiency percent (EE %) determination for filgrastim (G-CSF)
Separation of encapsulated and non-encapsulated filgrastim (G-CSF) was performed by means of centrifugation employing 100 KDa ultrafiltration tubes (AMICON®, Millipore). The prepared liposomes were centrifuged at the speed of 4000 g for 10 min at 25°C (lower than phase-transition temperature of phospholipids). The separated liposomes were lysed using 40% methanol (1 in 20) and were analyzed for measurement of encapsulated drug.
EE % was calculated by equation 1
26-31
:
(Eq. 1)
Where, Cencapsulated is the measured concentration of drug inside liposomes and Ctotal is total added drug to the liposome formulation.
Assay of filgrastim (G-CSF)
A pharmacopoieal RP-HPLC method was used for the measurement of filgrastim (G-CSF) amount. UV spectrophotometer at wavelength of 215 nm was used as detector in HPLC system (KNAUER®, Berlin, Germany). Analysis and data acquisition were performed by Chromgate® software of Knauer®. A KNAUER® made column (C18, 4.6 × 250 mm, 5 μm) was applied and placed in an oven at temperature of 65ºC. The composition of mobile phases was as below:
Mobile Phase-A (Acetonitrile (49.9 %) + Water (50%) + TFA (Trifluroacetic Acid) (0.1 %)) and mobile Phase-B (Acetonitrile (ACN) (95 %) + Water (5%) + TFA (Trifluroacetic Acid) (0.1 %)).
A gradient flow of 1 mL/min was applied. The relevant conditions are mentioned in Table 1.
Table 1.
Gradient flow HPLC conditions for filgrastim assay
|
Time (Min)
|
Mobile phase A (%v/v)
|
Mobile phase B (%v/v)
|
| 0-4 |
92 |
8 |
| 4-19 |
92 to 72 |
8 to 28 |
| 19-19.1 |
72 to 0 |
28 to 100 |
| 19.1- 21 |
0 |
100 |
| 21- 21.1 |
0 to 92 |
100 to 8 |
| 21.1- 25 |
92 |
8 |
Linearity range was 1-50 µg/mL.
Optimizing formulations using a 32 full factorial design
This investigation was performed using a full 32 randomized factorial design. During this study, evaluation of two factors was done and three levels were considered for each factor. Experimental studies were totally performed at nine combinations. Preliminary studies defined the type of factors and also their levels. Based on those data, the independent variables were molar ratios of DPPC/Cholesterol and hydration times. On the other side, the dependent variables were size of liposomes and EE %. Table 2 shows the composition of the factorial formulations (1 to 9).
Table 2.
Full 32 factorial design, molar ratios of DPPC/Cholesterol, and hydration times in different formulations along with responses (particle size [PS], encapsulation efficiency percent [EE %])
|
Formulation No.
|
DPPC/cholesterol molar ratio
|
Hydration time level (Min)
|
PS (nm)
|
EE (%)
|
| 1 |
3 |
2 (60) |
586 |
42.6 |
| 2 |
1 |
3 (90) |
1035 |
73.7 |
| 3 |
2 |
2 (60) |
753 |
62.8 |
| 4 |
2 |
3 (90) |
754 |
68.0 |
| 5 |
1 |
2 (60) |
976 |
70.9 |
| 6 |
3 |
3 (90) |
593 |
45.3 |
| 7 |
3 |
1 (30) |
569 |
39.3 |
| 8 |
2 |
1 (30) |
775 |
61.3 |
| 9 |
1 |
1 (30) |
1119 |
71.0 |
Application of response surface methodology for factor optimization
Different runs were performed in CCD model-designed experiments according to the RSM approach for visualization of the selected independent factors’ impacts on the responses along with the experimental conditions. Response surface graph was prepared using Minitab® software (version 16). Optimization of the formulations was carried out by means of response surface diagrams.
Results
Effects of formulation composition on dependent responses
According to the RSM approach, the runs were performed in CCD model-designed experiments to visualize the impacts of selected independent factors on the responses.
A general equation for the relationship between independent factors and EE% is as below (Equation 2):
Yr=a0 + a1X1+a2X2 + a1a1X1X1 + a2a2X2X2 + a1a2X1X2 (Eq. 2)
Where:
Yr: response (dependent variable);
a0: experimental runs’ arithmetic mean;
ai: predicted coefficient for Xi (affecting factor);
X1 and X2 (affecting factors): The mean results obtained during shifting a factor from the lowest to the highest amount at a time;
X1X2 (interaction terms): Varying the response while changing two factors simultaneously;
X1X1 and X2X2 (polynomial terms): non-linearity status of the equation.
Magnitude and mathematical sign of the above mentioned coefficients reflect the effectiveness of selected dependent variables on responses.
Effect of formulation composition on particle size
Based on many reports, it is obvious that the particle size (PS) of the liposomes affect their in vitro and/or in vivo performances. In other words, one of the most crucial parameters which need to be taken into consideration during liposome preparation is vesicle particle size. The particle sizes of different formulations of prepared liposomes were in a range of 569 to 1119 nm. Relevant results are included in Table 2. Moreover, the maximum and minimum sizes correspond to formulations No. 9 and No. 7, respectively. The obtained model for PS is as below (equation 3):
PS = 1685.11 – 493.67 (DPPC/Chol) – 210.83 (Hydr.Time) + 52.33 (DPPC/Chol)2+35.83 (Hydr.Time)2 + 27.00 (DPPC/Chol × Hydr.Time) (Eq. 3)
Equation 3 reveals that the PS values depend on the chosen independent variables including DPPC/Chol molar ratio and hydration time. The decreasing effect of DPPC/Chol on the particle size (p = 0.024) is shown by the negative sign of its coefficient. The coefficient of DPPC/Chol was found to be significant at the level of p < 0.05. According to the obtained results, hydration times and its interaction do not impact the PS of liposomes significantly (p > 0.05).
As illustrated in Fig. 1, at high values of hydration time, PS decreased from 1035 nm to 593 nm while DPPC/Chol increased from 1 to 5. Likewise, at low values of hydration time, PS decreased from 1119 nm to 569 nm while DPPC/Chol. molar ratio increased from 1 to 5.
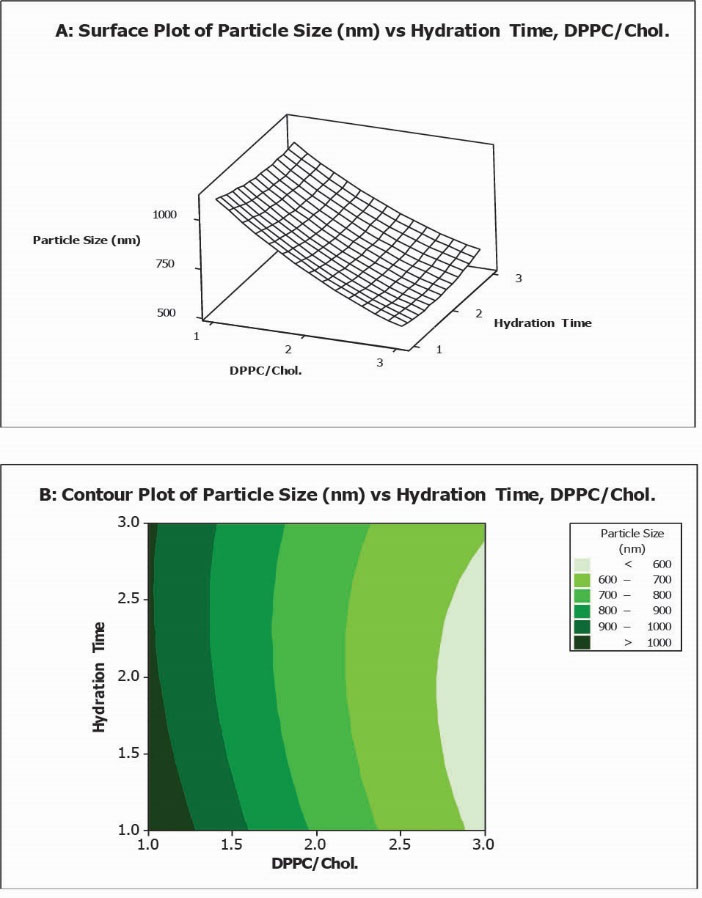
Fig. 1.
Surface plot (A) along with contour plot (B) showing molar ratio of DPPC/Cholesterol and hydration time effects on particle size (PS).
.
Surface plot (A) along with contour plot (B) showing molar ratio of DPPC/Cholesterol and hydration time effects on particle size (PS).
Effect of formulation composition on encapsulation efficiency percent
EE% was selected as another main and crucial response which can affect in vitro and/or in vivo performances of different formulations. Relevant results for different performed experiments are illustrated in Table 2. The model equation derived for EE % was equation 4:
YEE%= 67.40 + 11.22 (DPPC/Chol) – 3.08 (Hydr.Time) – 6.90 (DPPC/Chol)2 + 1.00(Hydr.Time)2 + 0.82 (DPPC/Chol × Hydr.Time) (Eq.4)
The EE % of liposomal formulations was in a range of 39.3% to 73.7%, while the maximum entrapment efficiency was observed in formulation No. 2. Contour and response surface plots were employed for the evaluation of relationship between independent and dependent variables. As reflected in Fig. 2, at low values of hydration time, there was a decrease in EE % from 71.0% to 39.3% while DPPC/Chol molar ratio increased from 1 to 5. Correspondingly, at high values of hydration time, EE % decreased from 73.7% to 45.3 % while DPPC/Chol molar ratio increased from 1 to 5. The coefficient of DPPC/Chol in the equation was found to be significant (p = 0.043). According to the obtained results, hydration times and their interaction do not impact the encapsulation efficiency percent of liposomes significantly (p > 0.05).
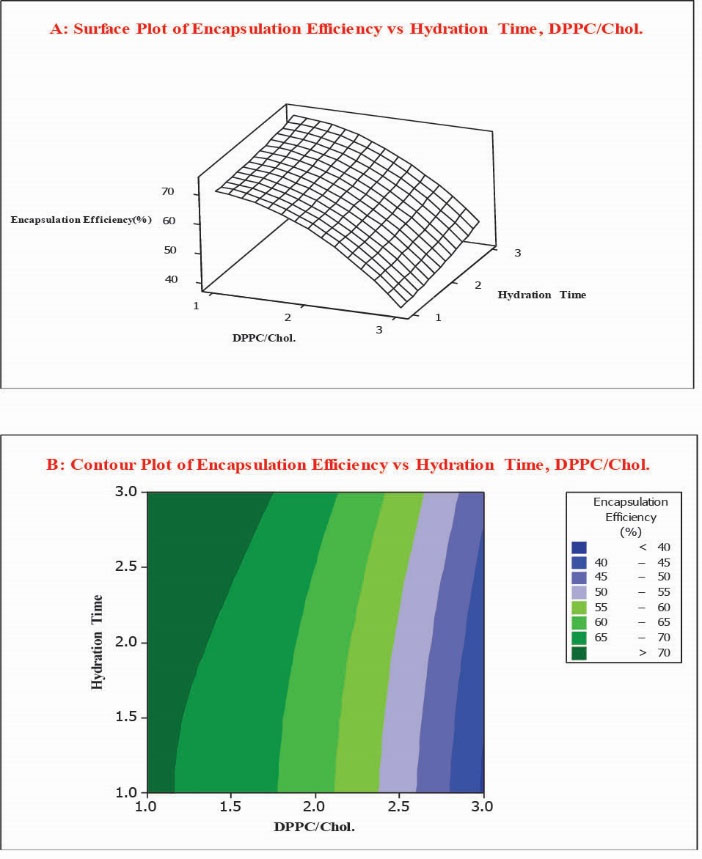
Fig. 2.
Surface plot (A) along with contour plot (B) showing molar ratio of DPPC/Cholesterol and hydration time effects on encapsulation efficiency percent (EE %).
.
Surface plot (A) along with contour plot (B) showing molar ratio of DPPC/Cholesterol and hydration time effects on encapsulation efficiency percent (EE %).
Overlaid contour plot with desired values for PS and EE % was obtained using RSM methodology. The white area inside the plot corresponds to conditions resulting in a particle size of 600 nm to 650 nm and EE % in the range of 50 to 60% (illustrated in Fig. 3).
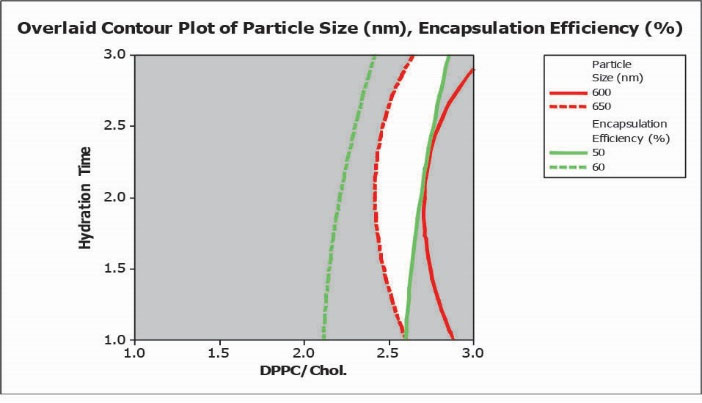
Fig. 3.
Overlaid contour plot with defined conditions for desired particle size (PS) and encapsulation efficiency percent (EE %).
.
Overlaid contour plot with defined conditions for desired particle size (PS) and encapsulation efficiency percent (EE %).
Optimization of liposomal formulations
Investigation of validity: To evaluate the model accuracy, some calculations with diverse conditions were conducted and then the acquired results were compared to the data obtained from model. Observed and calculated PS and EE% with these equations are reflected in Table 3. Percent error (PE) was obtained using equation 5:
(Eq. 5)
Table 3.
Observed and calculated percent error (PE) values regarding encapsulation efficiency percent (EE %) and Particle Size (PS) for experiments
|
Formulation No.
|
Obs PS
|
Calc PS
|
PS PE
|
Obs EE%
|
Calc EE%
|
EE% PE
|
| 1 |
586 |
558.73 |
4.65 |
42.6 |
41.72 |
2.06 |
| 2 |
1035 |
1014.75 |
1.95 |
73.7 |
73.94 |
0.32 |
| 3 |
753 |
736.75 |
2.15 |
62.8 |
63.36 |
0.89 |
| 4 |
754 |
759.07 |
0.67 |
68.0 |
66.92 |
1.59 |
| 5 |
976 |
1019.43 |
4.45 |
70.9 |
71.2 |
0.42 |
| 6 |
593 |
608.05 |
2.54 |
45.3 |
46.1 |
1.77 |
| 7 |
569 |
581.07 |
2.12 |
39.3 |
39.34 |
0.10 |
| 8 |
775 |
786.09 |
1.43 |
61.3 |
61.8 |
0.81 |
| 9 |
1119 |
1095.77 |
2.07 |
71.0 |
70.46 |
0.76 |
Average percent error (APE) for particle size and EE % for experiments were 2.45 % and 0.97 %, respectively.
Three more experiments were performed to investigate the external model power for prediction. Table 4 illustrates the results along with conditions. Based on the obtained results, average PEs for these experiments are 3.27% and 3.86% for PS and EE%, respectively. Predictive ability of the proposed model within the range of investigated variables is good according to the low PE values.
Table 4.
Observed and calculated percent error (PE) values regarding encapsulation efficiency percent (EE %) and particle size (PS) in test set
|
DPPC/Cholesterol
|
Hydration Time level (Min)
|
Obs PS (nm)
|
Calc PS (nm)
|
PS PE
|
Obs EE%
|
Calc EE%
|
EE% PE
|
| 1.5 |
2 (60) |
890 |
865.00 |
2.81 |
65.7 |
69.01 |
5.03 |
| 2.5 |
3 (90) |
648 |
670.48 |
3.47 |
56.4 |
58.24 |
3.25 |
| 2 |
2.5 (75) |
766 |
738.95 |
3.53 |
67.1 |
64.89 |
3.29 |
| Average PE for PS: 3.27 |
Average PE for EE%: 3.86 |
This model was used for obtaining optimum conditions as well (optimization plot in Fig. 4). Desired PS and EE% were considered as 625 nm and 55%, respectively. According to the proposed values for the factors, a new formulation was prepared. The values are in agreement with the white area in the overlaid plots (Fig. 3). Observed responses were close to the calculated ones in the prepared formulation and the prediction error for EE % and PS were 5.8% and 6.1%, respectively. These results further express the appropriateness of the optimization process in developing filgrastim (G-CSF) liposomes.
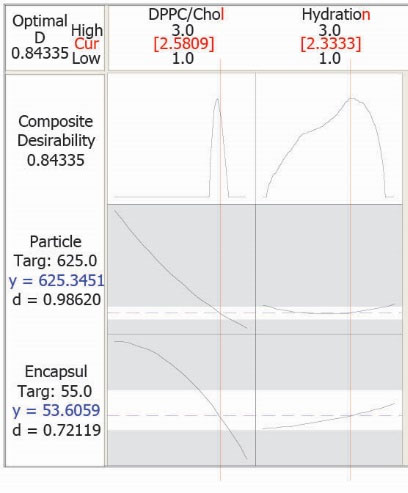
Fig. 4.
Optimization plot for formulation, having determined encapsulation efficiency percent (EE %) and particle size (PS) values.
.
Optimization plot for formulation, having determined encapsulation efficiency percent (EE %) and particle size (PS) values.
Discussion
Developing an appropriate pharmaceutical liposomal formulation involved with small number of people, consuming less time, and also lower raw materials is very desirable. Usually, formulations are being developed by changing a variable using try and error which could be very time consuming and would require lots of creative efforts. Additionally, since the interacting effects of the independent variables are not being considered, it might be very difficult to develop perfect formulations using these conventional techniques. Therefore, it is crucial to understand the complexity of formulations by means of statistical tools such as factorial design.
21,24,32-34
RSMs are mixtures of statistical and mathematical techniques which quantify the relationships between several factors and numbers of responses for obtaining desired responses through serial tests. Reducing the experimental runs is the most important advantage of response surface methodologies and now they are extensively being applied in the optimization of design of formulations in pharmaceutics.
In this study we investigated the effects of DPPC/Chol. molar ratio and hydration time of the prepared liposomes on the particle size and encapsulation efficiency percent. In different studies, the usages of mathematical modeling were reported for different molecules including peptides and proteins. Based on the results obtained during this investigation including laboratory experiments and mathematical modeling, as the p values of hydration time effect on the particle size and encapsulation efficiency were more than 0.05, these effects were not considered significant. On the other side, the results showed that the effects of DPPC/Chol. molar ratios were significantly effective on the particle size and encapsulation efficiency of prepared liposomes as the p values were less than 0.05. After modeling of these effects and comparing the observed results and calculated values based on the equations, the APEs for these two observed and calculated values were low, which supports the validity of the model. This was furthermore confirmed by 3 more experiments as test set. Moreover, after performing another measurement for an optimized and desired formulation and low APEs for all these four measurements between observed and calculated values, validity of the model was more confirmed for both optimization and prediction purposes.
Conclusion
Establishing significant variables and optimal conditions to prepare liposomes of filgrastim (G-CSF) could be done by full factorial design and RSM through CCD. The present investigation concentrated on the preparation and characterization of filgrastim (G-CSF) liposomes via the method of thin film layer hydration. Particle size (PS) and encapsulation efficiency percent (EE %) are key characteristics in liposomal formulas which have crucial effects on in vivo and in vitro properties of pharmaceuticals. Encapsulation efficiency percentages and particle sizes were optimized after investigation of effects of formulation variables. DPPC/Chol. molar ratio had a profound impact on the encapsulation efficiency and size of liposomes. Finally, the proposed model could be successfully applied to predict and optimize both EF % as well as particle sizes of liposomal formulations.
Acknowledgements
The present study is a part of performed activities and researches for No. 56 PhD thesis registered in Faculty of Pharmacy, Tabriz University of Medical Sciences, Tabriz, Iran. The authors thank Research Center for Pharmaceutical Nanotechnology (RCPN), Tabriz University of Medical Sciences, Tabriz, Iran and also Zahravi Pharmaceutical Company, Tabriz, Iran for their support.
Competing interests
No competing interests are available.
Ethical approval
There is nothing to be declared.
Research Highlights
What is current knowledge?
simple
-
√ Liposomes of different proteins and peptides have been
prepared.
-
√ Particle size and encapsulation efficiency measurements
of prepared protein/peptide loaded liposomes have been
performed.
-
√ Mathematical modeling has been performed for liposomal
formulations of some peptides such as sirolimus, cyclosporine
A, and Print 3G peptide.
What is new here?
simple
-
√ Liposomes of filgrastim was prepared.
-
√ Particle size and encapsulation efficiency measurements of
filgrastim liposomes was performed.
-
√ Mathematical modeling was performed for filgrastim
(G-CSF) liposomes.
-
√The relationship between formulation factors and particle
size and encapsulation efficiency for filgrastim liposomes was
investigated.
-
√ Optimization of formulation factors was done for filgrastim
liposomes.
References
- Hartmann LC, Tschetter LK, Habermann TM, Ebbert LP, Johnson PS, Mailliard JA. Granulocyte colony-stimulating factor in severe chemotherapy-induced afebrile neutropenia. N Engl J Med 1997; 336:1776-80. doi: 10.1056/nejm199706193362502 [Crossref] [ Google Scholar]
- Demetri GD, Griffin JD. Granulocyte colony-stimulating factor and its receptor. Blood 1991; 78:2791-808. [ Google Scholar]
- Vanz AL, Renard G, Palma MS, Chies JM, Dalmora SL, Basso LA. Human granulocyte colony stimulating factor (hG-CSF): cloning, overexpression, purification and characterization. Microb Cell Fact 2008; 7:13. doi: 10.1186/1475-2859-7-13 [Crossref] [ Google Scholar]
- Liongue C, Wright C, Russell AP, Ward AC. Granulocyte colony-stimulating factor receptor: stimulating granulopoiesis and much more. Int J Biochem Cell Biol 2009; 41:2372-5. doi: 10.1016/j.biocel.2009.08.011 [Crossref] [ Google Scholar]
- Okabe M, Asano M, Kuga T, Komatsu Y, Yamasaki M, Yokoo Y. In vitro and in vivo hematopoietic effect of mutant human granulocyte colony-stimulating factor. Blood 1990; 75:1788-93. [ Google Scholar]
- Kuderer NM, Dale DC, Crawford J, Lyman GH. Impact of primary prophylaxis with granulocyte colony-stimulating factor on febrile neutropenia and mortality in adult cancer patients receiving chemotherapy: a systematic review. J Clin Oncol 2007; 25:3158-67. doi: 10.1200/JCO.2006.08.8823 [Crossref] [ Google Scholar]
- Choi SH, Park TG. G-CSF loaded biodegradable PLGA nanoparticles prepared by a single oil-in-water emulsion method. Int J Pharm 2006; 311:223-8. doi: 10.1016/j.ijpharm.2005.12.023 [Crossref] [ Google Scholar]
- Welte K, Bonilla MA, Gillio AP, Boone TC, Potter GK, Gabrilove JL. Recombinant human granulocyte colony-stimulating factor Effects on hematopoiesis in normal and cyclophosphamide-treated primates. J Exp Med 1987; 165:941-8. [ Google Scholar]
- Panopoulos AD, Watowich SS. Granulocyte colony-stimulating factor: molecular mechanisms of action during steady state and 'emergency' hematopoiesis. Cytokine 2008; 42:277-88. doi: 10.1016/j.cyto.2008.03.002 [Crossref] [ Google Scholar]
- Nomdedeu M, Lara-Castillo MC, Etxabe A, Cornet-Masana JM, Pratcorona M, Diaz-Beya M. Treatment with G-CSF reduces acute myeloid leukemia blast viability in the presence of bone marrow stroma. Cancer Cell Int 2015; 15:122. doi: 10.1186/s12935-015-0272-3 [Crossref] [ Google Scholar]
- Duconge J, Rodriguez-Vera L, Valenzuela C, Alvarez D, Ramirez O, de la Luz-Hernandez KR. Pharmacokinetic comparison of two recombinant human granulocyte colony-stimulating factor after subcutaneous administration in rabbits. Eur J Pharm Biopharm 2005; 61:142-8. doi: 10.1016/j.ejpb.2005.06.003 [Crossref] [ Google Scholar]
- Herman AC, Boone TC, Lu HS. Characterization, formulation, and stability of Neupogen (Filgrastim), a recombinant human granulocyte-colony stimulating factor. Pharm Biotechnol 1996; 9:303-28. [ Google Scholar]
- Montemurro F, Gallicchio M, Aglietta M. [Prevention and treatment of febrile neutropenia]. Tumori 1997; 83:S15-9. [ Google Scholar]
- Skrlin A, Kosor Krnic E, Gosak D, Prester B, Mrsa V, Vuletic M. Correlation of liquid chromatographic and biological assay for potency assessment of filgrastim and related impurities. J Pharm Biomed Anal 2010; 53:262-8. doi: 10.1016/j.jpba.2010.02.006 [Crossref] [ Google Scholar]
- Balasubramanian SV, Bruenn J, Straubinger RM. Liposomes as formulation excipients for protein pharmaceuticals: a model protein study. Pharm Res 2000; 17:344-50. [ Google Scholar]
- Swaminathan J, Ehrhardt C. Liposomal delivery of proteins and peptides. Expert Opin Drug Deliv 2012; 9:1489-503. doi: 10.1517/17425247.2012.735658 [Crossref] [ Google Scholar]
- Samad A, Sultana Y, Aqil M. Liposomal drug delivery systems: an update review. Curr Drug Deliv 2007; 4:297-305. [ Google Scholar]
- Tan ML, Choong PF, Dass CR. Recent developments in liposomes, microparticles and nanoparticles for protein and peptide drug delivery. Peptides 2010; 31:184-93. doi: 10.1016/j.peptides.2009.10.002 [Crossref] [ Google Scholar]
- Maherani B, Arab-Tehrany E, Kheirolomoom A, Cleymand F, Linder M. Influence of lipid composition on physicochemical properties of nanoliposomes encapsulating natural dipeptide antioxidant l-carnosine. Food Chem 2012; 134:632-40. doi: 10.1016/j.foodchem.2012.02.098 [Crossref] [ Google Scholar]
- Kim TD, Sakon M, Kawasaki T, Kambayashi J, Ohshiro T, Mori T. Studies on liposome-encapsulated heparin. Thromb Res 1986; 43:603-12. [ Google Scholar]
- Hermans K, Van den Plas D, Everaert A, Weyenberg W, Ludwig A. Full factorial design, physicochemical characterisation and biological assessment of cyclosporine A loaded cationic nanoparticles. Eur J Pharm Biopharm 2012; 82:27-35. doi: 10.1016/j.ejpb.2012.05.003 [Crossref] [ Google Scholar]
- Ducat E, Brion M, Lecomte F, Evrard B, Piel G. The experimental design as practical approach to develop and optimize a formulation of peptide-loaded liposomes. AAPS Pharm Sci Tech 2010; 11:966-75. doi: 10.1208/s12249-010-9463-3 [Crossref] [ Google Scholar]
- Loukas YL. A computer-based expert system designs and analyzes a 2(k - p) fractional factorial design for the formulation optimization of novel multicomponent liposomes. J Pharm Biomed Anal 1998; 17:133-40. [ Google Scholar]
- Carbone C, Tomasello B, Ruozi B, Renis M, Puglisi G. Preparation and optimization of PIT solid lipid nanoparticles via statistical factorial design. Eur J Med Chem 2012; 49:110-7. doi: 10.1016/j.ejmech.2012.01.001 [Crossref] [ Google Scholar]
- Ghanbarzadeh S, Valizadeh H, Zakeri-Milani P. Application of response surface methodology in development of sirolimus liposomes prepared by thin film hydration technique. Bioimpacts 2013; 3:75-81. doi: 10.5681/bi.2013.016 [Crossref] [ Google Scholar]
- Haeri A, Alinaghian B, Daeihamed M, Dadashzadeh S. Preparation and characterization of stable nanoliposomal formulation of fluoxetine as a potential adjuvant therapy for drug-resistant tumors. Iran J Pharm Res 2014; 13:3-14. [ Google Scholar]
- Niggemann B, Erdmann G, Wellhoner HH. Liposome-entrapped [125I]anti-tetanus immunoglobulin G: evidence for entry into spinal cord neurons of the rat. Neurosci Lett 1984; 51:231-4. [ Google Scholar]
- Nii T, Ishii F. Encapsulation efficiency of water-soluble and insoluble drugs in liposomes prepared by the microencapsulation vesicle method. Int J Pharm 2005; 298:198-205. doi: 10.1016/j.ijpharm.2005.04.029 [Crossref] [ Google Scholar]
- Storm G, Van Bloois L, Steerenberg P, Van Etten E, De Groot G, Crommelin D. Liposome encapsulation of doxorubicin: pharmaceutical and therapeutic aspects. J Control Release 1989; 9:215-29. [ Google Scholar]
- Yuba E, Kojima C, Harada A, Tana Tana, Watarai S, Kono K. pH-Sensitive fusogenic polymer-modified liposomes as a carrier of antigenic proteins for activation of cellular immunity. Biomaterials 2010; 31:943-51. doi: 10.1016/j.biomaterials.2009.10.006 [Crossref] [ Google Scholar]
- Meyer J, Whitcomb L, Collins D. Efficient encapsulation of proteins within liposomes for slow release in vivo. Biochem Biophys Res Commun 1994; 199:433-8. doi: 10.1006/bbrc.1994.1247 [Crossref] [ Google Scholar]
- Derakhshandeh K, Erfan M, Dadashzadeh S. Encapsulation of 9-nitrocamptothecin, a novel anticancer drug, in biodegradable nanoparticles: factorial design, characterization and release kinetics. Eur J Pharm Biopharm 2007; 66:34-41. doi: 10.1016/j.ejpb.2006.09.004 [Crossref] [ Google Scholar]
- Gonzalez-Rodriguez ML, Barros LB, Palma J, Gonzalez-Rodriguez PL, Rabasco AM. Application of statistical experimental design to study the formulation variables influencing the coating process of lidocaine liposomes. Int J Pharm 2007; 337:336-45. doi: 10.1016/j.ijpharm.2007.01.024 [Crossref] [ Google Scholar]
- Hao J, Wang F, Wang X, Zhang D, Bi Y, Gao Y. Development and optimization of baicalin-loaded solid lipid nanoparticles prepared by coacervation method using central composite design. Eur J Pharm Sci 2012; 47:497-505. doi: 10.1016/j.ejps.2012.07.006 [Crossref] [ Google Scholar]