BioImpacts. 7(1):25-30.
doi: 10.15171/bi.2017.04
Original Research
Genetic polymorphisms of multidrug and toxin extrusion proteins (MATE1 and MATE2) in South Indian population
Gerard Marshall Raj 1, *, Jayanthi Mathaiyan 2, Mukta Wyawahare 3, Katiboina Srinivasa Rao 2, Rekha Priyadarshini 2
Author information:
1Department of Pharmacology, Sri Venkateshwaraa Medical College Hospital and Research Centre (SVMCH & RC), Puducherry, India
2Department of Pharmacology, Jawaharlal Institute of Postgraduate Medical Education and Research (JIPMER), Puducherry, India
3Department of General Medicine, Jawaharlal Institute of Postgraduate Medical Education and Research (JIPMER), Puducherry, India
Abstract
Introduction:
Drug transporters are key determinants of pharmacokinetic and pharmacodynamic profiles of certain drugs. SLC47A1 (MATE1) and SLC47A2 (MATE2) are major efflux transporters involved in the hepatic and renal excretion of many cationic drugs including metformin. Our study was proposed to determine the normative frequencies of the single nucleotide polymorphisms (SNPs) rs2289669 and rs12943590 in the SLC47A1 and SLC47A2 genes, respectively, in South Indian population and also to compare those with those of the HapMap populations.
Methods:
One hundred two unrelated healthy volunteers from South India were enrolled in the study. Genomic DNA was extracted by ‘phenol-chloroform extraction method’ from the peripheral blood leucocytes and genotyping was accomplished by real-time polymerase chain reaction using TaqMan SNP genotyping assay method.
Results:
In contrast to other populations, the minor allele in SLC47A1 gene was found to be "G" with a frequency of 46.6% in South Indian population. The populations of Hans Chinese in Beijing (HCB) [P = 0.017] and Japanese in Tokyo (JPT) [P < 0.001] had significantly different genotype and allele frequencies (SNP rs2289669) compared to those of South Indian population. Similarly, in the SNP rs12943590 of SLC47A2 gene, the genotype and allele frequencies of South Indian population differed significantly from those of Yoruba in Ibadan, Nigeria (YRI) [P < 0.001] and Utah residents with Northern and Western European ancestry (CEU) [P = 0.005] populations.
Conclusion:
Thus, the allele and genotype distributions of SLC47A1 and SLC47A2 gene polymorphisms were established in South Indian population and were found to be different from the frequencies of other ethnicities.
Keywords: Drug transporters, MATE1, MATE2, Single nucleotide polymorphisms, SLC47A1,
SLC47A2
Copyright and License Information
© 2017 The Author(s)
This work is published by BioImpacts as an open access article distributed under the terms of the Creative Commons Attribution License (
http://creativecommons.org/licenses/by-nc/4.0/). Non-commercial uses of the work are permitted, provided the original work is properly cited.
Introduction
Membrane transporters play an important role in the disposition of many drug molecules, especially the electrochemically charged cationic and anionic drug moieties. ATP-binding cassette (ABC) and solute carrier (SLC) transporters are two major superfamilies of drug transporters. Multidrug and toxin extrusion (MATE) proteins are involved in the efflux of certain lipophobic organic cations such as metformin (biguanide), cimetidine (H2 receptor blocker), and topotecan (camptothecin analog). MATEs are secondary active transporters acquiring energy from the oppositely directed proton gradient, also entitled as H+/organic cation antiporters (electroneutral transport). MATE transporters are made up of 400 to 550 amino acid residues spanning 12 transmembrane domains.
1,2
SLC47A1 and SLC47A2 are the genes coding for the transporters MATE1 and MATE2/ 2-K, respectively. Both these genes are positioned in tandem on the short arm of the 17th chromosome, i.e., at 17p11.2. MATE1 and MATE2 are also designated as SLC47A1 and SLC47A2, respectively; where SLC is the superfamily, the adjacent two digits denote the family (or) subclass and the suffixed alpha-numeral accounts for the specific transporter.
3
Other known substrates/inhibitors of MATE are acyclovir, cisplatin, ganciclovir, procainamide, clonidine, ranitidine, imatinib and zafirlukast (non-selective); cephalexin, cephradine, levofloxacin, fexofenadine, tenofovir, imipramine and vecuronium (MATE1 selective); verapamil, oxaliplatin and pramipexole (MATE2 selective).
4,5
However, of all the known substrates the pharmacokinetic and pharmacodynamic properties of the anti-diabetic drug metformin is greatly influenced by the functioning of these MATE transporters. MATE1, present at the canalicular (luminal) surface of hepatocytes, is involved in the hepatic biliary excretion of metformin. Similarly, MATE1 and MATE2 expressed at the apical (luminal) side of the renal tubules help in renal elimination of metformin through the urine.
Genetic variation in the genes coding for MATE1 and MATE2 have been found to be associated with an altered glycemic response to metformin.
6-8
As current knowledge in this field is inadequate and sometimes inconsistent, additional studies were required to confirm the clinical relevance of single nucleotide polymorphisms (SNPs) in genes coding for these transporters. Hence, this study was set forth to assess the prevalence of genetic polymorphisms of MATE1 and MATE2 transporter proteins in healthy population of South India who had a distinct genetic makeup. The SNP rs2289669 in the intronic region (922-158G>A) of SLC47A1 gene and the SNP rs12943590 in the 5ʹUTR region (-130G>A) of SLC47A2 gene were the polymorphisms proposed to be studied (Fig. S1).
Materials and methods
Subjects
The study was performed on 102 unrelated healthy volunteers hailing from Southern states of India (Tamil Nadu, Andhra Pradesh, Karnataka or Kerala). All these subjects were living in the South Indian states for at least three consecutive generations and speaking the native languages (Tamil, Telugu, Kannada or Malayalam). Out of 102 volunteers, 69 (67.6%) were males and 33 (32.4%) were females; and the mean age (± SD) was 28.7±9.4 years.
Under sterile precautions, 5 mL of venous blood was collected in a polypropylene centrifuge tube (15 mL) containing 100 μL of 10% disodium ethylenediaminetetraacetic acid salt (anti-coagulant) from each of the participants for genotyping. The samples were subsequently centrifuged at 2500 rpm for 10 minutes at 4°C. The supernatant containing plasma was discarded and the lower cellular fraction was stored at -80°C until further processing. Cellular fraction of the blood was used for DNA extraction and genotyping of SLC47A1 and SLC47A2 gene polymorphisms.
Genomic DNA was extracted from the frozen stored cellular fraction of the blood (i.e., from the peripheral white blood corpuscles) by using standardized ‘phenol-chloroform extraction method’. Multi-analyzer (Tecan Infinite M200, Switzerland) was utilized to determine the quality and quantity of the extracted DNA. The DNA samples were diluted to a concentration of 50 ng/μL by adding autoclaved DNase-free MilliQ water and were stored at -80°C until genotyping. Genotyping for SNPs rs2289669 in SLC47A1 gene and rs12943590 in SLC47A2 gene was performed using Applied Biosystems 7300 Real-Time PCR System (ABI, Foster City, CA, USA) using validated TaqMan® SNP genotyping assay method (Table 1).
Table 1.
Characteristic features of genetic polymorphisms studied
|
Gene
|
Base pair change
|
Gene location
|
SNP location
|
rs ID
|
Assay ID
|
|
SLC47A1
|
922-158G>A |
17p11.2 |
intron |
rs2289669 |
C__1588280_10 |
|
SLC47A2
|
-130G>A |
17p11.2 |
5’UTR |
rs12943590 |
C___2593951_10 |
The diluted DNA samples were incubated at 37°C for 24 hours before subjecting to qRT-PCR. The PCR reaction was carried out using 10 μL of final volume that contained 5 μL of TaqMan® Universal PCR Master Mix (2x), 0.25 μL of 40x working stock of TaqMan® assay, 2.5 μL of 50 ng/μL diluted genomic DNA and 2.25 μL of deionized water. The thermocycler conditions are given in Table 2. Figs. 1 and 2 depict the amplification plots of the SNPs.
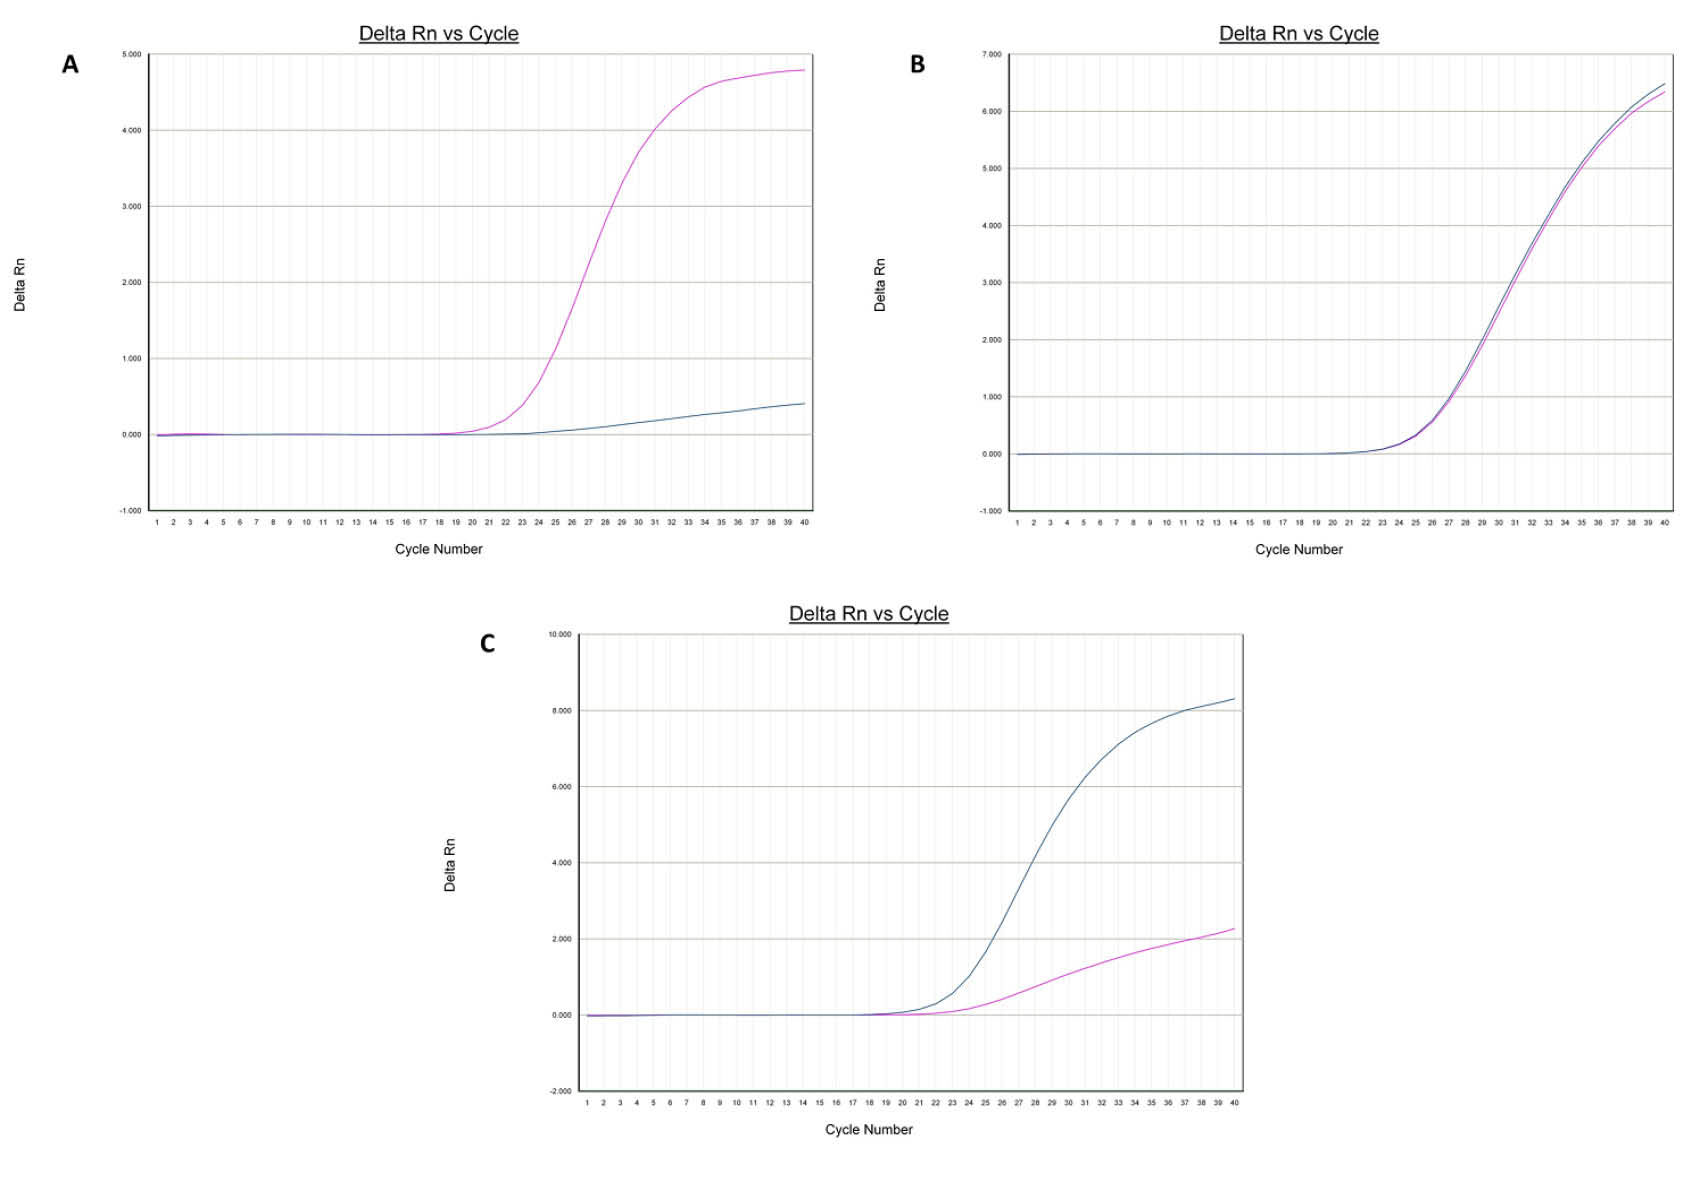
Fig. 1.
Amplification plots [A (AA), B (AG) and C (GG)] of rs2289669 in SLC47A1 gene.
.
Amplification plots [A (AA), B (AG) and C (GG)] of rs2289669 in SLC47A1 gene.
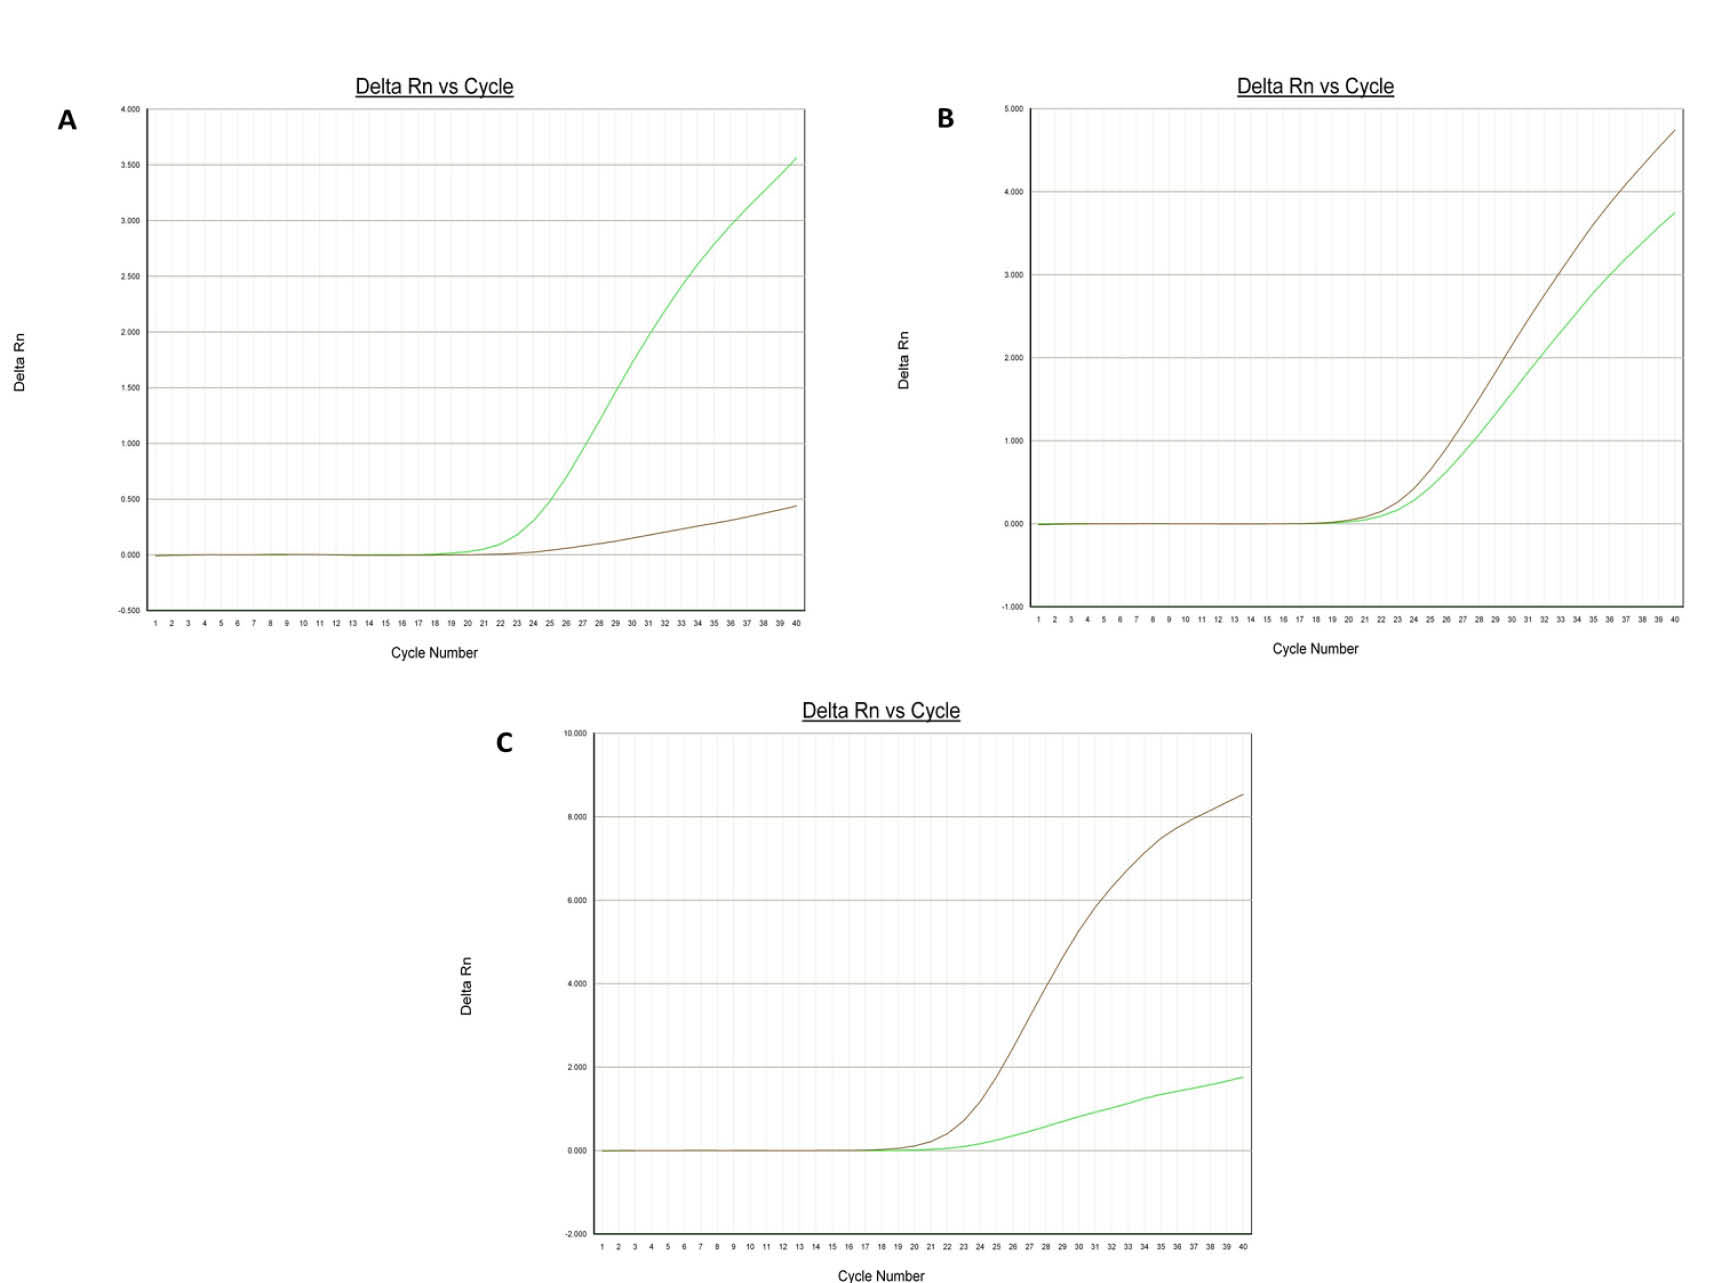
Fig. 2.
Amplification plots [A (AA), B (AG) and C (GG)] of rs12943590 in SLC47A2 gene.
.
Amplification plots [A (AA), B (AG) and C (GG)] of rs12943590 in SLC47A2 gene.
Table 2.
Quantitative real-time PCR thermal cycling conditions
|
Steps
|
PCR conditions
|
No. of cycles
|
|
Temperature
|
Time
|
| Initial denaturation |
60°C |
2 min |
1 |
| Amplification |
95°C |
10 min |
1 |
| Denaturation |
92.5°C |
15 s |
45 |
| Annealing and extension |
60°C |
1 min |
45 |
Allelic discrimination was done by 7300 Sequence Detection Software (SDS), version 1.4 (Figs. 3 and 4). For quality checking, 10% of the DNA samples were retested and the results were found to be 100% concordant with the previous ones.
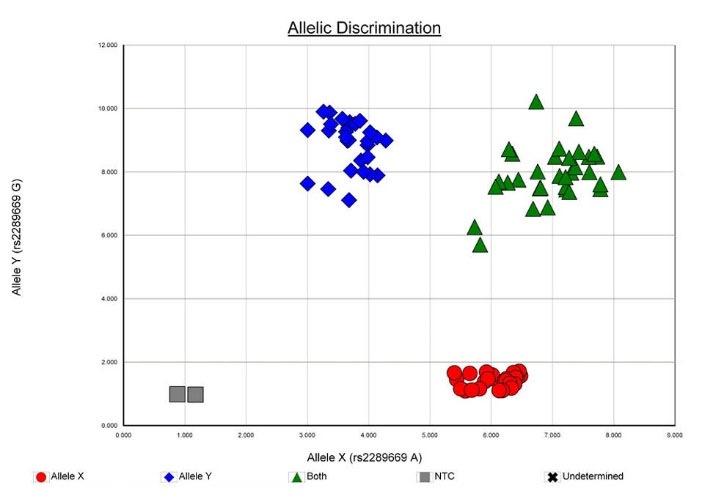
Fig. 3.
Allelic discrimination plot of SNP rs2289669 in SLC47A1 [MATE1] gene.
.
Allelic discrimination plot of SNP rs2289669 in SLC47A1 [MATE1] gene.
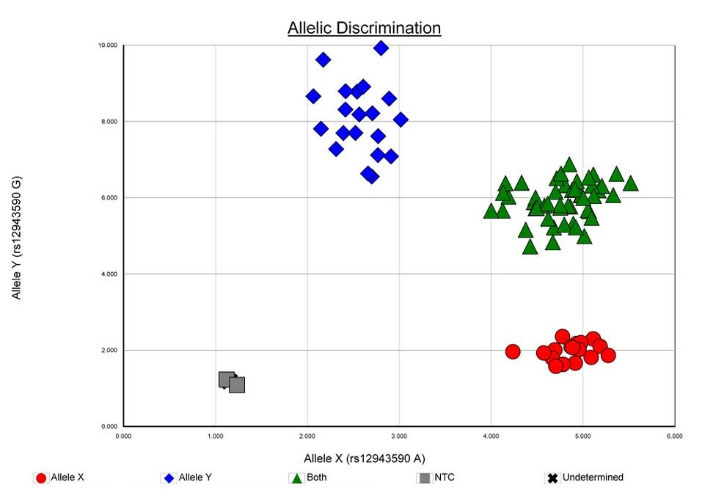
Fig. 4.
Allelic discrimination plot of SNP rs12943590 in SLC47A2 [MATE2] gene.
.
Allelic discrimination plot of SNP rs12943590 in SLC47A2 [MATE2] gene.
The genotype and allele frequencies were ascertained by direct gene count method. Chi-square test was used for establishing Hardy–Weinberg equilibrium by comparing the observed genotype frequencies with the expected genotype frequencies. Chi-square test was also applied to evaluate the differences in allele and genotype frequencies between the study population and populations of other ethnicities. Statistical analysis was performed using GraphPad InStat, version 3.06 (GraphPad Software, San Diego, CA, USA). Haploview, version 4.2 (Broad Institute of MIT and Harvard, Cambridge, MA, USA) was used for the haplotype analysis of the genes. Two-tailed P values were used and a P value less than 0.05 (P < 0.05) was considered statistically significant.
Results and Discussion
Frequency distribution of SLC47A1 gene polymorphism in South Indian healthy population and comparison with other ethnicities
The genotype frequencies were found to be in Hardy-Weinberg equilibrium (χ2 = 0.639). The allele and genotype frequencies of the SNP rs2289669 in SLC47A1 gene are given in Table 3.
Table 3.
Allele and genotype frequencies of SNP rs2289669 in SLC47A1 gene in healthy population
|
Allele (n = 204)
|
|
%
|
| A |
109 |
53.4 |
| G |
95 |
46.6 |
| Genotype (n = 102) |
|
|
| AG |
47 |
46.1 |
| AA |
31 |
30.4 |
| GG |
24 |
23.5 |
In the studied South Indian healthy population, the major allele was “A” with a frequency of 53.4% and minor allele was “G” with a frequency of 46.6%. All other ethnicities, as reported in the NCBI database, possessed “G” and “A” as the major and minor alleles, respectively. Hence, this was a notable finding from the study (Fig. 5).
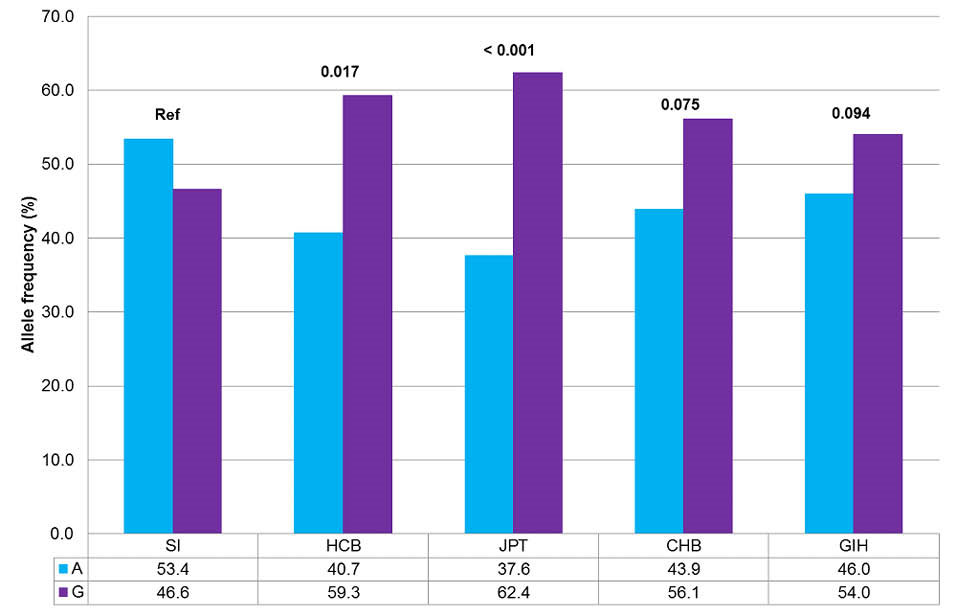
Fig. 5.
Comparison of allele frequencies of SNP rs2289669 between South Indian population and HapMap populations.
SI, South Indian; HCB, Hans Chinese in Beijing, China; JPT, Japanese in Tokyo, Japan; CHB, Hans Chinese in Beijing, China; GIH, Gujarat Indians in Houston, Texas. Fisher exact test was performed. *P < 0.05 was considered statistically significant.
.
Comparison of allele frequencies of SNP rs2289669 between South Indian population and HapMap populations.
SI, South Indian; HCB, Hans Chinese in Beijing, China; JPT, Japanese in Tokyo, Japan; CHB, Hans Chinese in Beijing, China; GIH, Gujarat Indians in Houston, Texas. Fisher exact test was performed. *P < 0.05 was considered statistically significant.
Similarly, the genotype frequencies of South Indian population were 46.1% for “AG” genotype, 30.4% for “AA” genotype, and 23.5% for “GG” genotype. Genotype and allele frequencies of South Indian population differed significantly from those of Hans Chinese in Beijing (HCB) [P = 0.017] and Japanese in Tokyo (JPT) [P < 0.001] populations.
9
Frequency distribution of SLC47A2 gene polymorphism in South Indian healthy population and comparison with other ethnicities
The allele and genotype frequencies of 102 healthy volunteers with SNP rs12943590 in SLC47A2 gene are given in Table 4. The “A” allele and “G” allele had a frequency of 47.5% and 52.5%, respectively. The genotype frequencies were found to be in Hardy-Weinberg equilibrium (χ2 = 1.409).
Table 4.
Allele and genotype frequencies of SNP rs12943590 in SLC47A2 gene in healthy population
|
Allele (n = 204)
|
|
%
|
| A |
97 |
47.5 |
| G |
107 |
52.5 |
| Genotype (n = 102) |
|
|
| AG |
45 |
44.1 |
| GG |
31 |
30.4 |
| AA |
26 |
25.5 |
The minor allele in healthy volunteers of South India was found to be “A”, similar to other populations. The genotype frequencies of South Indian population were 44.1% for “AG” genotype, 30.4% for “GG” genotype, and 25.5% for “AA” genotype. Genotype and allele frequencies of South Indian population differed significantly from those of Yoruba in Ibadan, Nigeria (YRI) [P < 0.001] and Utah residents with Northern and Western European ancestry (CEU) [P = 0.005] populations, though all these populations had “A” as the minor allele (Fig. 6).
10
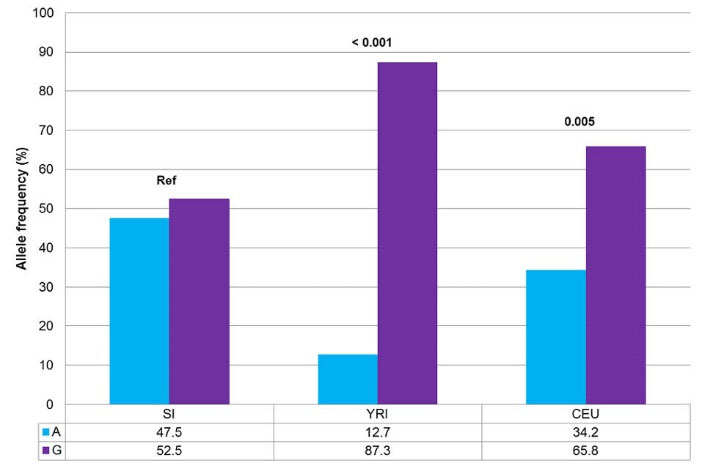
Fig. 6.
Comparison of allele frequencies of SNP rs12943590 between South Indian population and HapMap populations.
SI, South Indian; YRI, Yoruba in Ibadan, Nigeria; CEU, Utah residents with Northern and Western European ancestry. Fisher exact test was performed. *P < 0.05 was considered statistically significant.
.
Comparison of allele frequencies of SNP rs12943590 between South Indian population and HapMap populations.
SI, South Indian; YRI, Yoruba in Ibadan, Nigeria; CEU, Utah residents with Northern and Western European ancestry. Fisher exact test was performed. *P < 0.05 was considered statistically significant.
However, Stocker et al
11
reported similar genotype frequencies viz 47.4% of “GG” genotype, 38.6% of “GA” genotype, and 14% of “AA” genotype in their healthy volunteers study samples.
The frequencies of all the studied genotypes of SNPs rs2289669 in SLC47A1 gene and rs12943590 in SLC47A2 gene were found to be in Hardy-Weinberg equilibrium. Therefore, it can be reaffirmed that the studied subjects are non-consanguineous and also representative of the actual population.
Haplotype analysis
As both SLC47A1 and SLC47A2 genes are located at the same chromosome in close proximity, the likelihood of linkage disequilibrium between the SNPs (rs2289669 and rs12943590) was studied. The D’ (D prime) and r2 (correlation coefficient) of healthy population were 0.16 and 0.021, respectively (Fig. 7). This shows that chances of association between the studied SNPs are very minimal and recombination has occurred in the study populations. Thus, the haplotype analysis revealed that there was no linkage or association between two studied SNPs. Hence, the purpose of studying these SNPs is worthy though they are located contiguously in the same gene.
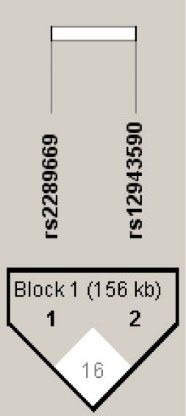
Fig. 7.
Linkage disequilibrium plot of SLC47A1 [SNP rs2289669] and SLC47A2 [SNP rs12943590] genes.
.
Linkage disequilibrium plot of SLC47A1 [SNP rs2289669] and SLC47A2 [SNP rs12943590] genes.
Polymorphisms in these genes could result in either ‘loss-of-function’ or ‘gain-of-function’ mutations resulting in altered function of the efflux transporters. As discussed earlier, studies which explored the correlations between the glycemic response to metformin and these SNPs were reported previously in other ethnicities. Studies of Becker et al,
12
Tkáč et al,
13
and He et al
14
are examples of the studies which reported significant association between the SNP rs2289669 and glycemic response. Similarly, Choi et al
15
and Stocker et al
11
concluded that those patients who were homozygous carriers of the minor “A” allele had a significantly poorer glycemic response than those patients with “GG/AG” genotypes in the SNP rs12943590. Whereas, trials by Klen et al
16
and Tarasova et al
17
did not find a significant association between the SNP rs2289669 and the metformin response.
The minor allele frequency (%) of the SNP rs2289669 in SLC47A1 gene in other ethnic populations is as follows: African-Americans (10.4), Caucasians/European Americans (42.7 to 45.6), Chinese Americans (46.4), Japanese (37.6), and Mexican Americans (49) (Table S1). The SNP rs12943590 in SLC47A2 gene had a minor allele frequency of 27.7%, 26.2%, 48.5%, 45.8%, and 34.1% in African-Americans, Caucasians/European Americans, Chinese Americans, Koreans, and Mexican Americans populations, respectively (Table S2).
18
Umamaheswaran et al
19
had previously studied the genetic distributions of the influx transporter, viz organic cation transporter 1 (OCT1) in South Indian population. In that study, the minor allele frequencies for the SNPs rs2282143, rs622342, and rs628031 were reported to be 8.9%, 24.5%, and 80.3%, respectively.
Conclusion
To the best of our knowledge, this study is the first of its kind to determine the allele and genotype frequencies of SNP rs2289669 in SLC47A1 gene (MATE1) and SNP rs12943590 in SLC47A2 gene (MATE2) in the ethnically distinct South Indian population. Hence, our study can function as a foundation for future studies to explore the association of metformin treatment response with these variants in SLC47A1 and SLC47A2 genes in the Dravidian South Indian population who have a characteristic genetic makeup.
Ethical approval
The approval was obtained from the Institute Ethics Committee (IEC) [No. JIP/IEC/SC/2014/1/541] and Research Monitoring Committee (RMC) [PGRMC/38/2013] of Jawaharlal Institute of Postgraduate Medical Education and Research (JIPMER), Puducherry, India, for the study. The study was conducted in accordance with principles of the Declaration of Helsinki following good clinical practice. All subjects were clearly explained about the details of the study in their native language and written informed consent was also obtained.
Competing interests
We declare no conflict of interests.
Acknowledgments
We wish to thank the Jawaharlal Institute of Postgraduate Medical Education and Research (JIPMER), Puducherry, India for providing us with the financial support through the intramural research grant (JIP/Res/Intra-MD/MS/01/2014 & JIP/Res/Intra-MD,MS/sec/05/2014) for conducting this study.
Supplementary materials
Supplementary file contains Fig. S1, Table S1 and Table S2.
()
Research Highlights
What is current knowledge?
simple
-
√ Genetic polymorphisms in the genes coding for the
efflux transporters are known to influence both the
pharmacodynamics and pharmacokinetics of many drugs
which act as substrates for these transporters.
-
√ As ethnical diversity partly determines how these genes
are expressed, we planned to study these SNPs in ethnically
distinct South Indian (Dravidian) population.
What is new here?
simple
-
√ The normative genotypic and allelic frequency distributions
in South Indian healthy population were established. Hence,
this study acts as the basis for further genetic association
studies between these variants and response to drugs which
utilize these transporters.
-
√ The studied SNPs could result in either hyper-functioning
(‘gain-of-function’) or hypo-functioning (‘loss-of-function’)
of the concerned efflux transporter causing an attenuated or
accentuated pharmacotherapeutic response, respectively.
References
-
Giacomini KM, Sugiyama Y. Membrane transporters and drug response. In: Goodman LS, Brunton LL, Chabner B, Knollmann BC, eds. Goodman & Gilman’s Pharmacological Basis of Therapeutics. 12th ed. New York: McGraw-Hill Education; 2011.
- Omote H, Hiasa M, Matsumoto T, Otsuka M, Moriyama Y. The MATE proteins as fundamental transporters of metabolic and xenobiotic organic cations. Trends Pharmacol Sci 2006; 27:587-93. doi: 10.1016/j.tips.2006.09.001 [Crossref] [ Google Scholar]
- Staud F, Cerveny L, Ahmadimoghaddam D, Ceckova M. Multidrug and toxin extrusion proteins (MATE/SLC47); role in pharmacokinetics. Int J Biochem Cell Biol 2013; 45:2007-11. doi: 10.1016/j.biocel.2013.06.022 [Crossref] [ Google Scholar]
- Mooij MG, Nies AT, Knibbe CAJ, Schaeffeler E, Tibboel D, Schwab M. Development of human membrane transporters: drug disposition and pharmacogenetics. Clin Pharmacokinet 2015; 55:507-24. doi: 10.1007/s40262-015-0328-5 [Crossref] [ Google Scholar]
- Damme K, Nies AT, Schaeffeler E, Schwab M. Mammalian MATE (SLC47A) transport proteins: impact on efflux of endogenous substrates and xenobiotics. Drug Metab Rev 2011; 43:499-523. doi: 10.3109/03602532.2011.602687 [Crossref] [ Google Scholar]
- Graham GG, Punt J, Arora M, Day RO, Doogue MP, Duong JK. Clinical pharmacokinetics of metformin. Clin Pharmacokinet 2011; 50:81-98. doi: 10.2165/11534750-000000000-00000 [Crossref] [ Google Scholar]
- Gong L, Goswami S, Giacomini KM, Altman RB, Klein TE. Metformin pathways: pharmacokinetics and pharmacodynamics. Pharmacogenet Genomics 2012; 22:820-7. doi: 10.1097/FPC.0b013e3283559b22 [Crossref] [ Google Scholar]
- Goswami S, Yee SW, Stocker S, Mosley JD, Kubo M, Castro R. Genetic variants in transcription factors are associated with the pharmacokinetics and pharmacodynamics of metformin. Clin Pharmacol Ther 2014; 96:370-9. doi: 10.1038/clpt.2014.109 [Crossref] [ Google Scholar]
-
National Center for Biotechnology Information. dbSNP. rs2289669. [updated 2015 Mar 12; cited 2016 Aug 22]. Available from: http://www.ncbi.nlm.nih.gov/projects/SNP/snp_ref.cgi?rs=2289669.
-
National Center for Biotechnology Information. dbSNP. rs12943590. [updated 2015 Mar 4; cited 2016 Aug 22]. Available from: http://www.ncbi.nlm.nih.gov/projects/SNP/snp_ref.cgi?rs=12943590.
- Stocker SL, Morrissey KM, Yee SW, Castro RA, Xu L, Dahlin A. The Effect of novel promoter variants in MATE1 and MATE2 on the pharmacokinetics and pharmacodynamics of metformin. Clin Pharmacol Ther 2013; 93:186-94. doi: 10.1038/clpt.2012.210 [Crossref] [ Google Scholar]
- Becker ML, Visser LE, van Schaik RHN, Hofman A, Uitterlinden AG, Stricker BHC. Genetic variation in the multidrug and toxin extrusion 1 transporter protein influences the glucose-lowering effect of metformin in patients with diabetes: A preliminary study. Diabetes 2009; 58:745-9. doi: 10.2337/db08-1028 [Crossref] [ Google Scholar]
- Tkáč I, Klimčáková L, Javorský M, Fabianová M, Schroner Z, Hermanová H. Pharmacogenomic association between a variant in SLC47A1 gene and therapeutic response to metformin in type 2 diabetes. Diabetes Obes Metab 2013; 15:189-91. doi: 10.1111/j.1463-1326.2012.01691.x [Crossref] [ Google Scholar]
- He R, Zhang D, Lu W, Zheng T, Wan L, Liu F. SLC47A1 gene rs2289669 G > A variants enhance the glucose-lowering effect of metformin via delaying its excretion in Chinese type 2 diabetes patients. Diabetes Res Clin Pract 2015; 109:57-63. doi: 10.1016/j.diabres.2015.05.003 [Crossref] [ Google Scholar]
- Choi JH, Yee SW, Ramirez AH, Morrissey KM, Jang GH, Joski PJ. A common 5′-UTR variant in MATE2-K is associated with poor response to metformin. Clin Pharmacol Ther 2011; 90:674-84. doi: 10.1038/clpt.2011.165 [Crossref] [ Google Scholar]
- Klen J, Goričar K, Janež A, Dolžan V. The role of genetic factors and kidney and liver function in glycemic control in type 2 diabetes patients on long-term metformin and sulphonylurea cotreatment. Biomed Res Int 2014; 2014:1-7. doi: 10.1155/2014/934729 [Crossref] [ Google Scholar]
- Tarasova L, Kalnina I, Geldnere K, Bumbure A, Ritenberga R, Nikitina-Zake L. Association of genetic variation in the organic cation transporters OCT1, OCT2 and multidrug and toxin extrusion 1 transporter protein genes with the gastrointestinal side effects and lower BMI in metformin-treated type 2 diabetes patients. Pharmacogenet Genomics 2012; 22:659-66. doi: 10.1097/FPC.0b013e3283561666 [Crossref] [ Google Scholar]
- Nies AT, Damme K, Kruck S, Schaeffeler E, Schwab M. Structure and function of multidrug and toxin extrusion proteins (MATEs) and their relevance to drug therapy and personalized medicine. Arch Toxicol 2016; 90:1555-84. doi: 10.1007/s00204-016-1728-5 [Crossref] [ Google Scholar]
- Umamaheswaran G, Praveen RG, Arunkumar AS, Das AK, Shewade DG, Adithan C. Genetic analysis of OCT1 gene polymorphisms in an Indian population. Indian J Hum Genet 2011; 17:164-8. doi: 10.4103/0971-6866.92094 [Crossref] [ Google Scholar]