BioImpacts. 6(1):41-47.
doi: 10.15171/bi.2016.06
Original Article
CFD simulation of blood flow inside the corkscrew collaterals of the Buerger’s disease
Alireza Sharifi 1, 2, *, Mohammad Charjouei Moghadam 1, 2
Author information:
1Department of Mechanical Engineering, Ferdowsi University of Mashhad, Mashhad, Iran
2Research Center for Biomedical Engineering, Ferdowsi University of Mashhad, Mashhad, Iran
Abstract
Introduction:
Buerger’s disease is an occlusive arterial disease that occurs mainly in medium and small vessels. This disease is associated with Tobacco usage. The existence of corkscrew collateral is one of the established characteristics of the Buerger’s disease.
Methods:
In this study, the computational fluid dynamics (CFD) simulation of blood flow within the corkscrew artery of the Buerger’s disease is conducted. The geometry of the artery is constructed based on the actual corkscrew artery of a patient diagnosed with the Buerger’s disease. The blood properties are the same as the actual blood properties of the patient. The blood flow rate is taken from the available experimental data in the literature.
Results:
The local velocity patterns, pressure and kinematic viscosity distributions in different segments of the corkscrew collateral artery was demonstrated and discussed for the first time for this kind of artery. The effects of non-Newtonian consideration for the blood viscosity behavior were investigated in different segments of the artery. Moreover, the variations of the blood flow patterns along the artery were investigated in details for each segment.
Conclusion:
It was found that the flow patterns were affected by the complex geometry of this artery in such a way that it could lead to the presence of sites that were prone to the accumulation of the flowing particles in blood like nicotine. Furthermore, due to the existence of many successive bends in this artery, the variations of kinematic viscosity along this artery were significant, therefore the non-Newtonian behavior of the blood viscosity must be considered.
Keywords: Blood flow patterns, Buerger’s disease, Corkscrew collateral, Non-Newtonian viscosity, Numerical modelling
Copyright and License Information
© 2016 The Author(s)
This work is published by BioImpacts as an open access article distributed under the terms of the Creative Commons
Attribution License (
http://creativecommons.org/licenses/by-nc/4.0/). Non-commercial uses of the work are permitted, provided the original work is properly cited.
Introduction
Thromboangiitis obliterans (TAO) or Buerger’s disease is an inflammatory, occlusive disease of small and medium-sized arteries and veins that involves distal vessels of the extremities.
1
In this disease, the arteries and veins in various parts become inflamed and blocked.
2
This condition leads to the poor circulation of the blood to the lower organs which is known as ischemia. Following the ischemia and limb pain, the organ is less tolerable to the activities. In the more advanced stages of the disease, pain, ulcer and blackening of the extremities may result in the “gangrene” that could eventually lead to the amputation.
3
Several factors including tobacco usage, sex hormones, bacterial-viral etiology, environmental conditions and genetics are mentioned as the potential mechanisms behind the development of the disease; yet the etiology of the Buerger’s disease is still unclear.
4
It is shown however that all of the patients suffering from Buerger’s disease are exposed to tobacco smoking,
5,6
thus complete cessation of tobacco usage is necessary in order to slow the progression of the disease and avoid amputation.
The literature on Buerger’s disease suffers from the lack of definite universally accepted criteria establishing the diagnosis.
7
One of the established characteristic features of the Buerger’s disease is the recanalization of the thrombosed vessel and the presence of the corkscrew collateral around areas of segmental occlusion.
8,9
Corkscrew collateral arteries are developed by severe stenosis and occlusion of native arteries as neo-endovascularization.
4
Corkscrew collaterals are in different types and sizes. Fujii et al
10
classified the corkscrew collateral arteries based on the artery amplitudes. They found out that there is a relationship between the clinical severity of the Buerger’s disease and type of the corkscrew collateral arteries. In another study,
4
the flow-mediated vasodilation was compared in the native artery and the corkscrew collateral artery of the patients with Buerger’s disease.
The combination of abnormal blood patterns and genetic predisposition could lead to the pathological formation of aneurysms.
11
Formation and evolution or even rupture of aneurysms are directly related to their wall shear stress.
12
Lots of studies are concerned with the effects of blood flow patterns on stenting arteries and it was found that the hemodynamic can change by using different stent geometries, therefore the risky sites which is prone to stenosis can change as well.
13
Considering the above discussion, the study of blood flow within the corkscrew collateral arteries in Buerger’s disease is of great importance since it may lead to the better understanding of the disease progression and its possible prevention. The conventional color Doppler method is unable to document the blood flow within tiny vessels because of the low resolution and low frame rates.
14
There are more effective methods like advanced dynamic flow imaging, however these methods are incapable of investigating some of the effective parameters on blood flow like local axial velocity patterns, pressure distribution, and viscosity variations. The mathematical simulation of the blood flow within a Buerger’s corkscrew collateral does not have the mentioned limitations while it can provide accurate realization of the flow regime inside the artery. Having reviewed the literature, the authors found that, although some studies like those of Fujii et al
4,10
attempted to study the flow-related effects on the corkscrew collaterals, there has not been any numerical study on the blood flow inside the corkscrew collaterals of the Buerger’s disease.
In the present study, the computational fluid dynamics (CFD) simulation of the blood flow within the corkscrew collateral artery of the Buerger’s disease is performed. The geometrical modeling of the artery is obtained based on the actual configurations of the corkscrew collateral of a 40 year old male patient with the Burger’s disease. Fig. 1 is the CT-angiography image of the patient’s leg. The location of the corkscrew artery is represented by red dots. The blood properties that are used in the presented simulation are the same as the actual blood properties of the patient. Flow patterns, velocity contours, pressure and kinematic viscosity in different segments of the corkscrew artery are studied and discussed further in the results and discussion section.
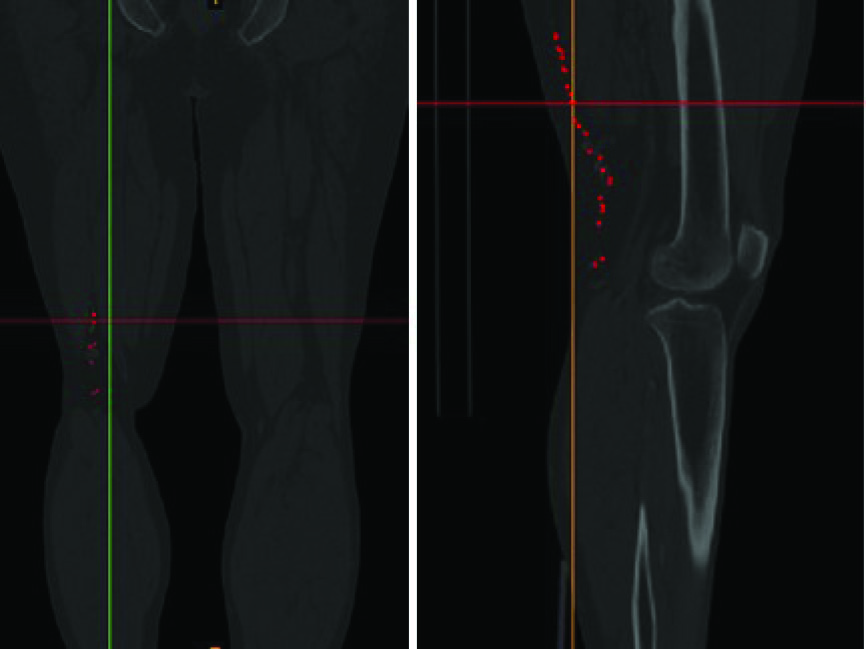
Fig. 1
.
The CT-angiography of the patient’s leg. The location of corckscrew collaterals are displayed by red dots.
.
The CT-angiography of the patient’s leg. The location of corckscrew collaterals are displayed by red dots.
Materials and methods
Physical models and governing equations
Real geometry of the artery was constructed based on the CT-angiography images of a 40 year old male heavy smoker patient who was diagnosed with the Buerger’s disease in one of Mashhad hospitals. In order to achieve a more accurate geometry of the corkscrew. As it is demonstrated in Fig. 2, this artery has many curvatures with lots of non-planarities that causes the blood flow to have a complex pattern.
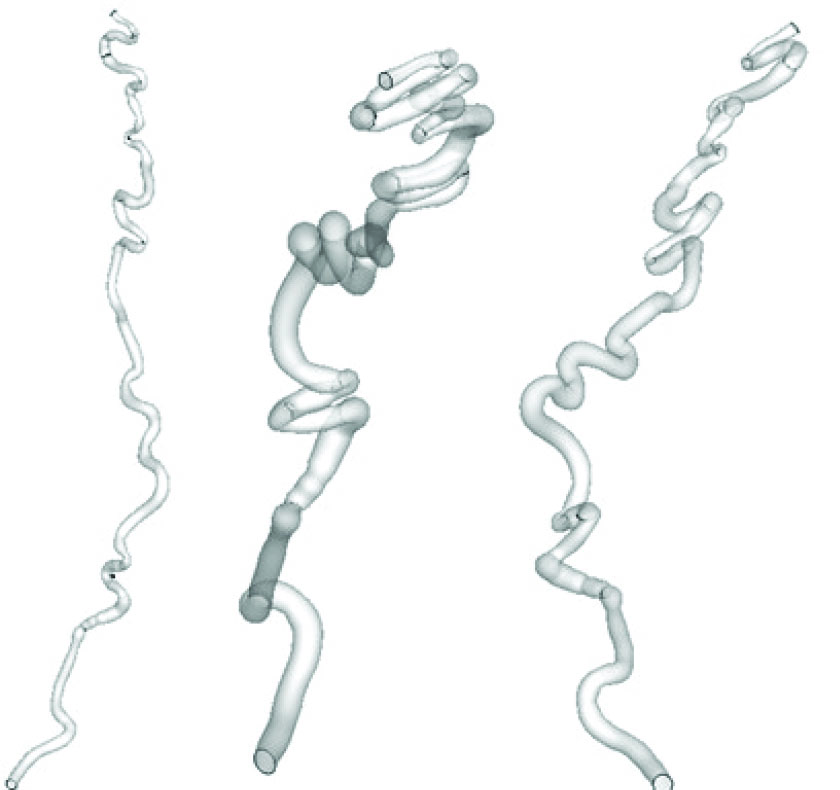
Fig. 2.
The geometry of corkscrew from different views. It has a complex geometry consisting of successive non planar bends.
.
The geometry of corkscrew from different views. It has a complex geometry consisting of successive non planar bends.
The governing equations are continuity and Navier–Stokes equation expressed as:
(Eq. 2)
Where
is the velocity vector, P is pressure, µ is dynamic viscosity of blood, and ρ is density. Velocity inlet boundary condition is applied at the inlet of the artery where the blood is pumped with the volumetric flow rate of 40 ml/min. In the present study, the blood properties that are used in the simulation are based on the actual properties of the patient’s blood sample. The blood is considered as an incompressible fluid with the density of ρ=1056 kg/m3 and the vessel walls are assumed rigid with non-slip condition.
It is commonly believed that the influence of shear thinning properties of blood can be neglected for the flow in large arteries,
15,16
however, in arteries with acute curvature such as the presented case, the shear thinning effects should be considered. Moreover, the blood properties of a heavy smoker make it to behave as a non-Newtonian fluid. In this study, the shear thinning is accounted for by employing the Carreau-Yasuda model.
17
(Eq. 3)
In Eq. 3,
and
represent low and high viscosities, respectively.
is shear rate. Constant parameters a, n, λ and control how the fluid behaves in the non-Newtonian regime between these two viscosity values. The model parameters are taken from
18
as
and
=0.1600 Pa s,
=0.0048 Pa s, λ=0.110 s, a=0.64, and n=0.2128.
Numerical method and validations
The governing equations are solved by the open source software Open FOAM. Non-Newtonian blood behavior is modeled by standard solver non-Newtonian ICO Foam. ICO FOAM is a solver for incompressible, laminar flow which works based on PISO (pressure-implicit splitting operator) algorithm. In order to validate the blood flow with the available data in the literature, the experimental results of
19
through a 90 degree bend with the radius of 4 mm and curvature radius of 24 mm was used. As shown in Fig. 3, the axial velocity profiles at different cross sections are in good agreement with the laser Doppler experimental results in Reynolds number of 300.
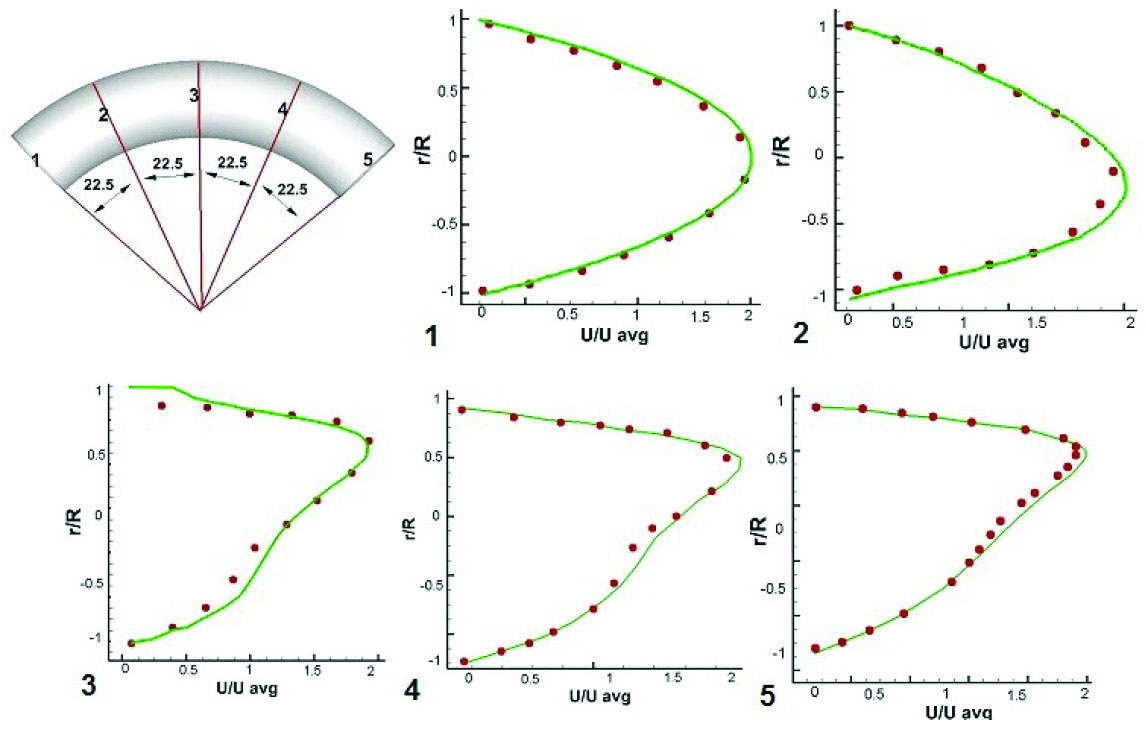
Fig. 3
.
Velocity validation. Spots represent the experimental data of Van de Vosse et al.
19
Solid lines indicate the numerically obtained profiles.
.
Velocity validation. Spots represent the experimental data of Van de Vosse et al.
19
Solid lines indicate the numerically obtained profiles.
Extensive computations were performed to identify the number of grid points that produce reasonably grid-independent results. It was found that the minimum grid cells of 390000 are required. Due to the length and complexity of the corkscrew geometry, it is necessary to divide the geometry into 10 parts and create grid network for each part separately, then by connecting these parts together the whole geometry mesh is formed.
Results
Since the important features of the flow patterns happen at the artery bends and due to its lengthiness, the artery is divided into three segments (a, b, and c) to present results in each segment separately. The artery and its segments are depicted in Fig. 4. The first segment (a) starts from the inlet and consists of six cross sections that are mostly located at the bends in order to investigate flow in these areas. Segment (b) starts from the end of segment (a) and consists of 9 bends as well as 9 cross sections at these bends (Fig. 4). Segment (c) is the final segment of the artery and it is started from the end of segment (b) to the outlet. It has six curves and six cross sections as well (Fig. 4). Flow patterns will be discussed along these cross sections later. All of the results are discussed for each of these different sections separately. The kinematic viscosity is provided in Fig. 5. While the blood flow distribution for each of the artery segments along with the axial velocity profiles are provided in Figs. 6-9. At the end, the pressure distribution
is given in Fig. 10. The detailed discussions for each of the mentioned results are provided in the following discussion section.
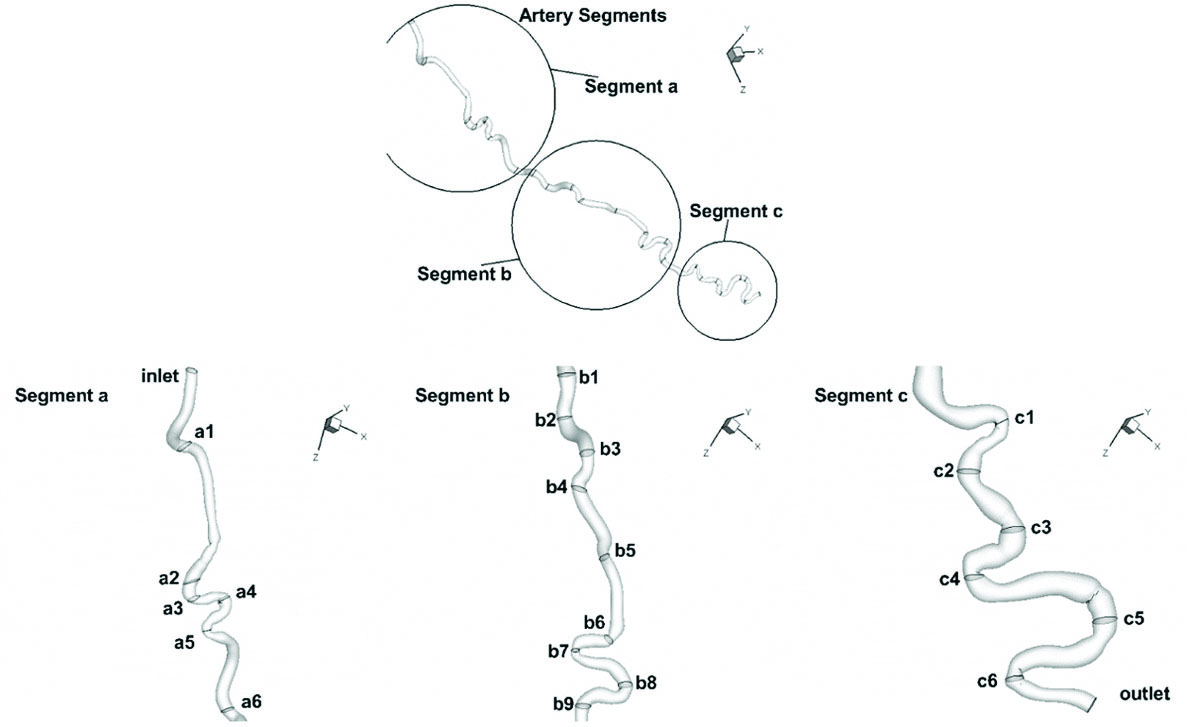
Fig. 4
.
Corkscrew geometry divided into three segments (a, b, and c). Cross sections for each segment are designated by numbers.
.
Corkscrew geometry divided into three segments (a, b, and c). Cross sections for each segment are designated by numbers.
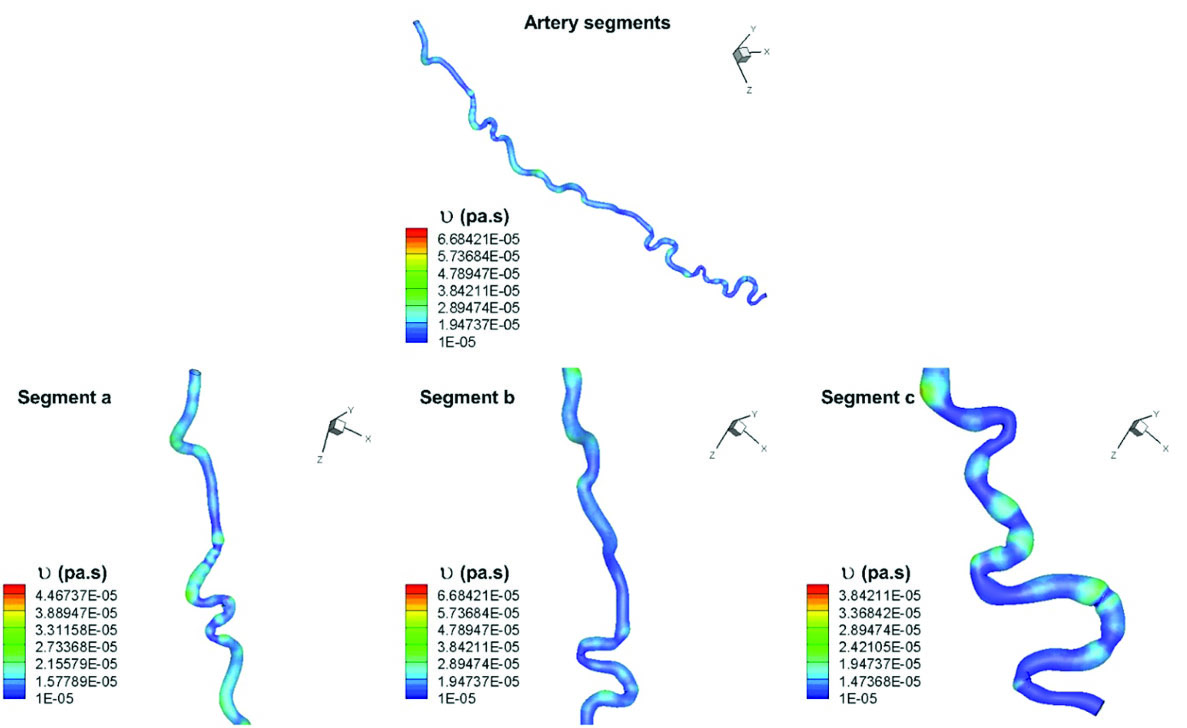
Fig. 5
.
Kinematic viscosity distribution in different segments of the artery.
.
Kinematic viscosity distribution in different segments of the artery.
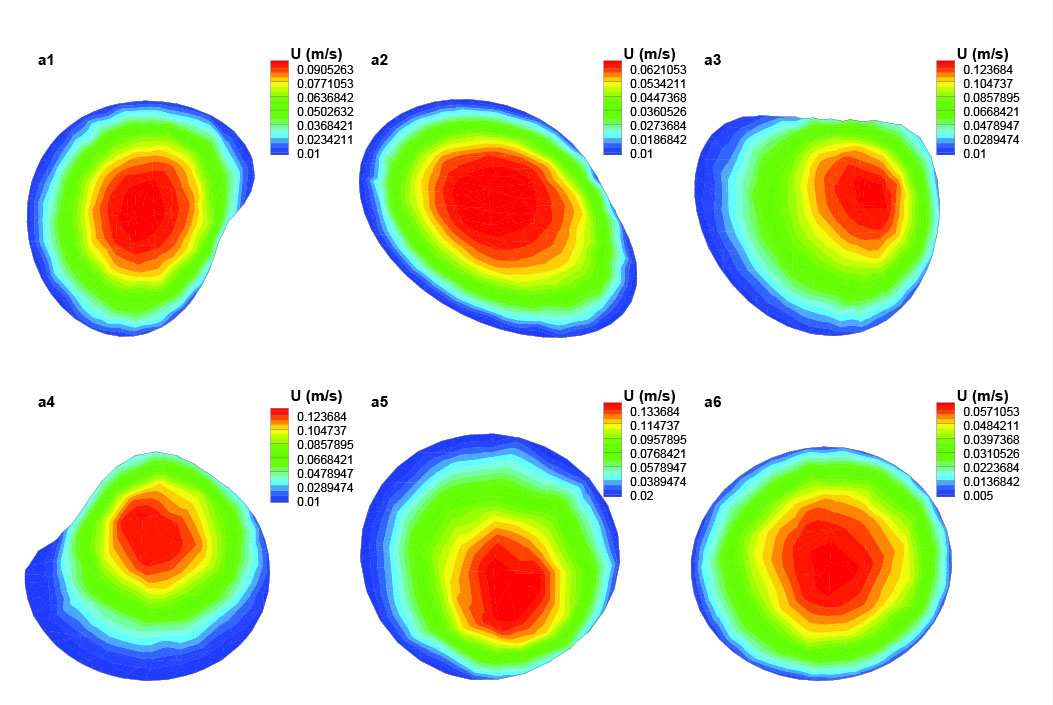
Fig. 6
.
Axial velocity distribution in different cross sections of the segment (a) of the artery.
.
Axial velocity distribution in different cross sections of the segment (a) of the artery.
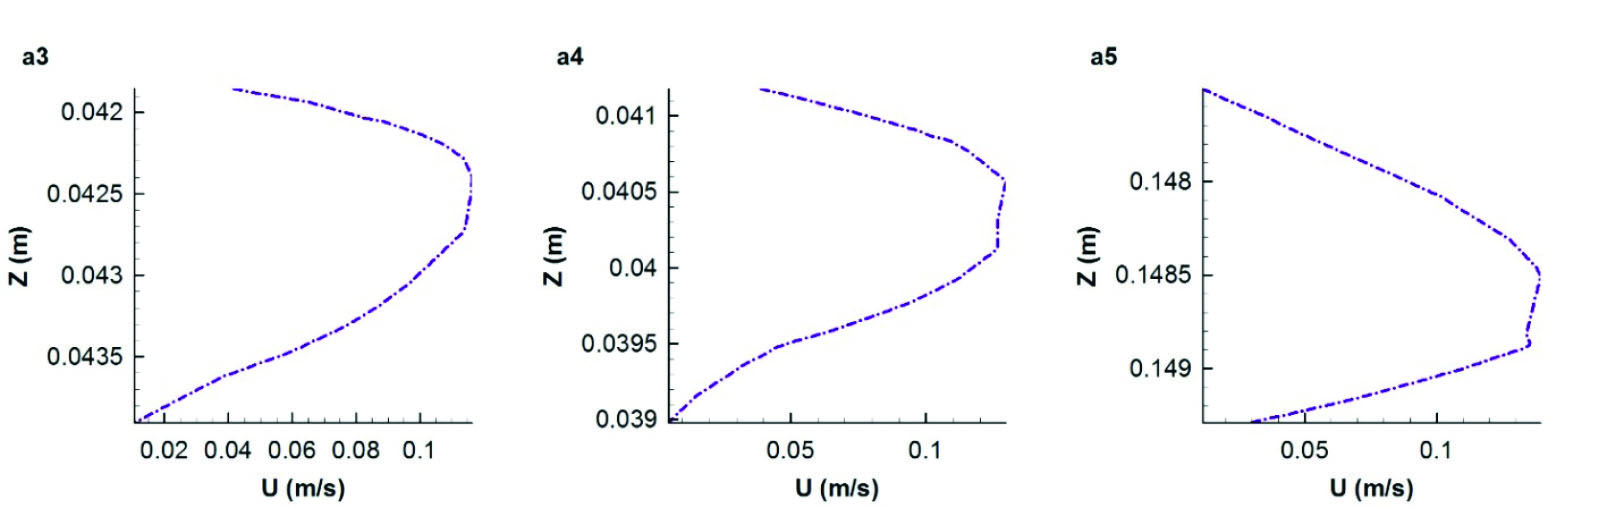
Fig. 7
.
Axial velocity profile along the diameter of three cross sections a3, a4, and a5 of the segment (a).
.
Axial velocity profile along the diameter of three cross sections a3, a4, and a5 of the segment (a).
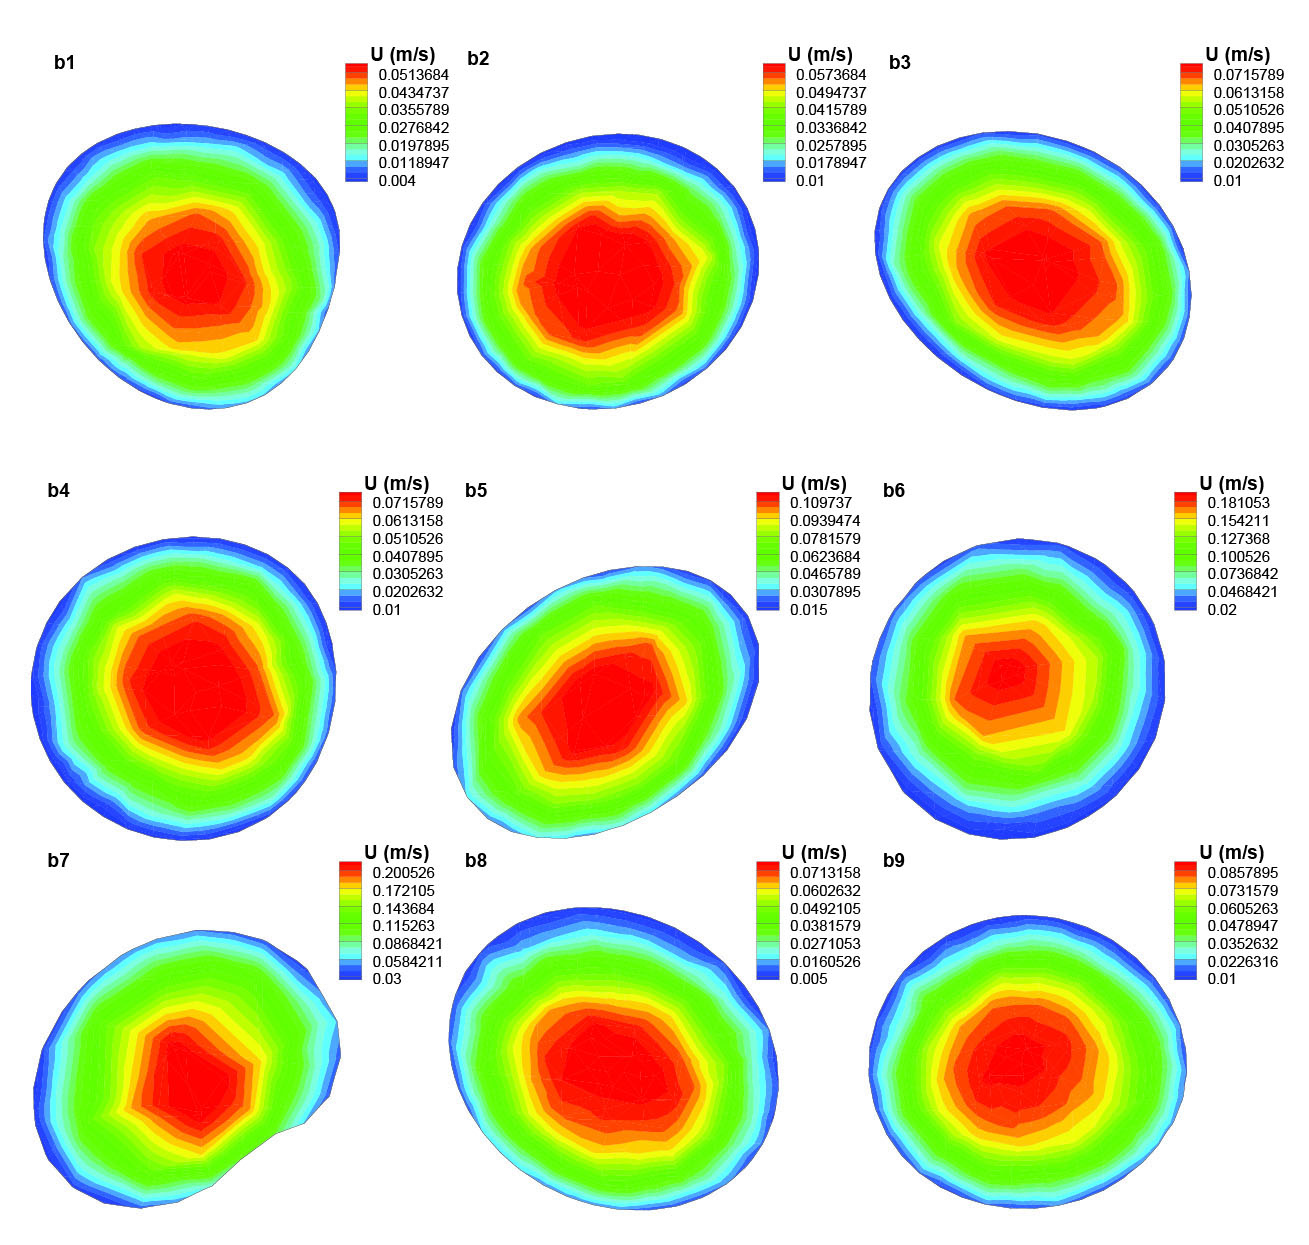
Fig. 8
.
Axial velocity distribution in different cross sections of the segment (b) of the artery.
.
Axial velocity distribution in different cross sections of the segment (b) of the artery.
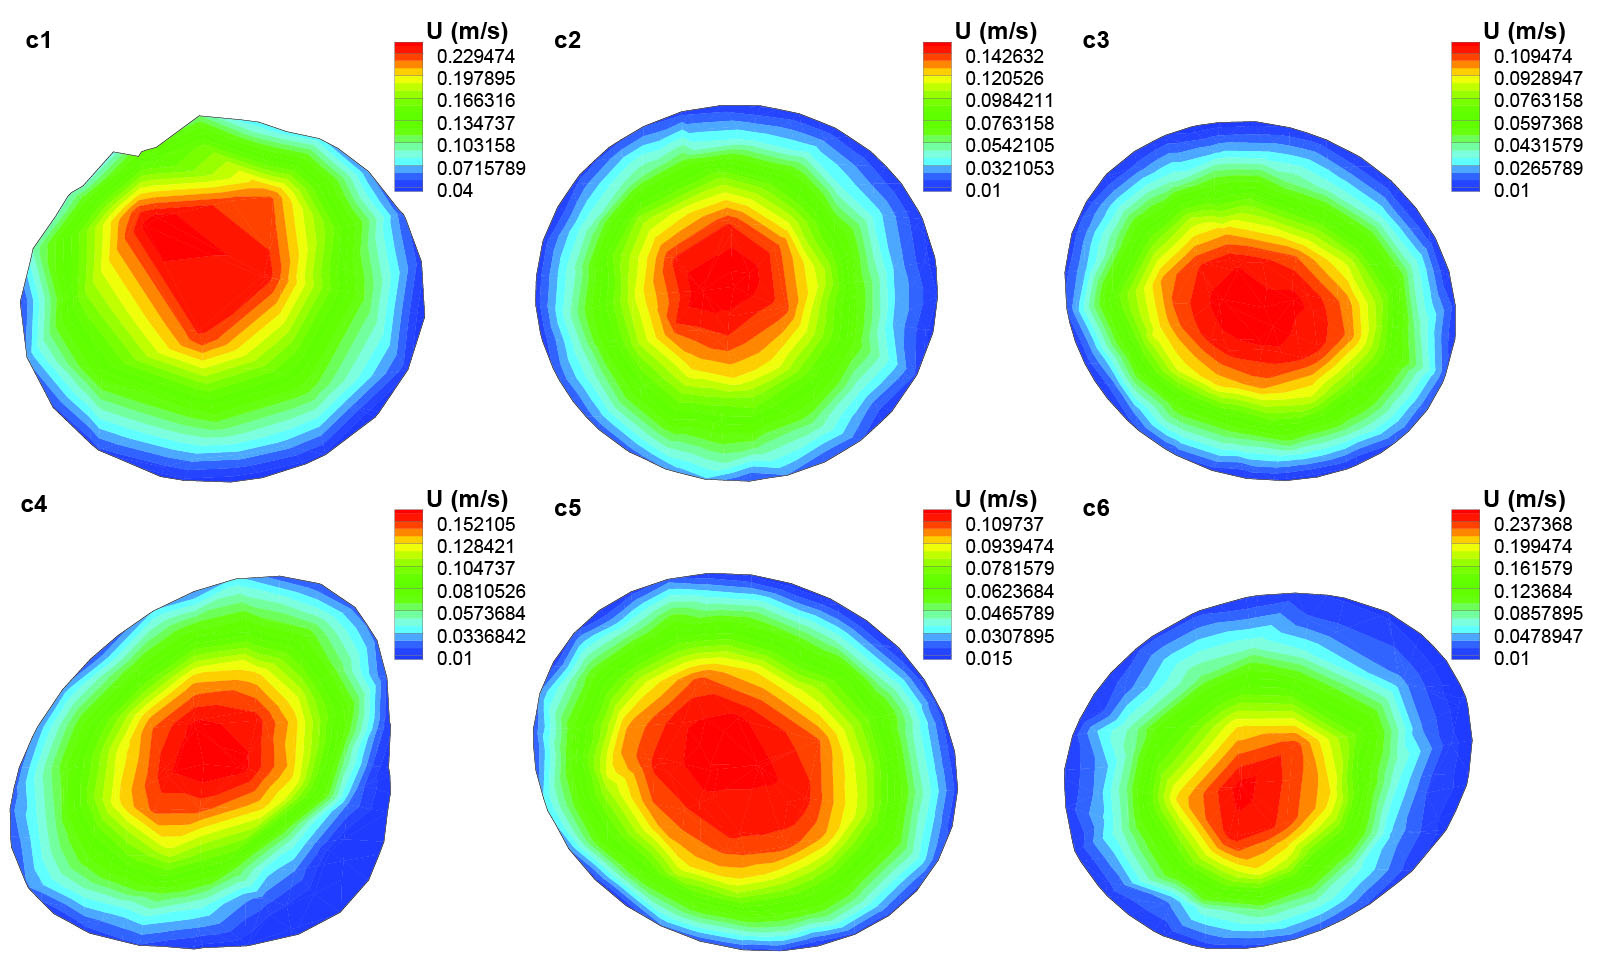
Fig. 9
.
Axial velocity distribution in different cross sections of the segment (c) of the artery.
.
Axial velocity distribution in different cross sections of the segment (c) of the artery.
Fig. 10
.
Pressure distribution in different segments of the artery.
Fig. 10
.
Pressure distribution in different segments of the artery.
Discussion
Kinematic viscosity distribution
Kinematic viscosity is the ratio of the dynamic viscosity μ to the blood density. Blood behaves as a non-Newtonian fluid but it is mostly assumed as Newtonian fluid in large arteries (arteries with diameter greater than 1 mm). This artery is categorized as a large artery but since it consists of many successive bends, therefore shear tinning behavior of blood becomes significant. Moreover, due to the blood properties which are those of a heavy smoker, in the present study, blood non-Newtonian behavior must be considered. As it is obvious from Fig. 5, there are significant changes in blood viscosity through this artery. It demonstrates the non-Newtonian behavior of blood flow through corkscrews. Sites that are designated with dark blue color are locations where blood has less viscosity and in the places with yellow-red color, it can be seen that blood has higher viscosities; therefore, in segment (a) blood has more viscosity as compared with segment (b).
Blood flow distribution
Segment (a) is the first section of the artery and it consists of 6 cross sections. As it is shown in Fig. 6, in these cross sections, the axial velocity contours of blood are displayed and the amount of velocity is specifically determined in each cross section. Fig. 6 shows that the blood flow has a fully developed profile in cross section a1. The maximum value for axial velocity occurs in the center which decreases as it tends to the artery wall. This velocity profile remains the same in cross section a2. Cross sections a3-a5 are located in two successive bends with sharp curvature that affects the blood flow distribution as a result of centrifugal forces. In cross section a3 and a4, the maximum axial velocity occurs at the outer wall of the bend. The inner wall experienced axial velocity values close to zero which increases the chance for the flowing particles in blood like nicotine to settle on artery walls. In the next bend (a6 cross section) there is an opposite trend due to the changing of the bend curvature in the opposite direction. Thus, this time the bend outer wall is faced with minimum axial velocity values.
In order to have a more detailed view of the axial velocity profile on three cross sections of a3-a5, they have been plotted along the diameter of these sections from inner side on the cross section to the outer (Fig. 7). Axial velocity profile in cross section a3 shows that the maximum axial velocity is almost located close to the outer wall of the bend and this trend remains the same for the next cross section a4. However in cross section a4, because of the primary effect of the next bend, axial velocity profile declines to the inner wall of the bend. Axial velocity profile of cross section a5 which is shown in Fig. 7 illustrates that the maximum axial velocity is located close to the inner side of the bend as it is still affected by the previous bend.
Fig. 8 shows the axial velocity distribution of blood flow in different cross sections of the segment (b). Because this segment does not have large bends and the Reynolds number is small (blood viscosities of heavy smokers are higher than those of non-smokers and the blood flow rate within this narrow artery is too low), the blood flow velocity profile is mostly the same in all these cross sections through most of this segment. As it is obvious from Fig. 8, the flow rate through the artery is constant but as the area of the cross sections are varied along the artery, the amount of blood flow velocity can be different depending on the area of the cross section; therefore, the velocity increases in b6 and b7 as a result of their smaller cross section area.
Blood flow distribution in segment (c) of the corkscrew is shown in Fig. 9. In most of this segment, the blood flow has a parabolic profile and its maximum values occur at the center of the respected cross sections except for the cross section c1, which occurs at the outer wall of the artery under the effect of its previous bend. In segment (c), the flow velocity in large areas around the artery wall experiences really low values that causes the existence of sites which are more prone to the accumulated nicotine particles. Blue color indicating the lowest velocity is observed in most of the areas of cross sections C4 and c6 while they are mostly affected by the large bends and their centrifugal forces to push the maximum velocity to the outer wall of the bend.
Pressure
Pressure distribution is seen in Fig. 5. It is obvious that the pressure decreases along the artery. This artery has many successive bends that reduce the pressure along its length. This pattern for pressure distribution is almost obvious in all of the arteries in human body which consists of lots of bends along its axial direction.
20
To have an accurate understanding of pressure drop in each segment, they are separately presented. As shown, the most pressure drop happens in segment (c). The pressure range is more than 0.7 pa; it is because of multiple successive large bends.
Conclusion
The CFD simulation of the blood flow within the corkscrew collateral artery of the Buerger’s disease was implemented for the first time in this artery. The geometry of the corkscrew collateral was created based on the CT-angiography images of a patient diagnosed with the Buerger’s disease. The blood properties that are used in the presented modeling are the same as the blood properties of a heavy smoker patient suffering from the Buerger’s disease. The blood flow rate is taken from the available experimental measurements of the literature. The artery was divided into three segments and the blood flow patterns, pressure distribution, and kinematic viscosity variations were investigated along the artery. It was found that due to the variations of the viscosity along the artery with the multiple successive bends such as this one, the blood viscosity behavior must be considered non-Newtonian as it was done so in this study. Furthermore, the pressure distribution was investigated and it was found that the amount of pressure drop is different in different segments of the artery. Moreover, since the geometry of the corkscrew artery is very complex, it affects the blood flow patterns that could lead to the existence of some potential sites that are prone to the accumulations of the flowing particles in blood like nicotine in those places.
Ethical approval
All human and animal studies have been approved by the Razavi Hospital ethics committee and have therefore been performed in accordance with the ethical standards laid down in the 1964 Declaration of Helsinki and its later amendments. All persons gave their informed consent prior to their inclusion in this study.
Competing of interests
The authors whose names are listed immediately below certify that they have no affiliations with or involvement in any organization or entity with any financial interest (such as honoraria; educational grants; participation in speakers’ bureaus; membership, employment, consultancies, stock ownership, or other equity interest; and expert testimony or patent-licensing arrangements), or non-financial interest (such as personal or professional relationships, affiliations, knowledge or beliefs) in the subject matter or materials discussed in this manuscript.
Research Highlights
What is current knowledge?
simple
-
√ Buerger’s disease is an inflammatory, occlusive disease of small and medium-sized arteries and veins.
-
√ The etiology of the Buerger’s disease remains unclear.
-
√ All of the patients suffering from Buerger’s disease are exposed to tobacco smoking.
-
√ Presence of the corkscrew collaterals around the areas of occlusion is an established feature of the Buerger’s disease.
-
√ There is a relationship between the severity of the Buerger’s disease and the features of the corkscrew collateral artery.
What is new here?
simple
-
√ The first CFD simulation of blood flow inside the Buerger’s disease corkscrew artery is performed.
-
√ Geometry, blood properties, and flow rate are those of the patient with the disease.
-
√ Presence of sites with the accumulation of particles like nicotine is identified.
-
√ The non-Newtonian viscosity changes in different segments of the artery are studied.
-
√ Pressure distributions along the different segments of the artery are investigated.
References
- Szuba A, Cooke JP. Thromboangiitis obliterans An update on Buerger’s disease. West J Med 1998; 168:255. [ Google Scholar]
- Adar R, Papa MZ, Halpern Z, Mozes M, Shoshan S, Sofer B. Cellular sensitivity to collagen in thromboangiitis obliterans. N Engl J Med 1983; 308:1113-6. [ Google Scholar]
- Puéchal X, Fiessinger JN. Thromboangiitis obliterans or Buerger’s disease: challenges for the rheumatologist. Rheumatology 2007; 46:192-9. doi: 10.1093/rheumatology/kel388 [Crossref] [ Google Scholar]
- Fujii Y, Fujimura N, Mikami S, Maruhashi T, Kihara Y, Chayama K. Flow-mediated vasodilation is augmented in a corkscrew collateral artery compared with that in a native artery in patients with thromboangiitis obliterans (Buerger disease). Journal of Vascular Surgery 2011; 54:1689-97. doi: 10.1016/j.jvs.2011.05.095 [Crossref] [ Google Scholar]
- Mills JL, Taylor LM, Porter JM. Buerger’s disease in the modern era. Am J Surg 1987; 154:123-9. doi: 10.1016/0002-9610(87)90301-1 [Crossref] [ Google Scholar]
- Shionoya S, Leu H, Lie J. Buerger’s disease (thromboangiitis obliterans). Vascular Surgery 1995; 4:235-45. doi: 10.5005/jp/books/11922_4 [Crossref] [ Google Scholar]
- Lazarides M, Georgiadis G, Papas T, Nikolopoulos E. Diagnostic criteria and treatment of Buerger’s disease: a review. Int J Low Extrem Wounds 2006; 5:89-95. doi: 10.1177/1534734606288817 [Crossref] [ Google Scholar]
- Shionoya S. Diagnostic criteria of Buerger’s disease. Int J Cardiol 1998; 66:S243-S5. doi: 10.1016/s0167-5273(98)00175-2 [Crossref] [ Google Scholar]
- Olin JW. Thromboangiitis obliterans (Buerger’s disease). N Engl J M 2000; 343:864-9. doi: 10.1016/s0167-5273(98)00175-2 [Crossref] [ Google Scholar]
- Fujii Y, Soga J, Nakamura S, Hidaka T, Hata T, Idei N. Classification of Corkscrew Collaterals in Thromboangiitis Obliterans (Buerger’s Disease)-Relationship Between Corkscrew Type and Prevalence of Ischemic Ulcers. Circulation J 2010; 74:1684-8. doi: 10.1253/circj.cj-09-0878 [Crossref] [ Google Scholar]
- Shojima M, Oshima M, Takagi K, Torii R, Hayakawa M, Katada K. Magnitude and role of wall shear stress on cerebral aneurysm computational fluid dynamic study of 20 middle cerebral artery aneurysms. Stroke 2004; 35:2500-5. doi: 10.1161/01.str.0000144648.89172.0f [Crossref] [ Google Scholar]
- Jou LD, Lee D, Morsi H, Mawad M. Wall shear stress on ruptured and unruptured intracranial aneurysms at the internal carotid artery. Am J Neuroradiol 2008; 29:1761-7. doi: 10.3174/ajnr.a1180 [Crossref] [ Google Scholar]
- Takizawa K, Schjodt K, Puntel A, Kostov N, Tezduyar TE. Patient-specific computer modeling of blood flow in cerebral arteries with aneurysm and stent. Comput Mech 2012; 50:675-86. [ Google Scholar]
- Yoshimuta T, Akutsu K, Okajima T, Tamori Y, Kubota Y, Takeshita S. Corkscrew collaterals in Buerger’s disease. Can J Cardiol 2009; 25:365. doi: 10.1016/s0828-282x(09)70099-6 [Crossref] [ Google Scholar]
- Perktold K, Peter R, Resch M, Langs G. Pulsatile non-Newtonian blood flow in three-dimensional carotid bifurcation models: a numerical study of flow phenomena under different bifurcation angles. J Biomed Engin 1991; 13:507-15. doi: 10.1016/0141-5425(91)90100-l [Crossref] [ Google Scholar]
-
Cho YI, Kensey KR. Effects of the non-Newtonian viscosity of blood on flows in a diseased arterial vessel. Part 1: Steady flows. Biorheology 1991; 241-62.
-
Bird RB, Armstrong R, Hassager O. Dynamics of polymeric liquids. Vol. 1. Fluid mechanics; 1987.
- Abraham F, Behr M, Heinkenschloss M. Shape optimization in steady blood flow: a numerical study of non-Newtonian effects. Comput Methods Biomech Biomed Engin 2005; 8:127-37. [ Google Scholar]
- Van de Vosse F, Van Steenhoven A, Segal A, Janssen J. A finite element analysis of the steady laminar entrance flow in a 90 curved tube. Int J Numer Methods Fluids 1989; 9:275-87. doi: 10.1002/fld.1650090304 [Crossref] [ Google Scholar]
- Zhang C, Xie S, Li S, Pu F, Deng X, Fan Y. Flow patterns and wall shear stress distribution in human internal carotid arteries: the geometric effect on the risk for stenoses. J Biomech 2012; 45:83-9. doi: 10.1016/j.jbiomech.2011.10.001 [Crossref] [ Google Scholar]