Bioimpacts. 7(3):147-153.
doi: 10.15171/bi.2017.18
Original Research
Investigation of the binding mechanism and inhibition of bovine liver catalase by quercetin: Multi-spectroscopic and computational study
Samaneh Rashtbari 1, Gholamreza Dehghan 1, *, Reza Yekta 1, Abolghasem Jouyban 2
Author information:
1Department of Biology, Faculty of Natural Sciences, University of Tabriz, Tabriz, Iran
2Pharmaceutical Analysis Research Center and Faculty of Pharmacy, Tabriz University of Medical Sciences, Tabriz, Iran
Abstract
Introduction:
The study on the side effects of various drugs and compounds on enzymes is a main issue for monitoring the conformational and functional changes of them. Quercetin (3,5,7,3ʹ,4ʹ-pentahydroxyflavone, QUE), a polyphenolic flavonoid, widely found in fruits, vegetables and it is used as an ingredient in foods and beverages. The interaction of bovine liver catalase (BLC) with QUE has been studied in this research by using different spectroscopic methods.
Methods:
In this work, the interaction of QUE with BLC was investigated using different spectroscopic methods including ultraviolet-visible (UV-vis) absorption, circular dichroism (CD) and fluorescence spectroscopy and molecular docking studies.
Results:
Fluorescence data at different temperatures, synchronous fluorescence and CD studies revealed conformational changes in the BLC structure in the presence of different concentration of QUE. Also, the fluorescence quenching data showed that QUE can form a non-fluorescent complex with BLC and quench its intrinsic emission by a static process. The binding constant (Ka) for the interaction was 104, and the number of binding site was obtained ~1. The ∆H, ∆S and ∆G changes were obtained, indicating that hydrophobic interactions play a main role in the complex formation. In vitro kinetic studies revealed that QUE can inhibit BLC activity through non-competitive manner. Molecular docking study results were in good agreement with experimental data, confirming only one binding site on BLC for QUE at a cavity among the wrapping domain, threating arm and β-barrel.
Conclusion:
Inhibition of BLC activity upon interaction with QUE demonstrated that in addition to their beneficial effects, they should not be overlooked for their side effects.
Keywords: Bovine liver catalase, Flavonoid, Molecular docking, Non-competitive inhibition, Quercetin, Static quenching
Copyright and License Information
© 2017 The Author(s)
This work is published by BioImpacts as an open access article distributed under the terms of the Creative Commons Attribution License (
http://creativecommons.org/licenses/by-nc/4.0/). Non-commercial uses of the work are permitted, provided the original work is properly cited.
Introduction
Catalase (H2O2:H2O2 oxidoreductase, EC 1.11.1.6) is a ubiquitous enzyme. It protects organelles and tissues against hydrogen peroxide (H2O2) and reactive oxygen species (ROS) toxicity. Catalase deficiency and oxidative stress have been detected in association with various disorders including hypertension, vitiligo, diabetes mellitus, Alzheimer disease, acatalasemia and cancer.
1,2
Catalase converts H2O2 to molecular oxygen and water in 2 steps. In the first step (equation 1) the heme iron is oxidized by using H2O2 to form compound I (Cpd I). In the next step (equation 2) Cpd I is reduced by using the second molecule of H2O2.
3
(1)
(2)
Bovine liver catalase (BLC) i, a tetrameric enzyme, composed of four identical subunits with one heme per subunit. Each subunit consists of four domains: an eight-stranded β-barrel, α-helical domain, N-terminal threading arm and wrapping loop which connects the N-terminal threading arm to β-barrel. Also, catalase binds NADPH at the surface of the molecule at a cleft between the helical domain and β-barrel. Studies revealed that NADPH plays many functions. It can decrease the formation of compound II, increase its removal and inhibits the enzyme at low concentration of H2O2.
4,5
Flavonoids are polyphenolic compounds that belong to a class of water-soluble plant pigments. They mainly present in vegetables, fruits, tea, wine, and fruit drinks and happen to be a component of the human diet. They show lots of biological and pharmacological properties including anti-oxidant, anti-cancer, anti-inflammatory and anti-obesity effects.
6-10
Flavonoids are divided into 6 categories including flavonols, flavones, flavanones, isoflavones, flavanols and anthocyanidins.
11,12
Quercetin (3,5,7,3ʹ,4ʹ-pentahydroxyflavone, QUE) (Fig. 1) belongs to the flavonol subclass of flavonoids. QUE present in most plants and fruits. It exists in the human diet as high as 25-40 mg/d.
13
QUE is an anti-oxidant agent due to its ability to metal chelation and scavenging oxygen free radicals. Complexation of metal cations by QUE has been reported for a large number of metals such as Fe(II), Fe(III), Zn(II), Co(II), Tb(III), Tb(II) and Sn(II).
14,15
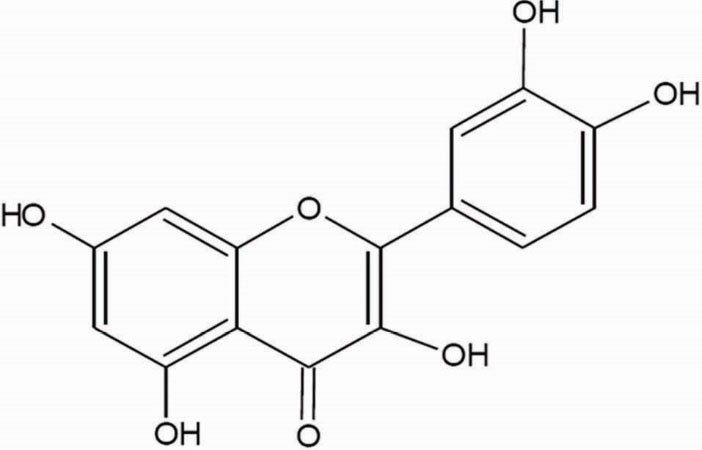
Figure 1.
Chemical structure of quercetin.
.
Chemical structure of quercetin.
It has been reported that flavonoids inhibit some enzymes including xanthine oxidase, cytochromes P450, cyclooxygenases and lipoxygenases. Also, several in vivo and in vitro studies have shown that flavonoids can decrease catalase expression and activity. Krych and Gebicka have reported that various flavonoids from flavonols, flavones and flavanols (catechins) subclasses, can efficiently react with catalase and inhibit its activity.
16
So in this study, the possible effects of QUE, as a polyphenol natural products from the flavonoid group, was investigated on the conformation and function of BLC by several methods. Since catalase has high activity in the liver which is one of the largest organs in the body with various metabolic functions, in which toxic substances are taken up and converted into harmless substances. Therefore, the study of the side effects of various compounds and drugs on catalase has been attached the attention of many researchers. In this work, we investigated the effects of QUE, as a dietary flavonoid, on the conformation and function of BLC.
Materials and Methods
Materials
BLC (molecular weight 250 KD), quercetin.2H2O and dimethylsulfoxide (DMSO) were purchased from Sigma- Aldrich (St. Louis, MO, USA). Disodium hydrogen phosphate (Na2HPO4), sodium dihydrogen phosphate (NaH2PO4) and Hydrogen peroxide (H2O2) 30% were purchased from Merck Co. (Darmstadt, Germany). The QUE stock solution (16.5 mM) was prepared by dissolving in DMSO and was added sufficient distilled water to bring the solution to the desired volume. The concentration of the H2O2 stock solution was computed spectrophotometrically, taking the extinction coefficient of 40 M−1 cm−1.
16
Methods
Kinetics studies of BLC
The activity of BLC was determined using a UV spectrophotometer (T60, PG Instruments LTD., Leicestershire, UK) by detecting the decrease in H2O2 maximum absorbance at 240 nm (A240) in sodium phosphate buffer (pH= 7, 50 mM), due to its break down by the enzyme. To investigate the effects of QUE on the activity of BLC, its 3 nM solution was incubated with different concentrations of QUE (5.5, 11, 16.5, 22 and 27.5 μM), in a total volume of 3 mL. Subsequently, a fixed concentration of H2O2 (70 mM) was added to the solutions and the absorbance of them was recorded at 240 nm every 2 seconds for 1 minute.
Spectroscopic investigations
BLC absorption spectra were recorded in the range of 200-500 nm, using 1 cm quartz cell. The fluorescence spectra were recorded using a FP-750 Jasco spectrofluorometer (Kyoto, Japan) at 2 temperatures (25°C and 37°C) with the excitation wavelength (λex) of 280 nm and the fluorescence emission wavelength (λem) range of 300-500 nm. The synchronous fluorescence spectra of BLC with and without QUE were scanned using Δλ=15 nm (λem=240-400) for tyrosine (Tyr) and Δλ=60 nm (λem=300-500) for tryptophan (Trp). The scan speed was fixed at 1000 nm.min-1.
CD spectra of BLC were recorded on a J-810 spectropolarimeter (Jasco, Tokyo, Japan) in the presence and absence of QUE at room temperature in 0.1 cm cell in 50 mM sodium phosphate buffer. The percentage of secondary structure elements of BLC upon interaction with various concentrations of QUE, were estimated by the CDNN software.
Molecular docking study
Molecular docking was carried out to obtain the best binding site of QUE on BLC using the Auto Dock software (version 4.2).
17
BLC's crystal structure (PDB ID: 1TGU) was taken from the Protein Data Bank. QUE molecular structure was drawn by Hyperchem 8.0.6 and its energy minimized conformation was conducted using Gaussian 03 programs. The Lamarckian genetic algorithm (LGA) search method was used for searching the best binding site of QUE to the BLC. The modes of interaction between BLC and QUE was investigated using Chimera 1.10.1 program.
18
Results and Discussion
Kinetics studies
Analysis of BLC activity
Catalase breakdowns the H2O2 to H2O and O2. The rate of decomposition of H2O2 by BLC, which leads to decrease in H2O2 absorption at 240 nm, was considered as the enzyme activity. For this purpose, the additional concentrations of H2O2 (10-90 mM) in the presence of the fixed concentration of BLC (3 nM) was used to determine the BLC activity. The results indicated that with raising H2O2 concentration, BLC activity increases (from 10 to 70 mM), after that with more concentrated solutions of H2O2 (> 70 mM), a significant reduction in BLC activity was detected, due to suicide inactivation process.
19
Lineweaver-Burk plot and equation 3 were applied to determine the accurate kinetic parameters.
The Km (Michaelis Constant) and Vmax (Maximal Velocity) values were obtained to be 39 mM and 2.28 mM.S-1, respectively. Also, the equation (4) was used to estimate the catalytic constant (Kcat) value, which was obtained as 7.6 × 10⁵ s-1.
where [Et] is total enzyme concentration.
In order to investigate the effects of QUE on enzyme activity, BLC activity assays were performed in the presence of additional concentrations of QUE (5.5, 11, 16.5, 22 and 27.5 μM) and fixed concentration of H2O2 (70 μM). It has been observed that with an increase in QUE concentration, BLC activity markedly reduced. According to Fig. 2A, the IC50 value was calculated as 16.76 μM. The inhibition kinetics of BLC by QUE was then analyzed by a Lineweaver-Burk plot (Fig. 2B) which indicated that QUE is a non-competitive inhibitor of BLC. When the slope of each curve from Fig. 2B was re-plotted against different concentrations of QUE a Ki of 46.0 μM was obtained (Fig. 2C).
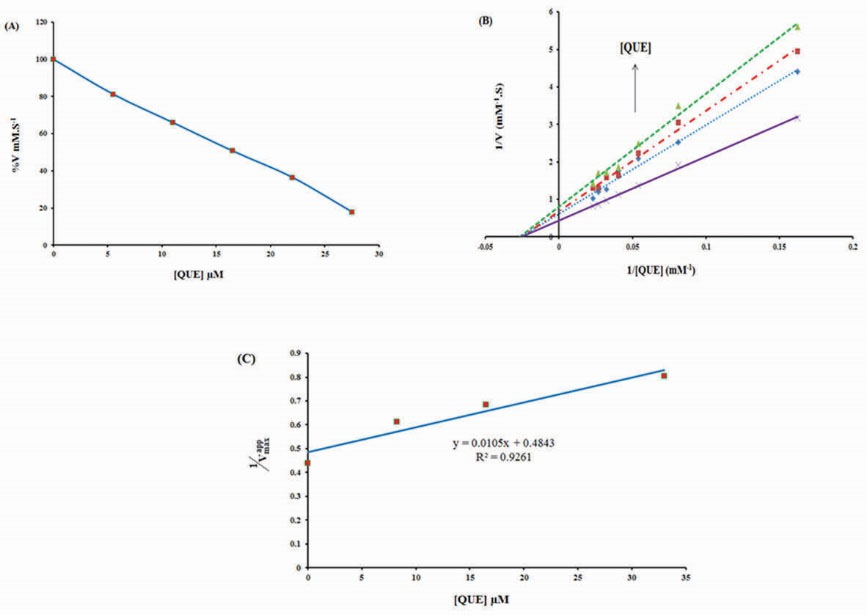
Figure 2.
Effect of different concentrations of quercetin (0, 5.5, 11, 16.5, 22 and 27.5 µM) on the catalytic activity of bovine liver catalase in phosphate buffer 50 mM, pH 7, at room temperature. (B) Lineweaver-Burk curve of bovine liver catalase (3 nm) in the absence and presence of different concentrations of quercetin: 0 (×), 8.38 (♦), 16.76 (■) and 33.52 (▲) µM in phosphate buffer 50 mM, pH 7, at room temperature. (C) The secondary linear plot which derived of Lineweaver–Burk plot.
.
Effect of different concentrations of quercetin (0, 5.5, 11, 16.5, 22 and 27.5 µM) on the catalytic activity of bovine liver catalase in phosphate buffer 50 mM, pH 7, at room temperature. (B) Lineweaver-Burk curve of bovine liver catalase (3 nm) in the absence and presence of different concentrations of quercetin: 0 (×), 8.38 (♦), 16.76 (■) and 33.52 (▲) µM in phosphate buffer 50 mM, pH 7, at room temperature. (C) The secondary linear plot which derived of Lineweaver–Burk plot.
UV-vis spectrometric investigations
UV-vis absorption spectrometry is a simple and effective method, which is applied to investigate the structural change of proteins upon interaction with ligands. The UV-vis spectrum of BLC shows the main absorption band around 280 nm, which mainly comes from aromatic amino acids. Also, BLC possesses another significant peak around 405 nm (Soret-band), which is caused by the π→π* transition of electrons in the heme group.
20,21
UV-vis spectra of BLC (1 μM) were measured in different concentrations of QUE (8.38, 16.76 and 33.52 µM). The results indicated that with increasing concentration of QUE both of the absorption peaks (280 and 405 nm) increase, but more investigations showed that QUE has its own absorption in the studied wavelengths (280 and 405 nm), so the absorption values of QUE at different concentrations were subtracted from the absorption values of BLC-QUE, showing that the interaction between BLC and QUE result in a little hyperchromic effect around 280 nm (Fig. 3A) and 405 nm (Fig. 3B). These results indicated that QUE can form complex with BLC and alter its structure slightly.
19
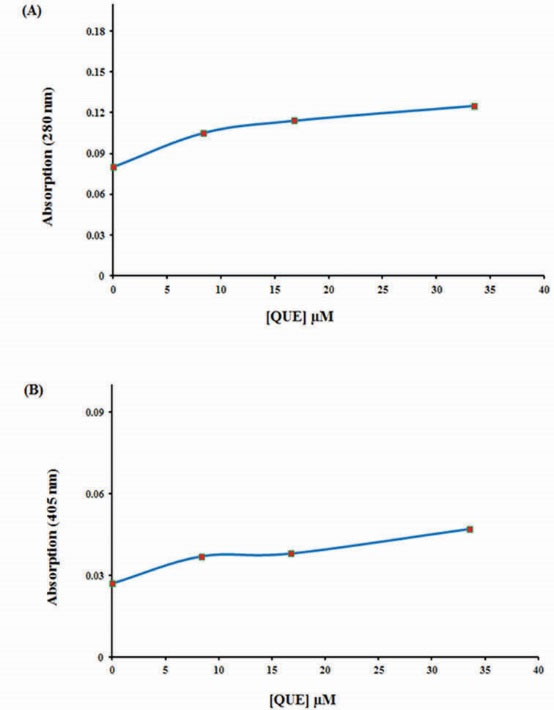
Figure 3.
The changes in bovine liver catalase absorption (1 µM) at 280 nm (A) and 405 nm (B) after addition of quercetin in phosphate buffer 50 mM, pH 7, at room temperature.
.
The changes in bovine liver catalase absorption (1 µM) at 280 nm (A) and 405 nm (B) after addition of quercetin in phosphate buffer 50 mM, pH 7, at room temperature.
Fluorescence spectroscopy
Fluorescence spectroscopy is a fast, robust and highly sensitive tool, which is applied to study the structural changes of macromolecules upon interaction with various ligands. The intrinsic fluorescence emission of BLC results from aromatic fluorophores (dominantly Trp and Tyr residues). The intrinsic fluorescence emission of tryptophan is very sensitive to the polarity of the surrounding environment.
22
We used fluorescence spectroscopy to investigate the interaction between QUE and BLC. As can be seen from Fig. 4, the fluorescence intensity of BLC decreases in the presence of an additional concentration of QUE (1, 2, 3, 4, 5 and 6 µM). Results indicated that QUE can quench the intrinsic fluorescence of BLC and change the micro-region environment around the fluorophores (excitation wavelength was set at 280 nm).
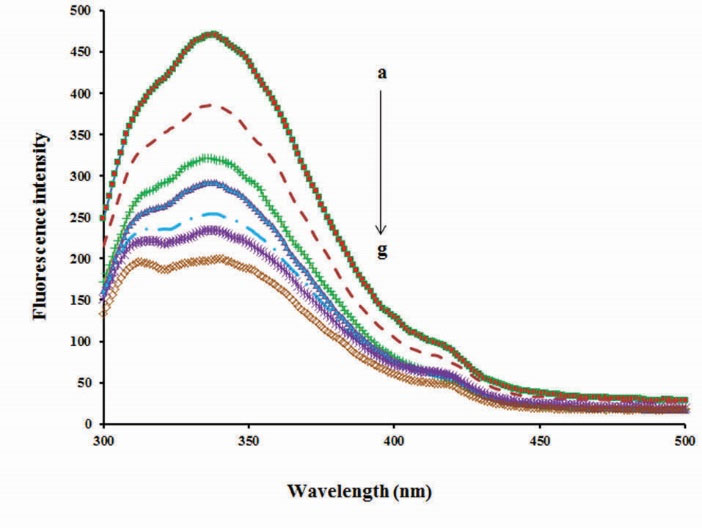
Figure 4.
Effect of concentration of quercetin on fluorescence intensity of bovine liver catalase before and after addition of quercetin. λex=280 nm, BLC concentration: (0.7 µM); quercetin concentrations:(a) 0, (b) 1, (c) 2, (d) 3, (e) 4, (f) 5, (g) 6.
.
Effect of concentration of quercetin on fluorescence intensity of bovine liver catalase before and after addition of quercetin. λex=280 nm, BLC concentration: (0.7 µM); quercetin concentrations:(a) 0, (b) 1, (c) 2, (d) 3, (e) 4, (f) 5, (g) 6.
Fluorescence quenching mechanisms are classified into 2 types by their different dependence on temperature: dynamic (collisional quenching) and static (non-fluorescent complex formation). In order to estimate the quenching mechanism of BLC in the presence of QUE, Stern-Volmer equation (5) was used:
(5)
where, F and F0 are the fluorescence intensities of BLC with and without the quencher (QUE), respectively, [QUE] is the concentration of the quencher, Kq is the quenching rate constant of the biomolecule, τ0is the fluorescence lifetime without quencher (10-8 s for BLC) and KSVis the Stern–Volmer quenching constant. The careful examination of the plot of F0/F vs. [QUE] (Fig. 5) revealed that the KSV values decrease with an increase in temperature, and Kq values are much greater than 2×10¹⁰ L mol-1 s-1, which are characteristic of static quenching mechanism.
23
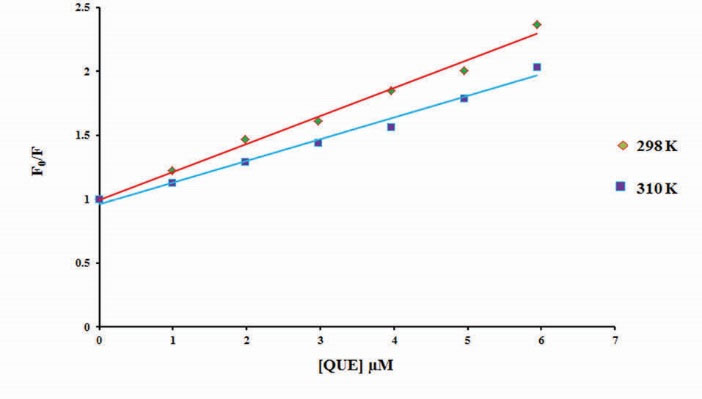
Figure 5.
Stern-Volmer plot for fluorescence quenching of bovine liver catalase by different concentrations of quercetin at 298 K (♦) and 310 K (■).
.
Stern-Volmer plot for fluorescence quenching of bovine liver catalase by different concentrations of quercetin at 298 K (♦) and 310 K (■).
Synchronous fluorescence spectroscopy
Synchronous fluorescence spectroscopy provides important information about the micro-region around the fluorophores. By scanning simultaneously both excitation and emission wavelengths, maintaining a constant wavelength interval (∆λ) between them (∆λ=15 nm for Tyr and ∆λ=60 nm for Trp).
24
The gradual decrease in the fluorescence intensity on the successive additions of QUE is an obvious indication of the complex formation between BLC and QUE, but the peak positions of the synchronous fluorescence spectra remain unshifted (Fig. 6A and 6B). It seems that the binding of QUE to BLC has no obvious effect on the microenvironment around the Tyr and Trp residues.
25
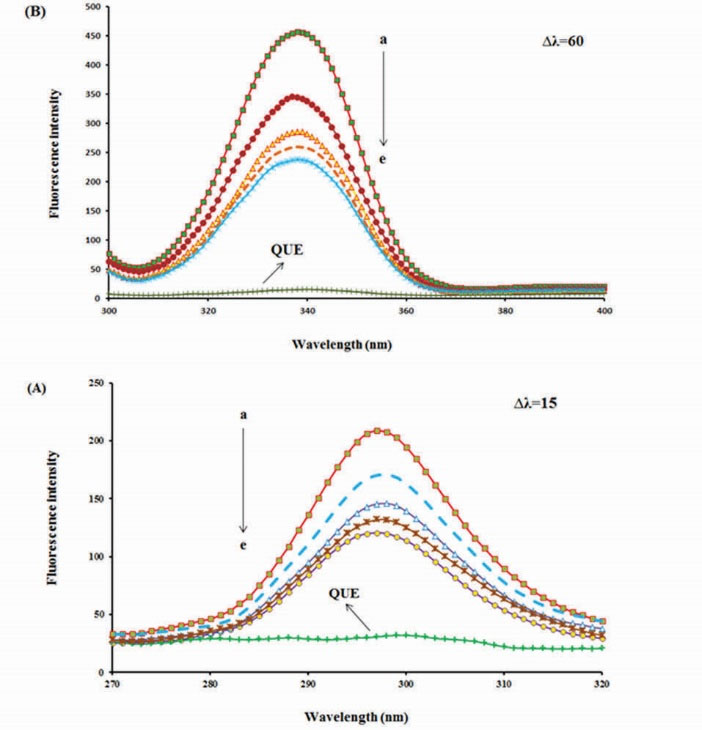
Figure 6.
Synchronous fluorescence emission spectra of bovine liver catalase in the presence of different concentrations of quercetin (0, 1, 2, 3 and 4 µM); (A) ∆λ=15 and (B) ∆λ=60 nm, (f) only quercetin 1 µM, at room temperature.
.
Synchronous fluorescence emission spectra of bovine liver catalase in the presence of different concentrations of quercetin (0, 1, 2, 3 and 4 µM); (A) ∆λ=15 and (B) ∆λ=60 nm, (f) only quercetin 1 µM, at room temperature.
Circular dichroism spectroscopy study
To gain a better understanding of QUE effects on the secondary structure of BLC, CD spectroscopy was used. Fig. 7 shows the CD spectra of BLC in the presence or absence of different concentrations of QUE in the far-UV spectral region (190-250 nm). The CD spectra of BLC exhibits two negative bands at 208 and 222 nm
(characteristic of the α-helical structure of the protein) and a negative band around 217 nm (related to β-sheets). The CD spectra recorded were analyzed using CDNN software and obtained results were summarized in Table 1. According to Table 1, the content of the α-helical structure in BLC increased from 26.4% to 30.3%, while the content of β-sheet decreased from 21.7% to 19.1%, suggesting the considerable changes in the protein secondary structure. Also, the results indicate that QUE can increase the stability of BLC via increasing the α-helical structures and reduction of other secondary elements of protein.
26
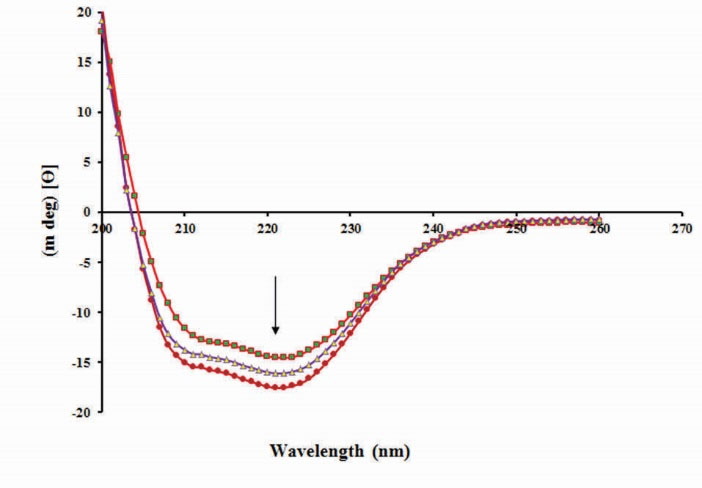
Figure 7.
Change in CD spectra of bovine liver catalase with and without various concentrations of quercetin at room temperature.
.
Change in CD spectra of bovine liver catalase with and without various concentrations of quercetin at room temperature.
Table 1.
Content of secondary structure elements of bovine liver catalase (BLC) with and without of quercetin at room temperature
|
Molar rate of BLC to quercetin
|
Secondary structure (%)
|
|
α-Helix
|
β-Sheet
|
β-Turns
|
Random coil
|
| 2:0 |
26.4 |
21.7 |
18.1 |
33.8 |
| 2:10 |
29.5 |
20.2 |
17 |
33.3 |
| 2:20 |
30.3 |
19.1 |
18.8 |
33.6 |
Thermodynamic analysis and binding mode
In order to calculate the number of binding sites (n) and binding constant (Ka), the following equation was used:
(7)
According to a plot of vs.
(Fig. 8), the Ka and "n" values were obtained and the results have been summarized in Table 2. The results indicated that there is only one binding site on BLC for QUE (n ~ 1) and the Ka value increased with the increasing temperature, suggesting that the stability of complex increase with the rising temperature. The Ka value was about 104, indicating that there is a strong interaction between
QUE and BLC.
27
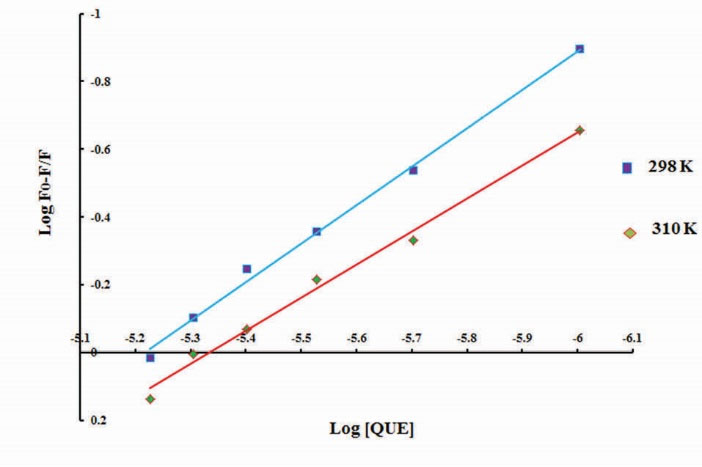
Figure 8.
The linear plot of
vs. log [quercetin], according to equation 7, for fluorescence quenching of bovine liver catalase in the presence of quercetin at 298K (♦) and 310K (■).
.
The linear plot of
vs. log [quercetin], according to equation 7, for fluorescence quenching of bovine liver catalase in the presence of quercetin at 298K (♦) and 310K (■).
There are various kinds of acting forces between a ligand and a macromolecule, which are classified into four groups based on the sign and the magnitude of the calculated parameters: 1) ∆H˂ 0 and ∆S > 0 (electrostatic forces play the main role), 2) ∆H ˃ 0 and ∆S ˃ 0 (hydrophobic interactions are important), 3) ∆H ˂ 0 and 4) ∆S ˂ 0 (van der Waals forces and hydrogen bonding are dominant).
28
Table 2 summarized the numerical values of ∆H, ∆S and ∆G calculated according to equations 8-10.
Table 2.
Binding parameters of bovine liver catalase (BLC)- quercetin complex at 25ºC and 37ºC
|
Temperature (°C)
|
n
|
K
SV
(×10
5
M
-1
)
|
K
q
(×10
13
M
-1
s
-1
)
|
K
a
(×10
4
M
-1
)
|
ΔG (kJmol
-1
)
|
ΔH(kJmol
-1
)
|
ΔS (JK
-1
mol
-1
)
|
| 25 |
0.97 |
2.18 |
2.18 |
16.04 |
-29.69 |
+105.8 |
+454.66 |
| 37 |
1.13 |
1.69 |
1.69 |
83.98 |
-35.15 |
|
|
The positive values of enthalpy changes (∆H) and the entropy changes (∆S) indicate that the hydrophobic interactions are involved in the complex formation between BLC and QUE. Also, the ΔG values are negative, indicating that interaction of QUE with BLC is a spontaneous process.
23,27
Molecular docking results
To predict the best binding sites of QUE on BLC molecular docking studies were performed. Fig. 9(A and B) shows that the best binding site of QUE on BLC is located away from heme group, at a cavity among the wrapping domain, threating arm and β-barrel, confirmation that the QUE is a non-competitive inhibitor. Fig. 9C shows the involving amino-acid residues in the interaction of BLC and QUE (Pro 367, Gln 386, Gln 397, Met 394, Asn 368, Tyr 369, Gln 371, Leu 370, Cys 376, Pro 377 and Val 382). It is clear that QUE interacts with BLC through hydrophobic interaction and hydrogen bonding, but hydrophobic interactions are dominant. The molecular docking results illustrated that there is one binding site for QUE on BLC. The value of lowest binding free energy was calculated as -7.21 kcal mol-1.
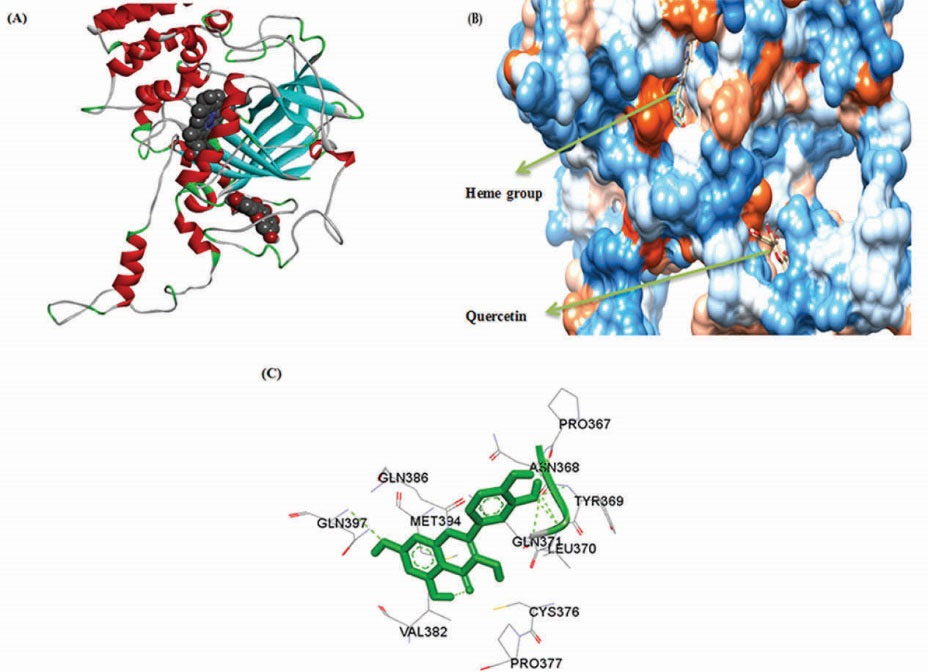
Figure 9.
Molecular docking results for complex of bovine liver catalase with quercetin (A) The carton form of one subunit of bovine liver catalase and (B) in hydrophobic surface model. (C) bovine liver catalase and quercetin amino acid residues in the binding site.
.
Molecular docking results for complex of bovine liver catalase with quercetin (A) The carton form of one subunit of bovine liver catalase and (B) in hydrophobic surface model. (C) bovine liver catalase and quercetin amino acid residues in the binding site.
Conclusion
Flavonoids are polyphenolic secondary metabolites in plants and mainly present in vegetables and fruits and they used as dietary supplements. Previous studies have been reported that flavonoids can inhibit catalase activity, so in this work, we investigated the interaction between QUE, one of the best-known flavonoids, and BLC. In vitro studies indicated that QUE (27.5 µM) has an inhibitory effect on catalase activity. The mechanism of inhibition was a non-competitive process. QUE binds to BLC through one binding site. The CD Spectroscopic results revealed that the conformational changes in BLC structure were caused by QUE. Fluorescence spectroscopy data indicated that QUE can quench fluorescence intensity of BLC by a static mechanism, but it cannot change the microenvironment of Tyr and Trp residues. The best interaction mode between QUE and BLC determined using molecular docking study. So, this study provides some evidence for evaluating the toxicity effects of QUE to catalase. According to the literature, the dietary intake of all flavonoids is about 200–350 mg/d, of which QUE accounts is approximately 10 mg/d. As QUE is present in vegetables and fruits, high consumption of such foods can increase intake to over 200 mg/d. So, according to our data excessive intake of the antioxidants such as QUE could be associated with some side effects.
Competing interests
The authors declare no competing interests.
Ethical approval
There is none to be declared.
Research Highlights
What is current knowledge?
simple
-
√ The interaction of quercetin with BLC was investigated.
-
√ Quercetin inhibited BLC activity by a non-competitive
manner.
-
√ The intrinsic fluorescence of BLC was quenched by
quercetin through static mechanism.
What is new here?
simple
-
√ The effect of quercetin on catalase activity was investigated
for the first time.
References
- Góth L, Rass P, Páy A. Catalase enzyme mutations and their association with diseases. Mol Diagn Ther 2004; 8:141-9. [ Google Scholar]
- Goth L, Nagy T. Inherited catalase deficiency: is it benign or a factor in various age related disorders?. Mutat Res Rev Mutat Res 2013; 753:147-54. doi: 10.1016/j.mrrev.2013.08.002 [Crossref] [ Google Scholar]
- Alfonso-Prieto M, Biarnés X, Vidossich P, Rovira C. The molecular mechanism of the catalase reaction. J Am Chem Soc 2009; 131:11751-61. doi: 10.1021/ja9018572 [Crossref] [ Google Scholar]
- Goyal MM, Basak A. Human catalase: looking for complete identity. Protein Cell 2010; 1:888-97. doi: 10.1007/s13238-010-0113-z [Crossref] [ Google Scholar]
- Gaetani GF, Ferraris AM, Sanna P, Kirkman HN. A novel NADPH:(bound) NADP+ reductase and NADH:(bound) NADP+ transhydrogenase function in bovine liver catalase. Biochem J 2005; 385:763-8. [ Google Scholar]
- Wang W, Sun C, Mao L, Ma P, Liu F, Yang J. The biological activities, chemical stability, metabolism and delivery systems of quercetin: A review. Trends Food Sci Technol 2016; 56:21-38. doi: 10.1016/j.tifs.2016.07.004 [Crossref] [ Google Scholar]
- Maciel RM, Carvalho FB, Olabiyi AA, Schmatz R, Gutierres JM, Stefanello N. Neuroprotective effects of quercetin on memory and anxiogenic-like behavior in diabetic rats: Role of ectonucleotidases and acetylcholinesterase activities. Biomed Pharmacother 2016; 84:559-568. doi: 10.1016/j.biopha.2016.09.069 [Crossref] [ Google Scholar]
- Seo M-J, Lee Y-J, Hwang J-H, Kim K-J, Lee B-Y. The inhibitory effects of quercetin on obesity and obesity-induced inflammation by regulation of MAPK signaling. J Nutr Biochem 2015; 26:1308-16. [ Google Scholar]
- de Oliveira MR, Nabavi SM, Braidy N, Setzer WN, Ahmed T, Nabavi SF. Quercetin and the mitochondria: a mechanistic view. Biotechnol Adv 2016; 34:532-49. doi: 10.1016/j.biotechadv.2015 [Crossref] [ Google Scholar]
- Kawabata K, Mukai R, Ishisaka A. Quercetin and related polyphenols: new insights and implications for their bioactivity and bioavailability. Food Funct 2015; 6:1399-417. doi: 10.1039/c4fo01178c [Crossref] [ Google Scholar]
- Miltonprabu S, Tomczyk M, Skalicka-Woźniak K, Rastrelli L, Daglia M, Nabavi SF. Hepatoprotective effect of quercetin: From chemistry to medicine. Food Chem Toxicol 2017; 108:365-74. doi: 10.1016/j.fct.2016.08.034 [Crossref] [ Google Scholar]
- Dehghan G, Dolatabadi JEN, Jouyban A, Zeynali KA, Ahmadi SM, Kashanian S. Spectroscopic studies on the interaction of quercetin–terbium (III) complex with calf thymus DNA. DNA Cell Biol 2011; 30:195-201. doi: 10.1089/dna.2010.1063 [Crossref] [ Google Scholar]
- Wang Y, Zhao L, Wang C, Hu J, Guo X, Zhang D. Protective effect of quercetin and chlorogenic acid, two polyphenols widely present in edible plant varieties, on visible light-induced retinal degeneration in vivo. J Funct Foods 2017; 33:103-11. doi: 10.1016/j.jff.2017.02.034 [Crossref] [ Google Scholar]
- Dehghan G, Khoshkam Z. Tin (II)–quercetin complex: Synthesis, spectral characterisation and antioxidant activity. Food Chem 2012; 131:422-6. doi: 10.1016/j.foodchem.2011.08.074 [Crossref] [ Google Scholar]
- Ravichandran R, Rajendran M, Devapiriam D. Antioxidant study of quercetin and their metal complex and determination of stability constant by spectrophotometry method. Food Chem 2014; 146:472-8. doi: 10.1016/j.foodchem.2013.09.080 [Crossref] [ Google Scholar]
- Krych J, Gebicka L. Catalase is inhibited by flavonoids. Int J Biol Macromol 2013; 58:148-53. [ Google Scholar]
- Morris GM, Huey R, Lindstrom W, Sanner MF, Belew RK, Goodsell DS. AutoDock4 and AutoDockTools4: Automated docking with selective receptor flexibility. J Comput Chem 2009; 30:2785-91. doi: 10.1002/jcc.21256 [Crossref] [ Google Scholar]
- Rizvi SMD, Shakil S, Haneef M. A simple click by click protocol to perform docking: AutoDock 42 made easy for non-bioinformaticians. EXCLI J 2013; 12:831-57. [ Google Scholar]
- Koohshekan B, Divsalar A, Saiedifar M, Saboury A, Ghalandari B, Gholamian A. Protective effects of aspirin on the function of bovine liver catalase: A spectroscopy and molecular docking study. J Mol Liq 2016; 218:8-15. doi: 10.1016/j.molliq.2016.02.022 [Crossref] [ Google Scholar]
-
Albani JR. Principles and Applications of Fluorescence spectroscopy. John Wiley & Sons; 2008.
- Xu Q, Lu Y, Jing L, Cai L, Zhu X, Xie J. Specific binding and inhibition of 6-benzylaminopurine to catalase: Multiple spectroscopic methods combined with molecular docking study. Spectrochim Acta A Mol Biomol Spectrosc 2014; 123:327-35. doi: 10.1016/j.saa.2013.12.021 [Crossref] [ Google Scholar]
- Lakowicz JR, Masters BR. Principles of fluorescence spectroscopy. J Biomed Opt 2008; 13:029901. [ Google Scholar]
- Teng Y, Zhang H, Liu R. Molecular interaction between 4-aminoantipyrine and catalase reveals a potentially toxic mechanism of the drug. Mol Biosyst 2011; 7:3157-63. doi: 10.1039/c1mb05271c [Crossref] [ Google Scholar]
- Pacheco ME, Bruzzone L. Synchronous fluorescence spectrometry: Conformational investigation or inner filter effect?. J Lumin 2013; 137:138-42. [ Google Scholar]
- Zeinabad HA, Kachooei E, Saboury AA, Kostova I, Attar F, Vaezzadeh M. Thermodynamic and conformational changes of protein toward interaction with nanoparticles: a spectroscopic overview. RSC Adv 2016; 6:105903-19. doi: 10.1039/C6RA16422F [Crossref] [ Google Scholar]
- Cao Z, Liu R, Yang B. Potential toxicity of sarafloxacin to catalase: spectroscopic, ITC and molecular docking descriptions. Spectrochim Acta A Mol Biomol Spectrosc 2013; 115:457-63. [ Google Scholar]
- Moradi M, Divsalar A, Saboury A, Ghalandari B, Harifi A. Inhibitory effects of deferasirox on the structure and function of bovine liver catalase: a spectroscopic and theoretical study. J Biomol Struct Dyn 2015; 33:2255-66. doi: 10.1080/07391102.2014.999353 [Crossref] [ Google Scholar]
- Teng Y, Zou L, Huang M, Zong W. Molecular interaction of 2-mercaptobenzimidazole with catalase reveals a potentially toxic mechanism of the inhibitor. J Photochem Photobiol B Biol 2014; 141:241-6. doi: 10.1016/j.jphotobiol.2014.09.018 [Crossref] [ Google Scholar]