BioImpacts. 8(3):159-165.
doi: 10.15171/bi.2018.18
Original Research
Risk association, linkage disequilibrium and haplotype analyses of FASN rs4246445, rs2229425, rs2228305 and rs2229422 polymorphisms in overweight and obesity
Eric Tzyy Jiann Chong  , Shawn Shi Erh Kuok , Ping-Chin Lee *
Author information:
Biotechnology Programme, Faculty of Science and Natural Resources, Universiti Malaysia Sabah, Jalan UMS, 88400 Kota Kinabalu, Sabah, Malaysia
Abstract
Introduction:
Obesity is commonly linked up with several life-threatening diseases. This study aims to investigate the association of fatty acid synthase (FASN) rs4246445, rs2229425, rs2228305, and rs2229422 single nucleotide polymorphisms (SNPs) with the risk of overweight and obesity in the Malaysian population.
Methods:
Blood samples were collected from 1030 individuals who were grouped into normal, overweight, and obese categories. Blood biochemistry test and lipid profiling were performed and genomic DNA was extracted. Genotyping was performed using hydrolysis probes and odd ratio with 95% CI was calculated for risk association analysis. Linkage disequilibrium and haplotypes analyses were carried out using SHEsis software.
Results:
We found that the hemoglobin and white blood cell counts were significantly high in the obese subjects. There is a lack of evidence to link the FASN SNPs with the risk of overweight and obesity in the population. All 4 SNPs were seemed to be in linkage equilibrium. Five common haplotypes were identified in this study but none of them was significantly associated with overweight and obesity in the population.
Conclusion:
Our findings suggest a lack of evidence to associate the FASN rs4246445, rs2229425, rs2228305, and rs2229422 SNPs with the risk of overweight and obesity in the Malaysian population. All 4 SNPs were independent of each other and not all identified haplotypes were significantly associated with overweight and obesity in this study.
Keywords: Fatty acid synthase, Obesity, Overweight, Single nucleotide polymorphisms
Copyright and License Information
© 2018 The Author(s)
This work is published by BioImpacts as an open access article distributed under the terms of the Creative Commons Attribution License (
http://creativecommons.org/licenses/by-nc/4.0/). Non-commercial uses of the work are permitted, provided the original work is properly cited.
Introduction
Overweight and obesity affect more than 1.9 billion adults globally.
1
Obesity has become a primary health issue in several Asia countries including in Malaysia. Nearly 50% of the Malaysian adults are reported to be overweight and about 17.7% of them are obese as were unveiled in the National Health and Morbidity Survey in 2015.
2
Obesity is commonly associated with several life-threatening diseases including stroke, cardiovascular disease,type 2 diabetes and cancers.
3-7
The etiology of overweight and obesity that subsequently affect the pathophysiological characteristics is not fully understood, but it seems to involve both genetic and environmental elements in this pandemic disease.
A genome-wide linkage scan in Pima Indians revealed that chromosome 17q25 has the strongest evidence for linkage with the percentage of body fat.
8
The fatty acid synthase (FASN) gene is located in this region and it encodes a core enzyme that is essential for de novo lipogenesis pathway and cellular substrate energy metabolism including the synthesis of long-chain fatty acids from acetyl-CoA, malonyl-CoA and NADPH (Fig. 1).
9
Previous studies in mice model suggested that inhibition of the FASN gene expression had led to reducing food intake, rapid weight and fat loss, as well as resolution of fatty liver in diet-induced obese mice.
10-12
Taken together, FASN gene is evidently and actively involving in the energy homeostasis process, making it an interesting gene to be studied for association with the risk of overweight and obesity in human populations.
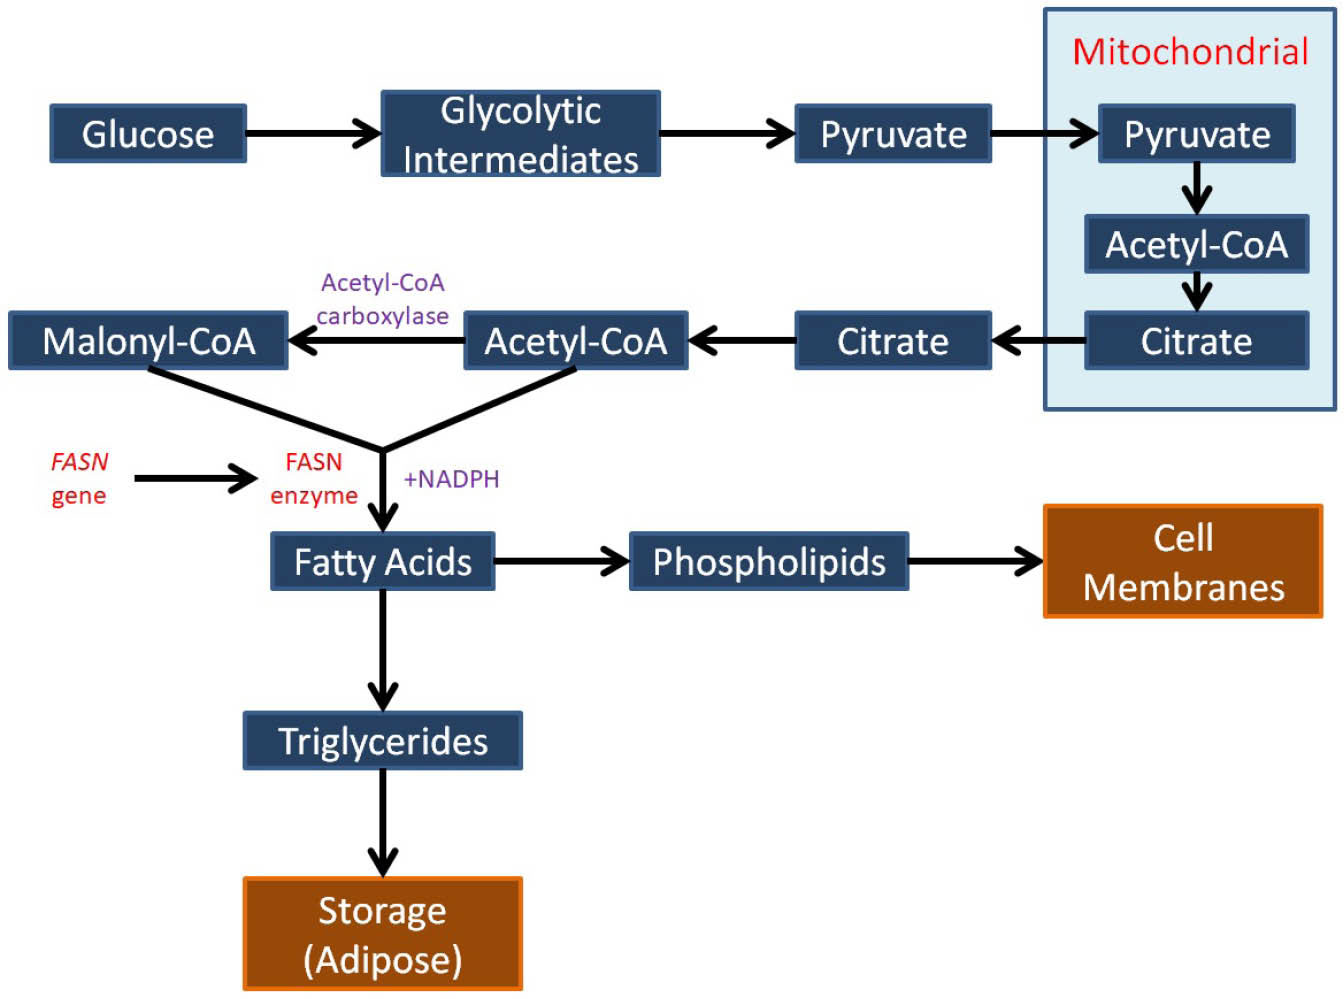
Fig. 1.
Schematic outline of de novo synthesis of fatty acids that involving the FASN gene.
.
Schematic outline of de novo synthesis of fatty acids that involving the FASN gene.
Sequencing of FASN gene in Pima Indians and Germans has successfully identified several single nucleotide polymorphisms (SNPs) within the gene.
13,14
Some of these SNPs, including the rs4246445, rs2229425, rs2228305, and rs2229422 have been significantly associated with the risk of obesity in Germans,
14
but yet to be investigated in the Malaysian population. Therefore, we report here the association of these 4 SNPs with the risk of overweight and obesity in the Malaysian population, including other factors such as gender, smoking status, alcohol consumption and fast-food intake. We are also interested to study the effect of linkage disequilibrium (LD) and haplotypes of these SNPs towards the risk of overweight and obesity in the population.
Materials and Methods
Subjects
Five milliliters of peripheral blood was collected from 1030 age-matched volunteers with written consent from the year 2014 to 2016. Information such as age, gender, height, weight, blood pressure, heart rate and lifestyles were obtained from all recruited subjects. The subjects were further divided into 3 groups based on their body mass index (BMI), including normal group with BMI <25.0 kg/m2(N = 694, mean age ± S.D. = 23.41 ± 9.81), overweight group with BMI = 25.0–29.9 kg/m2(N = 223, mean age ± S.D. = 23.34 ± 9.78), and obese group with BMI ≥30.0 kg/m2(N = 113, mean age ± S.D. = 23.45 ± 9.88). Blood biochemistry and lipid profile for each group were analyzed.
DNA isolation and integrity measurement
Genomic DNA was isolated from peripheral blood of all subjects using alkaline phenol-chloroform approach. Standard Sensitivity Genomic DNA Analysis Kit was purchased to measure the quality of the extracted DNA using Fragment AnalyzerTM (Advanced Analytical Technologies Inc., IA, USA). A genomic quality number (GQN) which represented the integrity of DNA for each sample was obtained and only high intact DNA with GQN >7.0 was selected for subsequence analysis.
Genotyping of FASN polymorphisms
TaqMan® genotyping assays (ABI, USA) for FASN rs4246445, rs2229425, rs2228305, and rs2229422 SNPs (Table S1) were purchased and genotyped using StepOnePlusTM Real-time PCR System (ABI, USA). Briefly, a PCR mixture containing 100 ng of genomic DNA, 5 µL of 2X TaqMan® GTXpressTM Master Mix (ABI, USA) and 0.5 µL of 20X TaqMan® genotyping assay was prepared. The mixture was topped-up with sdH2O to a final volume of 10 µL. The PCR condition was set at: an enzyme activation step at 95°C for 20 seconds followed by 40 cycles of 95°C for 3 seconds and 60ºC for 30 seconds.
Statistical analyses
Independent t-test was applied to compare the mean differences of health characteristics between overweight and/or obese groups to the normal group using SPSS software version 17.0 (IBM Corporation, USA). Hardy-Weinberg equilibrium (HWE) for all 4 SNPs was determined using the Online Encyclopedia for Genetic Epidemiology software.
15
Odd ratio (OR) with 95% CI was calculated in overall and in the sub-groups (e.g. gender, smoking status, alcohol consumption, and fast-food intake) using online MEDCALC® software (https://www.medcalc.org/calc/odds_ratio.php). LD and haplotype analyses were performed using SHEsis online software.
16
Independent chi-square test in the SPSS software version 17.0 (IBM Corporation, USA) was utilized to compare the distribution of the allele frequencies between this study and other populations. All P values were two-tail and considered statistically significant when P < 0.05.
Results
Demographic data of the normal, overweight, and obese subjects (Table 1) showed that overweight subjects had significantly higher BMI values when compared to normal subjects. Several parameters such as weight, BMI, systolic blood pressure, hemoglobin and white blood cell counts were significantly different between the normal and obese groups. When overweight and obese subjects were combined and analyzed together, their BMI and hemoglobin level were significantly higher than the normal subjects.
Table 1.
Demographic data of the normal, overweight, and obese groups
|
Demography
|
NR (n=694)
|
OW (n=223)
|
OB (n=113)
|
OW+OB (n=336)
|
| Gender (Male/Female) |
433/261 |
134/89 |
53/60 |
187/149 |
| Age (y) |
23.41±9.81 |
23.34±9.78 |
23.45±9.88 |
26.76±12.63 |
| Height (cm) |
170.25±10.97 |
168.25±11.62 |
159.50±12.71 |
163.88±12.21 |
| Weight (kg) |
62.25±6.80 |
74.00±10.68 |
90.50±19.60*
|
82.25±17.07 |
|
BMI (kg/m2)
|
21.45±1.29 |
26.05±0.73*
|
35.30±3.73*
|
30.67±5.54*
|
| Systolic (mm Hg) |
117.00±7.75 |
125.50±12.45 |
128.50±4.12*
|
127.00±8.73 |
| Diastolic (mm Hg) |
75.75±7.80 |
78.25±5.12 |
84.75±3.59 |
81.50±5.37 |
| Pulse (per min) |
72.00±13.44 |
80.75±9.57 |
76.75±5.68 |
78.75±7.59 |
| Haemoglobin (g/L) |
132.27±20.27 |
144.42±17.95 |
150.71±15.97*
|
146.74±17.08*
|
|
RBC (x1012/L)
|
4.88±0.60 |
4.96±0.75 |
5.37±0.55 |
5.11±0.70 |
|
WBC (x109/L)
|
6.49±1.37 |
6.89±1.43 |
7.93±2.11*
|
7.27±1.73 |
|
Platelets (x109/L)
|
280.58±65.45 |
275.58±62.24 |
271.00±50.58 |
273.89±58.13 |
| Glucose (mmol/L) |
5.30±0.56 |
5.17±0.46 |
5.89±2.85 |
5.43±1.72 |
| Cholesterol (mmol/L) |
4.48±0.44 |
4.83±0.87 |
5.73±2.04 |
5.28±1.53 |
| HDL (mmol/L) |
1.54±0.45 |
1.55±0.15 |
1.21±0.35 |
1.38±0.31 |
| LDL (mmol/L) |
2.52±0.71 |
2.98±0.99 |
3.39±0.60 |
3.18±1.03 |
| Triglyceride (mmol/L) |
0.90±0.31 |
0.65±0.15 |
2.44±1.94 |
1.55±1.59 |
NR, normal (BMI < 25.0 kg/m2); OW, overweight (BMI = 25.0-29.9 kg/m2); OB, obese (BMI ≥ 30.0 kg/m2); BMI, body mass index; RBC, red blood count; WBC, white blood count; HDL, high density lipid; LDL, low density lipid.
*Statistically significant when compared to normal (P < 0.05).
The FASN rs4246445 and rs2229425 SNPs were within the HWE (χ2 < 3.84), whereas FASN rs2228305 and rs2229422 SNPs deviated from the HWE (χ2> 3.84) in the population. The highest minor allele frequency (MAF) was observed in the rs4246445 (MAF = 0.363) followed by rs2229422 (MAF = 0.186), rs2228305 (MAF = 0.022) and rs2229425 (MAF = 0.003). Risk association analysis revealed no significant association of all these SNPs with overweight, obesity, and overweight + obesity when compared to normal subjects in this study including in the sub-groups (i.e. gender, smoking status, alcohol consumption, and fast-food intake) analyses (Tables S2-S5).
LD and haplotype analyses of all SNPs with the overweight + obese (BMI ≥ 25.0; N = 336) as cases, and normal group (BMI < 25.0; N = 694) as controls showed that the rs4246445 and rs2229425 SNPs, as well as the rs2229425 and rs2228305 SNPs were in strong LD with D’ values of 0.986 and 1.000, respectively. However, both LD were with extremely low r2 values (Fig. 2 and Table 2). We have identified five common haplotypes (defined by the composition of alleles at each SNP in the following order: rs4246445-rs2229425-rs2228305-rs2229422) where haplotypes TCGT, TCGC and CCAT exhibited slightly higher frequencies while haplotypes CCGT and CCGC were in lower frequencies in cases than in controls, but none of these haplotypes was statistically significant (P > 0.05) (Table 3).
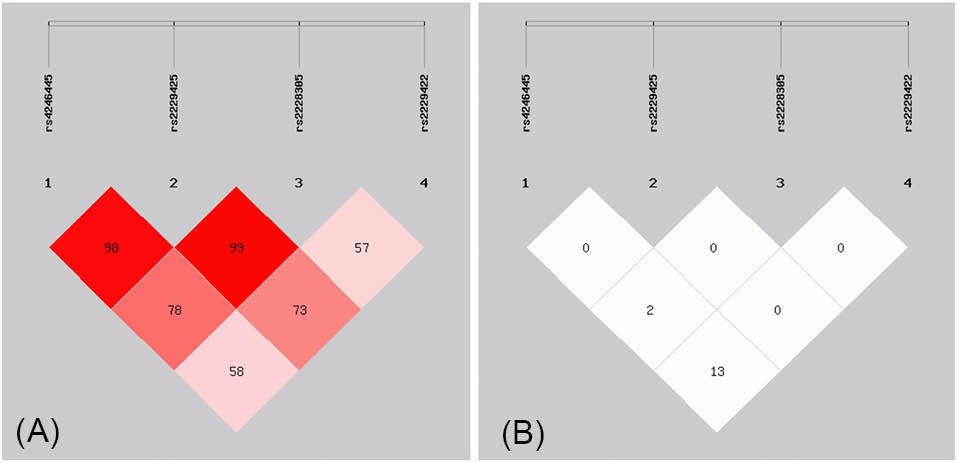
Fig. 2.
Linkage disequilibrium (LD) plots illustrating the degree of linkage disequilibrium of FASN polymorphisms in this study. (A) Values in the LD blocks represented the D’ in percentage. (B) Values in the LD blocks represented the r2 in percentage.
.
Linkage disequilibrium (LD) plots illustrating the degree of linkage disequilibrium of FASN polymorphisms in this study. (A) Values in the LD blocks represented the D’ in percentage. (B) Values in the LD blocks represented the r2 in percentage.
Table 2.
Linkage disequlibrium (LD) analysis of FASN polymorphisms in this study
|
SNP
|
rs4246445
|
rs2229425
|
rs2228305
|
rs2229422
|
| rs4246445 |
|
0.986 |
0.789 |
0.590 |
| rs2229425 |
0.005 |
|
1.000 |
0.731 |
| rs2228305 |
0.025 |
0.000 |
|
0.575 |
| rs2229422 |
0.139 |
0.007 |
0.002 |
|
Values in upper diagonal and lower diagonal represented the D’ and r2for the SNP combinations, respectively
Table 3.
Haplotype analysis of FASN polymorphisms in this study
|
Haplotype
*
|
OW+OB (Frequency)
**
|
Normal (Frequency)
**
|
OR (95% CI)
|
P
|
| TCGT |
0.598 |
0.583 |
1.06 (0.88-1.28) |
0.527 |
| TCGC |
0.050 |
0.044 |
1.14 (0.74-1.75) |
0.553 |
| CCGT |
0.199 |
0.208 |
0.95 (0.75-1.19) |
0.655 |
| CCGC |
0.127 |
0.140 |
0.89 (0.68-1.17) |
0.410 |
| CCAT |
0.020 |
0.019 |
1.07 (0.55-2.06) |
0.843 |
OW, overweight; OB, obese.
*As listed in Table 3 based on the physical marker order: rs4246445, rs2229425, rs2228305 and rs2229422.
**All haplotype frequencies less than 0.010 were ignored in the analysis.
Discussion
Blood biochemistry and compositions have been intensively studied in correlation with the overweight and obesity pandemics, and several indicators were successfully identified in peripheral blood of overweight and obese when compared to individuals with normal BMI.
17,18
To further extend the study on this perspective, we have performed full blood and lipid profiling of the collected blood samples, and our results showed significantly higher hemoglobin level in the obese and overweight+obese individuals. We have established the positive correlation between BMI and hemoglobin count, which is similar to previously reported studies.
17,18
Interestingly, our study revealed that WBC was significantly higher in the obese than in normal subjects. Obesity is often associated with chronic, systemic and low-grade inflammation, and recent reviews have summarized the crucial role of immune mechanisms in obesity-induced inflammation,
19,20
explaining the obvious elevated WBC in the obese subjects in this study. Furthermore, obese individuals tend to have a higher risk of stroke or cardiovascular disease as the adipokines released by the obese adipose tissues may induce oxidative stress as well as microvascular and endothelial dysfunctions that considered as the essential steps of atherogenesis.
3,4,19,21
The T allele was reported as the minor allele for the rs4246445 SNP and the distributions of this allele were significantly different in the South Asian (MAF = 44.0%, P = 0.005), African (MAF = 19.0%, P ≤ 0.001), European (MAF = 25.0%, P < 0.001) and Ad Mixed American (MAF = 23.0%, P < 0.001) populations when compared to the Malaysian in this study (Fig. 3). Interestingly, this allele is more dominant in our population with the allele frequency of 63.7%, which is comparable to the East Asian population (MAF = 58.0%, P = 0.384). Therefore this allele was selected as the reference for subsequent risk association analysis. Overall, no significant association was observed for the rs4246445 SNP with the risk of overweight and obesity in this study. However, the presence of T allele in this SNP is seemed to have a higher risk for overweight and obesity in our study population but moderately protective against obesity in Germans by 0.83-fold after adjustment with age, gender, and type 2 diabetes though not significant.
14
The distribution of the T allele frequency of this SNP is significantly different between our population and Germans (Fig. 4). These findings indicate that the risk association of this SNP towards obesity prevalence is population-dependent.
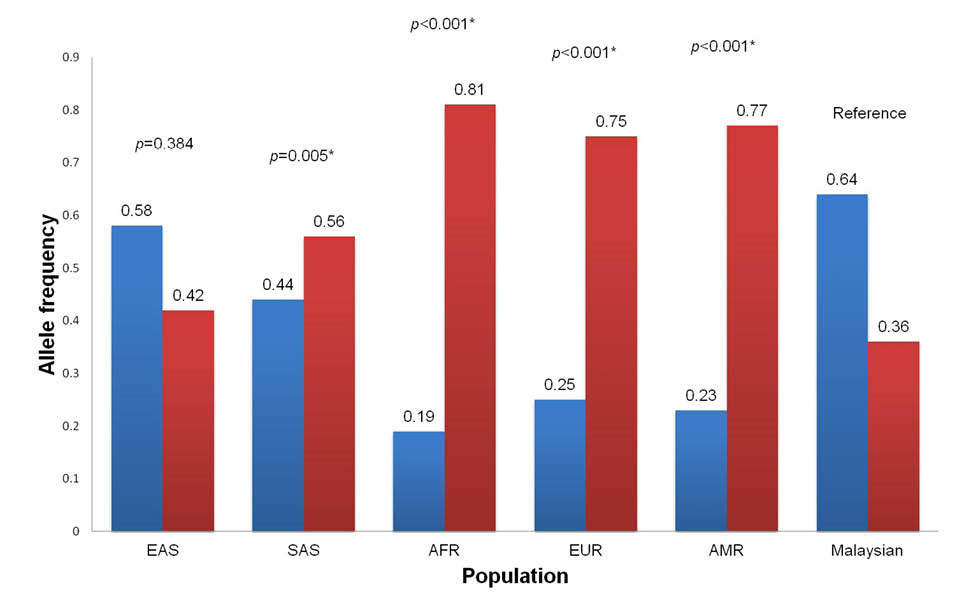
Fig. 3.
Comparison of allele frequencies of FASN rs4246445 SNP between Malaysian (this study) and super populations from 1000 Genomes Project. EAS, East Asian; SAS, South Asian; AFR, African; EUR, European; AMR, Ad Mixed American. * Significantly different in chi-square test (P < 0.05).
.
Comparison of allele frequencies of FASN rs4246445 SNP between Malaysian (this study) and super populations from 1000 Genomes Project. EAS, East Asian; SAS, South Asian; AFR, African; EUR, European; AMR, Ad Mixed American. * Significantly different in chi-square test (P < 0.05).
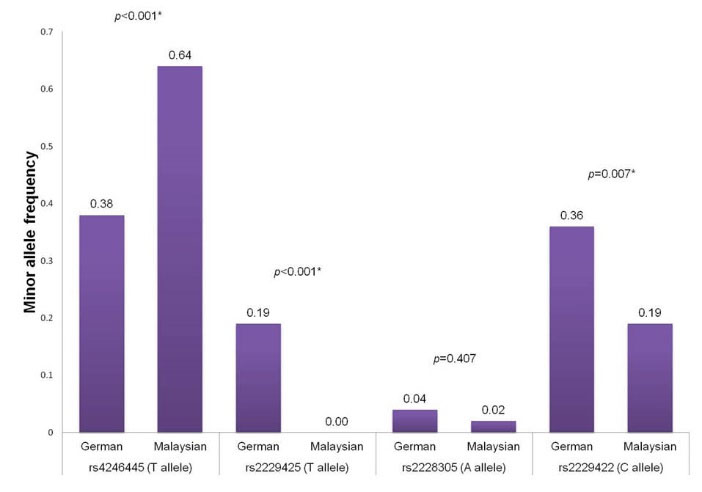
Fig. 4.
Comparison of minor allele frequencies of FASN SNPs between Malaysian (this study) and German populations.
14
MAF, minor allele frequency. * Significantly different in chi-square test (P < 0.05).
.
Comparison of minor allele frequencies of FASN SNPs between Malaysian (this study) and German populations.
14
MAF, minor allele frequency. * Significantly different in chi-square test (P < 0.05).
The MAF distribution of the rs2229425 SNP in our population is similar to the East Asian (MAF = 0.0%) and African (MAF = 1.0%, P = 0.316) populations but significantly different to other populations including South Asian (MAF = 4.0%, P = 0.043), European (MAF = 13.0%, P < 0.001) and Ad Mixed American (MAF = 8.0%, P = 0.004) (Fig. 5). For the rs2229422 SNP, the distribution of the allele frequencies is similar with the East Asian (MAF = 29.0%, P = 0.098), South Asian (MAF = 18.0%, P = 0.856), African (MAF = 20.0%, P = 0.858), European (MAF = 31.0%, P = 0.050) and Ad Mixed American (MAF = 20.0%, P = 0.858) populations (Fig. 6). The variant allele in the rs2229425 and rs2229422 SNPs has been reported as a significant risk factor for obesity in Germans with OR (95% CI) of 1.72 (1.35-2.18) and 1.85 (1.35-2.56), respectively, after adjusted for the age, sex, and type 2 diabetes.
14
However, the presence of the variant allele in these two SNPs does not associate with the risk of overweight and obesity in this study.
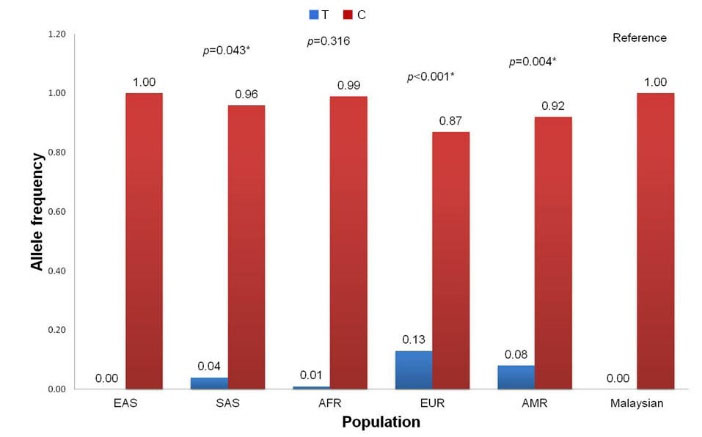
Fig. 5.
Comparison of allele frequencies of FASN rs2229425 SNP between Malaysian (this study) and super populations from 1000 Genomes Project. EAS, East Asian; SAS, South Asian; AFR, African; EUR, European; AMR, Ad Mixed American. * Significantly different in chi-square test (P < 0.05).
.
Comparison of allele frequencies of FASN rs2229425 SNP between Malaysian (this study) and super populations from 1000 Genomes Project. EAS, East Asian; SAS, South Asian; AFR, African; EUR, European; AMR, Ad Mixed American. * Significantly different in chi-square test (P < 0.05).
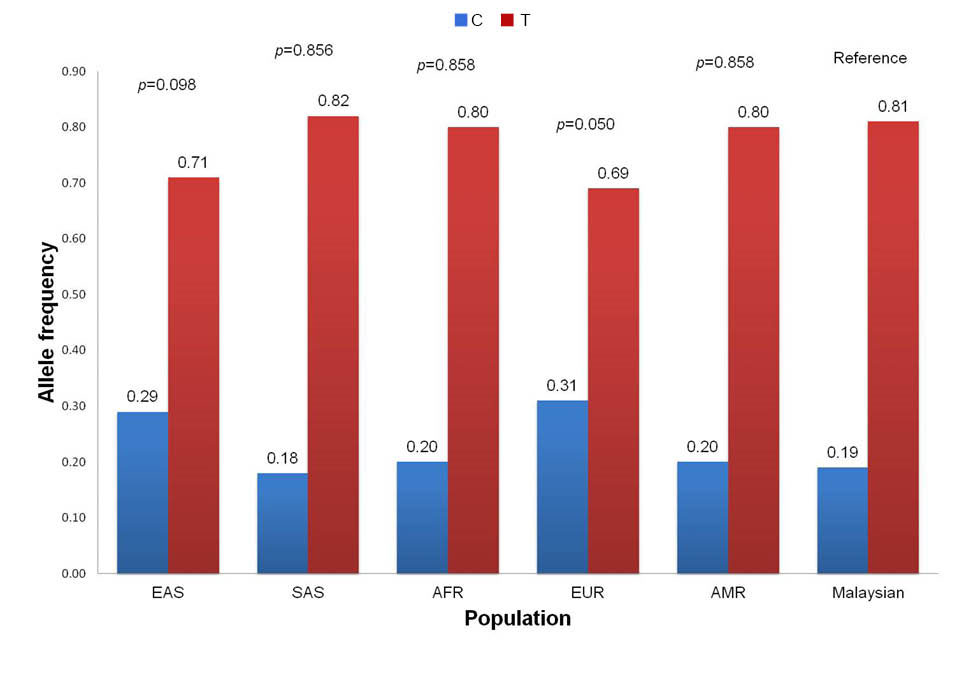
Fig. 6.
Comparison of allele frequencies of FASN rs2229422 SNP between Malaysian (this study) and super populations from 1000 Genomes Project. EAS, East Asian; SAS, South Asian; AFR, African; EUR, European; AMR, Ad Mixed American. * Significantly different in chi-square test (P < 0.05).
.
Comparison of allele frequencies of FASN rs2229422 SNP between Malaysian (this study) and super populations from 1000 Genomes Project. EAS, East Asian; SAS, South Asian; AFR, African; EUR, European; AMR, Ad Mixed American. * Significantly different in chi-square test (P < 0.05).
Distribution of allele frequencies of the rs2228035 SNP in our population is significantly different with the South Asian population (MAF = 10.0%, P = 0.017) but statistically similar to other populations including East Asian (MAF = 1.0%, P = 0.561), African (MAF = 7.0%, P = 0.088), European (MAF = 3.0%, P = 0.651) and Ad Mixed American (MAF = 5.0%, P = 0.248) (Fig. 7). Notably, the appearance of the variant A allele in the rs2228305 SNP has been reported to be protective against obesity in different populations, especially in male subjects.
13,14,22,23
The distribution of allele frequency of this SNP in Germans was similar to our population (P = 0.407) and our study also revealed that the variant allele of this SNP is more likely to defend against obesity in male subjects though no significant association was observed, indicating that the association of the rs2228305 SNP with the risk of overweight and obesity could be gender-specific.
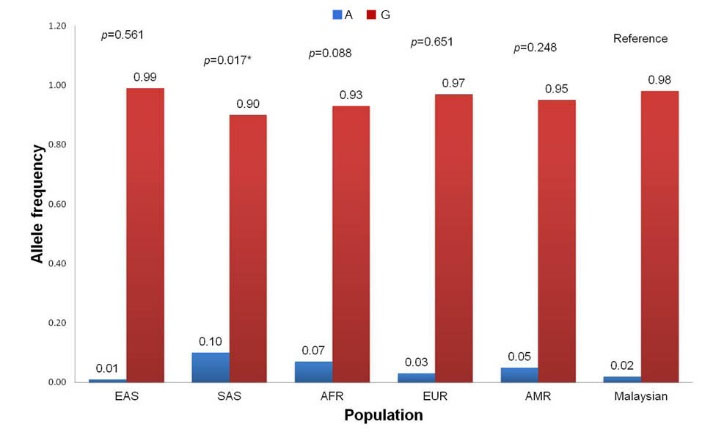
Fig. 7.
Comparison of allele frequencies of FASN rs2228305 SNP between Malaysian (this study) and super populations from 1000 Genomes Project. EAS, East Asian; SAS, South Asian; AFR, African; EUR, European; AMR, Ad Mixed American. * Significantly different in chi-square test (P < 0.05).
.
Comparison of allele frequencies of FASN rs2228305 SNP between Malaysian (this study) and super populations from 1000 Genomes Project. EAS, East Asian; SAS, South Asian; AFR, African; EUR, European; AMR, Ad Mixed American. * Significantly different in chi-square test (P < 0.05).
Sequencing of the FASN gene in Pima Indians and Germans successfully discovered 13 and 35 SNPs, respectively, and the latter showed 8 SNP combinations within the FASN gene in LD that associated with obesity.
13,14
We performed LD analysis for all 4 SNPs in this study and managed to identify the rs4246445 and rs2229425, as well as the rs2229425 and rs2228305 SNP combinations were in strong LD with D’ of 98% and 99%, respectively. However, the r2 values for both SNP combinations in LD were extremely low and therefore their effects seem to be independent of each other. One possible explanation is that the variant allele frequency for both rs2229425 and rs2228305 SNPs is exceptionally low in the population.
Our study also identified 3 haplotypes (TCGT, TCGC and CCAT) which were more common in overweight+obese subjects. Haplotypes CCGT and CCGC were more frequent in subjects with normal BMI. None of these haplotypes were evidently linked with obesity. Malaysia is a multi-ethnic country with a majority of Malays, Chinese and Indians, and some minor ethnic groups (i.e. KadazanDusun, Bajau, Orang Asli, etc). A recent review of obesity prevalence in Malaysia suggested that Malays and Indians are more obese than Chinese, and Orang Asli are the least obese ethnic group in Malaysia.
24
Therefore it is worth to fully sequence the FASN gene of different ethnic groups in the Malaysian population to determine haplotype that may markedly contribute to obesity endemic in the country.
Conclusion
In conclusion, this study showed significantly higher hemoglobin and WBC levels in the obese individuals compared to the normal individuals. Lack of association was observed for all 4 SNPs (rs4246445, rs2229425, rs2228305 and rs2229422) within the FASN gene with the risk of overweight and obesity in the population, including in the different parameters assessed (i.e. gender, smoking status, alcohol consumption and fast-food intake). The rs4246445 and rs2229425, as well as the rs2229425 and rs2228305 SNP combinations, were in strong LD but the r
2
values for both combinations were notably low, due to a low frequency of a variant allele in the rs2229425 and rs2228305 SNPs. Five common haplotypes were discovered in this study but none of them was evidently associated with the prevalence of overweight and obesity. We recommend to fully sequence the FASN gene of different ethnic groups in the Malaysian population to identify superior candidate of SNP combinations in LD and haplotypes that might be perceptibly linked with the risk of overweight and obesity.
Ethical approval
This study conforms with The Code of Ethics of the World Medical Association (Declaration of Helsinki) and the ethical approval was obtained from Universiti Malaysia Sabah Medical Ethics Committee with reference JKEtika 1/15 (7). All subjects were clearly explained about the details of the study and written informed consent was obtained.
Competing interests
There is no conflict of interests to be reported.
Acknowledgments
We would like to thank all volunteers who participated in this study. This study is supported by the Ministry of Higher Education, Malaysia (TRGS0006-SG-2/2014) and Universiti Malaysia Sabah (SBK0180-SG-2014).
Research Highlights
What is current knowledge?
simple
-
√ Obesity is commonly associated with several life-threatening
diseases.
-
√ Nearly half of the Malaysian adults are reported to be
overweight and about 17.7% of them are obese.
-
√ FASN gene is located at chromosome 17q25 that has the
strongest evidence for linkage with the percentage of body
fat.
-
√ FASN rs4246445, rs2229425, rs2228305 and rs2229422
SNPs have been significantly associated with obesity risk
in Germans, but yet to be investigated in the Malaysian
population.
What is new here?
simple
-
√ Lack of evidences to associate the FASN rs4246445,
rs2229425, rs2228305 and rs2229422 SNPs with the risk of
overweight and obesity in the Malaysian population.
-
√ All 4 SNPs are independent of each other.
-
√ All identified haplotypes were not significantly linked
with overweight and obesity in the population.
References
-
World Health Organization. Obesity and overweight. 2017. Available from: http://www.who.int/mediacentre/factsheets/fs311/en/.
-
Malaysian Institute for Public Health. National Health and Morbidity Survey Report 2015, Volume II - Non-communicable Diseases & Other Health Problems. Kuala Lumpur: Ministry of Health Malaysia Press; 2015.
- Haley MJ, Lawrence CB. Obesity and stroke: can we translate from rodents to patients?. J Cerebral Blood Flow Metabol 2016; 36:2007-21. doi: 10.1177/0271678X16670411 [Crossref] [ Google Scholar]
- Fuster JJ, Ouchi N, Gokce N, Waish K. Obesity-induced changes in adipose tissue microenvironment and their impact on cardiovascular disease. Circ Res 2016; 118:1786-807. doi: 10.1161/CIRCRESAHA.115.306885 [Crossref] [ Google Scholar]
- Nadira F, Djamila M, Lamia K, Saida F. Type 2 diabetes and obesity. Endocrine Abstracts 2016; 41:EP470. doi: 10.1530/endoabs.41.EP470 [Crossref] [ Google Scholar]
-
O’Rourke RW. Obesity and cancer. In: Kurian M, Wolfe BM, Ikramuddin S, eds. Metabolic Syndrome and Diabetes: Medical and Surgical Management. New York: Springer; 2016.
-
Zhang X, Wu WKK, Yu J. Obesity and cancer. In: Ahmad SI, Imam SK, eds. Obesity: A Practical Guide. Switzerland: Springer International Publishing; 2016.
- Norman RA, Tataranni PA, Pratley R, Thompson DB, Hanson RL, Prochazka M. Autosomal genomic scan for loci linked to obesity and energy metabolism in Pima Indians. Am J Hum Genet 1998; 62:659-68. doi: 10.1086/301758 [Crossref] [ Google Scholar]
- Semenkovich CF. Regulation of fatty acid synthase (FAS). Prog Lipid Res 1997; 36:43-53. doi: 10.1016/S0163-7827(97)00003-9 [Crossref] [ Google Scholar]
- Loftus TM, Jaworsky DE, Frehywot GL, Townsend CA, Ronnett GV, Lane MD. Reduced food intake and body weight in mice treated with fatty acid synthase inhibitors. Science 2000; 288:2379-81. doi: 10.1126/science.288.5475.2379 [Crossref] [ Google Scholar]
- Kumar MV, Shimokawa T, Nagy TR, Lane MD. Differential effects of a centrally acting fatty acid synthase inhibitor in lean and obese mice. Proc Natl Acad Sci USA 2002; 99:1921-5. doi: 10.1073/pnas.042683699 [Crossref] [ Google Scholar]
- Thupari JN, Landree LE, Ronnett GV, Kuhajda FP. C75 increases peripheral energy utilization and fatty acid oxidation in diet-induced obesity. Proc Natl Acad Sci USA 2002; 99:9498-502. doi: 10.1073/pnas.132128899 [Crossref] [ Google Scholar]
- Kovacs P, Harper I, Hanson RL, Infante AM, Bogardus C, Tataranni PA. A novel missense substitution (Val1483Ile) in the fatty acid synthase gene (FAS) is associated with percentage of body fat and substrate oxidation rates in nondiabetic Pima Indians. Diabetes 2004; 53:1915-9. doi: 10.2337/diabetes.53.7.1915 [Crossref] [ Google Scholar]
- Schleinitz D, Klöting N, Körner A, Berndt J, Reichenbächer M, Tönjes A. Effect of genetic variation in the human fatty acid synthase gene (FASN) on obesity and fat depot-specific mRNA expression. Obesity 2010; 18:1218-25. doi: 10.1038/oby.2009.392 [Crossref] [ Google Scholar]
- Rodriguez S, Gaunt TR, Day IN. Hardy-Weinberg equilibrium testing of biological ascertainment for Mendelian randomization studies. Am J Epidemiol 2009; 169:505-14. doi: 10.1093/aje/kwn359 [Crossref] [ Google Scholar]
- Shi YY, He L. SHEsis, a powerful software for analyses of linkage disequilibrium, haplotype construction, and genetic association at polymorphism loci. Cell Res 2005; 15:97-8. doi: 10.1038/sj.cr.7290272 [Crossref] [ Google Scholar]
- Rao GM, Morghom LO. Effect of obesity on erythrocyte count and hemoglobin levels in Libyan diabetic patients. Clin Physiol Biochem 1986; 4:277-80. [ Google Scholar]
- Gozkaman A, Okuturlar Y, Mert M, Harmankaya O, Kumbasar A. The relationship between haemoglobin and BMI in overweight and obese patients. Endocrine Abstracts 2015; 37:EP632. doi: 10.1530/endoabs.37.EP632 [Crossref] [ Google Scholar]
- Rocha VZ, Folco EJ. Inflammatory concepts of obesity. Int J Inflammation 2011; 2011:529061. doi: 10.4061/2011/529061 [Crossref] [ Google Scholar]
- Rodríguez-Hernández H, Simental-Mendía LE, Rodríguez-Ramírez G, Reyes-Romero MA. Obesity and inflammation: epidemiology, risk factors, and markers of inflammation. Int J Endocrinol 2013; 2013:678159. doi: 10.1155/2013/678159 [Crossref] [ Google Scholar]
- Emanuela F, Grazia M, Marco DR, Paola LM, Giorgio F, Marco B. Inflammation as a link between obesity and metabolic syndrome. J Nutri Metabol 2012; 2012:476380. doi: 10.1155/2012/476380 [Crossref] [ Google Scholar]
- Körner A, Ma L, Franks PW, Kiess W, Baier LJ, Stumvoll M. Sex-specific effect of the Val1483Ile polymorphism in the fatty acid synthase gene (FAS) on body mass index and lipid profile in Caucasian children. Int J Obes 2007; 31:353-8. doi: 10.1038/sj.ijo.0803428 [Crossref] [ Google Scholar]
- Moreno-Navarrete JM, Botas P, Valdés S, Ortega FJ, Delgado E, Vázquez-Martín A. Val1483Ile in FASN gene is linked to central obesity and insulin sensitivity in adult white men. Obesity (Silver Spring) 2009; 17:1755-61. doi: 10.1038/oby.2009.65 [Crossref] [ Google Scholar]
- Lim KG. A review of adult obesity research in Malaysia. Med J Malaysia 2016; 71:1-19. [ Google Scholar]