Bioimpacts. 10(3):141-150.
doi: 10.34172/bi.2020.18
Original Research
Microfluidic system for screening disease based on physical properties of blood
Siddharth Singh Yadav 1, Basant Singh Sikarwar 1, *  , Priya Ranjan 2, Rajiv Janardhanan 3
Author information:
1Department of Mechanical Engineering, Amity University Uttar Pradesh, Noida, India
2Department of Electrical Engineering, Amity University Uttar Pradesh, Noida, India
3Department of Public Health, Amity University Uttar Pradesh, Noida, India
Abstract
Introduction:
A key feature of the 'One Health' concept pertains to the design of novel point of care systems for largescale screening of health of the population residing in resource-limited areas of low- and middle-income countries with a view to obtaining data at a community level as a rationale to achieve better public health outcomes. The physical properties of blood are different for different samples. Our study involved the development of an innovative system architecture based upon the physical properties of blood using automated classifiers to enable large-scale screening of the health of the population living in resource-limited settings.
Methods:
The proposed system consisted of a simple, robust and low-cost sensor with capabilities to sense and measure even the minute changes in the physical properties of blood samples. In this system, the viscosity of blood was derived from a power-law model coupled with the Rabinowitsch-Mooney correction for non-Newtonian shear rates developed in a steady laminar Poiseuille flow. Surface tension was measured by solving the Young-Laplace equation for pendant drop shape hanging on a vertical needle. An anticipated outcome of this study would be the development of a novel automated classifier based upon the rheological attributes of blood. This automated classifier would have potential application in evaluating the health status of a population at regional and global levels.
Results:
The proposed system was used to measure the physical properties of various samples like normal, tuberculous and anemic blood samples. The results showed that the physical properties of these samples were different as compared to normal blood samples. The major advantage of this system was low-cost, as well as its simplicity and portability.
Conclusion:
In this work, we proposed making a case for the validation of a low-cost version of a microfluidic system capable of scanning large populations for a variety of diseases as per the WHO mandate of "One Health".
Keywords: Microfluidics, Screening system, Surface tension, Viscosity, Tuberculosis, Anaemia
Copyright and License Information
© 2020 The Author(s)
This work is published by BioImpacts as an open access article distributed under the terms of the Creative Commons Attribution License (
http://creativecommons.org/licenses/by-nc/4.0/). Non-commercial uses of the work are permitted, provided the original work is properly cited.
Introduction
Blood is a non-Newtonian shear-thinning fluid and its rheological properties such as plasma viscosity, hematocrit, red blood cell accumulation, and deformability vary with age and sex.
1,2
Blood viscosity increases from childhood to adult age but decreases in elderly men whilst progressively increasing in elderly women.
3
The rheological properties of blood undergo certain changes during both the process of ontogenesis in humans, as well as shrinkage due to the age-related involution. Pathological test reports indicate that patients afflicted with tuberculosis and anemia have low red blood cell and platelets count causing the blood to become thinner with lower levels of viscosity.
4-6
A recent study has reported that fluid and flow properties of blood affect tissue perfusion, which contributes significantly to hydrodynamic resistance in vessels.
7
Similarly, a variety of human diseases could be detected due to the variance of surface tension in the blood.
8
In a weightless state, the surface tension of blood is known to influence the formation of blood clots, thereby affecting the character of bleeding from the skin.
9
Blood rheology and surface tension have a statutory role in healing.
10
The rheological attributes of the Blood have been extensively studied over the last 25 years by groups with divergent professional competencies such as physicists, material scientists, as well as engineers.
12,13
It is only in the last decade or so that biologists and doctors have evinced interest in using the physical properties of blood to classify and typify many human and cattle diseases. Given its significance, unfortunately, there is an acute lack of systematic studies correlating rheology and surface tension to pathological disease states,
12-14
although few studies have tried to ascribe the diseased state of an individual with rheological properties and surface tension of blood.
15,16
A variety of disease states are known to affect the physical properties of blood and many scientists
11,17,18
have reported this observation as a part of studies focusing on the pattern recognition of bloodstains for healthy and diseased patients on the basis of microscopic structures as shown in Fig. 1. These studies have demonstrated that the pattern of the stains of blood varies extensively for blood samples representing different disease states.
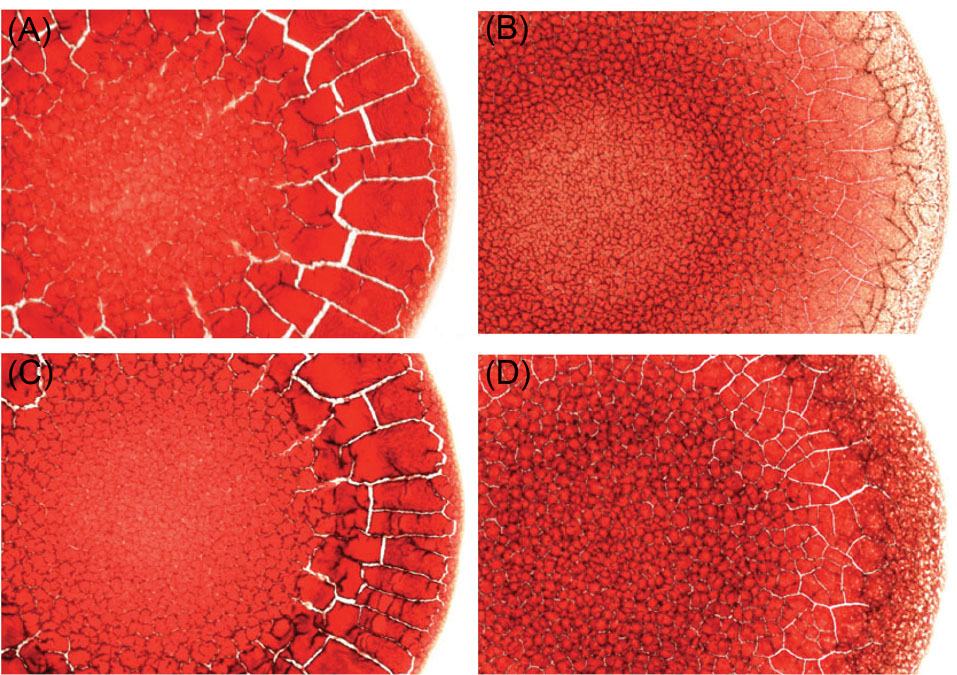
Fig. 1.
Micrograph is depicting morphological attributes of a blood smear (235 pixel/mm):(A) a blood smear sample of a normal woman, (B) a smear from a woman suffering from anaemia, (C) a smear sample of a normal man, and (D) a person with hyperlipidaemia.
11
.
Micrograph is depicting morphological attributes of a blood smear (235 pixel/mm):(A) a blood smear sample of a normal woman, (B) a smear from a woman suffering from anaemia, (C) a smear sample of a normal man, and (D) a person with hyperlipidaemia.
11
Moreover, they relate this anomaly to the physical properties of blood such as surface tension and viscosity.
11,16,19
Impact of viscosity and surface tension on biomedical formulation and technology has been studied in significant detail.
18,20
Broberg et al sought to determine the relationship between blood viscosity and iron deficiency and their impact on the clinical presentation of cyanotic congenital heart diseases.
21
The viscosity of blood is known to increase in the case of patients burdened with iron deficiency.
22
Sikarwar et al were able to decipher a recognition pattern in the bloodstains from patients with a variety of pathophysiological disorders.
23
Mukesh Roy et al reported flow and fluid properties to be the prime factors for producing high wall shear stress close to the narrow zone of veins in their simulations.
24
Rosina et al showed that rheological properties of blood differed not only with respect to body temperature but also surface tension, which in turn has a statutory effect of many vital functions of the human body.
25
Fathi-Azarbayjani and Jouyban reported that surface tension measurement combined with a routine lab test is a novel non-invasive technique used for not only diagnosing various diseases but also ranking the patients in the order of their severity.
26
Sikarwar et al proposed the non-linear system of architecture for screening diseases based on the certain pattern in blood samples stains.
15
Kim et al proposed a novel technique for measuring hemoglobin for screening anemia with help of microfluidics system which consists of a novel single sidewall air bubble-free microfluidic cuvette.
27
Yap et al designed and fabricated microfluidics systems for facilitating the diagnosis of iron deficiency-induced anemia.
28
They used this system for detecting various diseases such as human immunodeficiency virus (HIV), malaria and dengue as well. The viscosity of blood was observed to decrease substantially in patients suffering from dengue or malaria and this attribute could be used not only for large-scale screening of populace afflicted with the disease along with their surrogate markers but also to find the precursors of the above-mentioned two diseases.
Pathological features of diseases vary in nature and magnitude. Taken together with inherent variances in the genetic base across the Indian sub-continent, correlation of variances in rheological and physical properties of blood could be used effectively for preliminary screening of the health status of a community using minimally invasive techniques. Although viscometer and surface tensiometer systems are very common in the field of engineering, their usage in the context of biological fluids and medicine is still in its infancy.
29,30
A reason for this discrepancy could be the fact that the rheology and surface interface properties of biological fluids have not been applied extensively to characterize the disease pathophysiology extensively.
This formed the premise for the design and fabrication of a simple low-cost system for large-scale screening diseases based on the physical properties of blood. This system consists of a micro-capillary scanning viscometer and a micro-tensiometer to measure the physical properties of blood samples. Later, automated linear and nonlinear classifiers were also developed for automated reasoning and presentation of results on a user-friendly interface. The major advantages of this system are low cost and high accuracy for measuring data not to mention its portability. This system requires only a few microliters (µL) of blood for making its measurements. The portability of the system could be exploited to develop novel points of care systems with the capability of large-scale subjects in resource-limited settings across the low- and middle-income countries (LMICs) which is in accord with the WHO’s mandate of “One Health”. This system has been calibrated and tested over a spectrum of blood samples and the result has been found to be satisfactory.
Materials and Methods
Details of proposed system
A simple, low-cost system was designed and fabricated for screening diseases based on physical properties of blood as shown in Fig. 2. It consists of two micro-fluidic modules namely capillary scanning viscometer and pendant drop tensiometer (Fig. 2A-B) integrated with system architecture and user interface (UI) for disease mapping. It measures the physical properties of blood for the development of a unique disease mapping system (Fig. 2C) which classifies the disease based on measured viscosity and surface tension of blood sample along with the automated risk stratification of susceptibility patterns in a user-friendly manner.
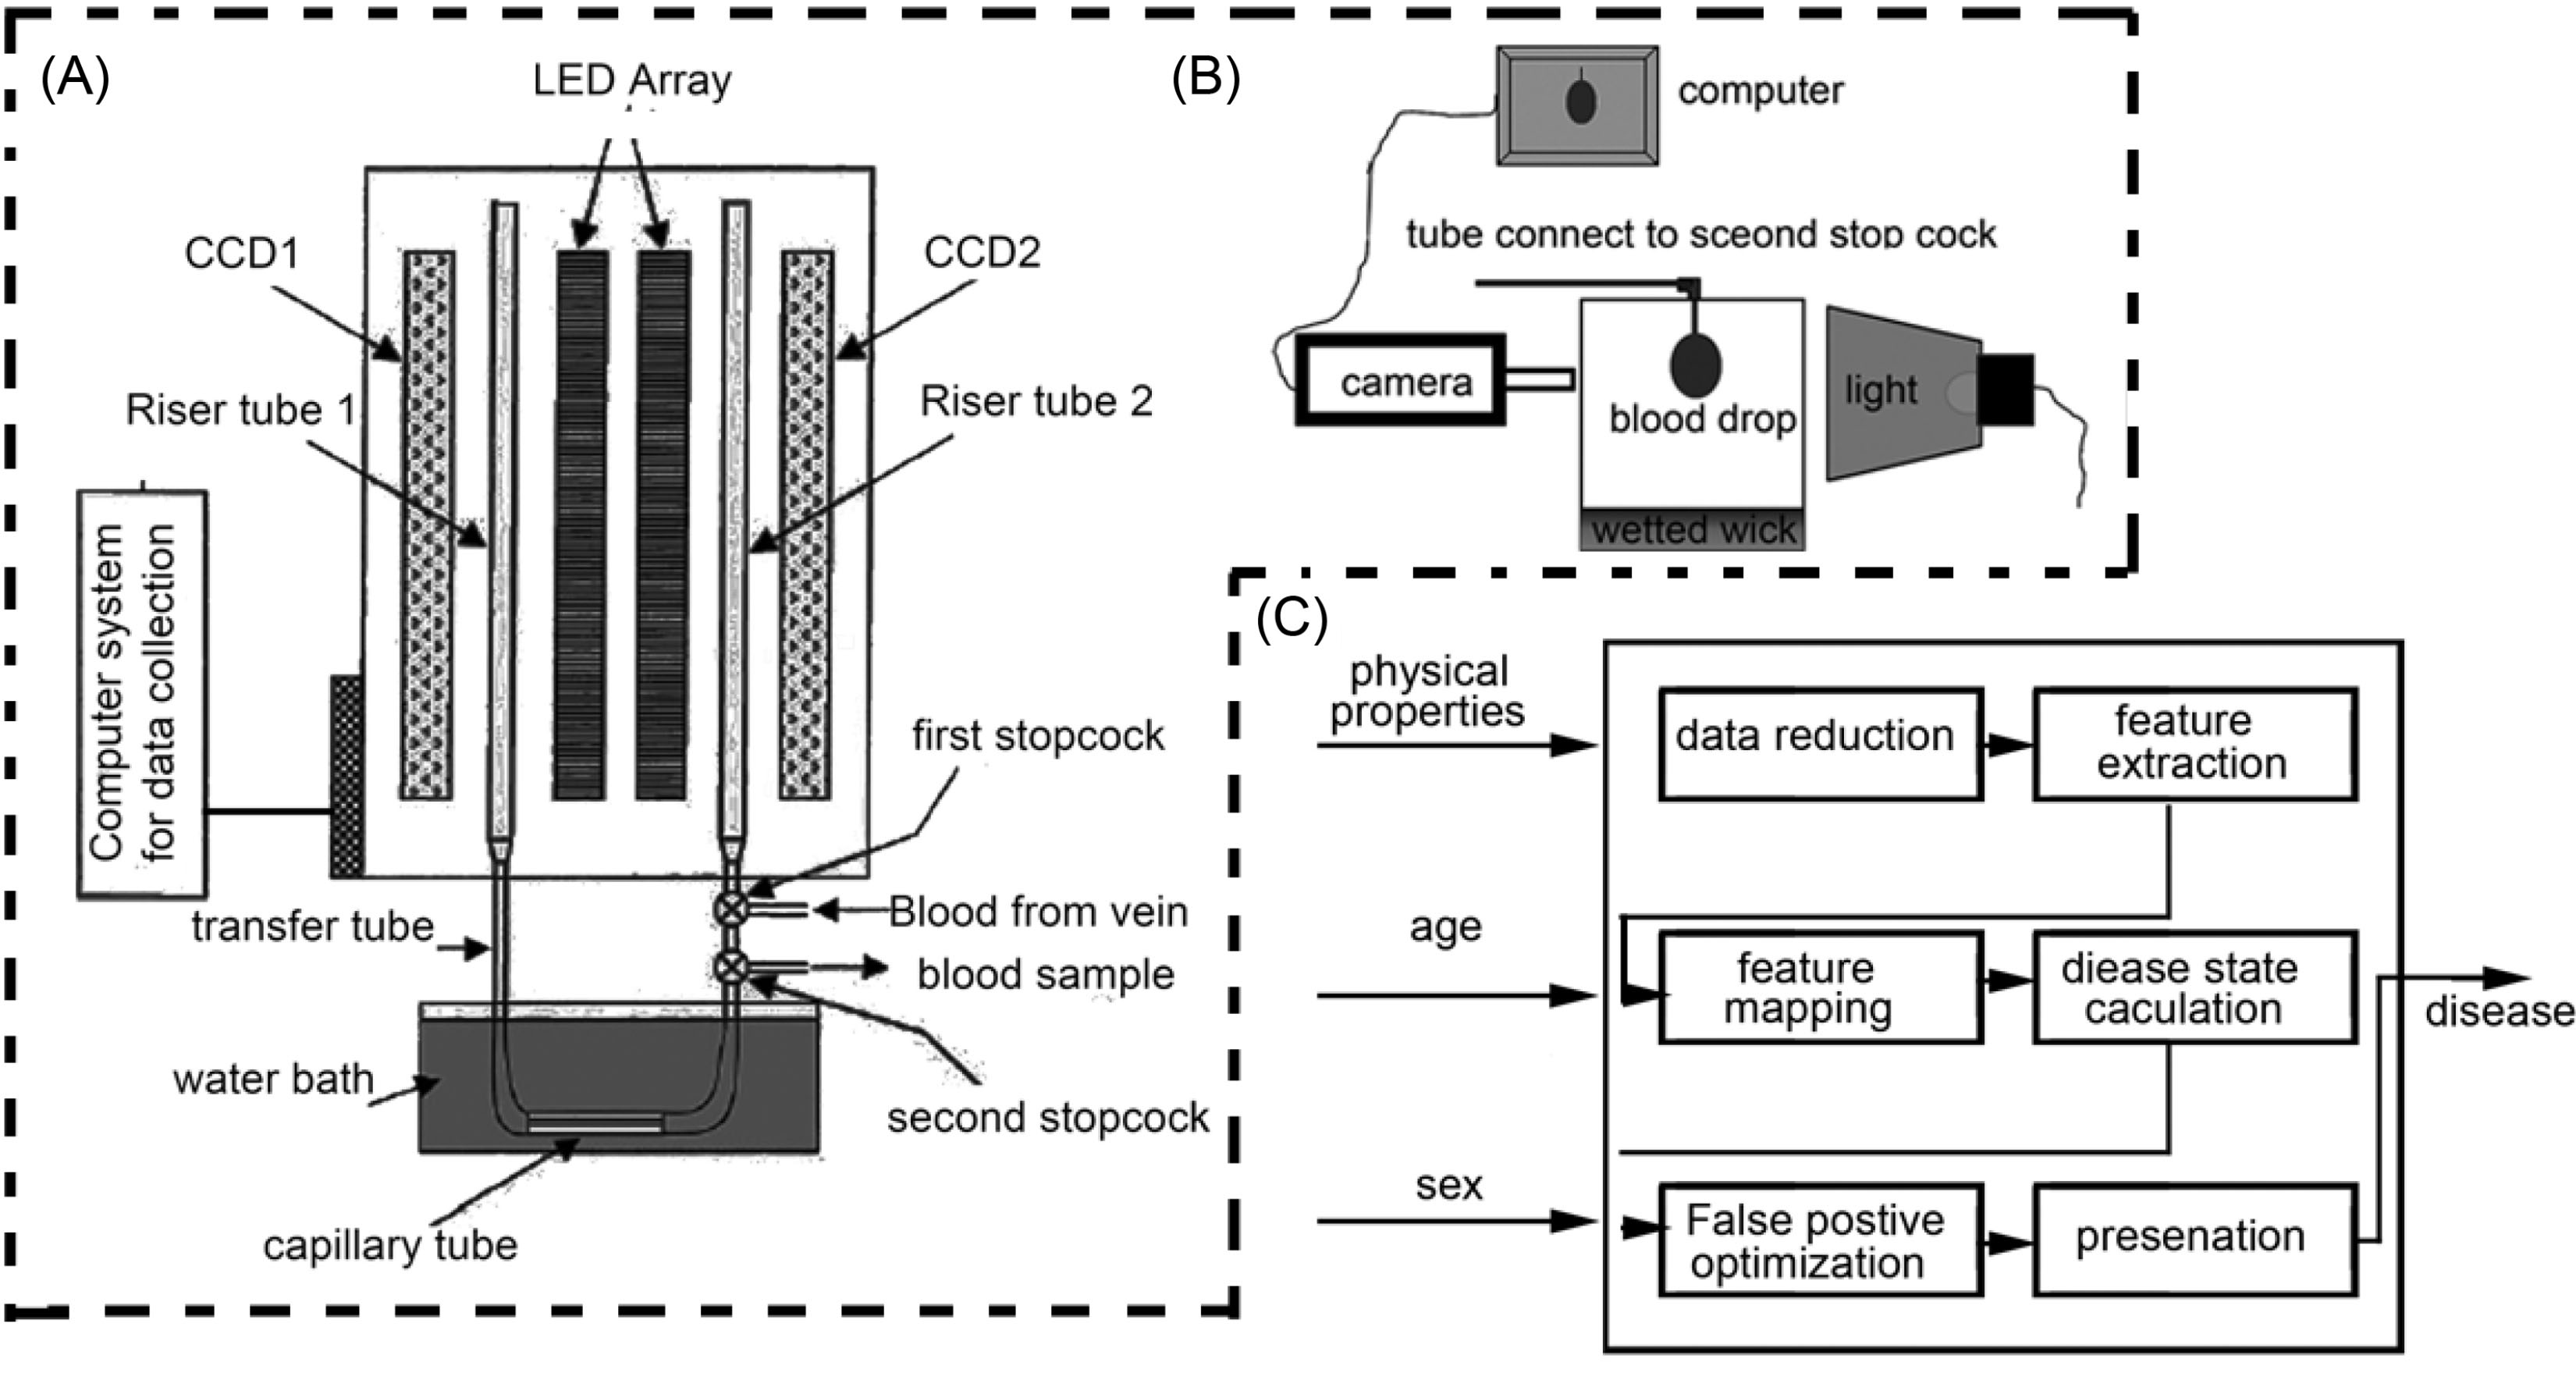
Fig. 2.
Schematic diagram of microfluidic system for physical properties of blood; (A) scanning capillary tube viscometer system, (B) pendant drop tensiometer, and (C) system architecture for diseases mapping.
.
Schematic diagram of microfluidic system for physical properties of blood; (A) scanning capillary tube viscometer system, (B) pendant drop tensiometer, and (C) system architecture for diseases mapping.
The system for measuring the physical properties was fabricated at Mechanical Engineering Department, Amity University Uttar Pradesh NOIDA and some parts of this system were fabricated in the local market of Noida, India. The details of the components bought for fabrication are shown in Table 1. A micro-capillary viscometer with a surface tension measurement device is to be designed and fabricated. The schematic diagram is shown in Fig. 2. The device is portable and maintains blood samples in a closed system, which is coated with biocompatible material and temperature-controlled, simulating in vivo conditions. It can be placed directly in the blood sample laboratory, permitting blood to be drawn directly into the device, precluding the need for anticoagulation. Scanning capillary tube viscometer, as shown in Fig. 2A, consists of charge-coupled systems that are positioned vertically, two light-emitting diodes with two transparent riser tubes used to measure the flow rate of blood through the capillary at different pressure head. The inside diameter of both the transfer and riser tubes used in the present tests were d1=d2=3 mm. The inside diameter and length of the capillary tube were dcap=0.797mm and Lcap=100 mm, respectively. The small diameter of the capillary tube, compared with those of both the transfer and riser tubes, is chosen to ensure that the friction in the capillary tube was significantly greater than those in the others.
Table 1.
The details of components used in fabrication of scanning capillary tube viscometer and pendant drop tensiometer
|
Components
|
Specification
|
Manufacturer
|
| Syringe pump |
Injection accuracy = ±3%, pump mechanical accuracy=±2%
reproducibility =0.1%, Maximum number of syringes = 1 power consumption=30 VA, volume limit range=0.1 mL to 999.9 mL and weight=2.0 kg
|
Hygeia Medical Supplies and Services Sheridan Boulevard Unit 3C, Lakewood, CO 80214, USA |
| Micro-capillary tube |
Diameter: 0.797 mm and length: 100 mm
Characteristics: (a) transparent, (b) resistant to almost all inorganic chemicals, (c) tasteless, (d) smooth polished inner wall, (e) low gas permeability, (f) non-aging and non-oxidizing, and (g) high dielectric constant.
|
IDEX India Pvt Ltd, 205, Matharu Arcade, Plot No. 32 Subhash Road, Vile Parle (East) |
| Riser tube |
Suitable for above micro-capillary tubes
Diameter: 3 mm
|
IDEX India Pvt Ltd, 205, Matharu Arcade, Plot No. 32 Subhash Road, Vile Parle (East) |
| Transfer tube |
Suitable for above micro-capillary tubes
Diameter: 3 mm
|
IDEX India Pvt Ltd, 205, Matharu Arcade, Plot No. 32 Subhash Road, Vile Parle (East) |
| CCD (charged coupled device) |
High sensitivity high resolution, Low smear and low dark current Continuous variable-speed shutter horizontal register: 5 V drive
Reset gate: 5 V drive
|
SONY ICX059CL |
| LED (light emitting diode) |
Model: WC301-08 white color
Frequency: 0.31×0.32
Intensity: 17,000 mcd
|
Bhagwati Lighting Industries Peeragarhi,
New Delhi
|
| High speed camera |
Max.Resolution-1280 × 1280
Max.FPS-1850 fps
|
Phantom LAB3a10 with Nikon AF-S |
| Syringes |
10 mL plastic syringes |
Fisher scientific |
The blood is a non-Newtonian shear-thinning fluid. Its viscosity is represented as:
Where μb is the viscosity of blood, k the flow consistency index, n the flow behavior index, and the rate of shearing.
The viscosity of the blood was derived from the power-law model coupled with the Rabinowitsch-Mooney correction for non-Newtonian shear rates developed in a steady laminar Poiseuille flow. Hence the volume flow rate ( Q ) is estimated as:
Accordingly, the law of conservation energy for scanning capillary tube viscometer is
31
:
(4)
For sake of simplicity, one may define a new function
and so that equation 4 becomes
Equation 5 is the first-order linear differential equation, and its analytical solution is
(6)
The computer code written to determine the viscosity from experimental data is depicted as a flow diagram (Fig. 3).
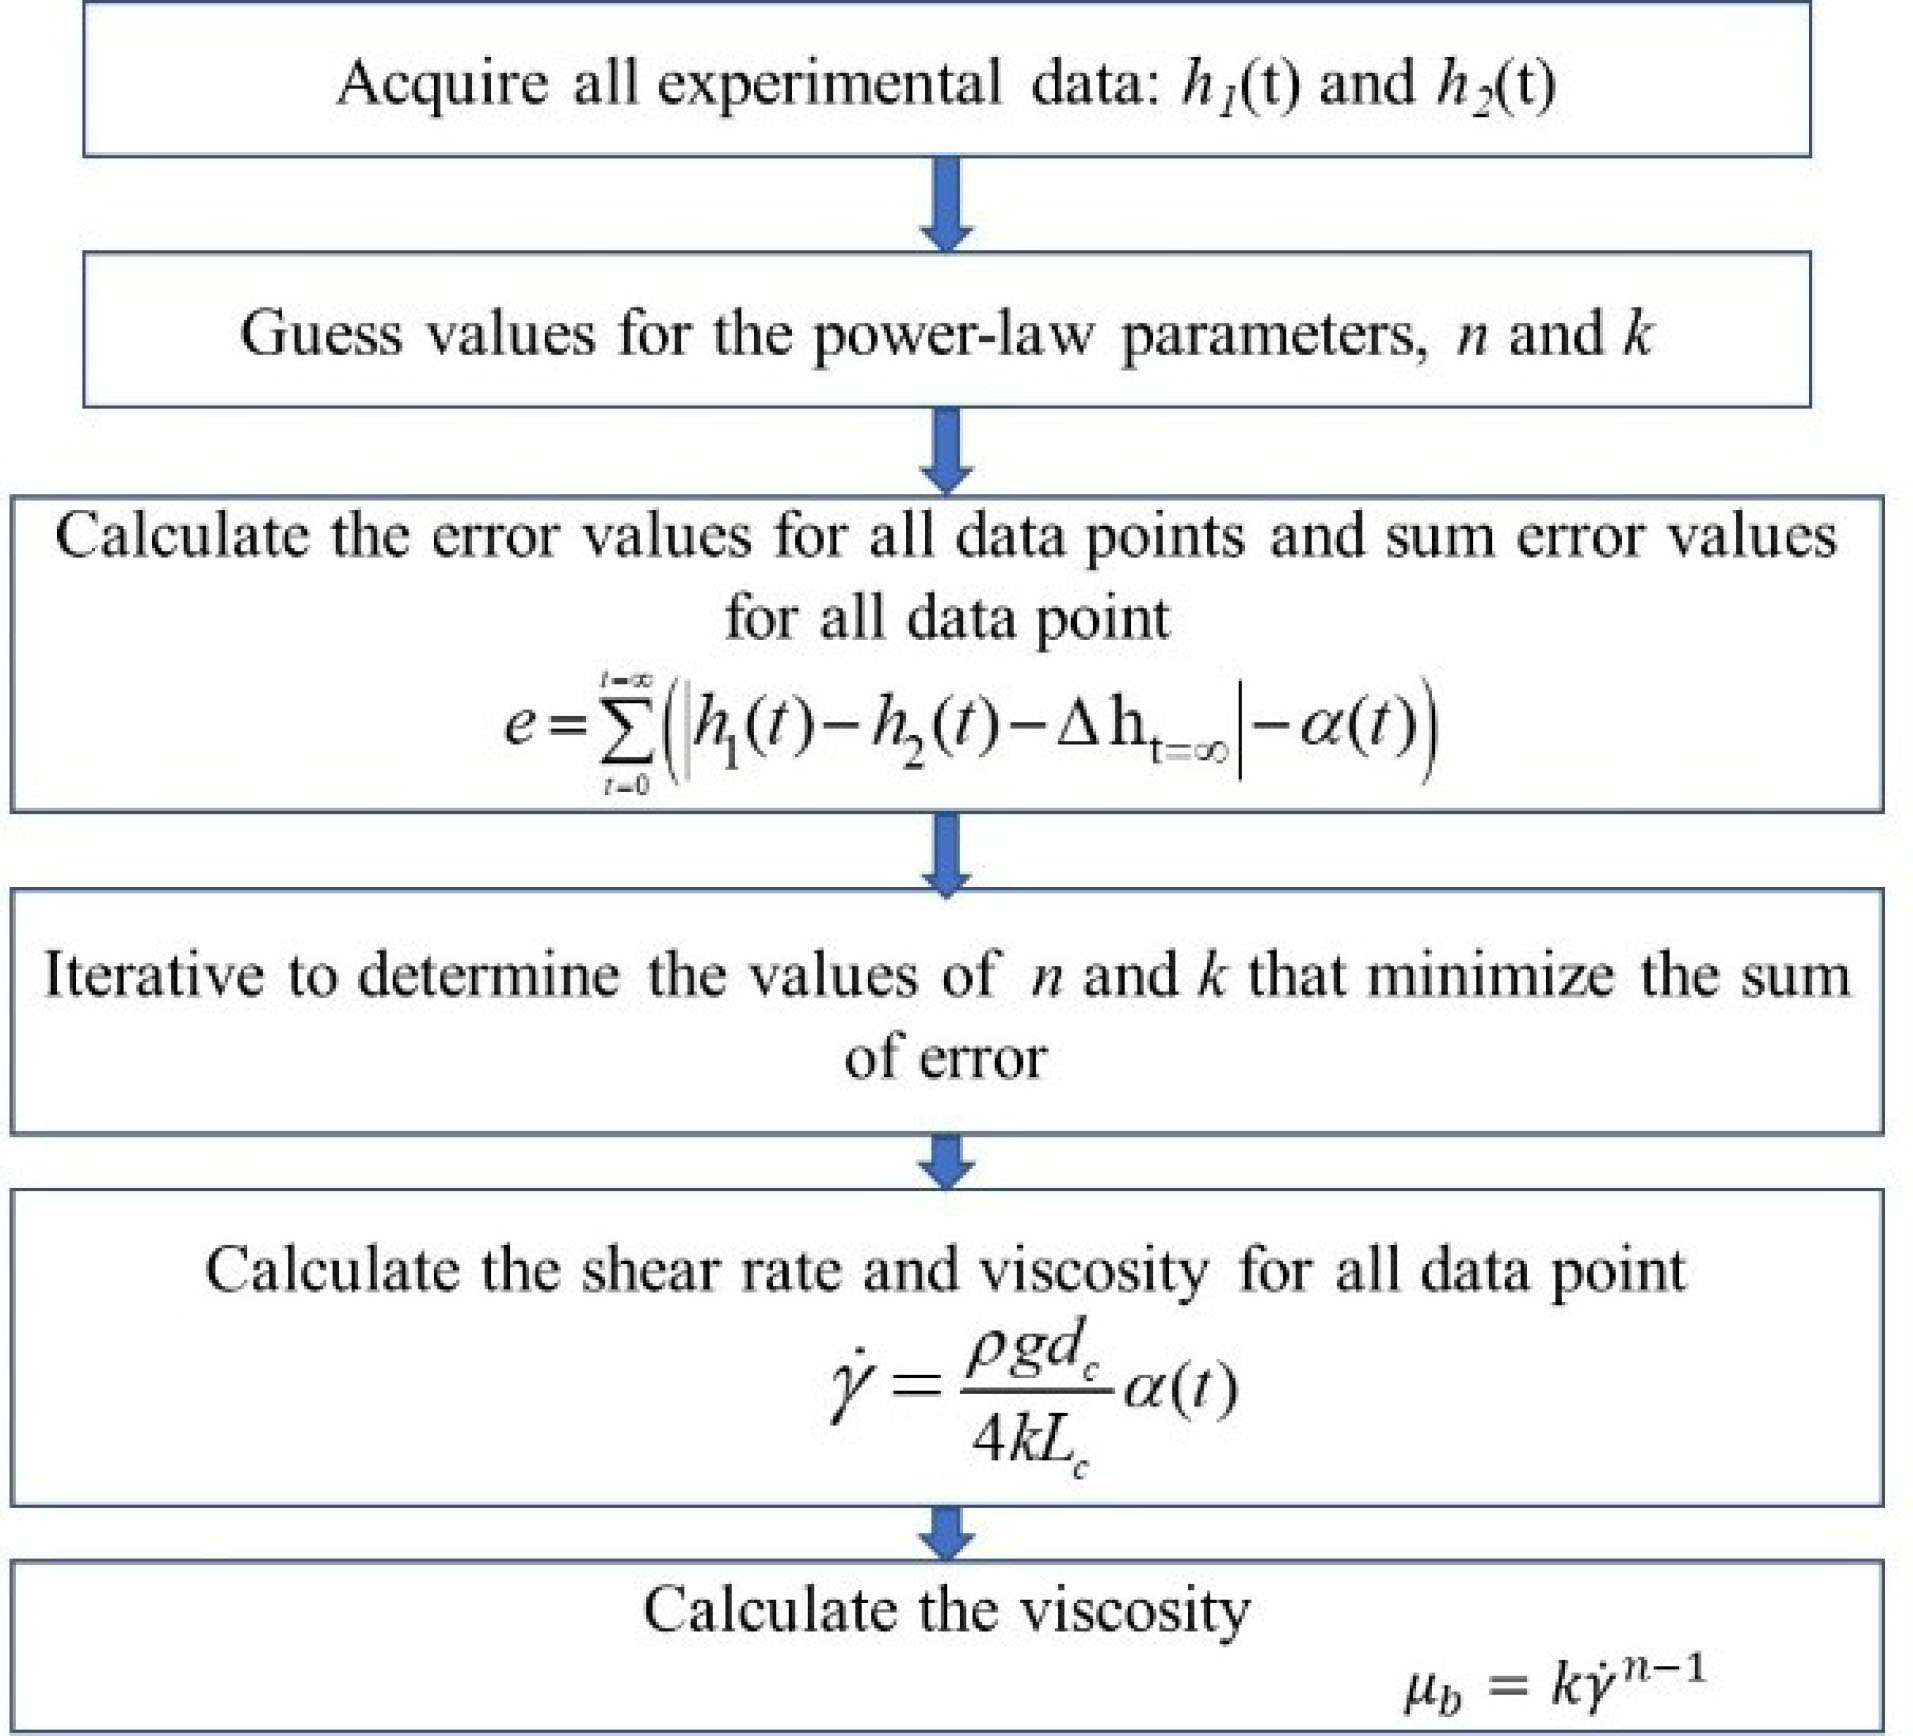
Fig. 3.
Flow diagram depicting the measurement of viscosity of the blood sample.
.
Flow diagram depicting the measurement of viscosity of the blood sample.
Fig. 2B shows a tensiometer which consists of a transparent cubical chamber (1 cm × 1 cm × 4 cm), sufficiently large as compared to the size of the droplet. Its bottom is exposed to constant humidity levels throughout the experiment, via a thick porous layer of paper to ensure that there is no evaporation of drop inside the test cell. In this method, approximately 5 µL stable drop at 20-gauge blunt needle tip is formed under controlled conditions and an image of the drop is captured by a camera-aided with appropriate lighting. The shape of the captured droplet interface is obtained using image processing. Based on the Young-Laplace equations which is as follows:
Equation 7 is solved for numerically appropriate boundary conditions to estimate the interface shape of a drop. The shape of a pendant droplet interface of volume 5 µL can be found theoretically (solving equation 7 numerically) by iterating the value of surface tension till the predicted interface equals to the captured drop interface. Fig. 4 shows the flow diagram for measuring the surface tension of blood samples.
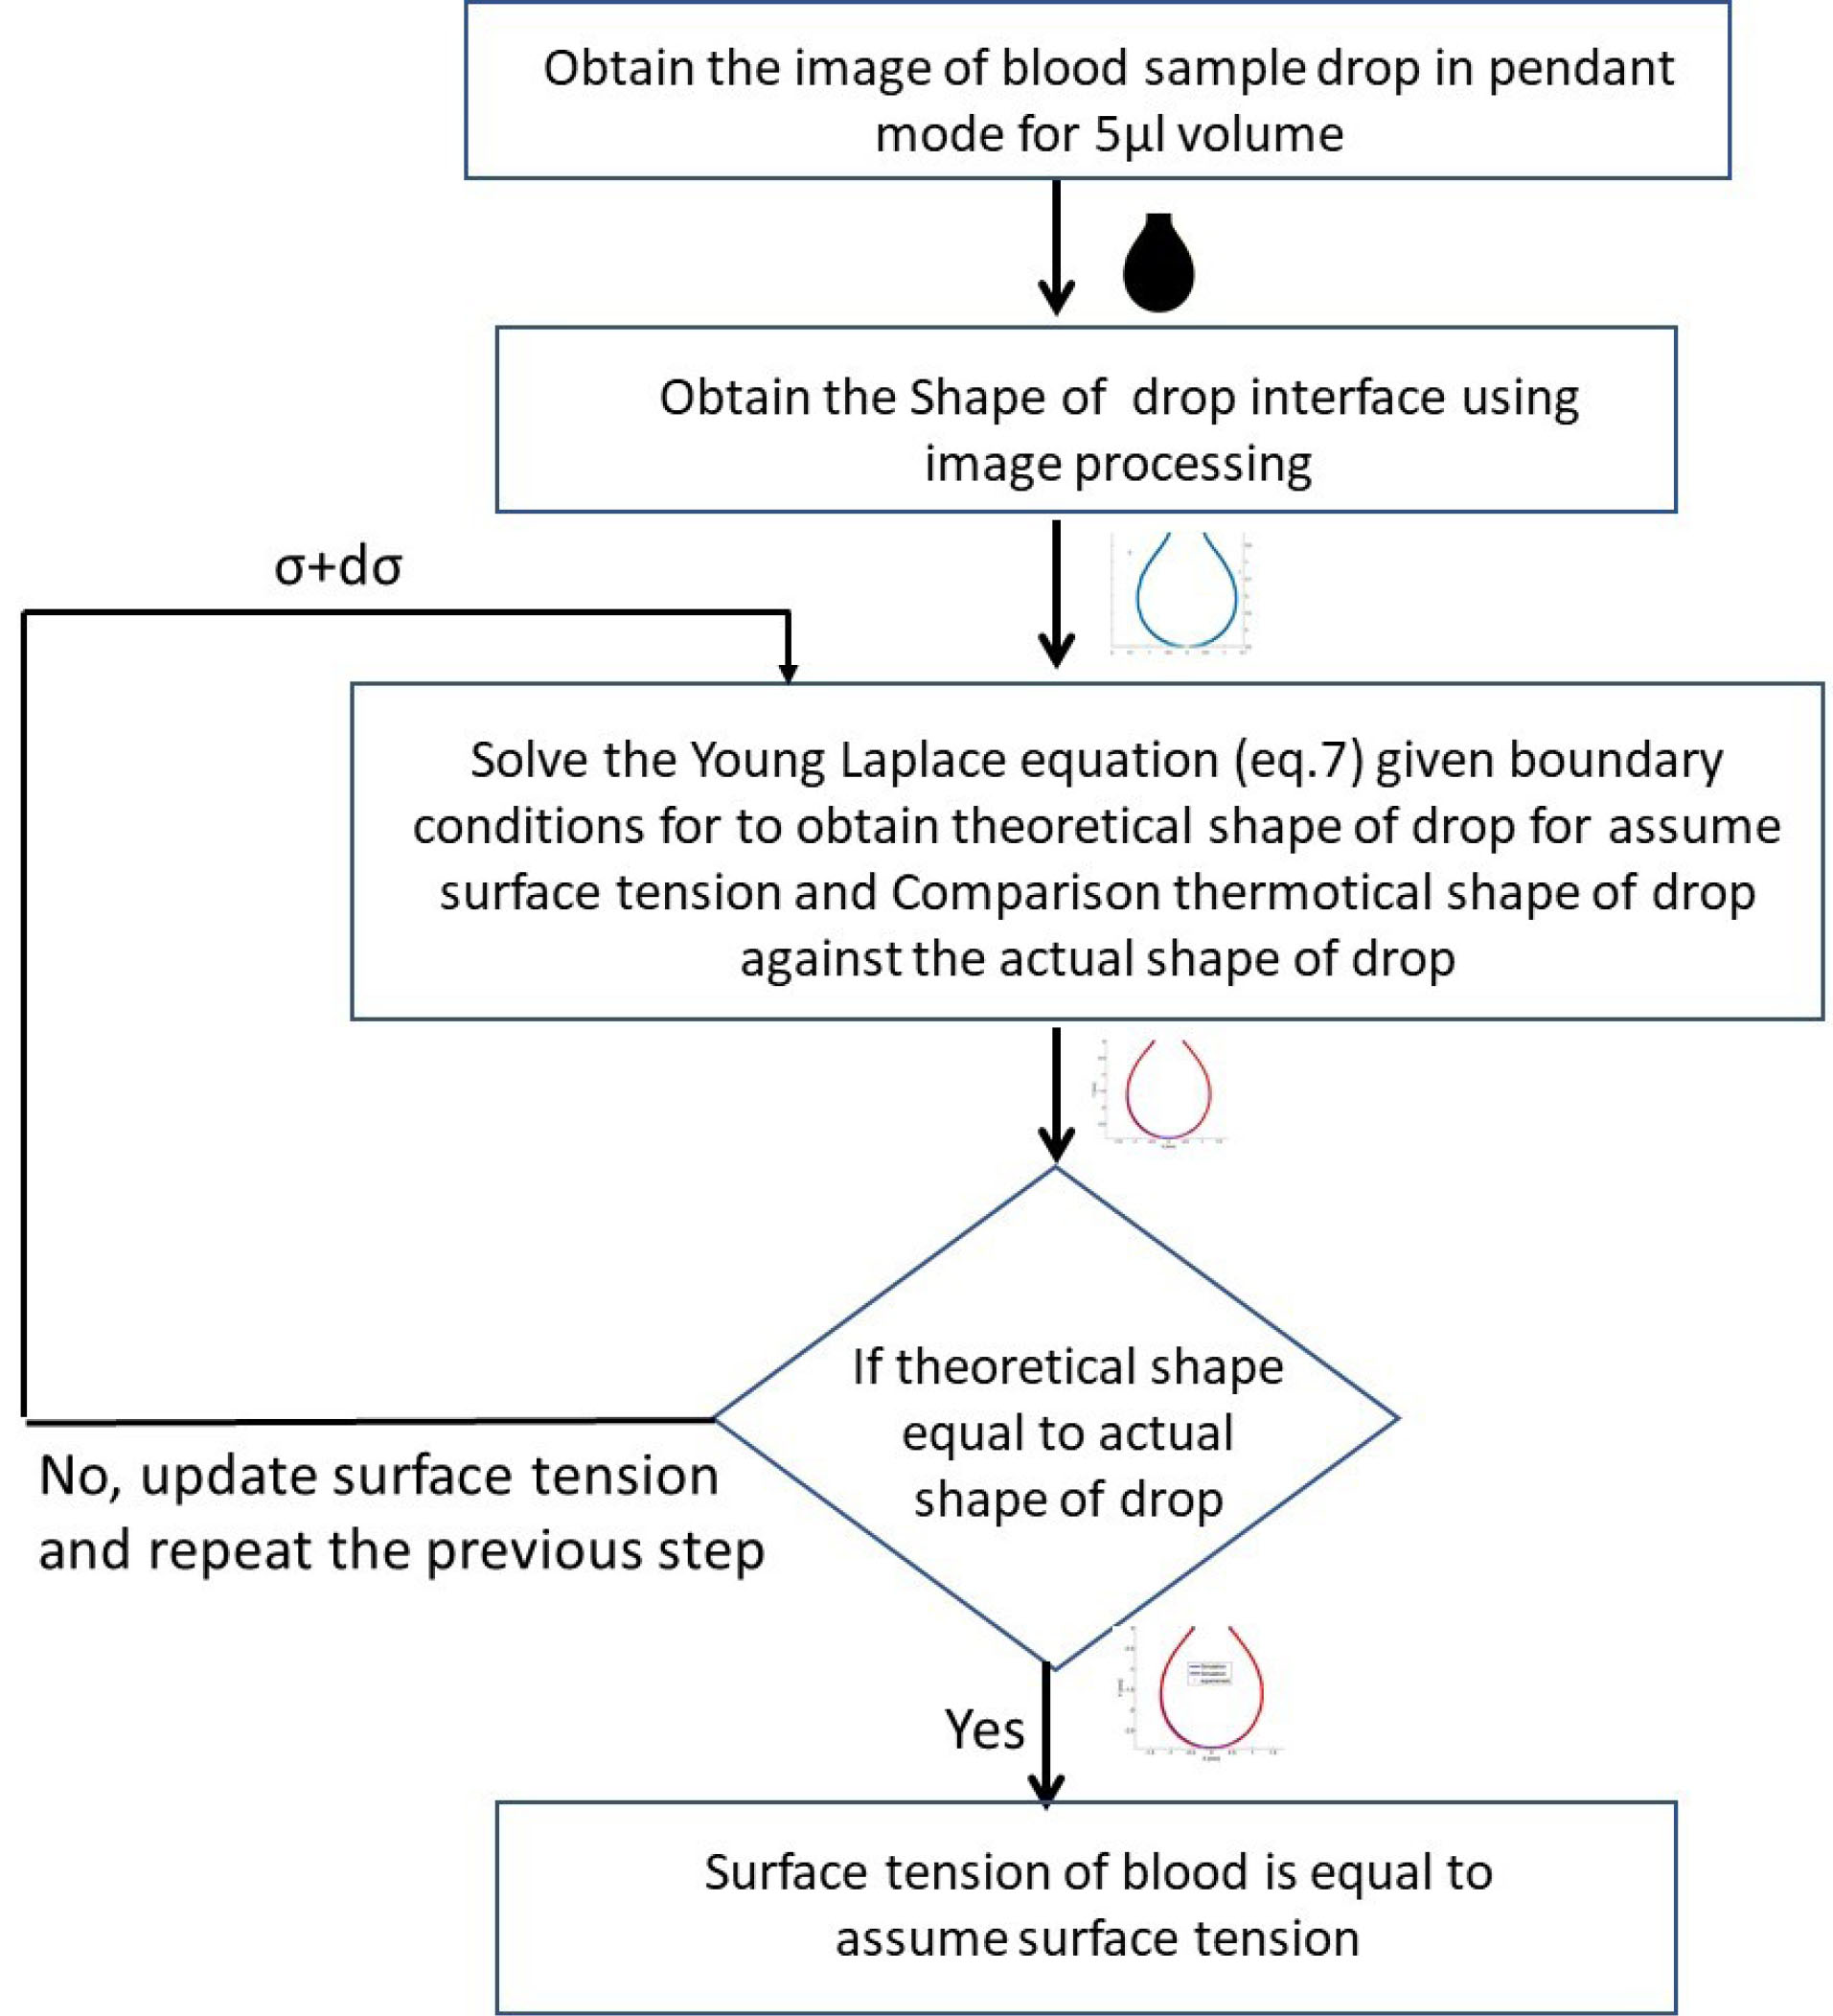
Fig. 4.
Schematic diagram depicting measurement of surface tension of blood samples.
.
Schematic diagram depicting measurement of surface tension of blood samples.
Fig. 5 shows the image of the blood drop captured by the camera. Fig. 5B-C shows the experimentally measured drop interface in circular symbols versus numerical prediction (line). As per the algorithm of surface tension measurement (Fig. 4), the surface tension value is iterated untill the numerical prediction interface fits best with the experimentally measured interface.
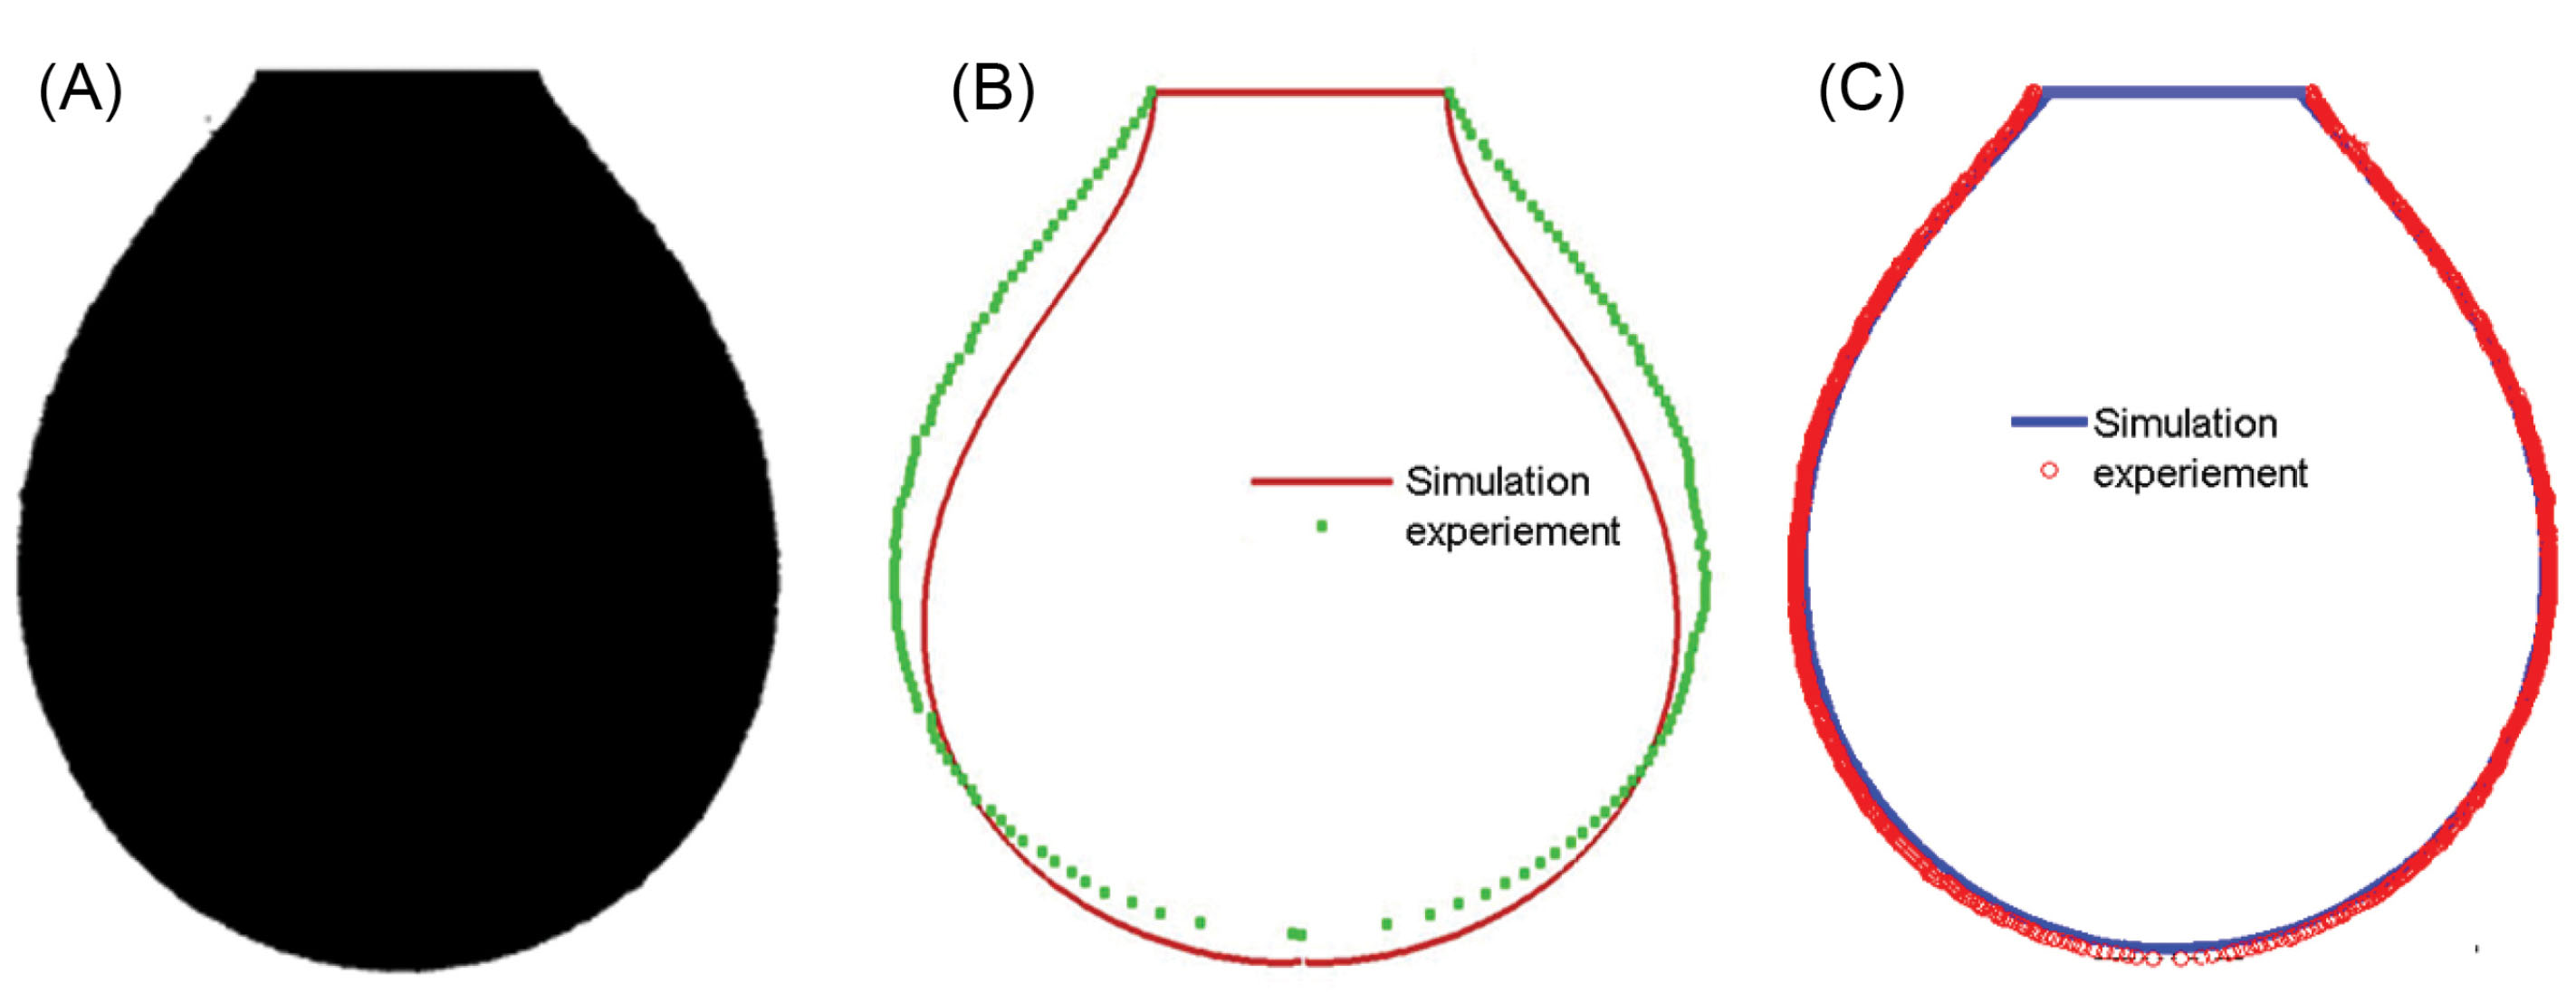
Fig. 5.
(A) Image of blood drop captured by camera, (B-C) Pendant drop: experimentally measured drop contour is shown by symbols versus the best fit of the numerical prediction (line).
.
(A) Image of blood drop captured by camera, (B-C) Pendant drop: experimentally measured drop contour is shown by symbols versus the best fit of the numerical prediction (line).
Once the data obtained from rheological attributes of blood are generated using the microfluidic system-based system, our observations would be automated using non-linear algorithms to develop a predictive analytics based risk score for disease onset in a user-friendly fashion. This is accomplished based on the table-lookup kind of wedge base where different values of blood rheological properties are mapped with the values representing different diseases such as anemia or anomalous conditions like dehydration. This lookup table has been built after extensive experimentation and can be thought of as a brain of the proposed machine as shown in Tables 1 and 2. The system architecture for disease mapping is shown in Fig. 2C. The input of this system is age, gender, and physical properties of blood and the output of the system is an artificial intelligence risk prediction score to a host of communicable and non-communicable diseases. The functionalization of disease mapping has been shown in Fig. 6.
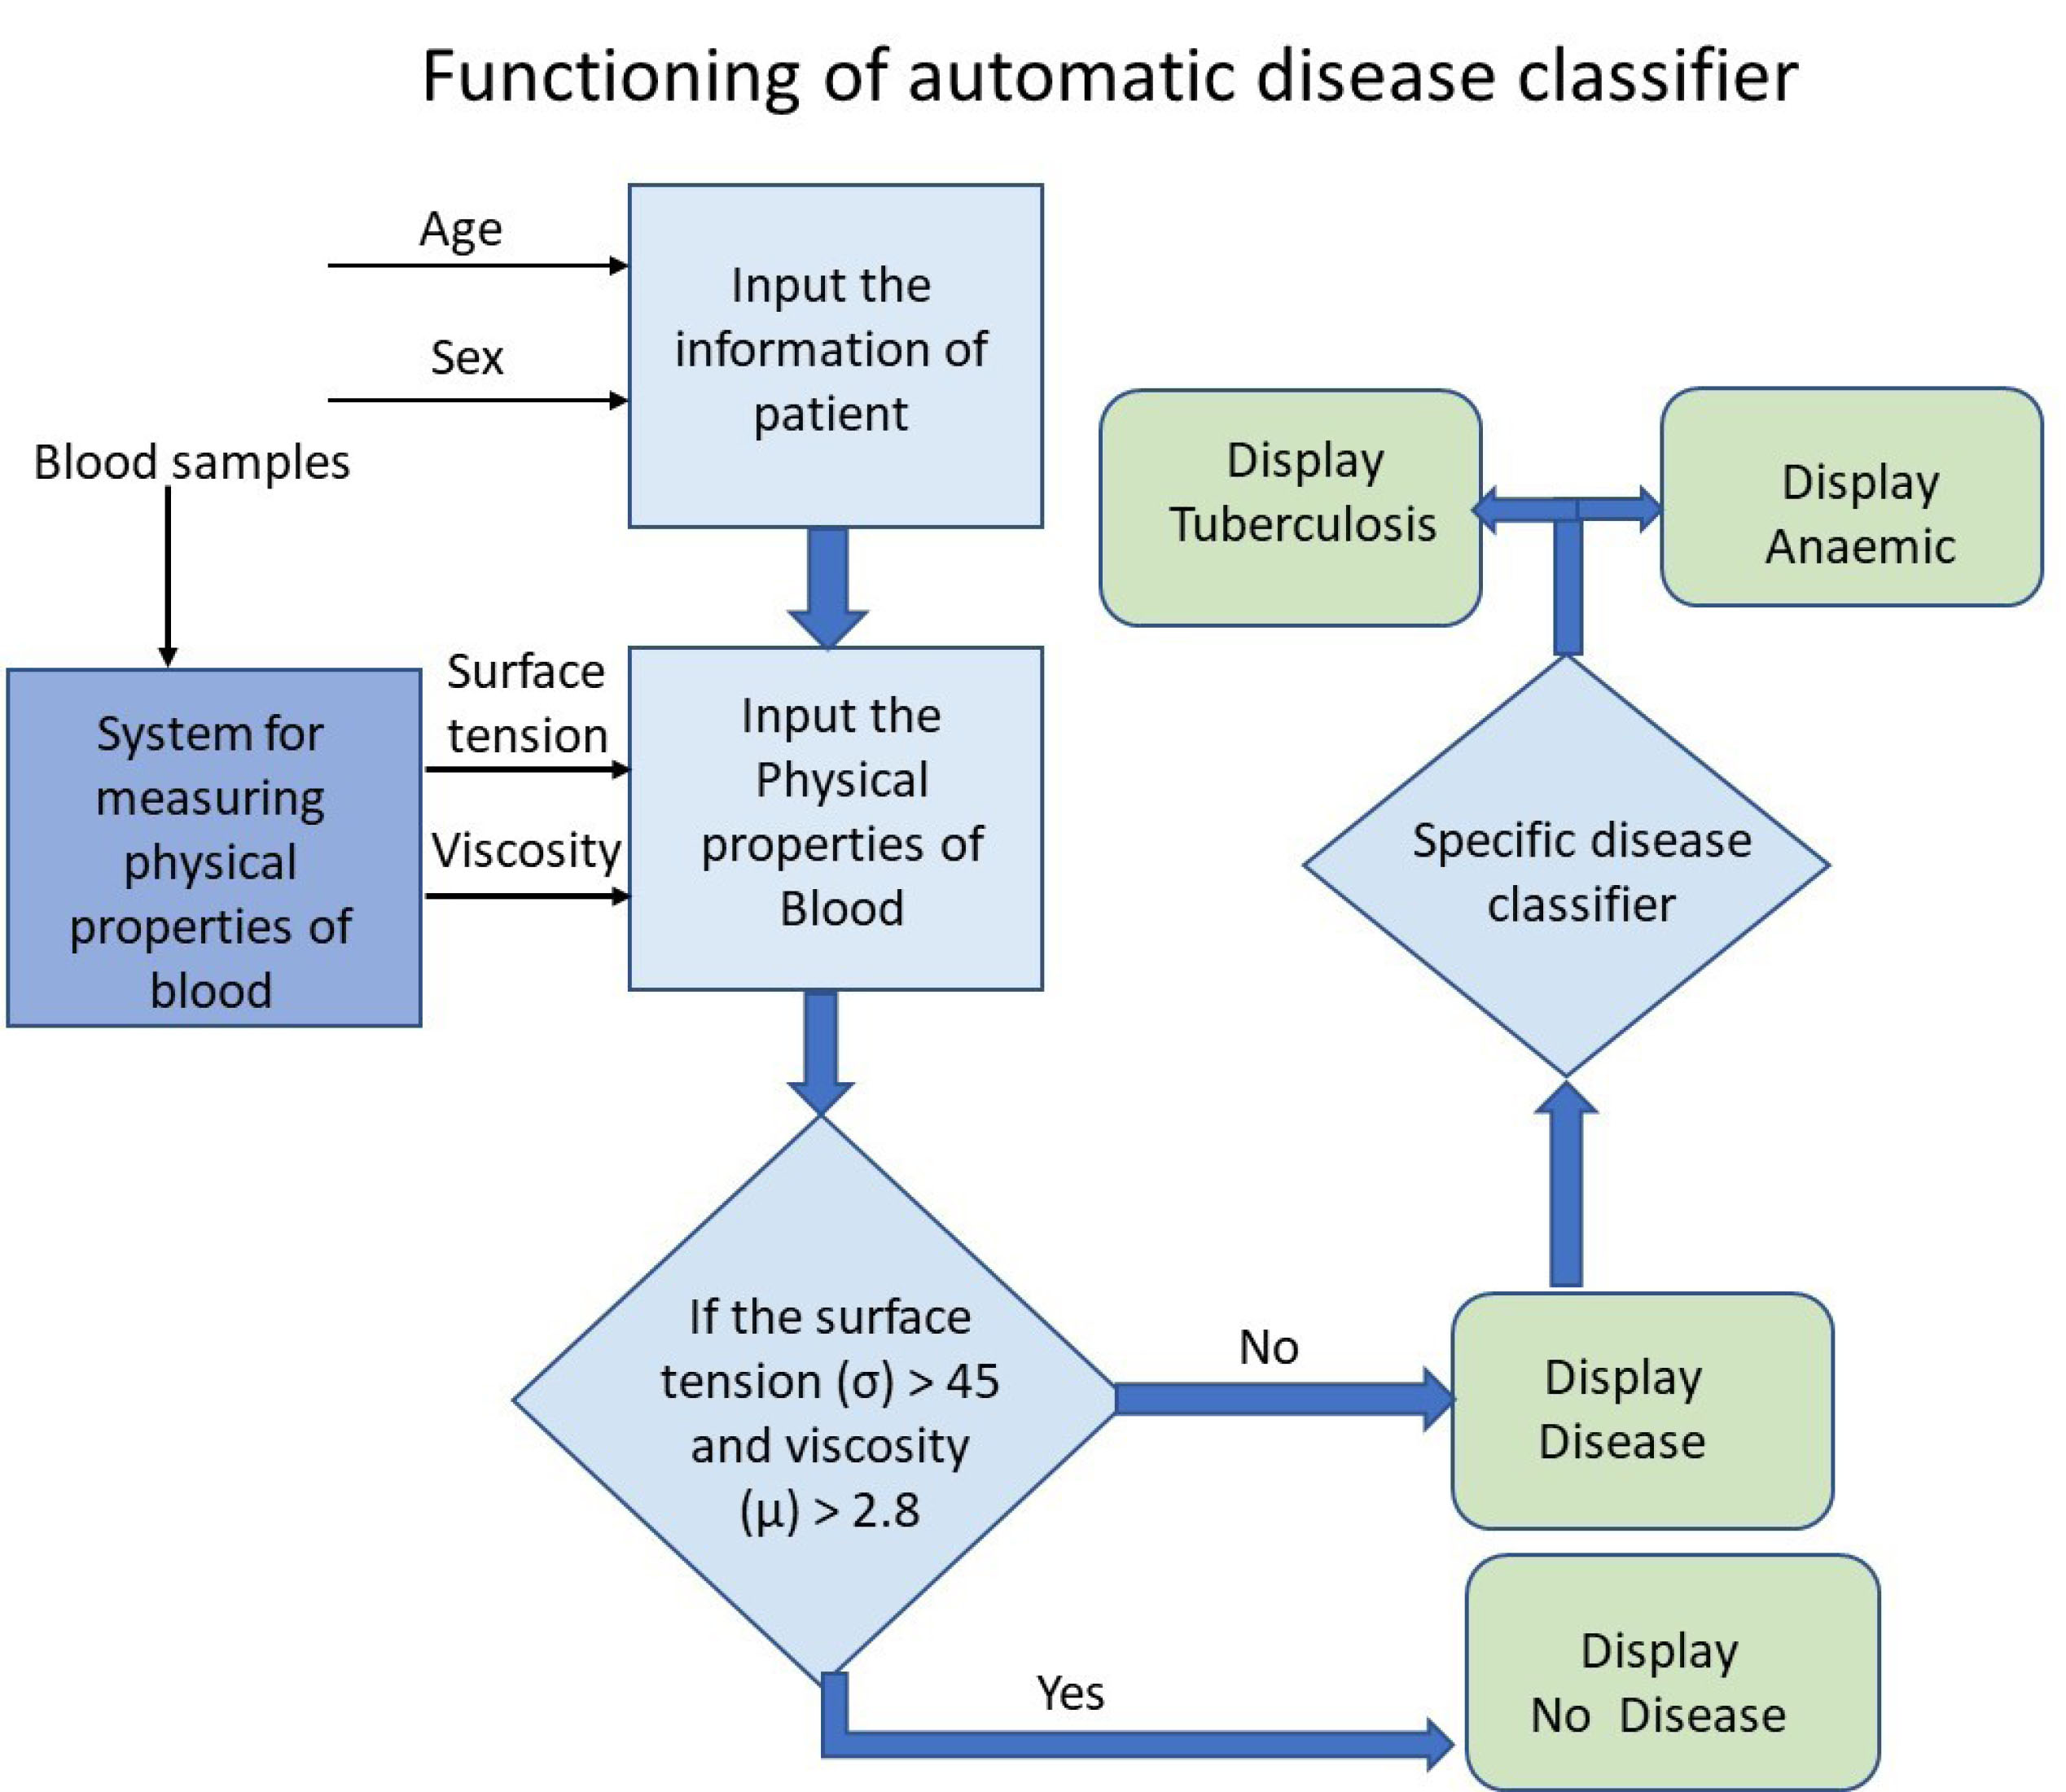
Fig. 6.
Schematic diagram of functioning of rheological attributes of blood as a function of risk scale for determining disease susceptibility patterns using an automated classifier.
.
Schematic diagram of functioning of rheological attributes of blood as a function of risk scale for determining disease susceptibility patterns using an automated classifier.
Table 2.
Matrix of blood sample collection from various pathologies
|
Type of samples
|
Age range (y)
|
No. of samples
|
Remarks (aging of blood)
|
| Normal |
Female |
5-10 |
30 |
Free from all diseases and range of hematocrit of blood is 40 to 46% |
| 11-20 |
30 |
| 21-30 |
30 |
| 31-60 |
30 |
| Male |
5-10 |
30 |
| 11-20 |
30 |
| 21-30 |
30 |
| 31-60 |
30 |
| Anemic blood sample |
Female |
5-10 |
30 |
Iron deficiency and free from other diseases |
| 11-20 |
30 |
| 21-30 |
30 |
| 31-60 |
30 |
| Male |
5-10 |
30 |
| 11-20 |
30 |
| 21-30 |
30 |
| 30-60 |
30 |
| Tuberculosis blood samples |
Female |
5-10 |
30 |
Blood sample of a patient that has only TB |
| 11-20 |
30 |
| 21-30 |
30 |
| 31-60 |
30 |
| Male |
5-10 |
30 |
| 11-20 |
30 |
| 21-30 |
30 |
| 31-60 |
30 |
Table 3.
Physical properties of human blood during healthy and anemic condition
|
Type of samples
|
|
Age range (y)
|
Number of samples
|
Viscosity ( mPa.s ) at shear rate 100 s
-1
|
Surface tension ( mN /m)
|
| Normal |
Female |
5-10 |
30 |
3.6 ± 0.07 |
52± 2.5 |
| 11-20 |
30 |
3.6 ± 0.22 |
52± 3.6 |
| 21-30 |
30 |
4.3 ± 0.05 |
53± 3.8 |
| 31-60 |
30 |
4.4 ± 0.09 |
60± 3.9 |
| Male |
5-10 |
30 |
3.6 ± 0.10 |
55± 2.6 |
| 11-20 |
30 |
3.8 ± 0.12 |
60 ± 3.0 |
| 21-30 |
30 |
5.1 ± 0.09 |
62 ± 3.7 |
| 31-60 |
30 |
4.7 ± 0.13 |
60 ± 3.9 |
| Anemic blood sample |
Female |
5-10 |
30 |
2.16± 0.07 |
38 ± 2.40 |
| 11-20 |
30 |
2.18± 0.22 |
36 ± 2.45 |
| 21-30 |
30 |
2.58± 0.05 |
38 ± 2.50 |
| 31-60 |
30 |
2.64± 0.09 |
36 ± 2.56 |
| Male |
5-10 |
30 |
2.16± 0.10 |
40 ± 2.5 |
| 11-20 |
30 |
2.20± 0.12 |
42 ± 2.54 |
| 21-30 |
30 |
2.90± 0.09 |
43 ± 2.58 |
| 30-60 |
30 |
2.78± 0.13 |
40 ± 2.60 |
| Tuberculosis blood sample |
Female |
5-10 |
30 |
1.08 ± 0.07 |
30 ± 2.40 |
| 11-20 |
30 |
1.08 ± 0.22 |
30 ± 2.45 |
| 21-30 |
30 |
1.29 ± 0.05 |
25 ± 2.50 |
| 31-60 |
30 |
1.32 ± 0.09 |
25 ± 2.56 |
| Male |
5-10 |
30 |
1.08 ± 0.07 |
27 ± 2.5 |
| 11-20 |
30 |
1.14 ± 0.07 |
32 ± 2.54 |
| 21-30 |
30 |
1.53 ± 0.06 |
33 ± 2.58 |
| 31-60 |
30 |
1.41 ± 0.13 |
36 ± 2.60 |
Procedure of lookup table building from experimental data
The blood samples were collected from normal and disease samples (anemic blood sample and TB blood samples) from JAYPEE Hospital Noida.
The system was set up at a pathology laboratory in JAYPEE Hospital Noida. Experiments were conducted with normal blood samples, anemic blood samples, and tuberculosis blood samples. Blood samples for this study were taken according to the specified protocol (as shown in Table 2). Using statistical techniques, we took thirty samples for each case study. Experiments were performed throughout the year to obtain the blood from a donor at a particular age as per protocol. The system was connected to a computer and software of measuring viscosity and surface tension from the clinical samples after properly calibrating the system. Backlight and charge-coupled system (CCD) were switched on for capturing the images and the height of blood samples was ( h1 and h2) computed at various time steps (1.5 seconds). The test was initiated with a venipuncture on the patient using a 22-gauge stainless steel needle. Fresh blood was first directly taken from veins from the first to the second stopcock to collect blood into the syringe. Two milliliters blood was collected in the syringe for validation of system with a commercial viscometer, tensiometer, and hematocrit measurement.
The viscosity was measured by scanning capillary viscometer following the method as reported in the literature.
31
In this method, the second stopcock was tuned to a position to allow blood flow to both the capillary tube and the riser tube 2. When the blood reached a predetermined height of 250 pixels in riser tube 2, the second stopcock was shut to stop further blood flow into riser tube 2, and the first stopcock was then turned to direct blood flow into riser tube 1 up to a height of 1200 pixels. At t=0, the data acquisition system was enabled, and both stopcocks were adjusted to allow blood to flow from riser tube 1 to tube 2 as driven by gravity. Of note is that the initial pixel difference of 950 was chosen to produce the maximum shear rate of approximately 540 per second. The capillary tube was placed at a constant temperature bath to maintain blood temperature at 37oC. In this way, all data ( h1 and h2) were acquired at various time steps. Experimental data are shown in Table 3.
Simultaneously, some amount of blood flowed from 500 µm diameter capillary tube to tensiometer syringe tip to form pendant mode of the droplet. This drop is further captured by a 1-megapixel camera and saved in the computer for measuring the surface tension of blood. All the measurements were completed within 1 minute from the time the blood samples were collected from the patients.
Validation and data analysis
Data were analyzed after the microfluidics-based measurements were validated against data available on the physical properties of blood and other fluids. Fig. 7 shows the variation of blood viscosity with respect to the shear rate. The blood sample was collected from the donor in such a way that its hematocrit (HT) value was the same as reported in the literature.
32
The present system results are quite satisfactory and in accord with the published literature. Similarly, the data obtained from surface tensiometer were validated against the data available in the literature.
25
Fig. 8 shows the measured data in agreement with the published literature.
32
In addition, the error analysis of both microfluidic systems was carried out. The confidence level of these systems is 98%.
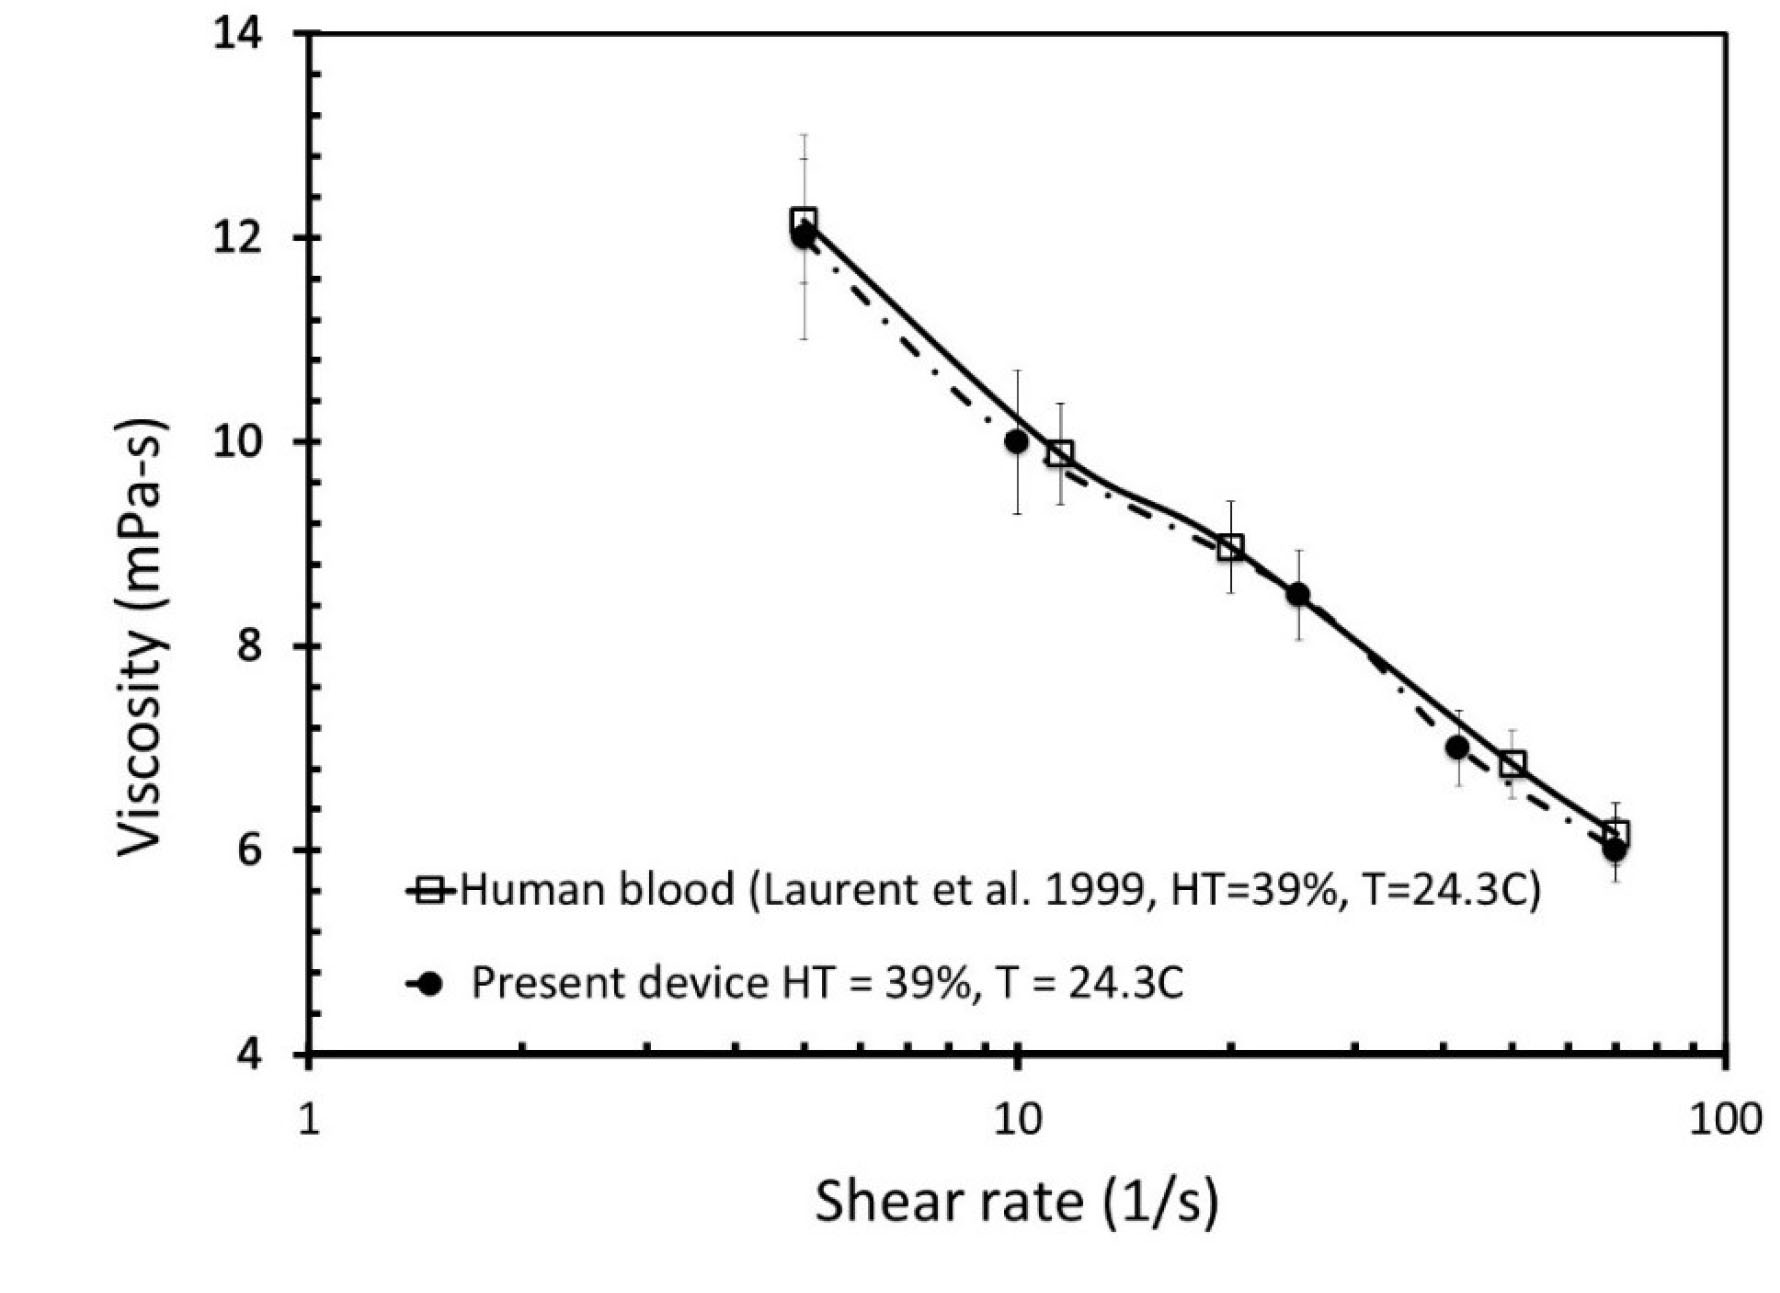
Fig. 7.
The comparative analysis of the viscosity values of blood samples with respect to the shear rate published in literature
32
and donor blood samples measured by our system.
.
The comparative analysis of the viscosity values of blood samples with respect to the shear rate published in literature
32
and donor blood samples measured by our system.
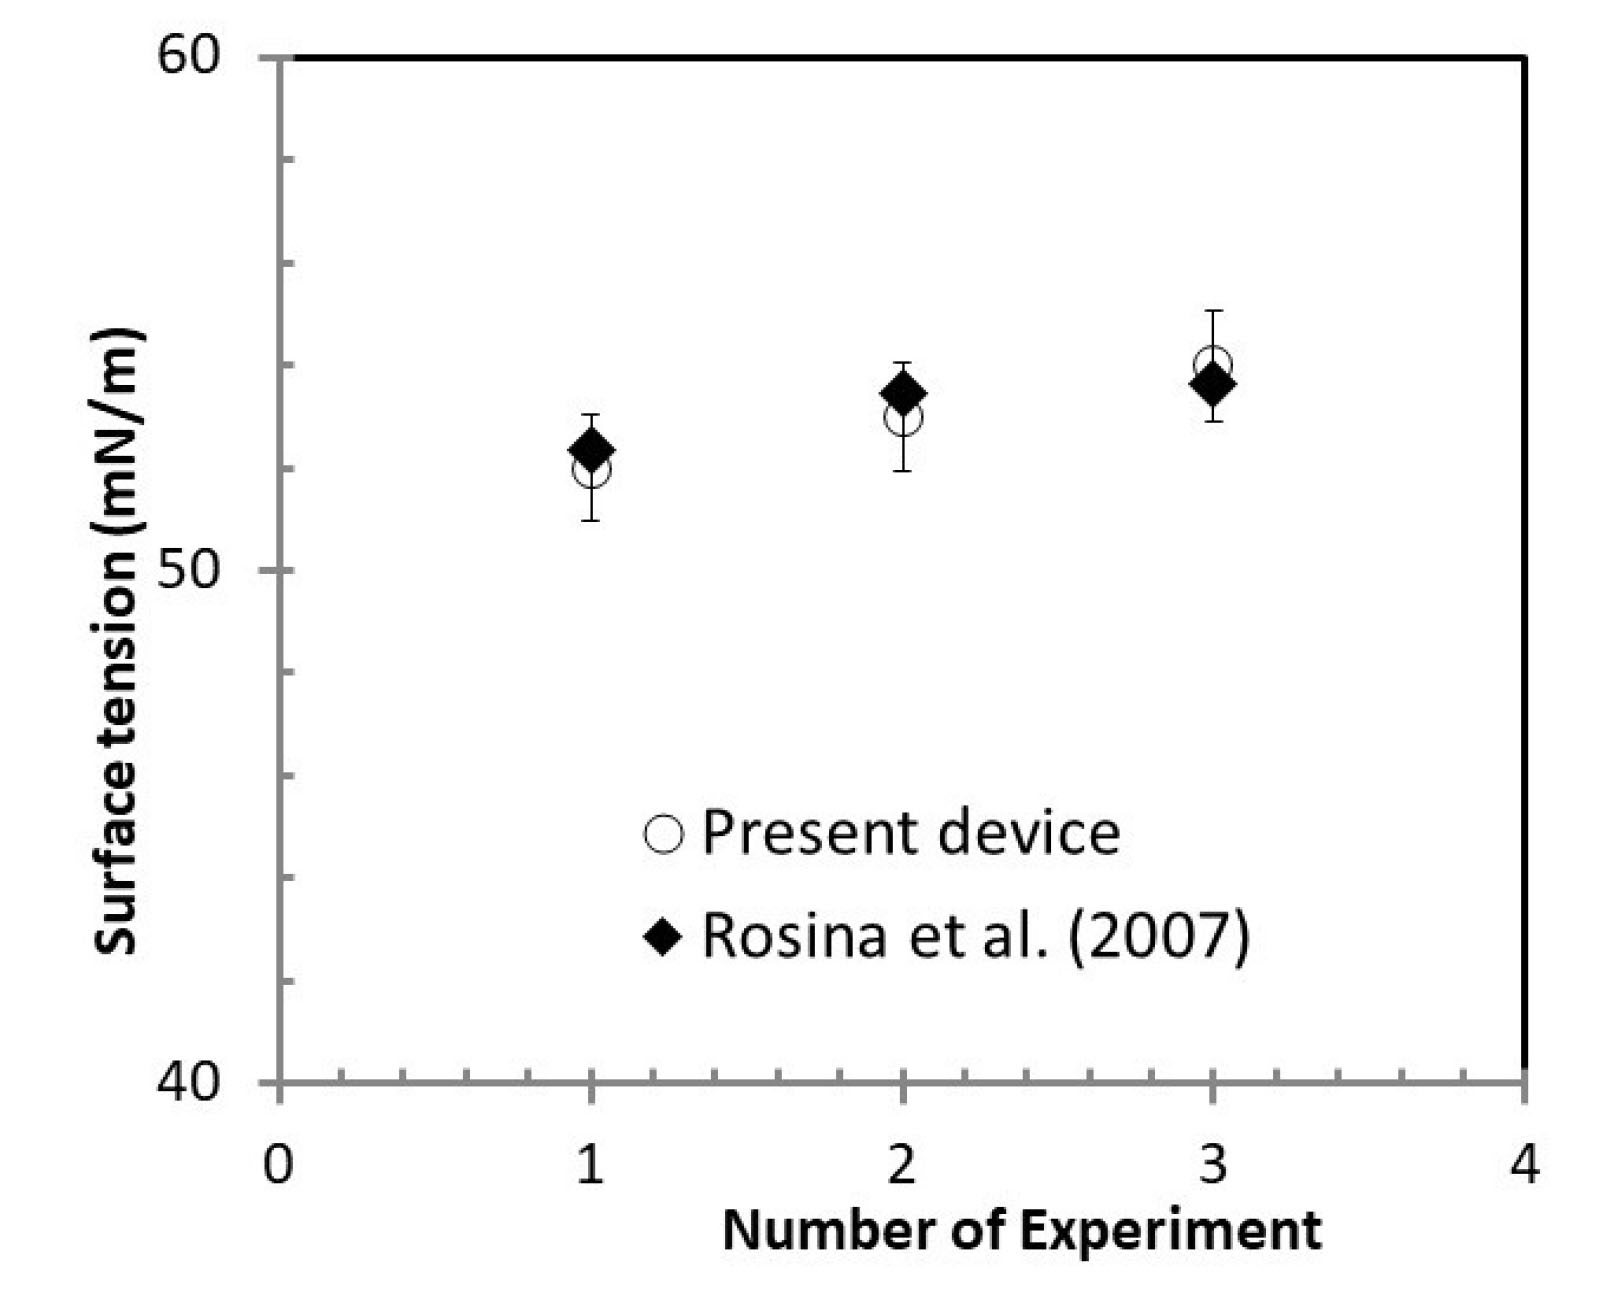
Fig. 8.
The comparative surface tension values obtained from our instrument with respect to data available in published literature.
25
.
The comparative surface tension values obtained from our instrument with respect to data available in published literature.
25
Results and Discussion
The data generated from the proposed system have been used to screen two diseases namely anemia and tuberculosis. The samples were collected as per protocol reported in the previous section. All the measured data were tabulated in Table 3. Fig. 9 shows the variation of viscosity with respect to the ages of male and female patients and it was calculated for shear rate 100 s-1 of blood flow. Fig. 9A shows the variation of viscosity with respect to age for normal blood samples. However, Fig. 9B and Fig. 9C show the viscosity for anemic and tuberculosis-related (TB) blood samples. This plot shows that the viscosity of blood samples is drastically different for various diseases as compared to normal blood samples for the same age and gender. It also shows that the viscosity of all blood samples (normal, anemic, and tuberculosis) at a given shear rate increases with increasing the age of blood samples. In addition, the viscosity of normal blood samples have very small difference with respect to gender as shown in Fig. 9A. However, Fig. 9B and Fig. 9C show drastic differences for two genders like female and male blood samples which may belong to anemic or tuberculosis patients. Blood viscosity depends on the content of the blood, or the concentration of each of many components in the plasma fluid. It depends on the concentration of red blood cells and multiple proteins present in the plasma. It is demonstrated that diseases like anemia and TB affect the red cells of blood and this particular change of blood viscosity in given samples is used in disease diagnostic tools.
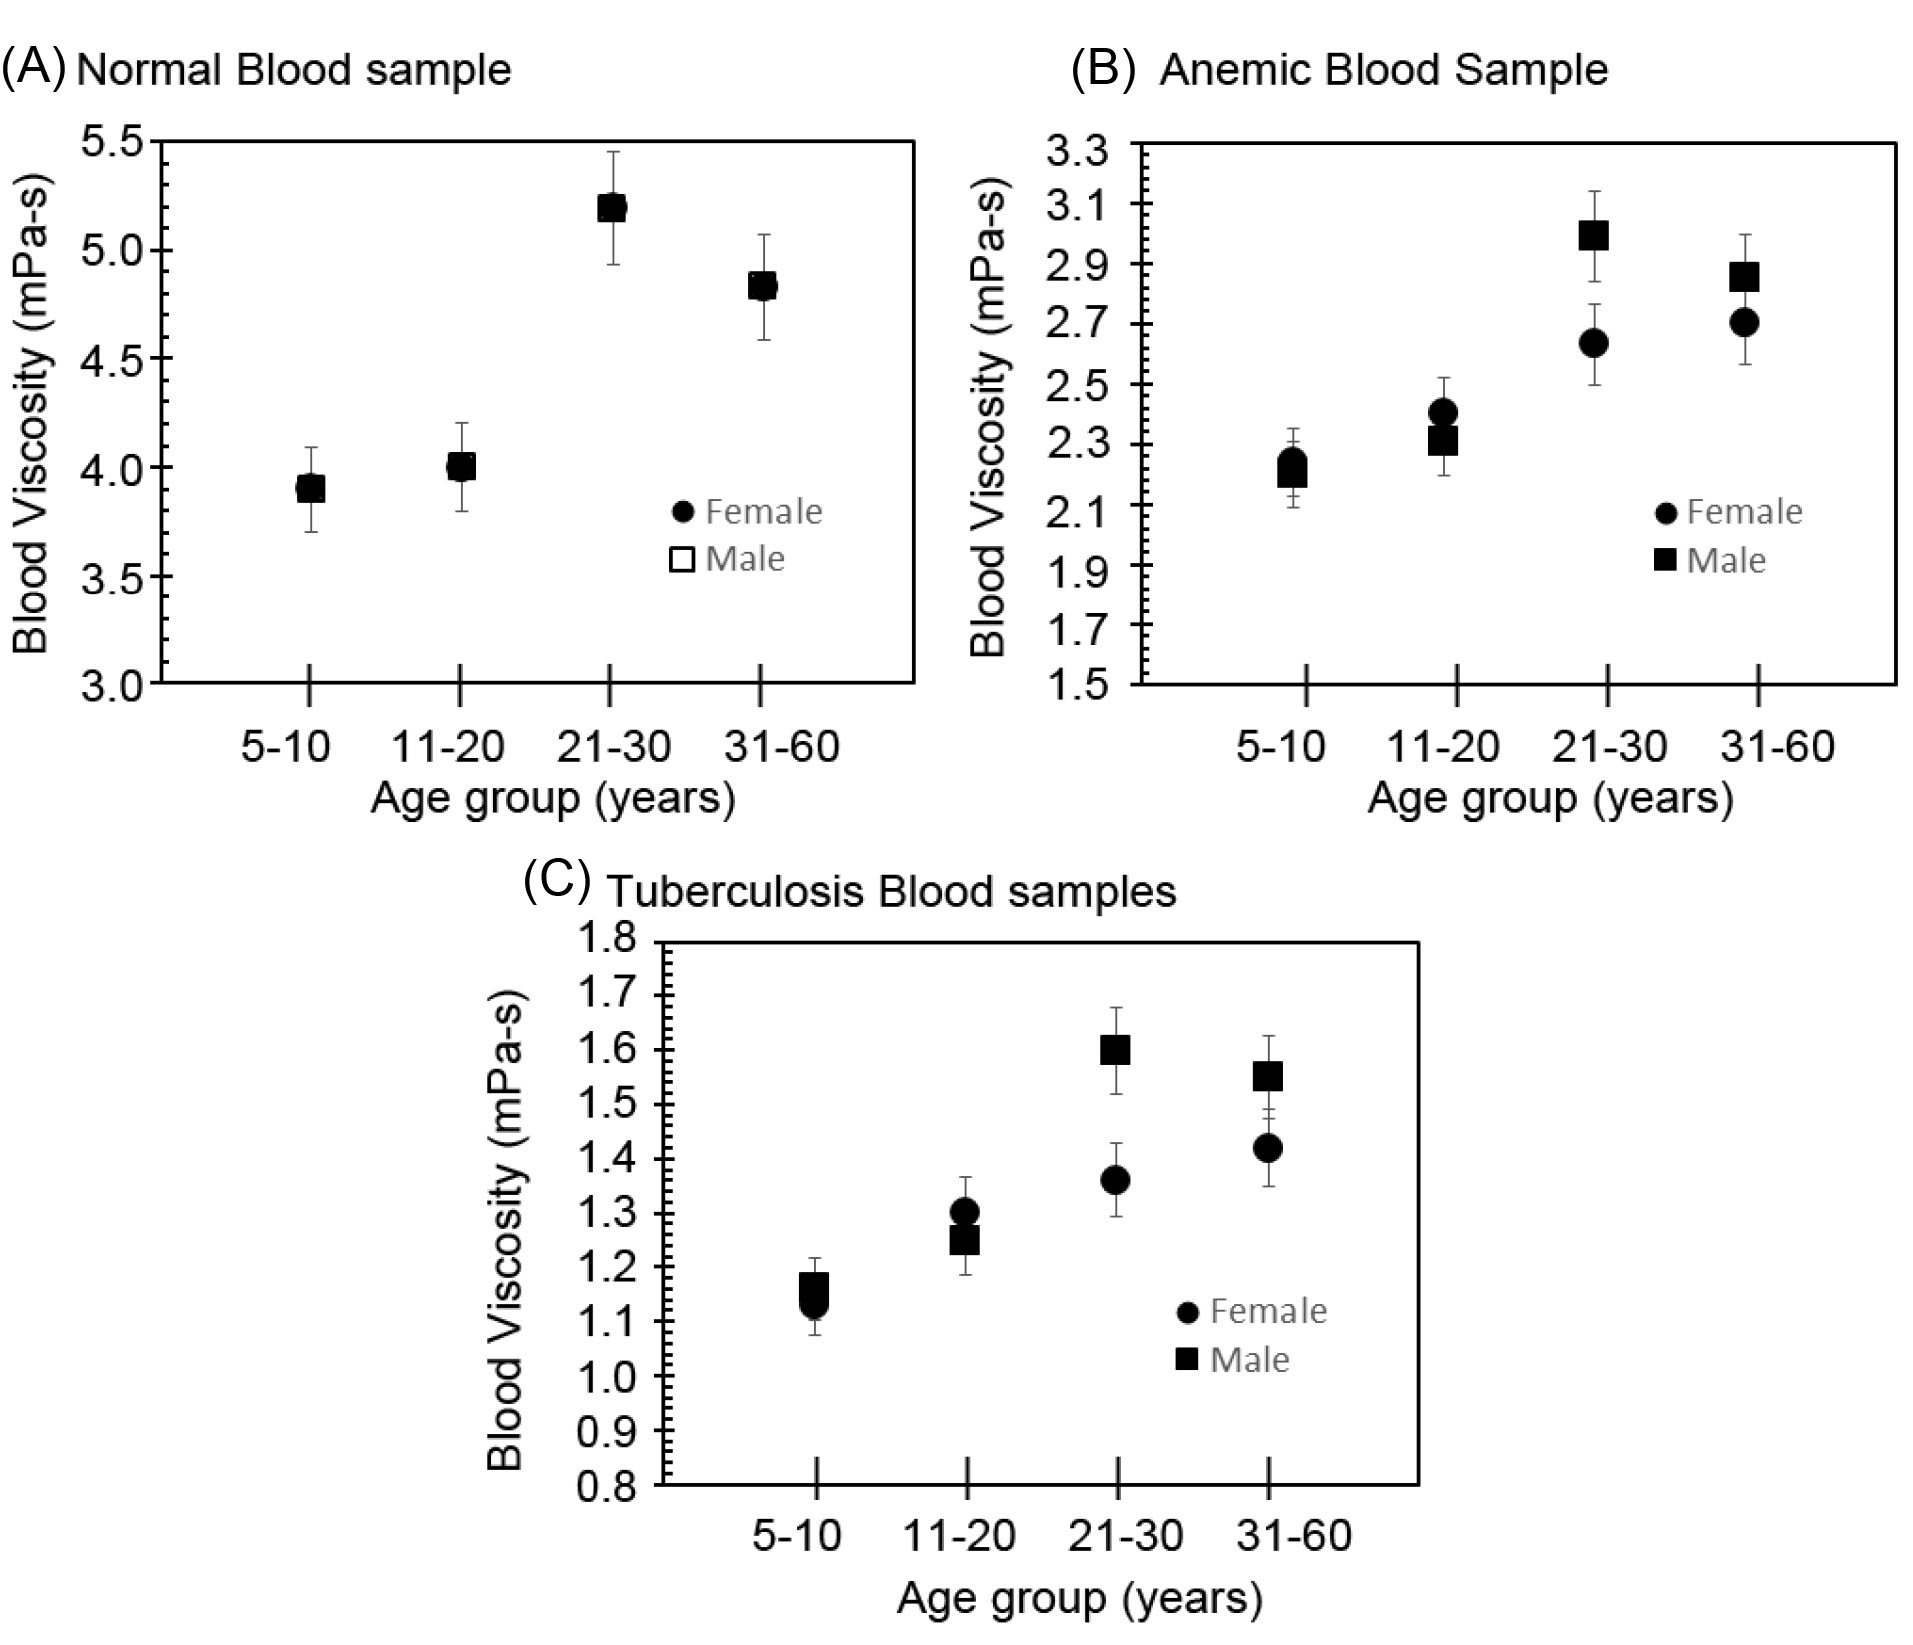
Fig. 9.
Variation of viscosity at 100 shear rate (1/s) with respect to age: (A) normal blood samples, (B) anemic blood samples, and (C) tuberculosis blood samples.
.
Variation of viscosity at 100 shear rate (1/s) with respect to age: (A) normal blood samples, (B) anemic blood samples, and (C) tuberculosis blood samples.
Fig. 10 shows the variation of surface energy with respect to age of different male and female blood samples. Fig. 10A shows the variation of surface tension with respect to age of normal blood samples for both genders. However, Fig. 10B and Fig. 10C show the variation of surface tension of abnormal (anemic and tuberculosis) blood samples again for both genders. Anemic and TB blood samples have low surface tension as compared to normal blood samples, as shown in Fig. 10. Hence, the surface tension of blood directly interlinks with the percentage of RBC. TB infection generally occurs by the entry of the mycobacterium to the respiratory system. This bacterium moderates the surface energy of blood.
26
Hence, multiple lipids form in the body during the TB to destroy the surfactant property of blood samples. Therefore, Fig. 10 shows that the surface energy of normal blood samples is larger than that of the anemic and TB samples and this nature of variation of the surface energy of blood samples is used as a disease signature in the form of diagnostic tool.
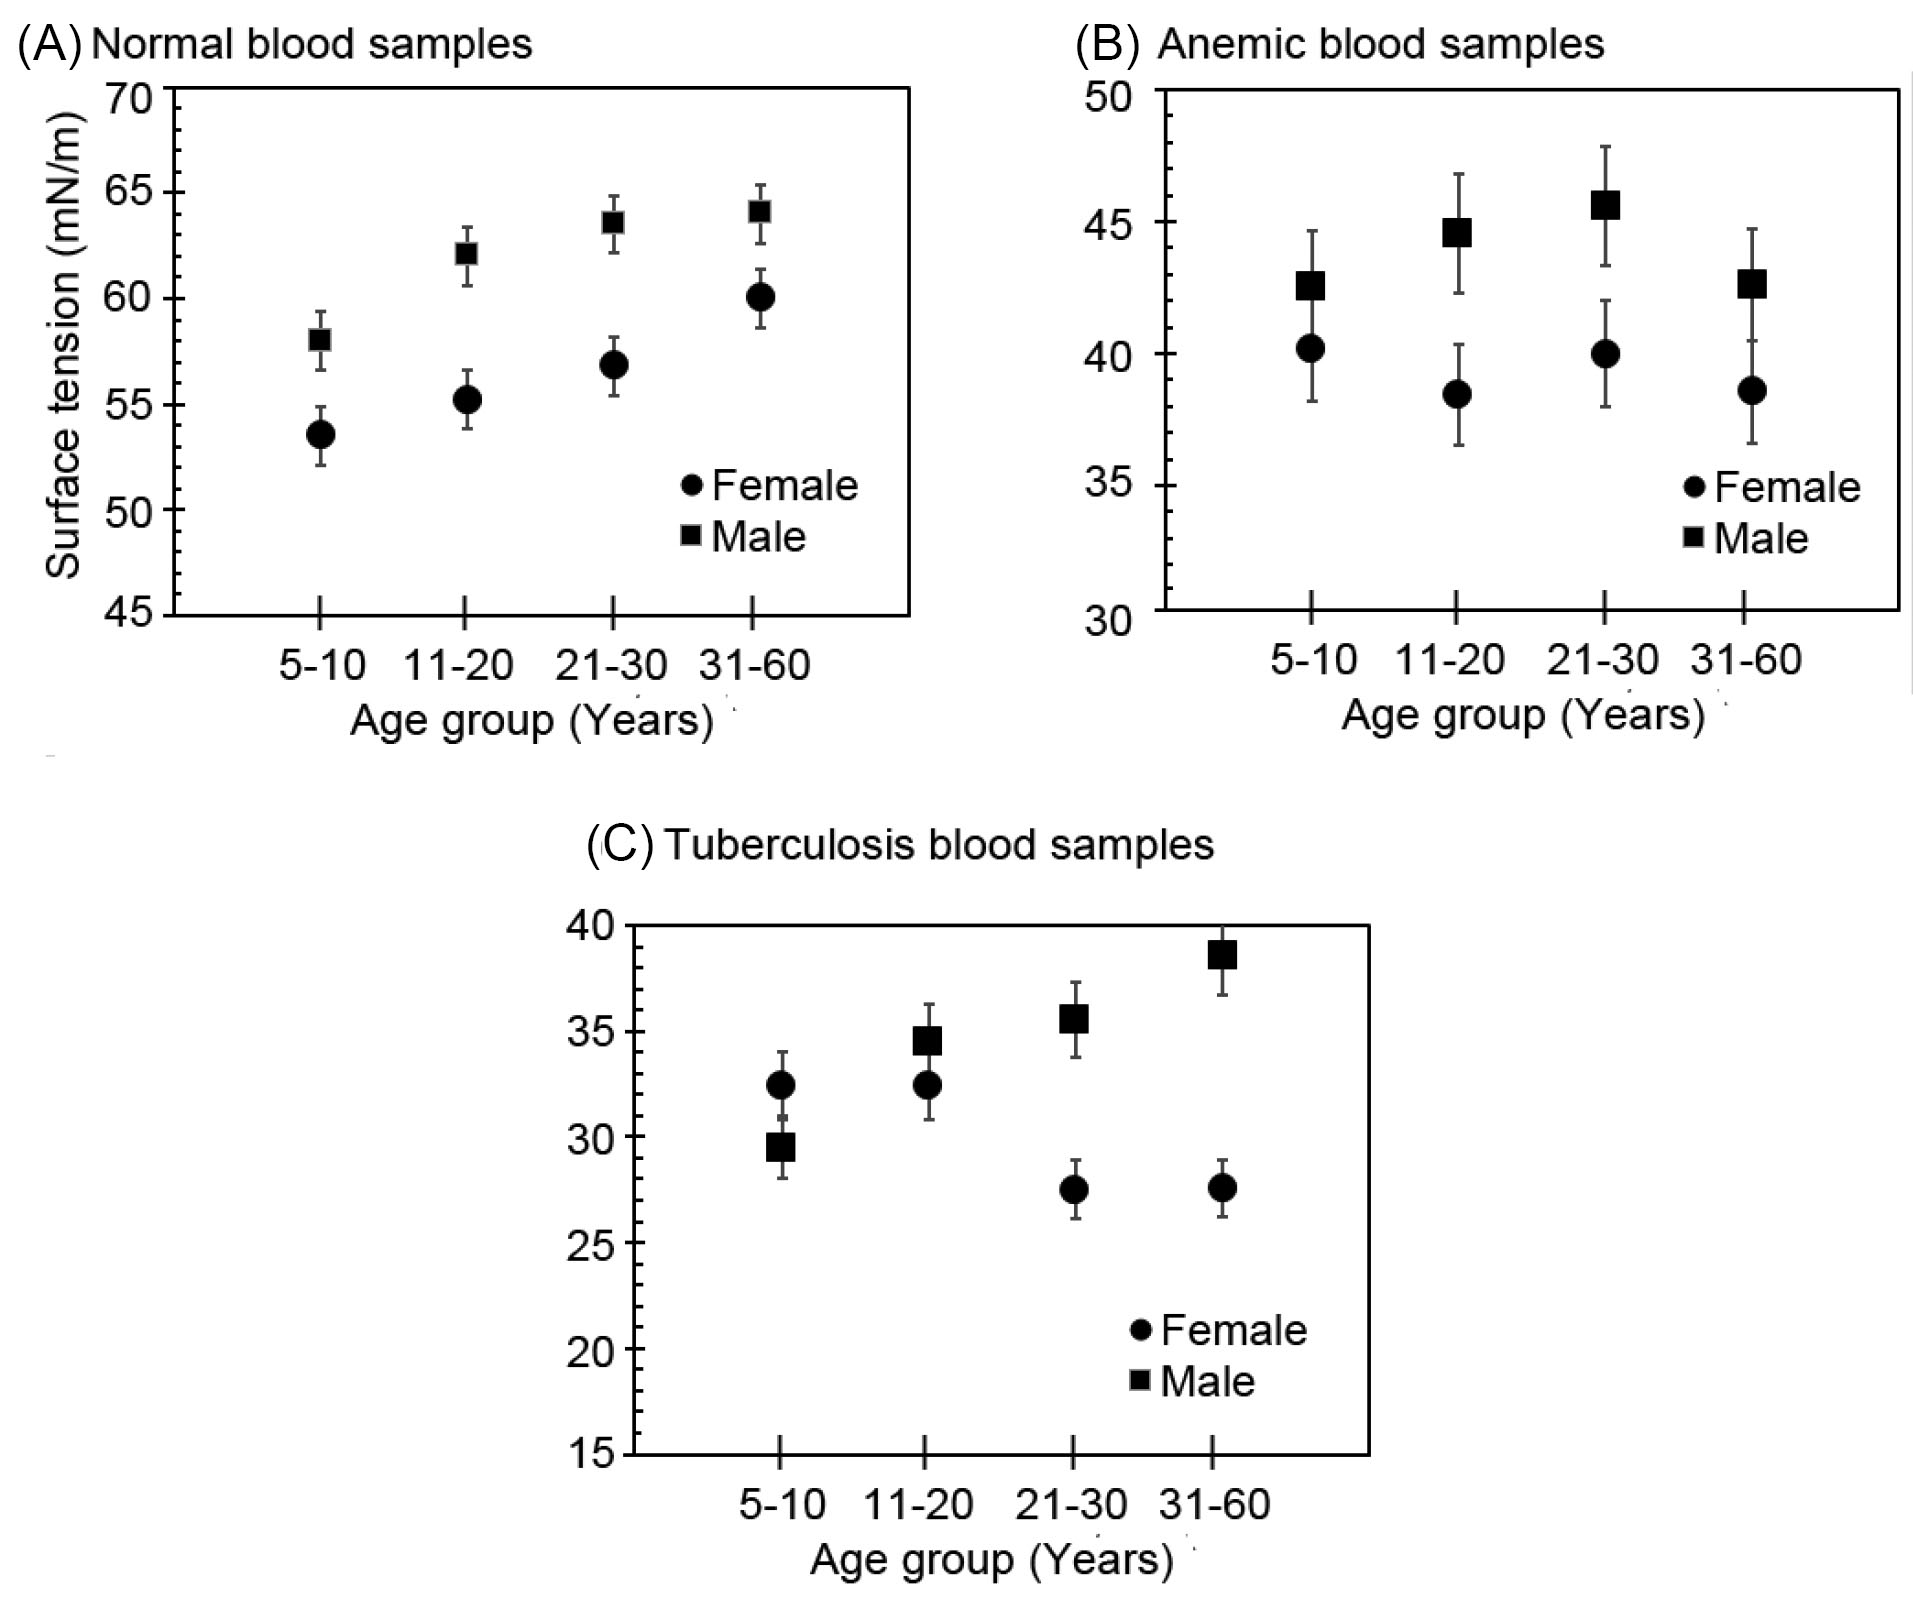
Fig. 10
.
Variation of surface tension with respect to age: (A) normal blood samples, (B) anemic blood samples, and (C) tuberculosis blood samples.
.
Variation of surface tension with respect to age: (A) normal blood samples, (B) anemic blood samples, and (C) tuberculosis blood samples.
Fig. 11 plots the range of viscosity and surface tension of all blood samples across different age groups. Surface tension and viscosity of normal blood samples are higher than the same of abnormal or diseased blood sample across genders. For a normal blood sample, the viscosity of blood samples must be greater than 2.6 at shear rate 100/s. However, the surface tension of normal blood samples must be higher than 45 mN/m. This information has been used in this manuscript for designing screening system criteria.
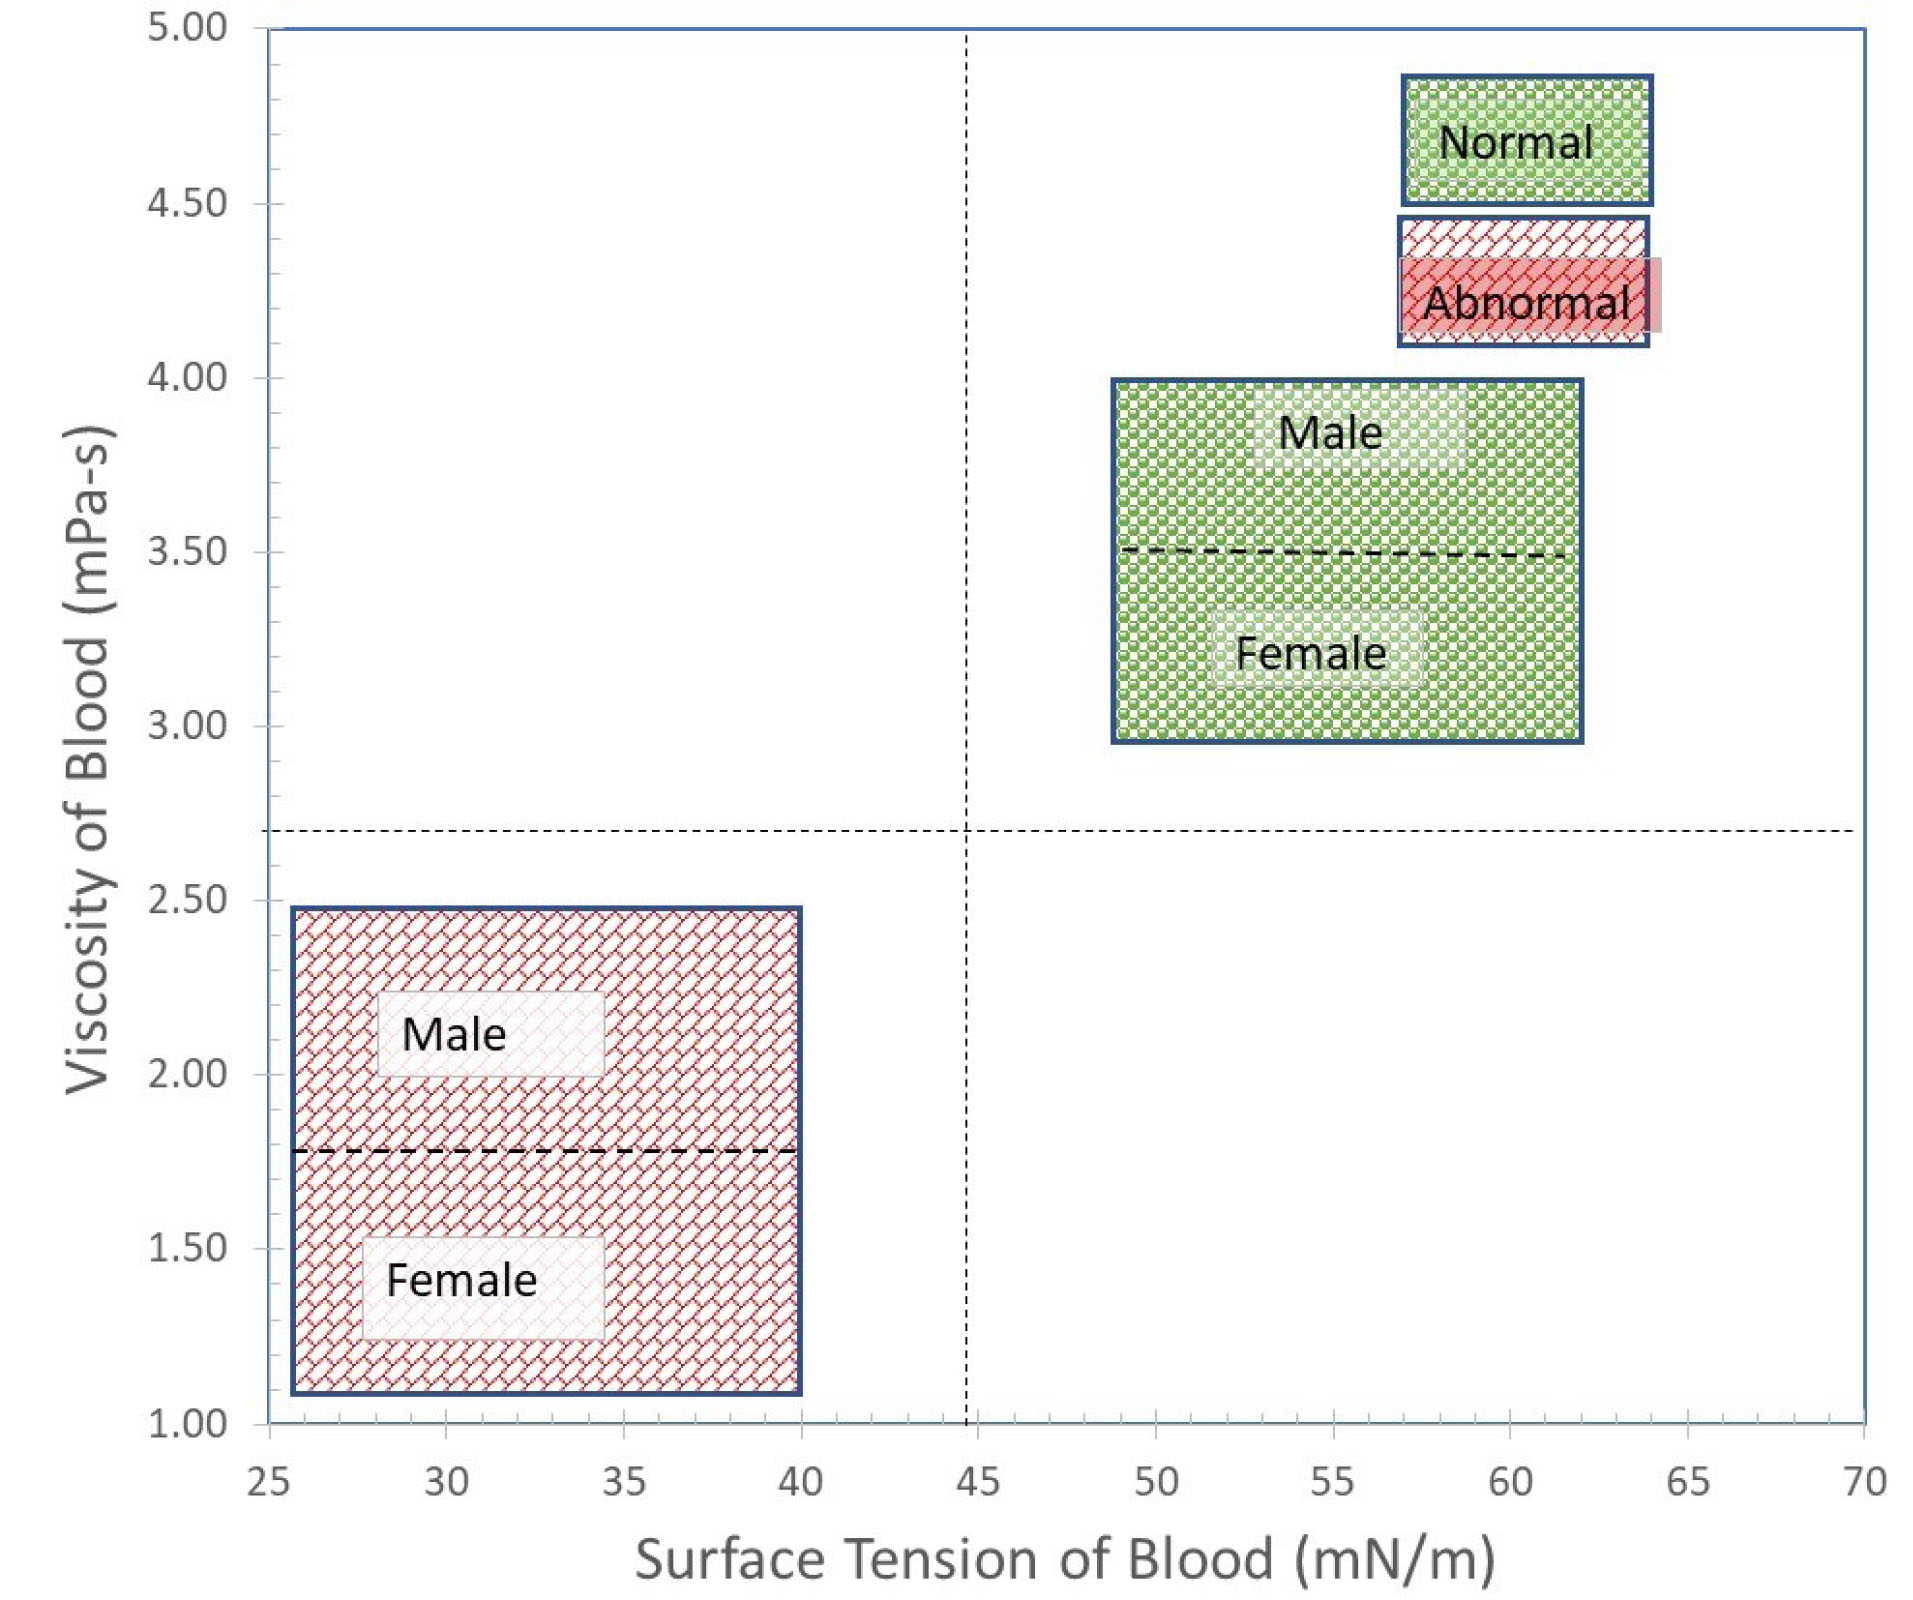
Fig. 11
.
Graphic showing the cut-off line for discrimination of normal and abnormal blood samples.
.
Graphic showing the cut-off line for discrimination of normal and abnormal blood samples.
Conclusion
In this work, we proposed to make a case for the validation of a low-cost version of a microfluidic system capable of scanning large populations for a variety of diseases as per the WHO mandate of “One Health”. We proposed the use of this system for providing an affordable and accessible diagnosis to populace living in resource-limited settings found in LMICs. It has already been validated against the data available in the literature. This system is an example of a low-cost innovation aimed at providing affordable and accessible screening of the populace for a variety of diseases. The main characteristics of this system are: (a) cheap and simple, (b) highly accurate measurement of data, (c) ease of use by lay-person, and (d) only a small volume (5 µL) of blood is required pushing it towards non-invasiveness. The Innovative system of architecture will be a diagnostic aid with data being automated using linear and nonlinear classifiers for large-scale screening of patients for a variety of diseases.
Acknowledgments
The authors would like to recognize the contribution of Jaypee Hospital and labs in NOIDA (India) for providing various blood samples as per our requirement. In addition, the authors acknowledge the Science and Engineering Research Board (SERB), Department of Science & Technology (DST), and Government of India (Project no: ECR/2016/000020) for using the equipment of this project. We are grateful to everyone with whom we had the pleasure to work.
Funding sources
None.
Ethical statement
There is none to be declared.
Competing interests
There is none to be declared.
Authors’ contribution
BSS, SSY: Draft preparation, writing and reviewing, data handling. BSS: Conceptualization, experiments design, study validation, writing and reviewing, data analysis. SSY, BSS: Data handling, data analysis, Writing. BSS, PR, RJ: Conceptualization, trials design, supervision, writing and reviewing.
Research Highlights
What is the current knowledge?
simple
-
√ Design and development of simple, robust and low-cost
disease screening devices based on physical properties of
blood in clinical environment.
-
√ The main characteristics of these devices are: (a) cheap and
simple, (b) highly accurate and measuring data within range
of ±1% uncertainty, (c) any person that has basic computer
knowledge can use them, and (d) a very few μL volume of
blood is required pushing it towards non-invasiveness.
What is new here?
simple
-
√ New system architecture based on prognosis and diagnosis
data using automated linear and nonlinear classifiers for
automated reasoning and presentation of screening results.
-
√ Finally, an impact of these devices on Indian health care
scenario will be measured.
References
- Filatova OV, Sidorenko AA, Agarkova SA. Effects of age and sex on rheological properties of blood. Hum Physiol 2015; 41:437-43. doi: 10.1134/s0362119715030044 [Crossref] [ Google Scholar]
- Kim S, Namgung B, Ong PK, Cho YI, Chun KJ, Lim D. Determination of rheological properties of whole blood with a scanning capillary-tube rheometer using constitutive models. Journal of Mechanical Science and Technology 2010; 23:1718-26. doi: 10.1007/s12206-009-0420-6 [Crossref] [ Google Scholar]
- Simmonds MJ, Meiselman HJ, Baskurt OK. Blood rheology and aging. J Geriatr Cardiol 2013; 10:291-301. doi: 10.3969/j.issn.1671-5411.2013.03.010 [Crossref] [ Google Scholar]
- Rohini K, Surekha Bhat M, Srikumar PS, Mahesh Kumar A. Assessment of Hematological Parameters in Pulmonary Tuberculosis Patients. Indian J Clin Biochem 2016; 31:332-5. doi: 10.1007/s12291-015-0535-8 [Crossref] [ Google Scholar]
- Kuhn V, Diederich L, Keller TCSt, Kramer CM, Lückstädt W, Panknin C. Red Blood Cell Function and Dysfunction: Redox Regulation, Nitric Oxide Metabolism, Anemia. Antioxid Redox Signal 2017; 26:718-42. doi: 10.1089/ars.2016.6954 [Crossref] [ Google Scholar]
- Houston J, Lawrence JS. The blood sedimentation rate and fractional plasma viscosity in pulmonary tuberculosis. BBr J Tuberc Dis Chest 1955; 49:119-28. doi: 10.1016/S0366-0869(55)80090-1 [Crossref] [ Google Scholar]
- Dmitrieff S, Alsina A, Mathur A, Nédélec FJ. Balance of microtubule stiffness and cortical tension determines the size of blood cells with marginal band across species. Proc Natl Acad Sci U S A 2017; 114:4418-23. doi: 10.1073/pnas.1618041114 [Crossref] [ Google Scholar]
- Picart C, Piau J-M, Galliard H, Carpentier P. Human blood shear yield stress and its hematocrit dependence. J Rheol 1998; 42:1-12. doi: 10.1122/1.550883 [Crossref] [ Google Scholar]
- Hrncir E, Rosina J. Surface tension of blood. Physiol Res 1997; 46:319-21. [ Google Scholar]
- Gault KA, Tikuisis P, Nishi RY. Calibration of a bubble evolution model to observed bubble incidence in divers. Undersea Hyperb Med 1995; 22:249-62. [ Google Scholar]
- Brutin D, Sobac B, Loquet B, Sampol J. Pattern formation in drying drops of blood. J Fluid Mech 2011; 667:85-95. doi: 10.1017/s0022112010005070 [Crossref] [ Google Scholar]
- Deegan RD. Pattern formation in drying drops. Phys Rev E Stat Phys Plasmas Fluids Relat Interdiscip Topics 2000; 61:475-85. doi: 10.1103/PhysRevE.61.475 [Crossref] [ Google Scholar]
- Attinger D, Moore C, Donaldson A, Jafari A, Stone HA. Fluid dynamics topics in bloodstain pattern analysis: comparative review and research opportunities. Forensic Sci Int 2013; 231:375-96. doi: 10.1016/j.forsciint.2013.04.018 [Crossref] [ Google Scholar]
- Yakhno TA, Kazakov VV, Sanin AG, Shaposhnikova OB, Chernov AS. Mechanical properties of adsorption layers in solutions of human blood serum proteins: A comparative assessment. Technical Physics 2007; 52:510-4. doi: 10.1134/s1063784207040184 [Crossref] [ Google Scholar]
- Sikarwar BS, Roy M, Ranjan P, Goyal A. Automatic Pattern Recognition for Detection of Disease from Blood Drop Stain Obtained with Microfluidic Device. 2016; 425:655-67. doi: 10.1007/978-3-319-28658-7_56 [Crossref]
- Sikarwar BS, Roy M, Ranjan P, Goyal A. Automatic disease screening method using image processing for dried blood microfluidic drop stain pattern recognition. J Med Eng Technol 2016; 40:245-54. doi: 10.3109/03091902.2016.1162215 [Crossref] [ Google Scholar]
- Yakhno TA, Sanin AA, Ilyazov RG, Vildanova GV, Khamzin RA, Astascheva NP. Drying drop technology as a possible tool for detection leukemia and tuberculosis in cattle. J Biomed Sci Eng 2015; 08:1-23. doi: 10.4236/jbise.2015.81001 [Crossref] [ Google Scholar]
- Castner DG, Ratner BD. Biomedical surface science: Foundations to frontiers. Surf Sci 2002; 500:28-60. doi: 10.1016/S0039-6028(01)01587-4 [Crossref] [ Google Scholar]
- Laan N, Bremmer RH, Aalders MC, de Bruin KG. Volume determination of fresh and dried bloodstains by means of optical coherence tomography. J Forensic Sci 2014; 59:34-41. doi: 10.1111/1556-4029.12272 [Crossref] [ Google Scholar]
- Kolbasov A M, Comiskey P, Sahu R, Sinha Ray S L, Yarin A, Sikarwar B. Blood rheology in shear and uniaxial elongation. Rheologica Acta 2016; 55:901-908. doi: 10.1007/s00397-016-0964-1 [Crossref] [ Google Scholar]
- Broberg CS, Bax BE, Okonko DO, Rampling MW, Bayne S, Harries C. Blood viscosity and its relationship to iron deficiency, symptoms, and exercise capacity in adults with cyanotic congenital heart disease. J Am Coll Cardiol 2006; 48:356-65. doi: 10.1016/j.jacc.2006.03.040 [Crossref] [ Google Scholar]
- Mukherjee S, Sharma M, Devgan A, Jatana SK. Iron deficiency anemia in children with cyanotic congenital heart disease and effect on cyanotic spells. Med J Armed Forces India 2018; 74:235-40. doi: 10.1016/j.mjafi.2017.07.003 [Crossref] [ Google Scholar]
-
Sikarwar BS, Roy MK, Ranjan P, Goyal A, editors. Imaging-Based Method for Precursors of Impending Disease from Blood Traces. Singapore: Springer; 2017. 10.1007/978-981-10-1675-2_41
- Mukesh Roy BSS, Mohit Bhandwal, Priya Ranjan. Modelling of Blood Flow in Stenosed Arteries. Procedia Computer Science 2017; 115:821-30. doi: 10.1016/j.procs.2017.09.164 [Crossref] [ Google Scholar]
- Rosina J, Kvasnak E, Suta D, Kolarova H, Malek J, Krajci L. Temperature dependence of blood surface tension. Physiol Res 2007; 56 Suppl 1:S93-8. [ Google Scholar]
- Fathi-Azarbayjani A, Jouyban A. Surface tension in human pathophysiology and its application as a medical diagnostic tool. Bioimpacts 2015; 5:29-44. doi: 10.15171/bi.2015.06 [Crossref] [ Google Scholar]
- Kim HJ, Son JK, Seo YH, Kim BH, Lee WH, Park KT. Disposable microfluidic blood cuvette for measuring hemoglobin concentration. Microsyst Technol 2014; 20:499-504. doi: 10.1007/s00542-013-1954-1 [Crossref] [ Google Scholar]
- Yap BK, SN MS, Talik NA, Lim WF, Mei IL. Potential Point-of-Care Microfluidic Devices to Diagnose Iron Deficiency Anemia. Sensors (Basel) 2018:18. doi: 10.3390/s18082625 [Crossref]
- Krishnan A, Wilson A, Sturgeon J, Siedlecki CA, Vogler EA. Liquid-vapor interfacial tension of blood plasma, serum and purified protein constituents thereof. Biomaterials 2005; 26:3445-53. doi: 10.1016/j.biomaterials.2004.09.016 [Crossref] [ Google Scholar]
- Baskurt OK, Meiselman HJ. Blood rheology and hemodynamics. Semin Thromb Hemost 2003; 29:435-50. doi: 10.1055/s-2003-44551 [Crossref] [ Google Scholar]
- Kim S, Cho YI, Jeon AH, Hogenauer B, Kensey KR. A new method for blood viscosity measurement. Journal of Non-Newtonian Fluid Mechanics 2000; 94:47-56. doi: 10.1016/S0377-0257(00)00127-0 [Crossref] [ Google Scholar]
-
Penhouët L, Laurent A, Dufaux J, Bailly AL, Durussel JJ, Bonneau M, et al. Blood viscosity comparison and red blood cells aggregation in three species (human, pig, sheep) before and after addition of contrast medium. Agris; 1996.