Bioimpacts. 10(3):169-175.
doi: 10.34172/bi.2020.21
Original Research
Fluid-structure interaction of blood flow around a vein valve
Zahra Hajati 1  , Farhad Sadegh Moghanlou 1, * , Mohammad Vajdi 1 , Seyed Esmail Razavi 2, Somaieh Matin 3
Author information:
1Faculty of Engineering, University of Mohaghegh Ardabili, Ardabil, Iran
2Faculty of Mechanical Engineering, University of Tabriz, Tabriz, Iran
3Department of Internal Medicine, Ardabil University of Medical Sciences, Ardabil, Iran
Abstract
Introduction:
Venous valves are a type of one-way valves which conduct blood flow toward the heart and prevent its backflow. Any malfunction of these organs may cause serious problems in the circulatory system. Numerical simulation can give us detailed information and point to point data such as velocity, wall shear stress, and von Mises stress from veins with small diameters, as obtaining such data is almost impossible using current medical devices. Having detailed information about fluid flow and valves' function can help the treatment of the related diseases.
Methods:
In the present work, the blood flow through a venous valve considering the flexibility of the vein wall and valve leaflets is investigated numerically. The governing equations of fluid flow and solid domain are discretized and solved by the Galerkin finite element method.
Results:
The obtained results showed that the blood velocity increases from inlet to the leaflets and then decreases passing behind the valve. A pair of vortices and the trapped region was observed just behind the valves. These regions have low shear stresses and are capable of sediment formation.
Conclusion:
The von Mises stress which is a criterion for the breakdown of solid materials was obtained. It was also observed that a maximum value occurred at the bottom of the leaflets.
Keywords: Venous valve, Blood flow, Fluid-structure interaction, Numerical method
Copyright and License Information
© 2020 The Author(s)
This work is published by BioImpacts as an open access article distributed under the terms of the Creative Commons Attribution License (
http://creativecommons.org/licenses/by-nc/4.0/). Non-commercial uses of the work are permitted, provided the original work is properly cited.
Introduction
The cardiovascular system is a closed-loop circuit which consists of the heart, the systemic, and the pulmonary blood vessels.
1
Blood vessels are divided into the arteries, the veins, and the capillaries.
2
Veins are responsible for blood transport back to the heart. The pressure in the venous system is low, therefore a supplementary pumping system(muscular pumping) helps to return the blood from the lower limbs toward the heart.
2
A series of one-way valves which are called venous valves, conduct the blood toward the heart and prevent its backflow. Inadequacy in the venous valves results in leaking back of blood toward the legs, veins malfunction, and subsequent diseases such as varicose veins.
1
In order to treat the diseases related to the venous system, it is needed to have detailed information about blood behavior through the veins. Experimental methods like invasive method not only disturb the flow regime but also correspond to the related costs, uncertainties, pain, and related dangers. On the other hand, it is very difficult to get detailed data in any position especially in vessels with small diameters. Computational fluid dynamics (CFD) is a practical, competent and reliable tool for investigation of blood behavior through the cardiovascular system due to its low cost and straightforwardness.
3
The simulation results can be used for practical purposes such as prosthetic venous valve design. In the present work, the blood flow around a venous valve was studied through the interaction of blood and the deformable venous valves leaflet using fluid-structure interaction (FSI).
Research background
Noda et al
4
investigated the valve effect on the blood flow behavior numerically and observed a vortex pair just behind the valve. Tien et al
5
and Ohashi et al
6
used an experimental and numerical method respectively and reported vortex formation around leaflets and the function of sinus pockets as flow regulators.
Narracott et al
7
used a numerical method to represent that the deformation of valve orifice, valvular pressure drops, and increase in velocity through the valve affect venous flow. The effects of variations in the leaflet gap width and the ratio of the sinus depth to vein diameter were experimentally studied by Buescher et al.
8
Downie et al
9
analyzed the effects of elastic compression on calf veins experimentally and estimated their WSS with numerical simulations.
A mesh-free and discrete multi-physics approach was proposed by Ariane et al
10
for numerical simulation of the hydrodynamics in flexible valves as an alternative to mesh-based modeling. Rohan et al
11
studied the effect of exterior compression on reducing the trans-mural pressure by the use of numerical simulation and found that it had a positive impact on the control and treatment of venous diseases. Partsch et al
12
evaluated the external pressure necessary for contraction and obstruction of leg veins in sitting, standing and supine positions using experimental methods.
Rohan et al
13
using a numerical method showed that muscle contraction is more helpful to reduce the deep vein diameter in contrast to the medical compression stockings. Simakov et al
14
studied blood flow in lower extremities under intense physical load. Their computational study presented the skeletal-muscle pump impact as an exterior time-periodical pressure function with a period associated with the two-stride period during running applied to a group of veins. Lurie et al
15
experimented blood flow changes and venous wall movements in the perivalvular area and recorded the duration of four phases of a valve cycle in supine and standing position at rest and while performing foot movements.
Ariane et al
16
used mathematical modeling to study free emboli circulation in the flow around a valve. They discovered that the presence of an embolus influences both blood flow and the leaflets of venous valves' behavior. In the opening region, the embolus can potentially generate new vortex area that can further increase platelets aggregation.
Wang et al
17
analyzed blood flow and WSS in the peroneal veins under external compression using CFD methods and in vivo data. They reported a strong linear relationship between the time-averaged WSS and mean blood velocity.
Materials and Methods
To simulate and validate the obtained results of blood flow through a venous valve, a Doppler Ultrasound image of a 35-year-old person was used (Fig. 1A). The scan was performed with the person in a relaxed supine position and the flow velocity was measured at a point between the valve leaflets of the femoral vein. The computational geometry (Fig. 1B) was designed based on the real sample of Fig. 1A. Blood (Domain 5) is considered as Newtonian fluid, and the governing equations are solved for laminar regime.
16,18-20
The vein wall (Domain 6) is considered to be linear elastic material.
8
Due to the high flexibility of the valve leaflets (Domain 1), they are considered as hyper-elastic materials.
21
Blood and vein wall properties are given in Table 1.
22
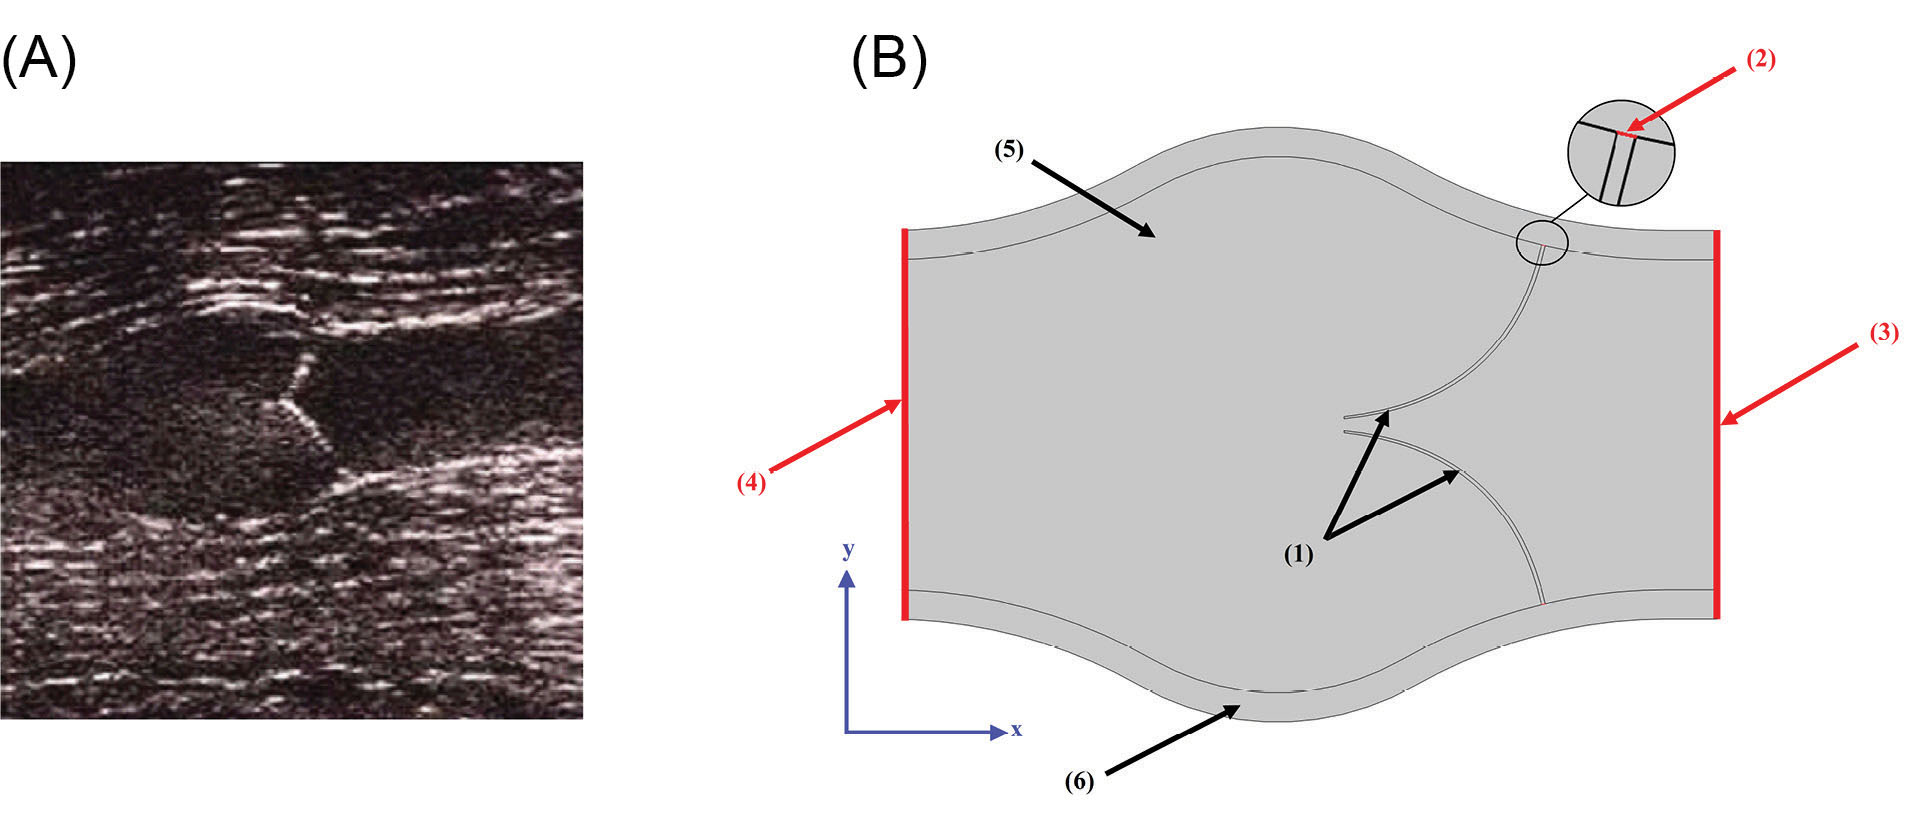
Fig. 1.
Applied geometry of the present work. (A) Doppler Ultrasound image of a venous valve in the closed position. (B) Geometry for present work.
.
Applied geometry of the present work. (A) Doppler Ultrasound image of a venous valve in the closed position. (B) Geometry for present work.
Table 1.
Blood and vein wall properties
16,23-25
|
Parameter
|
Value
|
Ref.
|
|
Blood Viscosity, µblood
|
0.0035 Pa.s |
16
|
|
Blood Density, ρblood
|
1056 kg.m
-3
|
25
|
|
Vein Wall Density, ρwall
|
1200 kg.m-3
|
25
|
|
Vein Wall Young’s Modulus, υwall
|
10.63 MPa |
24
|
|
Vein Wall Poisson’s Ratio, υwall
|
0.499 |
24
|
Since the periodic blood inflow to the vein would be a result of muscles activity and sequential opening and closing of the valves, the inlet boundary condition (Boundary 3) was set to a sine function versus time as Eq. (1). This function was a correlation for blood velocity as a result of sequential opening and closing of the series of the valves in a vein.
23
The inlet velocity rises to a value of 10 cm/s at t=3s and then decreases to reach zero at t=6s. The velocity function is dependent on the type of body activity. For example in the case of fast running, the time that the velocity reaches its maximum value decreases and the higher value for velocity magnitude is observable. For the supine position, the velocity magnitude has lower values than the maximum amount (10 cm/s) according to Eq.1.
The outlet boundary condition (Boundary 4) was set at P=0. Referring Fig. 1B, the valves connected parts to the vein wall (Boundary 2) were fixed constraint and other parts of vein were considered to be free.
26
The governing equations were discretized and solved by Galerkin finite element method. The computational domain was divided into four parts and meshed separately. Fig. 2 shows the meshed domain. The inlet region was meshed by extremely fine mapped elements and the rest of the regions were meshed using coarser unstructured triangular meshes.
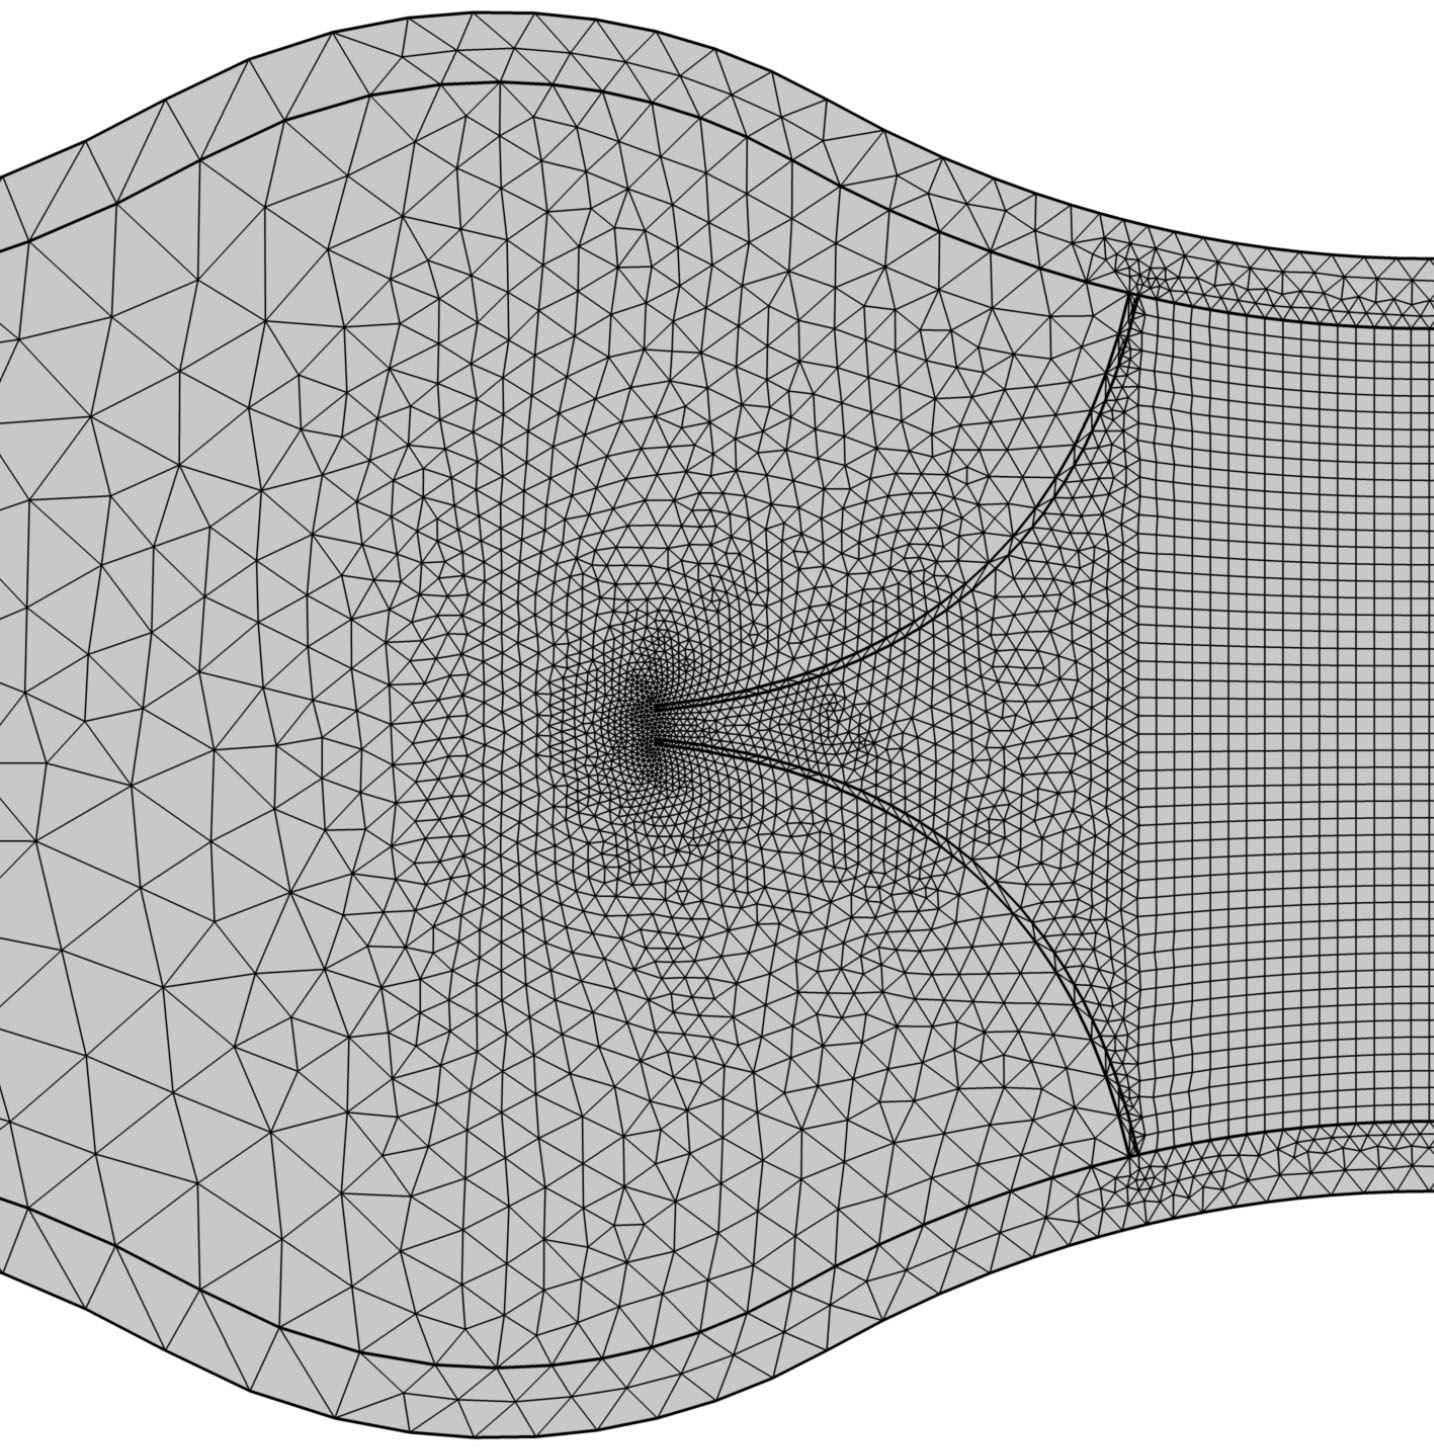
Fig. 2.
Mesh elements at different parts of the geometry.
.
Mesh elements at different parts of the geometry.
According to the flexibility of the valves, the highly deformed geometry resulted in distortion of mesh elements and consequent solution divergence. Therefore it was necessary to remesh the geometry whenever the distortion of elements was over the standard amount (or whenever the quality of the mesh was lower than 0.2). The solution continued for the new mesh and this procedure was repeated until the convergence of the solution. In the present work, Yeoh
27
method was used for remeshing process.
Governing equations
In the current work, the blood flow was studied numerically around a venous valve considering the interaction of blood and the hyperelastic venous valves leaflets using FSI method.
In the FSI problems, both fluid and solid governing equations should be solved. Considering the interface forces of the solid and fluid domain, the fluid dynamics and solid mechanics were coupled. Hence the fluid problem was solved on a moving domain. The governing equations consisted of the continuity and the momentum equations for fluid flow and the hyper-elastic stress-strain equation for highly deformable valves. In order to consider the solid-fluid interaction, the arbitrary Lagrangian-Eulerian method was used and the fluid and the solid domains were formulated in Eulerian and Lagrangian coordinates, respectively. The partial differential equations were coupled on the moving interfaces which separate the fluid and solid components.
28
In the current work, the time-dependent model was used to solve the equations.
For the fluid domain, the continuity and momentum equations were employed as shown in Eqs. (2) and (3).
29
where , ρ and t indicate velocity vector, blood density and time, respectively. Since the fluid is considered Newtonian, stress tensor, τij is as the form of Eq. (4).
29
(4)
Where p, u, δij, µ and λ represent pressure, velocity, Kronecker delta, viscosity, and Lamѐ parameter for fluid compressibility.
The solid domain equations are linear elastic stress-strain relation for vein wall and hyperelastic equations for the highly deformable valves. For the vein wall, the displacement equation (second law of Newton) and linear elastic Hook’s law were used which are given in equations (5) and (6). The elastic strain energy density is also defined as Eq. (7).
30
(6)
(7)
Where fv, ρs, u and σs represent body forces, solid body density, displacement vector, and stress tensor.
A hyperelastic material is defined by its elastic strain energy density. In the current work, the Neo-Hookean model was used to model the venous valve and its elastic strain energy density is shown as:
(8)
Where µs and λ3 are Lamѐ Parameters.
The interaction of fluid and solid on their interfaces should be defined, as all boundaries experience a load from the fluid which is given by Eq. (9).
(9)
In which n, p, I, µ, and ufluid represent the normal vector of the boundary, fluid pressure, identity matrix, fluid dynamic viscosity, and flow field respectively.
Results
Blood enters the inlet region with a maximum periodic velocity of 10 cm/s. In the first instance, the valves are closed. Blood flow applies stress to the valves and consequent strain results in the valve opening through time. It is needed to validate the obtained results of numerical simulation, therefore a series of experiments were carried out by Doppler ultrasound image of a healthy thirty-five-year-old person with no history of vascular disease which is shown in Fig. 3A and 3B. The velocity magnitude of blood passing through the valve was obtained at three different points along the centerline of the femoral vein with the subject in supine position and the data was compared with numerical results.
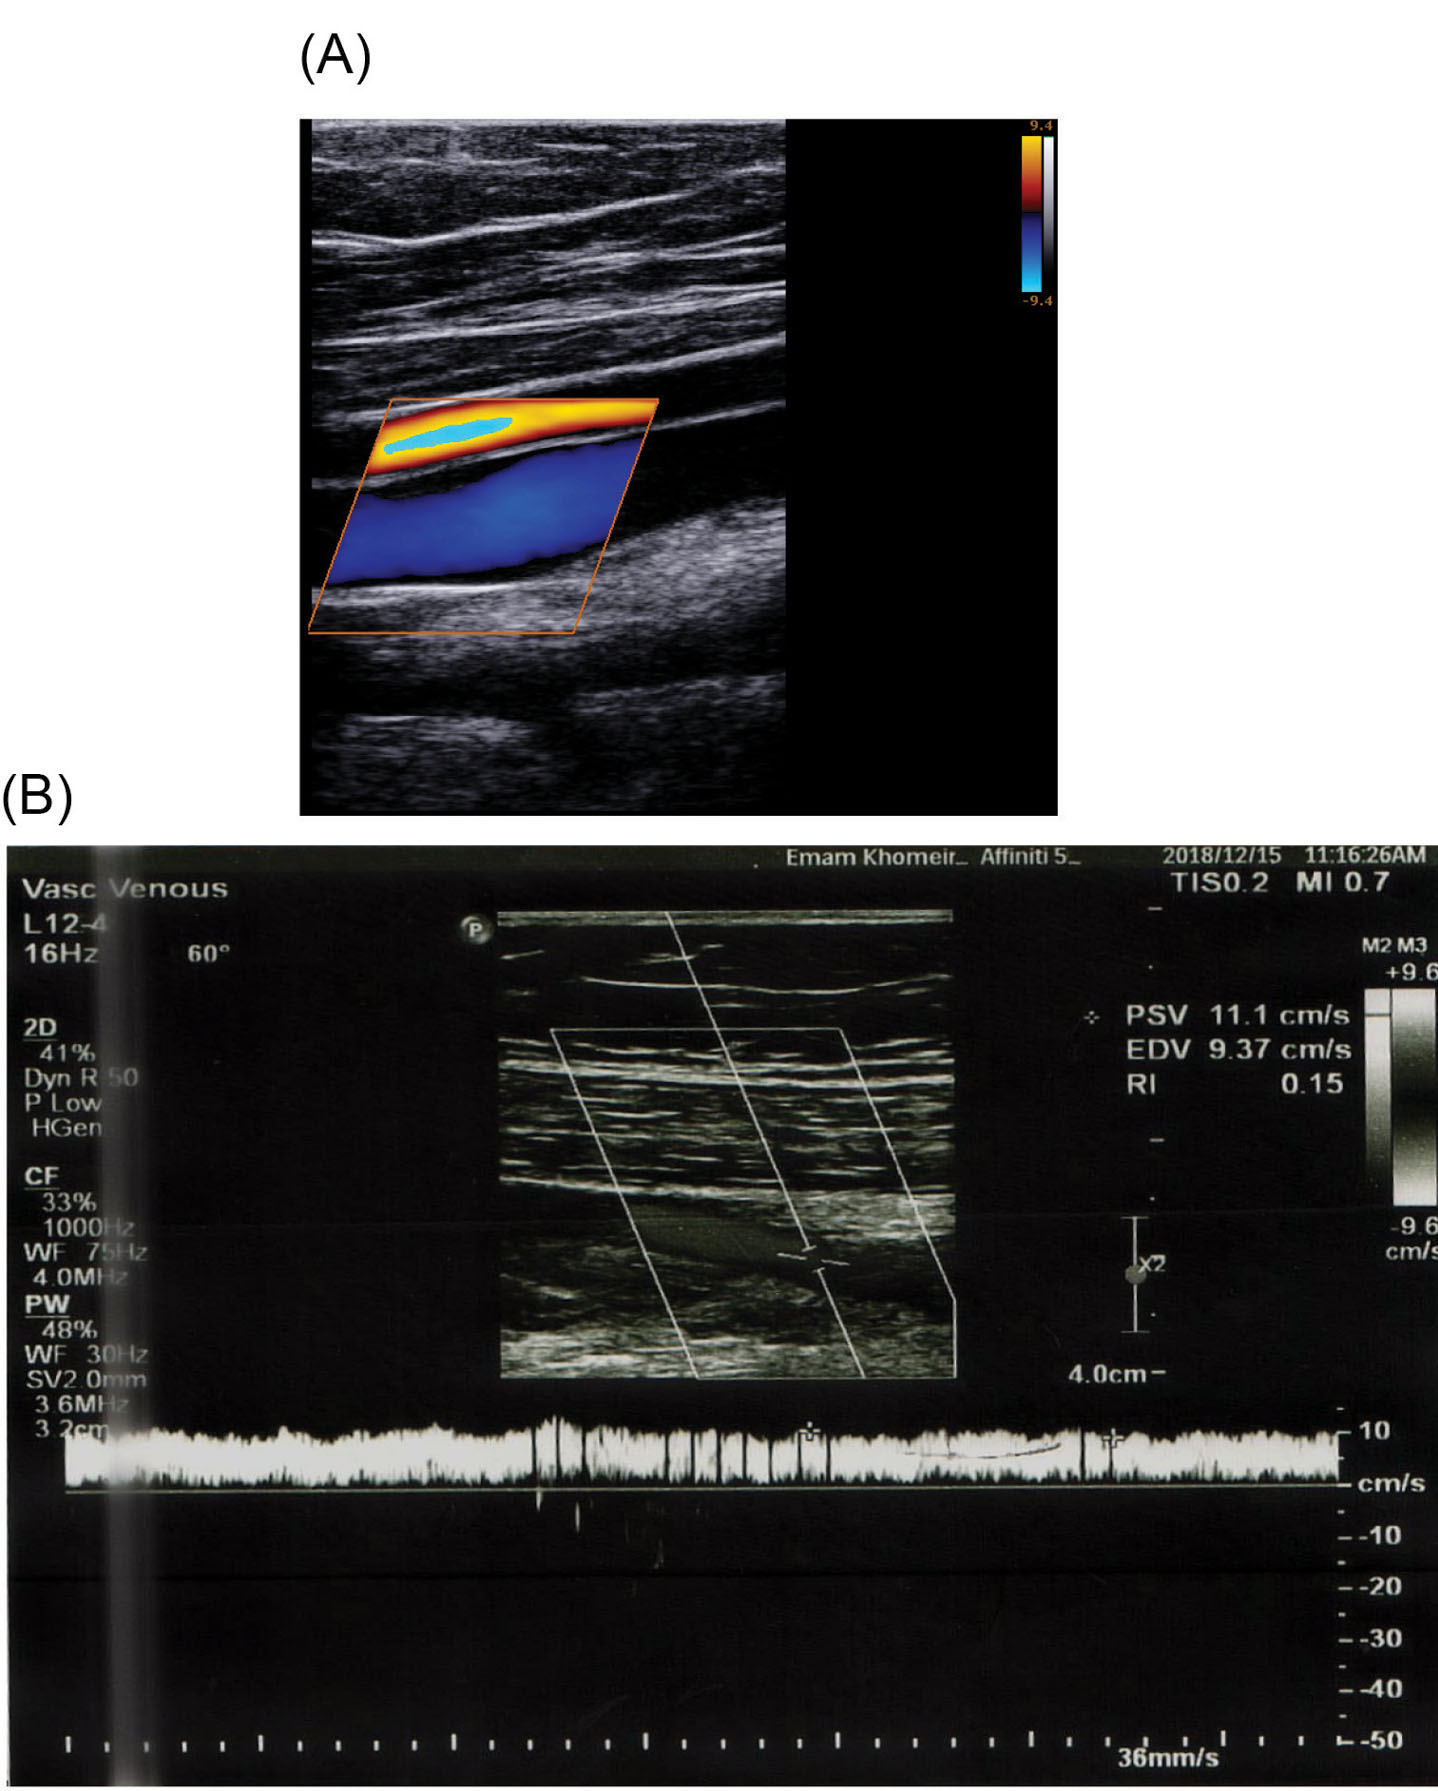
Fig. 3.
In vivo measurements. (A) Doppler Ultrasound image of the vein. (B) Velocity magnitude at the point between leaflets obtained by Doppler Ultrasound image.
.
In vivo measurements. (A) Doppler Ultrasound image of the vein. (B) Velocity magnitude at the point between leaflets obtained by Doppler Ultrasound image.
The mesh independency was investigated for the maximum blood velocity at t=1.31. Fig. 4 shows the blood velocity versus mesh elements in which the 9794 triangular Elements were selected for simulations.
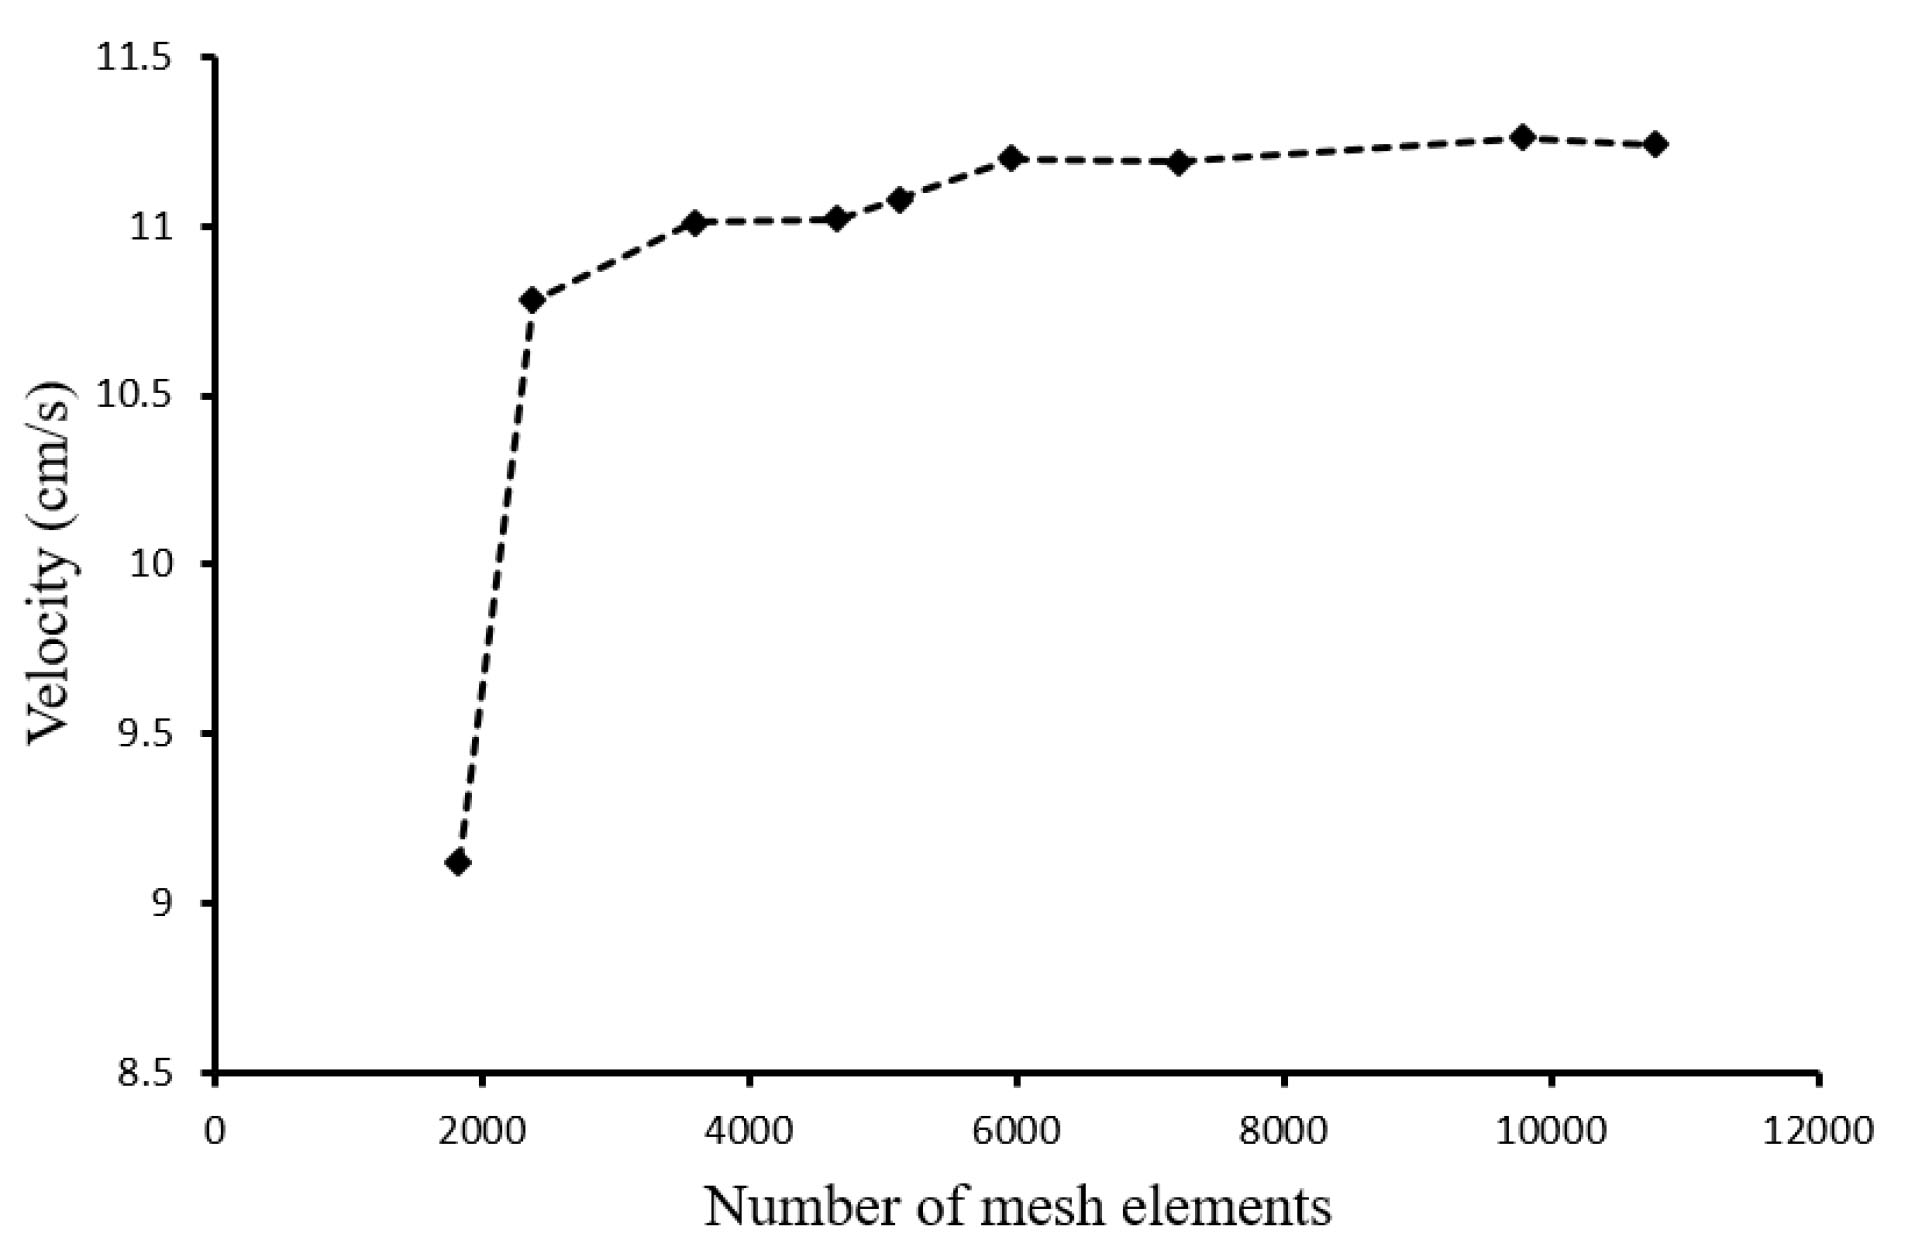
Fig. 4.
Mesh independency.
.
Mesh independency.
The flow behavior around the valve and the generated vortices around the valve are shown in Fig. 5A and Fig. 5B, respectively.
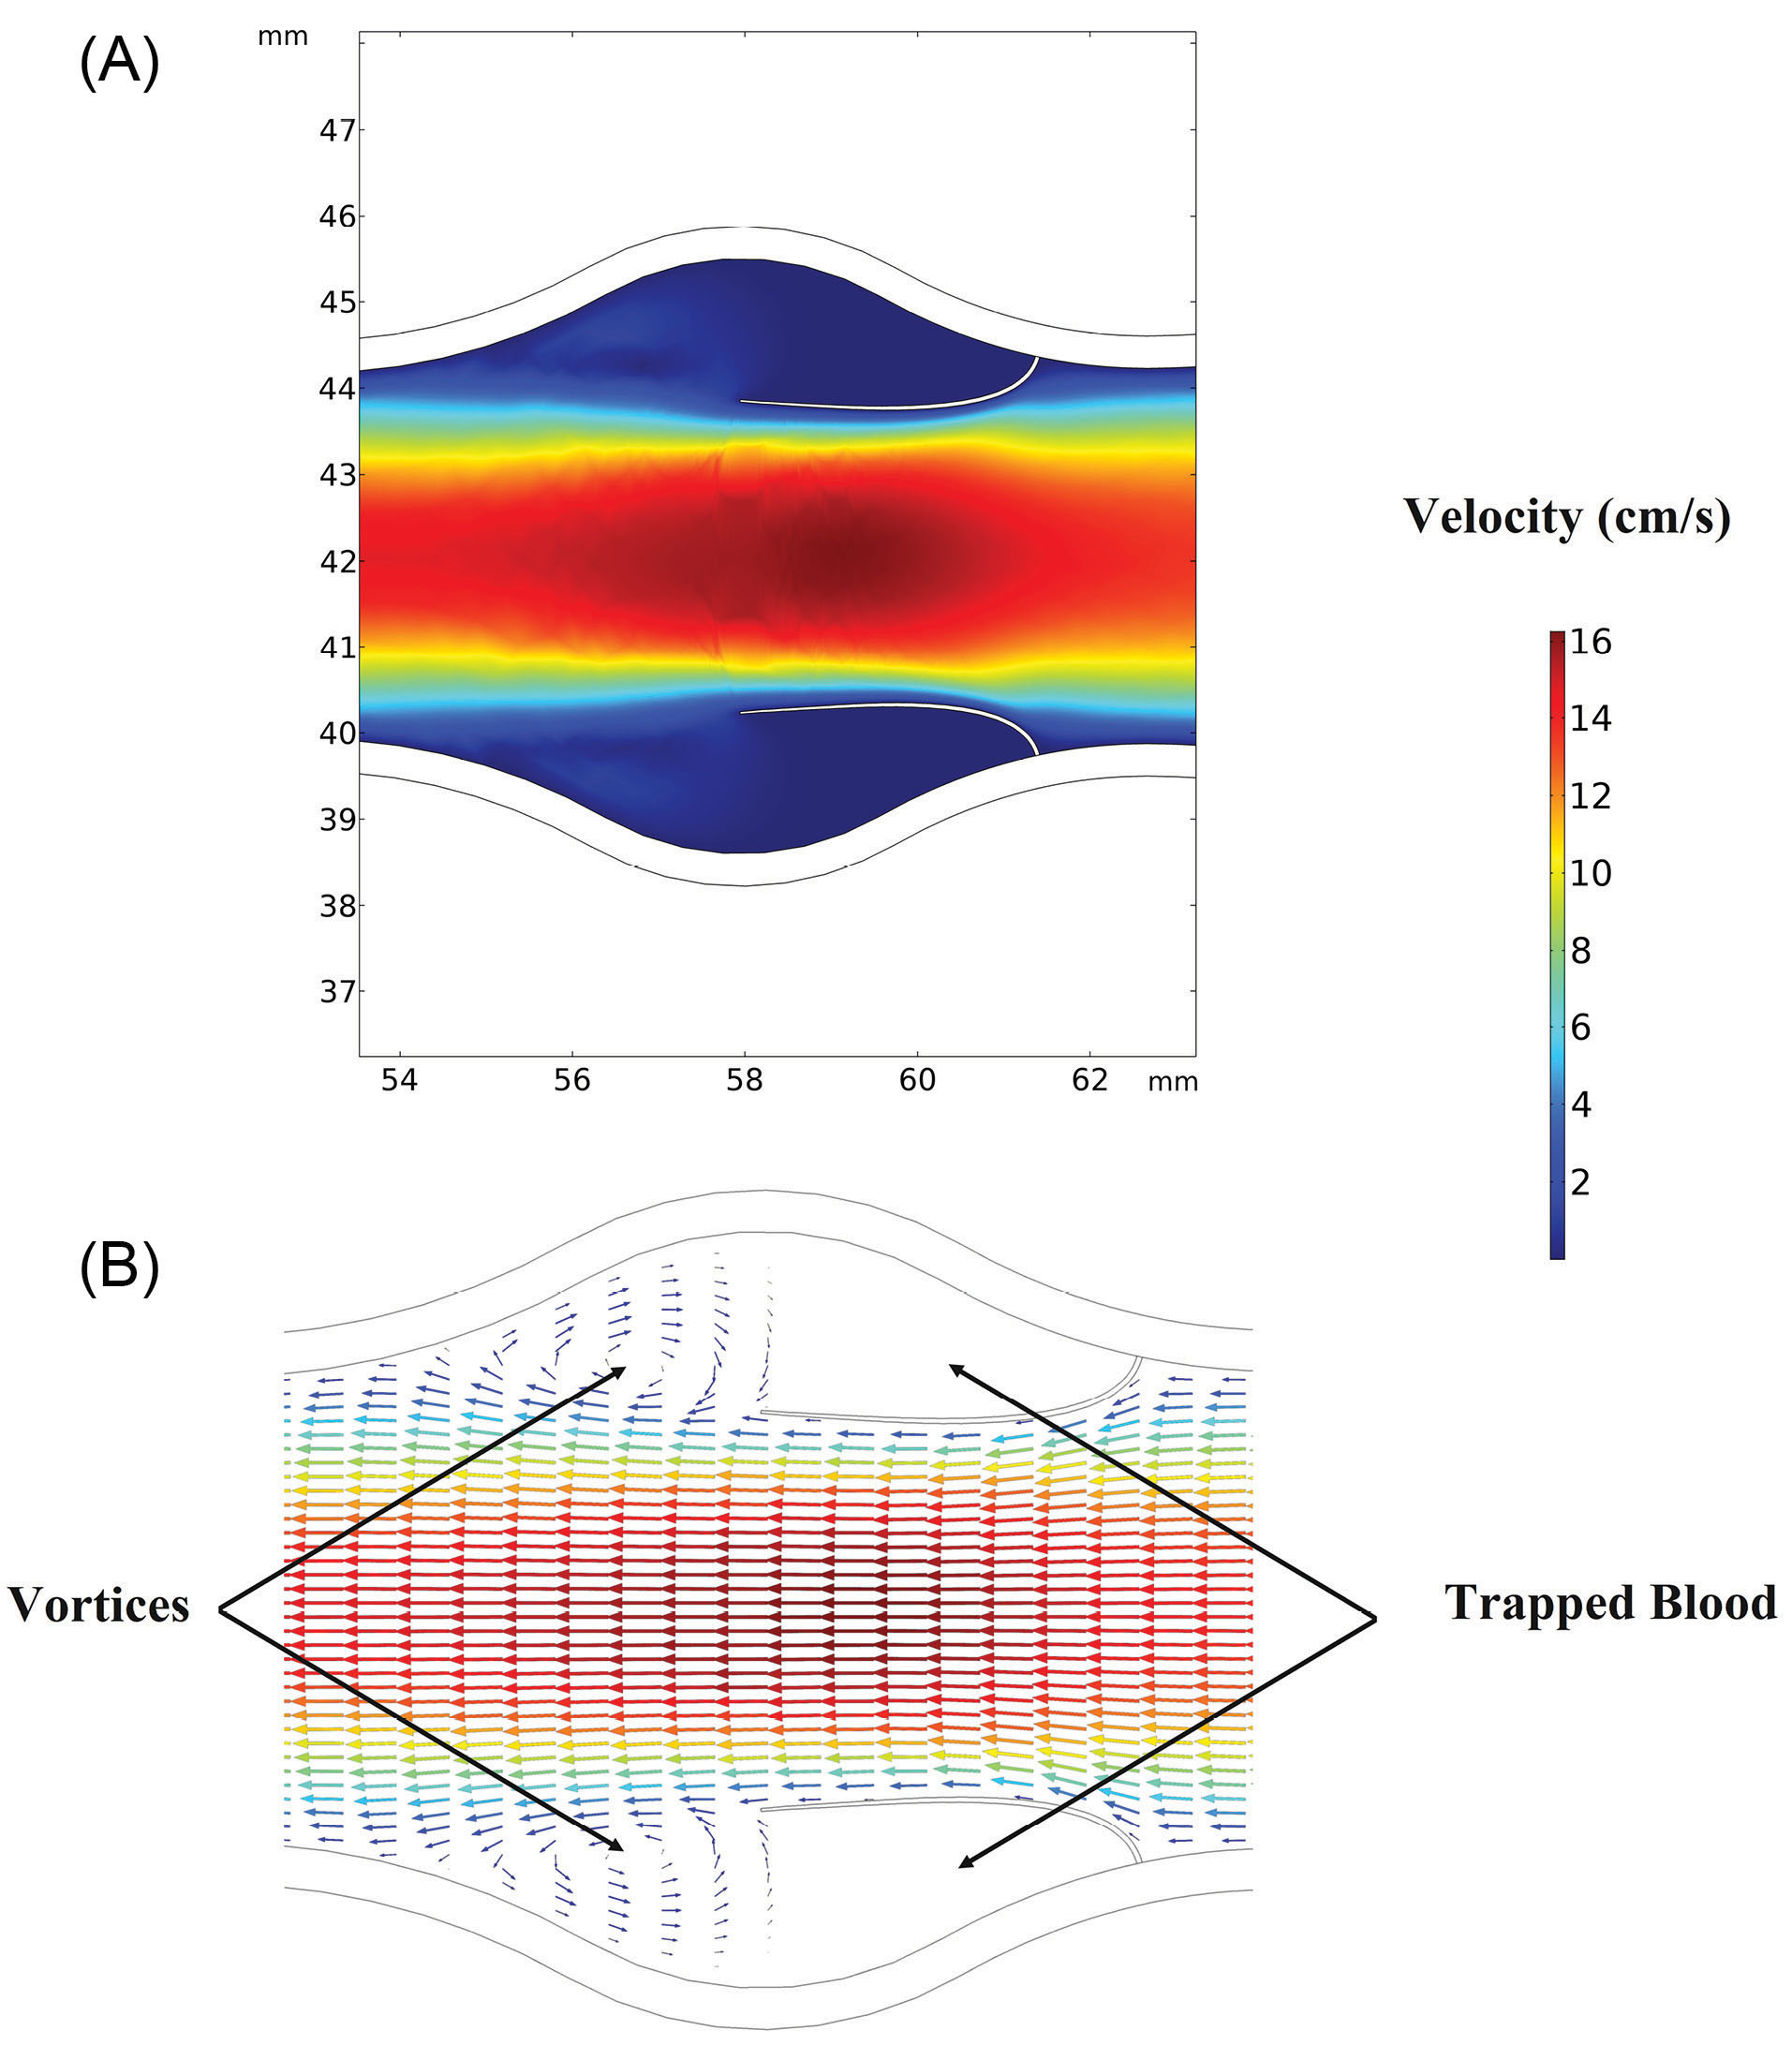
Fig. 5.
Flow behavior around the valve. (A) Velocity contours around the valve. (B) Vortex formation just behind the leaflets.
.
Flow behavior around the valve. (A) Velocity contours around the valve. (B) Vortex formation just behind the leaflets.
The leaflets opening versus time up to t=6 s is shown in Fig. 6. In the beginning, when t=0 there was no blood flow and the valve was closed. As inlet velocity increased by Equation 1, the blood flow applied external stress to the wall of the vein as well as leaflets. This total stress was in the right-hand side of the momentum equation (Eq. 3). Applied stresses by the blood resulted in solid domain strains and corresponding deformations. These deformations caused openings of the valves which allow the blood passing in the left direction. By passing the time, as a result of increased velocity magnitude, the valve opening increased. After t=3s as a result of decreased inlet velocity, valve opening decreased by the time.
Referring to Fig. 6, at each time step, the blood velocity rised from the inlet toward the valve and then again droped towards the outlet. The velocity reached a maximum amount passing through the valve, at the point where the cross-sectional area of the passing flow is minimum. This fact is also shown in Fig. 7 that shows the velocity variation along the vein at t=1.31 s, which corresponds to the 90.79 % of valve opening.
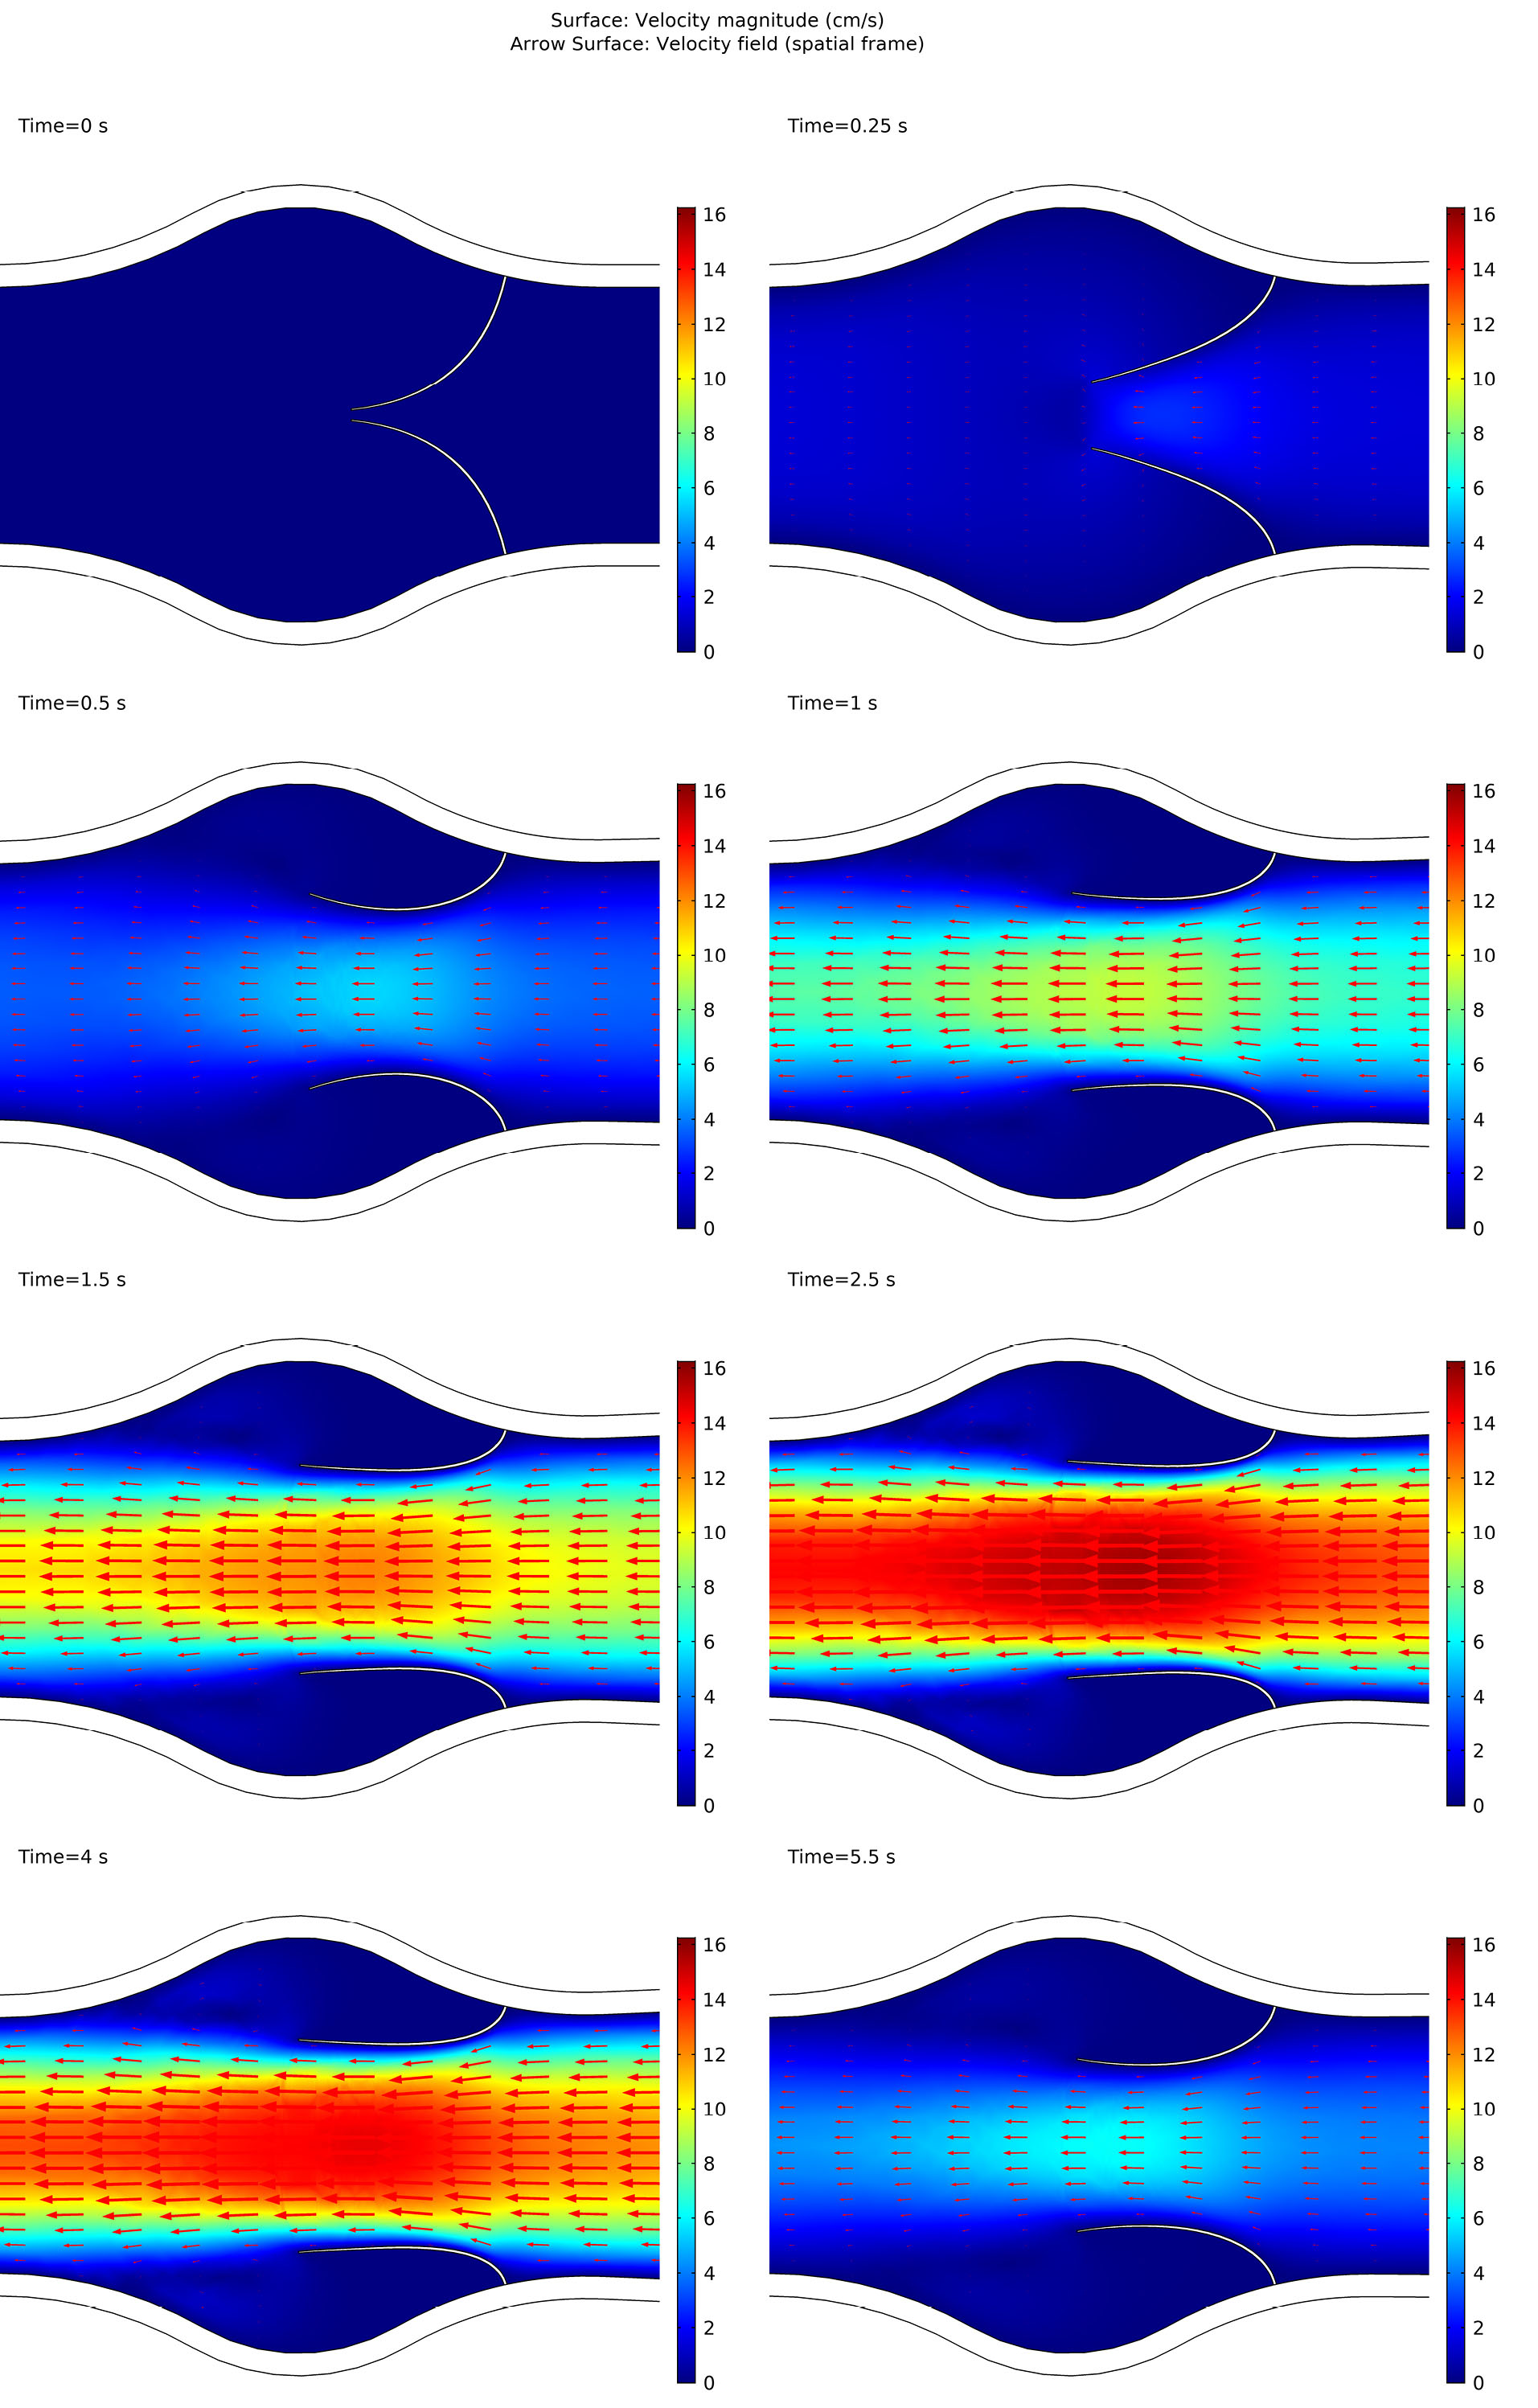
Fig. 6.
Leaflets opening through time.
.
Leaflets opening through time.
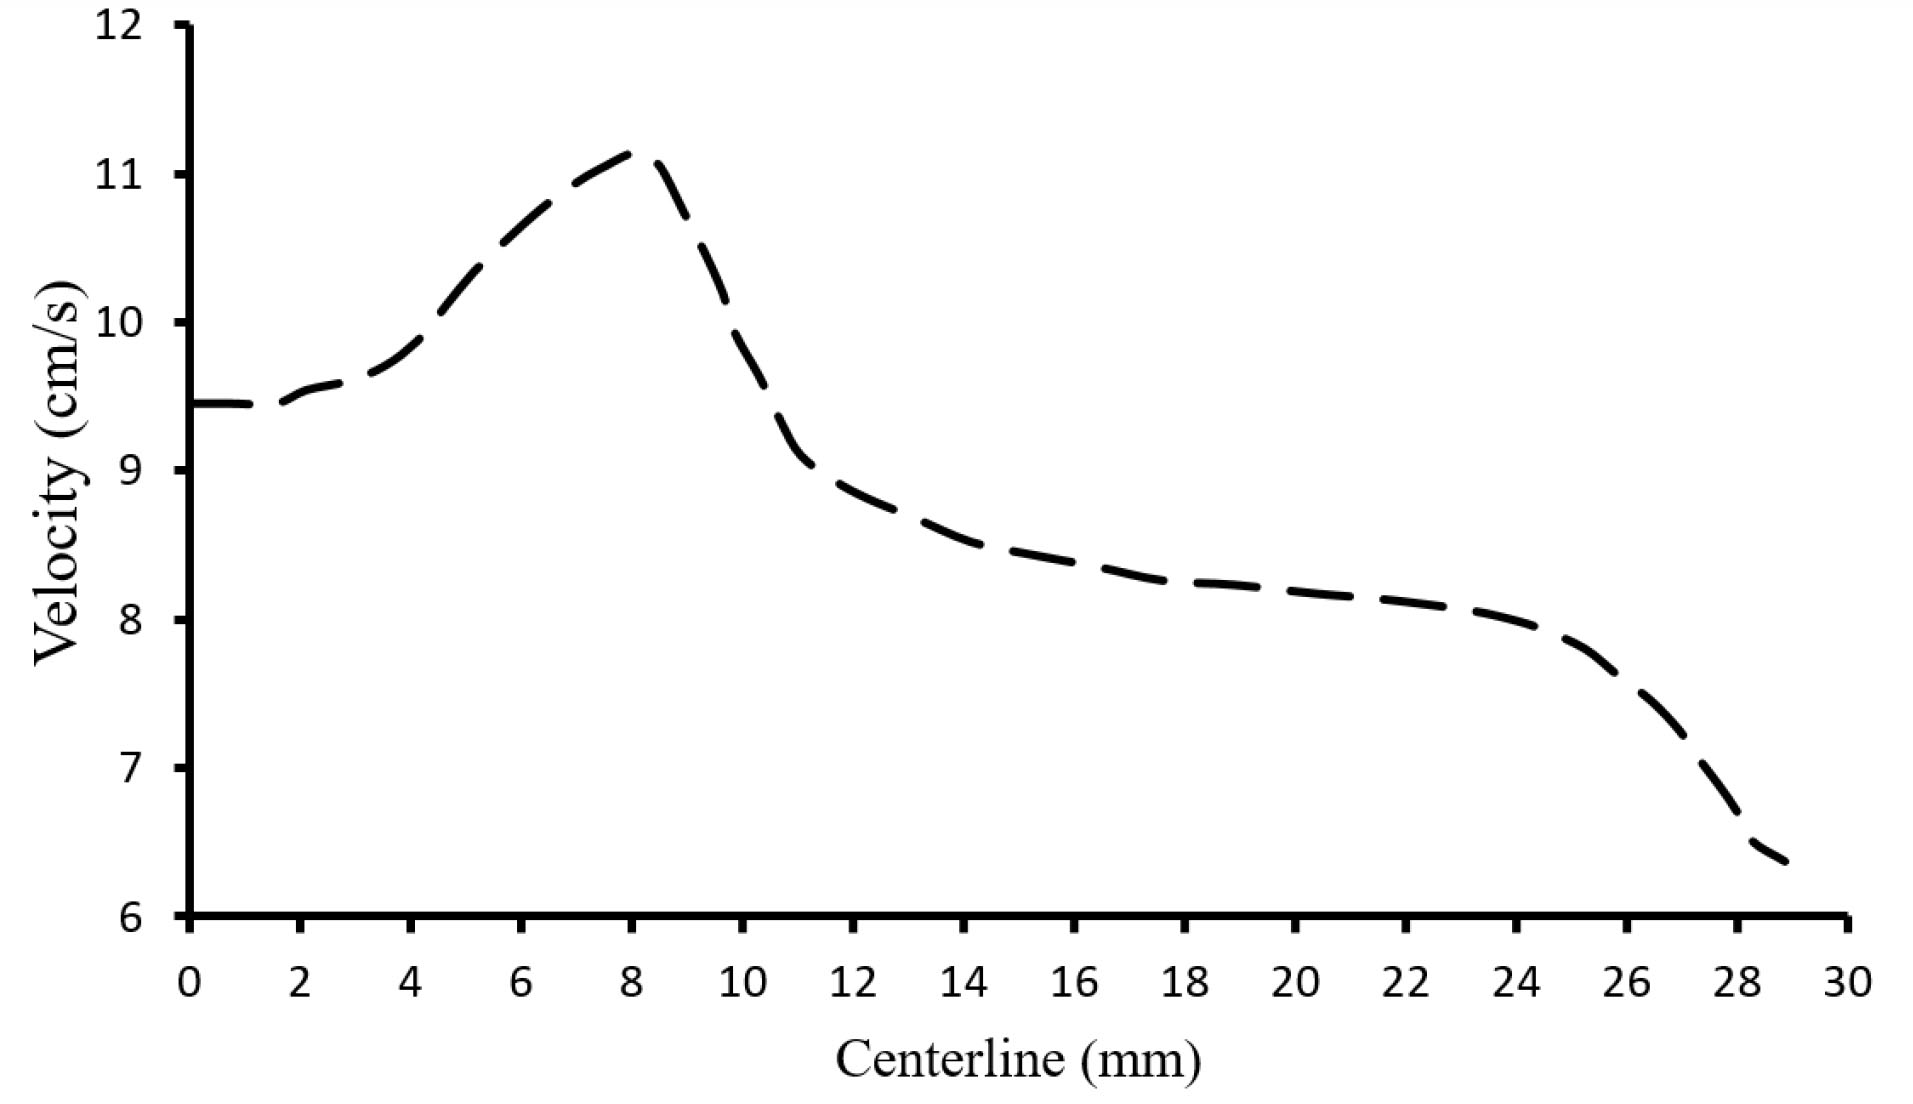
Fig. 7.
Velocity magnitude at the centerline of the vein at t=1.31s.
.
Velocity magnitude at the centerline of the vein at t=1.31s.
Fig. 8A shows the region at the venous wall in the sinus pocket just behind the valve leaflet which is used to obtain the shear stress (Fig. 8B). The shear stress at the connection point of the valve to the wall was almost negligible. This point was capable of clot formation.
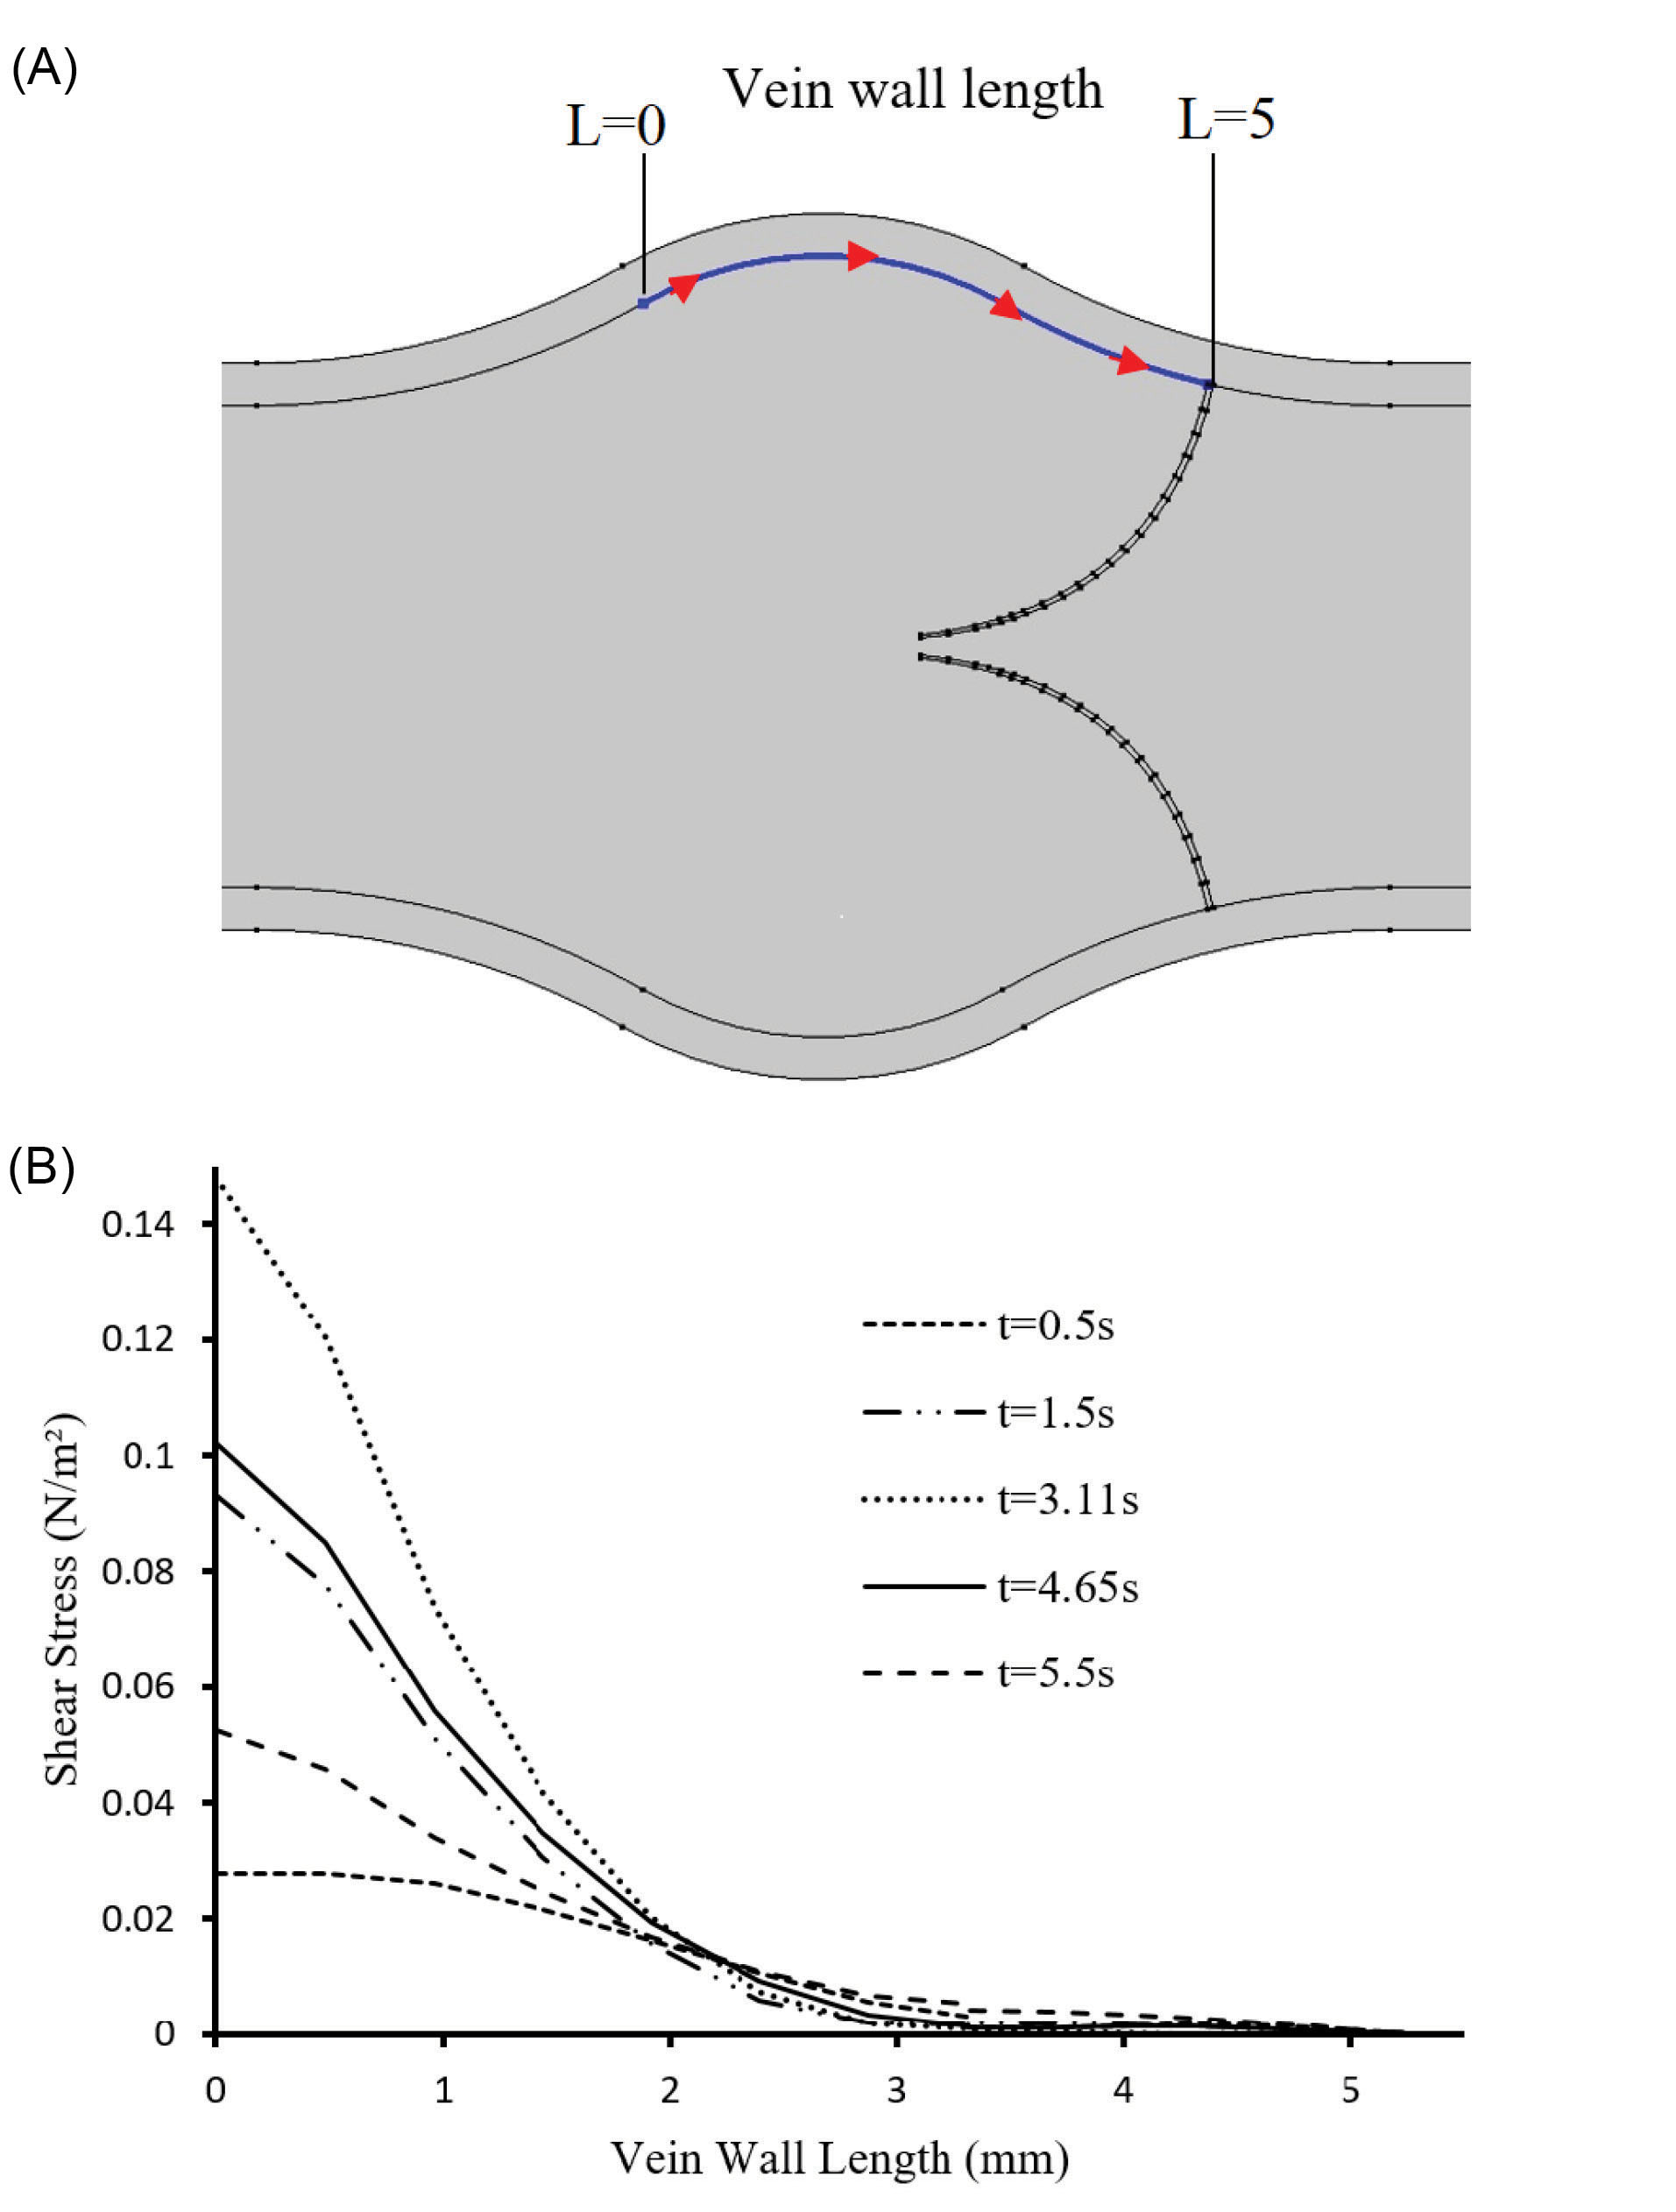
Fig. 8.
Wall shear stress behind the valve. (A) Boundary considered for shear stress analysis. (B) Shear stress through the length of the vein wall.
.
Wall shear stress behind the valve. (A) Boundary considered for shear stress analysis. (B) Shear stress through the length of the vein wall.
Fig. 9 shows the venous valve leaflet’s maximum von Mises stresses versus time. The von Mises stress increased to a maximum amount when the valve was fully opened (t=3.11s) and experienced its maximal deformation. As the valve closed and leaflets went back to their normal state, von Mises stress gradually decreased.
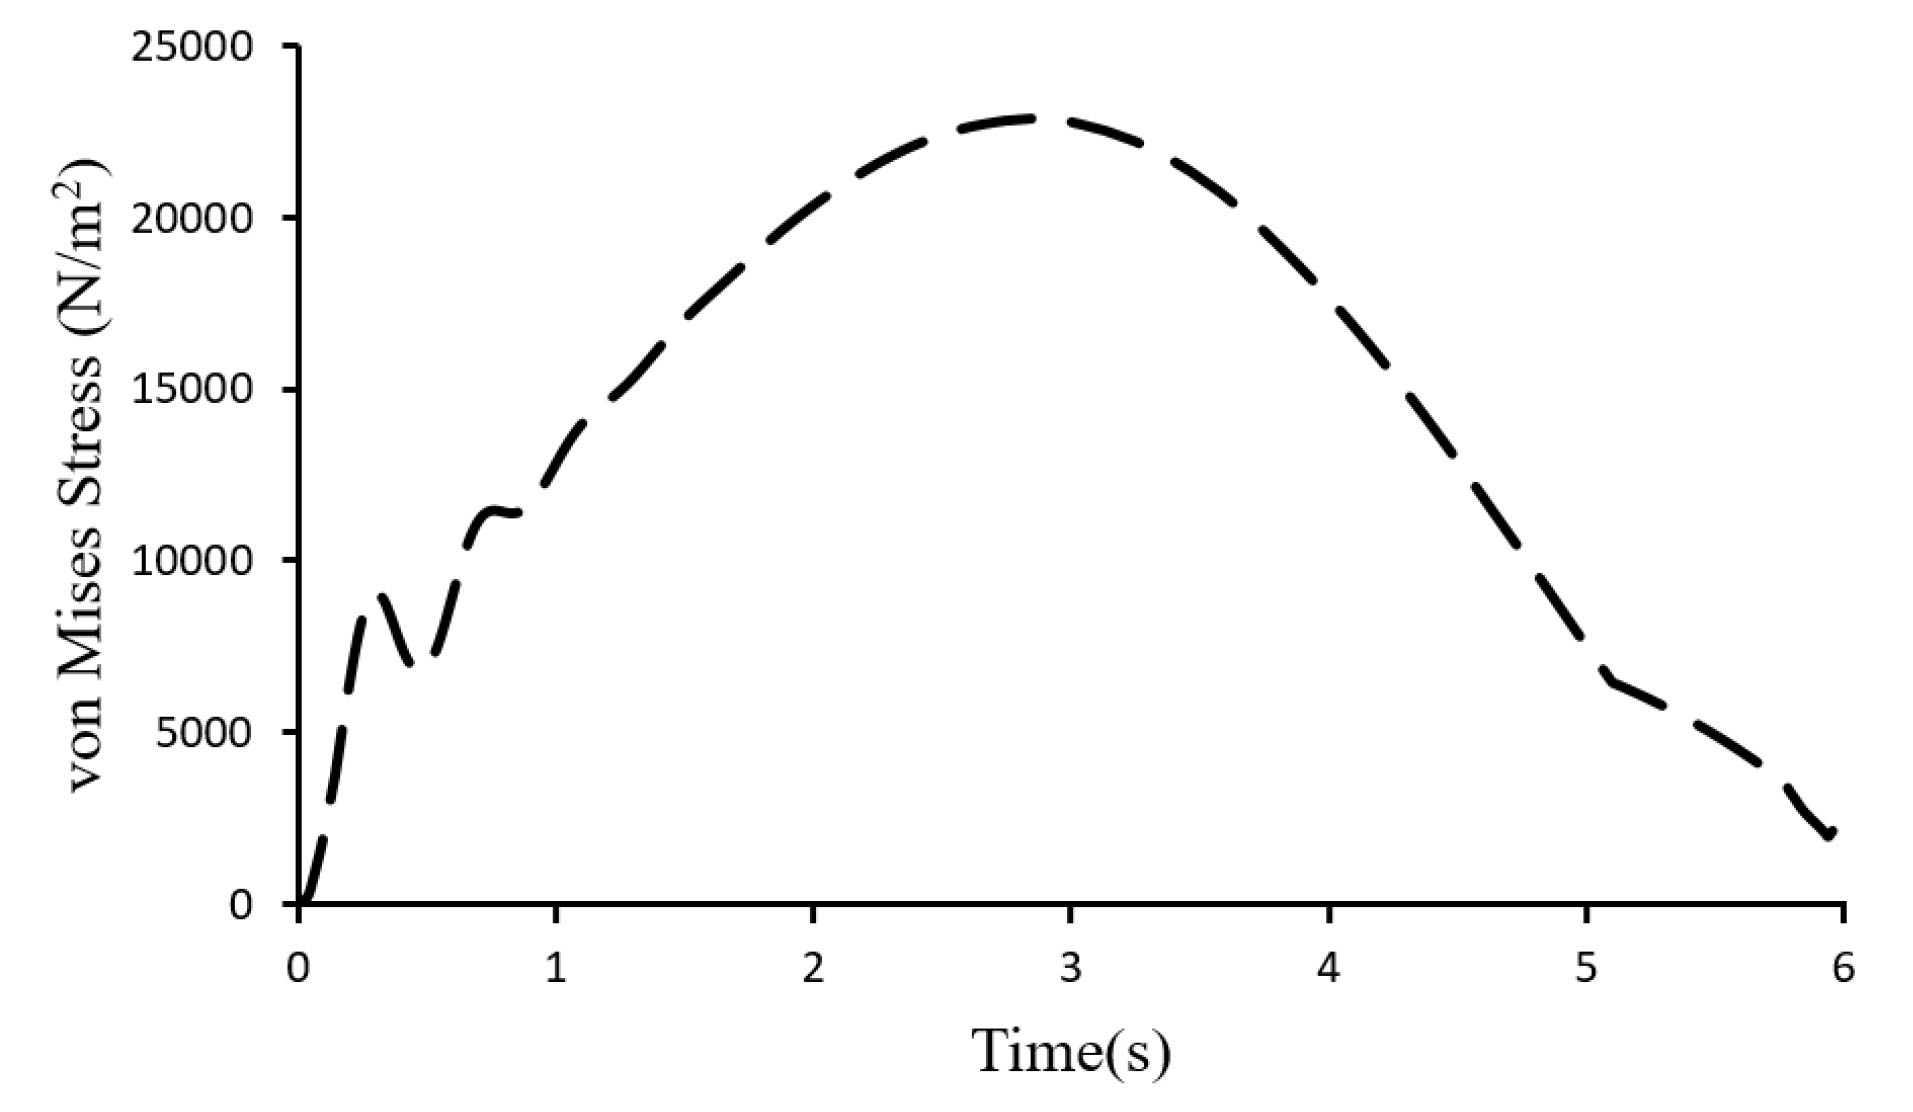
Fig. 9.
von Mises stress versus time.
.
von Mises stress versus time.
The maximum andminimum von Mises stress of the solid domain when the valve is fully open are shown in Fig. 10.
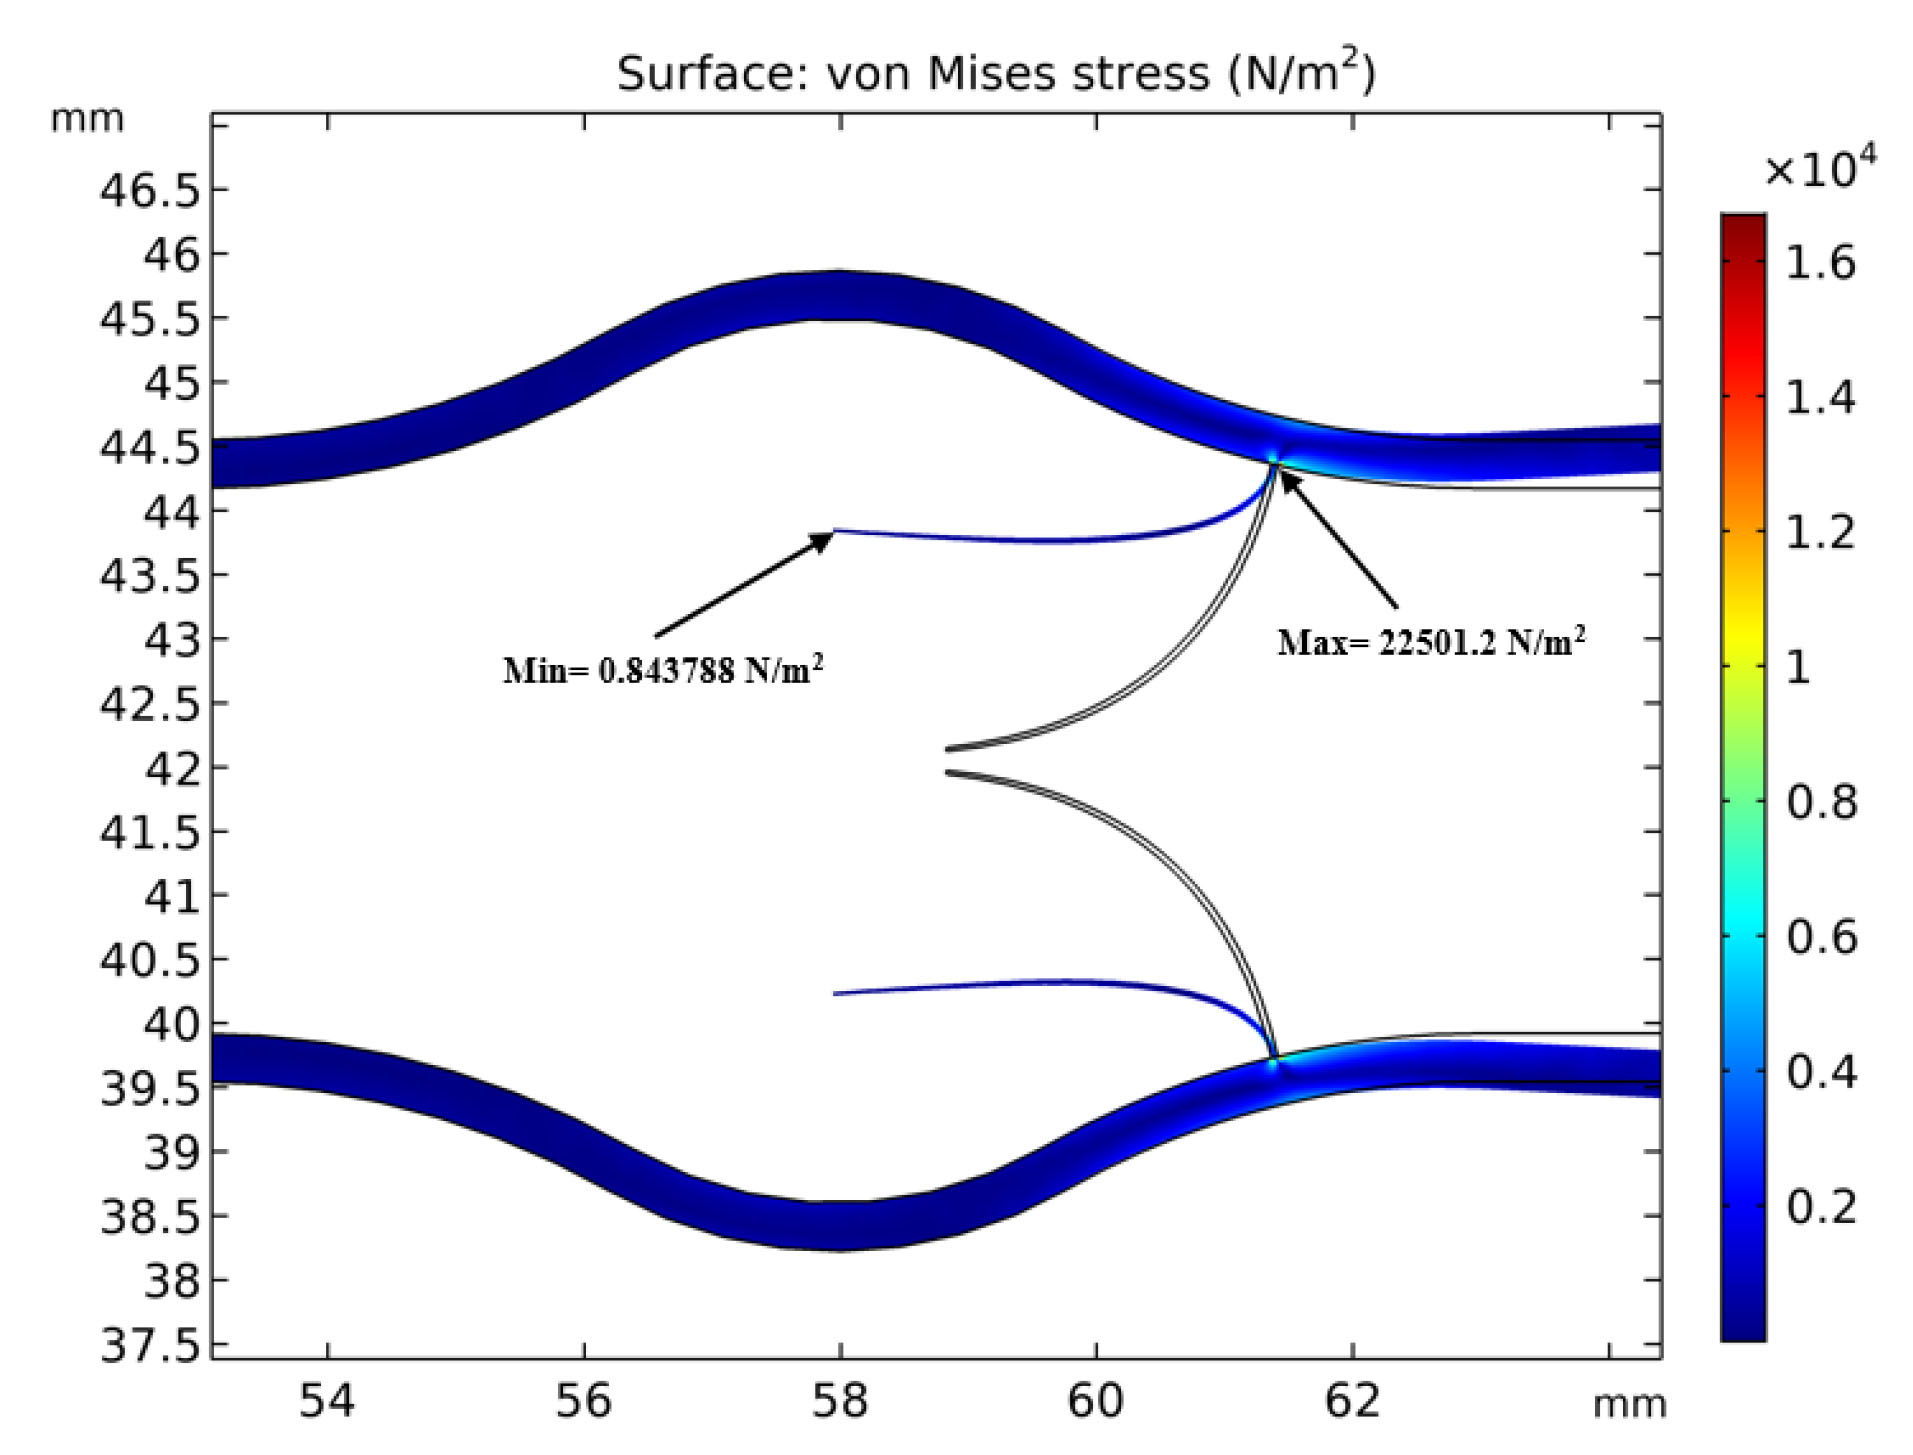
Fig. 10.
Maximum and minimum von Mises stress of the solid domain.
.
Maximum and minimum von Mises stress of the solid domain.
Discussion
As shown in Fig. 5, it is obvious that the velocity experiences its maximum value passing the valve and a minimum value near the walls. This is a result of the continuity equation which states that by decreasing the flow cross-section area the velocity increases and vice versa. Fig. 5 also shows the regions with very low velocities just behind the leaflets. This is because of trapped blood in these regions and the formation of reverse flow. There is a trapped blood region close to the connection point of the valve to the vein wall. Moving toward the valves tips, the blood velocity increases and two vortices are observable. The result is also consistent with the previous works of some researchers who reported the formation of two vortexes around the vein valves.
5-7
These regions have law shear stresses which have been linked to the formation of sediments. Low wall shear stresses as a result of blood stasis is a possible irritant for some diseases like endothelial activation.
9
The presence of these vortices prevents the valves to be fully opened and have contact with the vein wall.
15
Vortexes behind the valves play a significant role in the safety of the circulatory system. For example, reduced muscular pumping as a result of immobility or venous valve insufficiency can lead to low-speed flow and subsequent limitation of blood exchange within sinus pocket.
31
According to velocity magnitude at the centerline of the vein, shown in Fig. 7, the blood flow acquired a maximum velocity of 11.25 cm/s in the valve at t=1.31 s. This is in good agreement with obtained data of 11.1 cm/s by Doppler ultrasound velocimetry ( Fig. 3B). The close agreement between the numerical and experimental data showed the reliability of the numerical calculation of the present work.
According to Fig. 8 at the regions with lower shear stresses, clots may grow and disrupt the valves function.
32,33
On the other hand, separated clots of these regions can move by the blood flow toward the heartand cause subsequent diseases such as pulmonary embolism.
34
The shear stress gradually increases at sinus pocket and reaches a maximum amount distal to the valve. High shear stresses also may cause vein wall damage which is one of the significant reasons for thrombus formation and blood circulatory obstructions.
25
It is significant to study the mechanical stress of the venous wall and tissue for both its direct and long-term effects. Moreover, it can be contributed to the onset and progression of long-term damages on the venous system such as atherosclerosis.
25
Increased pressure applied by gravity as a result of venous valve insufficiency may cause blood accumulation and stasis, edema, inflammation, varicose veins, damage to the lymphatic system and skin, and venous ulcers.
35
The primary mechanism of venous valve incompetency is that the low-shear-stress regions in the pockets behind the leaflets might cause flow stagnation and propagation of venous diseases.
36
The von Mises stress or equivalent tensile stress is a scalar value that is calculated from the Cauchy stress tensor and is corresponding to the distortion energy. The von Mises stress is a useful criterion to predict plastic deformation and yielding of ductile materials under any loading condition. Venous valves work on a periodic condition and may experience consequent deformations or fatigue failure. Therefore it is useful to investigate the von Misses stress in the vein especially valve leaflets. According to Fig. 10, the maximum von Mises stress occurs at the connection point of venous valve to the wall while minimum von Mises stress occurs at the tip of the valve leaflet. Therefore, the vein is more probable to damage from the base.
Conclusion
Venous valves are a type of one-way valves which conduct blood flow toward the heart and prevent its backflow. In order to treat the diseases related to the venous system, it is needed to have detailed information about blood behavior through the veins. CFD is a useful tool for the investigation of blood flow behavior and obtain detailed information through the cardiovascular system. In the present work, the blood flow around a venous valve was studied considering the interaction of blood and the deformable venous valves leaflet regarding FSI. The obtained results showed that the blood velocity increased from inlet to the leaflets and again decreased passing the valve. A pair of vortices and trapped region were observed just behind the valves. These regions have low shear stresses which are capable of formation of sediments. The Von misses stress which is a criterion for yielding solid materials is obtained and it was observed that a maximum value occurred at the bottom of the leaflets.
Funding sources
There is no founding sources for the present work.
Ethical statement
There is none to be disclosed.
Competing interests
The authors declare that they have no known competing financial interests or personal relationships that could have appeared to influence the work reported in this paper.
Authors’ contribution
ZH: Numerical simulation, data analysis. FSM: Project administration, conceptualization. MV: Data validating, study consultation. SER: Technical advisor, reviewing. SM: Experimental design, Technical advisor.
Research Highlights
What is the current knowledge?
simple
-
√ Venous valves prevent the backward blood flow.
-
√ Sinus pockets regulate the flow around the valves.
-
√ Venus valve malfunction results in circulatory system disease.
What is new here?
simple
-
√ Flow around a vein valve is simulated numerically.
-
√ The regions of the highest stress are defined.
-
√ The flow vortices and low shear stress points which are at
the risk of blood clotting are defined.
References
-
Chandran KB, Yoganathan AP, Rittgers SE, Yoganathan AP, Rittgers SE. Biofluid mechanics The human circulation. Taylor & Francis; 2007. 10.1088/1751-8113/44/8/085201
-
Rubenstein DA, Yin W, Frame MD. Biofluid mechanics An introduction to fluid mechanics, macrocirculation, and microcirculation. 2nd ed. Oxford: Elsevier; 2012.
- Yilmaz F, Gundogdu MY. A critical review on blood flow in large arteries; relevance to blood rheology, viscosity models and physiologic conditions. Kore-Australia Rheol J 2008; 20:197-211. [ Google Scholar]
-
Noda N, Nakano M, Matsuura H, Nemoto T, Koide K. Numerical Analysis of Blood Flow in Vessels. First International Conference on Innovative Computing, Information and Control - Volume I (ICICIC'06); 30 August-1 September 2006; Beijing, China. 10.1109/ICICIC.2006.483
-
Tien WH, Chen HY , Berwick ZC, Krieger J, Chambers S, Dabiri D, et al. Role of Sinus in prosthetic Venous Valve. Elsevier; 2014. 10.1016/j.ejvs.2014.03.041
-
Yamaguchi T. Clinical Application of Computational Mechanics to the Cardiovascular System. In: Ohashi T, Liu H, Yamaguchi T. Computational Fluid Dynamic Simulation of the Flow through Venous Valve. Tokyo: Springer; 2000. p. 186–189. 10.1007/978-4-431-67921-9_18
- Narracott AJ, Keijsers JMT, Leguy CAD, Huberts W, Vosse FN van de. Fluid-structure interaction analysis of venous valve hemodynamics. In: 4th International Conference on Computational and Mathematical Biomedical Engineering 2015:31-34.
- Buescher CD, Nachiappan B, Brumbaugh JM, Hoo KA, Janssen HF. Experimental studies of the effects of abnormal venous valves on fluid flow. Biotechnol Prog 2005; 21:938-945. doi: 10.1021/bp049835u [Crossref] [ Google Scholar]
- Downie SP, Raynor SM, Firmin DN, Wood NB, Thom SA, Hughes AD. Effects of elastic compression stockings on wall shear stress in deep and superficial veins of the calf. Am J Physiol Heart Circ Physiol 2008; 294:H2112-20. doi: 10.1152/ajpheart.01302.2007 [Crossref] [ Google Scholar]
- Ariane M, Allouche MH, Bussone M, Giacosa F, Bernard F, Barigou M. Discrete multi-physics: A mesh-free model of blood flow in flexible biological valve including solid aggregate formation. PLoS One 2017; 12:e174795. doi: 10.1371/journal.pone.0174795 [Crossref] [ Google Scholar]
- Rohan CPY, Badel P, Lun B, Rastel D, Avril S. Biomechanical response of varicose veins to elastic compression: A numerical study. J Biomech 2013; 46:599-603. doi: 10.1016/j.jbiomech.2012.10.043 [Crossref] [ Google Scholar]
- Partsch B, Partsch H. Calf compression pressure required to achieve venous closure from supine to standing positions. J Vasc Surg 2005; 42:734-738. doi: 10.1016/j.jvs.2005.06.030 [Crossref] [ Google Scholar]
- Rohan PY, Badel P, Lun B, Rastel D, Avril S. Prediction of the Biomechanical Effects of Compression Therapy on Deep Veins Using Finite Element Modelling. Ann Biomed Eng 2015; 43:314-324. doi: 10.1007/s10439-014-1121-6 [Crossref] [ Google Scholar]
- Simakov S, Gamilov T, Soe YN. Computational study of blood flow in lower extremities under intense physical load. Russ J Numer Anal Math Model 2013; 28:485-503. doi: 10.1515/rnam-2013-0027 [Crossref] [ Google Scholar]
- Lurie F, Kistner RL, Eklof B, Kessler D. Mechanism of venous valve closure and role of the valve in circulation: A new concept. J Vasc Surg 2003; 38:955-961. doi: 10.1016/S0741-5214(03)00711-0 [Crossref] [ Google Scholar]
- Ariane M, Vigolo D, Brill A, Nash FGB, Barigou M, Alexiadis A. Using Discrete Multi-Physics for studying the dynamics of emboli in flexible venous valves. Comput Fluids 2018; 166:57-63. doi: 10.1016/j.compfluid.2018.01.037 [Crossref] [ Google Scholar]
- Wang Y, Pierce I, Gatehouse P, Wood N, Firmin D, Xu XY. Analysis of flow and wall shear stress in the peroneal veins under external compression based on real-time MR images. Med Eng Phys 2012; 34:17-27. doi: 10.1016/j.medengphy.2011.06.012 [Crossref] [ Google Scholar]
- Elabbasi N, Bathe K-J. On the reliable solution of contact problems in engineering design article. Eur Sci Ed 2012; 38:35-37. doi: 10.1023/B:MAMD.0000035458.72478.7a [Crossref] [ Google Scholar]
- Calandrini S, Aulisa E. Fluid-structure interaction simulations of venous valves: a monolithic ALE method for large structural displacements. Int J Numer Method Biomed Eng 2019; 35:e3156. doi: 10.1002/cnm.3156 [Crossref] [ Google Scholar]
- Wolinsky CD, Waldorf H. Chronic Venous Disease. Med Clin North Am 2009; 93:1333-1346. doi: 10.1016/j.mcna.2009.08.001 [Crossref] [ Google Scholar]
- Chen HY, Berwick Z, Krieger J, Chambers S. and tricuspid valve architectures. J Vasc Surg Venous Lymphat Disord 2014; 2:188-193 e1. doi: 10.1016/j.jvsv.2013.08.004 [Crossref] [ Google Scholar]
-
bt Aziz NS, bt Ibrahim N, Abdullah K, bt Mat Harun NHI. Computational fluid dynamics simulation on blood velocity and vorticity of venous valve behaviour. In: Ibrahim H, Iqbal S, Teoh SS, Mustaffa MT, eds. Lecture Notes in Electrical Engineering. Vol 398. Lecture Notes in Electrical Engineering. Singapore: Springer; 2017. p. 617–625. 10.1007/978-981-10-1721-6_67
-
Wijeratne NS, Hoo KA. Numerical studies on the hemodynamics in the human vein and venous valve. In: 2008 American Control Conference. IEEE; 2008. p. 147–152. 10.1109/ACC.2008.4586482
- Razaghi R, Karimi A, Rahmani S, Navidbakhsh M. A computational fluid-structure interaction model of the blood flow in the healthy and varicose saphenous vein. Vascular 2016; 24:254-263. doi: 10.1177/1708538115594095 [Crossref] [ Google Scholar]
- Simão M, Ferreira JM, Mora-Rodriguez J, Ramos HM. Identification of DVT diseases using numerical simulations. Med Biol Eng Comput 2016; 54:1591-609. doi: 10.1007/s11517-015-1446-9 [Crossref] [ Google Scholar]
- Zervides C, Narracott AJ, Lawford PV, Hose DR. The role of venous valves in pressure shielding. Biomed Eng Online 2008; 7:8. doi: 10.1186/1475-925X-7-8 [Crossref] [ Google Scholar]
-
Dokos S. Lecture Notes in Bioengineering Modelling Organs, Tissues, Cells and Devices Using MATLAB and COMSOL Multiphysics. Springer; 2017. 10.1007/978-3-642-54801-7
-
Chen HY, Zhu L, Huo Y, Liu Y, Kassab GS. Fluid-structure interaction (FSI) modeling in the cardiovascular system. In: Guccione JM, Kassab GS, Mark B, eds. Ratcliffe Computational Cardiovascular Mechanics. Springer; 2010. p. 141-157. 10.1007/978-1-4419-0730-1
-
White FM. Viscous Fluid Flow. 3rd ed. McGraw Hill; 2006.
-
Bower AF. Applied Mechanics of Solids. CRC Press; 2010.
- Elizondo P, Fogelson AL. A Mathematical Model of Venous Thrombosis Initiation. Biophys J 2016; 111:2722-2734. doi: 10.1016/j.bpj.2016.10.030 [Crossref] [ Google Scholar]
- Van Langevelde K, Šrámek A, Rosendaal FR. The Effect of aging on venous valves. Arterioscler Thromb Vasc Biol 2010; 30:2075-2080. doi: 10.1161/ATVBAHA.110.209049 [Crossref] [ Google Scholar]
- Ariane M, Wen W, Vigolo D, Brill A, Nash FGB, Barigou M. Modelling and simulation of flow and agglomeration in deep veins valves using discrete multiphysics. Comput Biol Med 2017; 89:96-103. doi: 10.1016/j.compbiomed.2017.07.020 [Crossref] [ Google Scholar]
-
Kasper D, Fauci A, Hauser S, Longo D, Jameson J L. Harrison’s Principles of Internal Medicine. 19th ed. McGraw-Hill; 2015.
- Huang HYS, Lu J. Biaxial mechanical properties of bovine jugular venous valve leaflet tissues. Biomech Model Mechanobiol 2017; 16:1911-23. doi: 10.1007/s10237-017-0927-1 [Crossref] [ Google Scholar]
- Liu X, Liu L. Effect of valve lesion on venous valve cycle: A modified immersed finite element modeling Pandolfi A (ed). PLoS One 2019; 14:e0213012. doi: 10.1371/journal.pone.0213012 [Crossref] [ Google Scholar]