Bioimpacts. 11(4):271-279.
doi: 10.34172/bi.2021.37
Original Research
GADP-align: A genetic algorithm and dynamic programming-based method for structural alignment of proteins
Soraya Mirzaei 1  , Jafar Razmara 1, * , Shahriar Lotfi 1
Author information:
1Department of Computer Science, Faculty of Mathematics, Statistics, and Computer Science, University of Tabriz, Tabriz, Iran
Abstract
Introduction:
Similarity analysis of protein structure is considered as a fundamental step to give insight into the relationships between proteins. The primary step in structural alignment is looking for the optimal correspondence between residues of two structures to optimize the scoring function. An exhaustive search for finding such a correspondence between two structures is intractable.
Methods:
In this paper, a hybrid method is proposed, namely GADP-align, for pairwise protein structure alignment. The proposed method looks for an optimal alignment using a hybrid method based on a genetic algorithm and an iterative dynamic programming technique. To this end, the method first creates an initial map of correspondence between secondary structure elements (SSEs) of two proteins. Then, a genetic algorithm combined with an iterative dynamic programming algorithm is employed to optimize the alignment.
Results:
The GADP-align algorithm was employed to align 10 ‘difficult to align’ protein pairs in order to evaluate its performance. The experimental study shows that the proposed hybrid method produces highly accurate alignments in comparison with the methods using exactly the dynamic programming technique. Furthermore, the proposed method prevents the local optimal traps caused by the unsuitable initial guess of the corresponding residues.
Conclusion:
The findings of this paper demonstrate that employing the genetic algorithm along with the dynamic programming technique yields highly accurate alignments between a protein pair by exploring the global alignment and avoiding trapping in local alignments.
Keywords: Bioinformatics, Protein structure alignment, Genetic algorithm, Dynamic programming
Copyright and License Information
© 2021 The Author(s)
This work is published by BioImpacts as an open access article distributed under the terms of the Creative Commons Attribution License (
http://creativecommons.org/licenses/by-nc/4.0/). Non-commercial uses of the work are permitted, provided the original work is properly cited.
Introduction
Structural alignment of proteins plays a fundamental role in understanding their functional similarity and evolutionary relationship. Generally, since protein structure is more conserved than protein sequence, structure comparison is more evident to identify high distantly proteins than sequence comparison. As a result, the prediction of the new protein’s function is carried out through the detection of local or global structural similarity between a new protein and a protein with a known function.
1
The methods are used to measure the structural similarity between two proteins and then produce a pairwise structural alignment between them.
Many algorithms have been developed to find the optimal structural alignment. These methods deal with two significant problems: a search algorithm for determining an optimal alignment between two structures and a scoring function to evaluate the created alignment.
2
The structural alignment problem can be formulated as a search algorithm for finding the optimal set of correspondences minimizing the spatial distance between pairs of residues.
3,4
The algorithm does not have any initial knowledge about correspondence between residues. Accordingly, the problem is computationally intractable and known as NP-hard.
5
Though many similarity scoring functions have been proposed in polynomial time.
6,7
no procedure (of any running time) has been proposed to optimize structural alignment.
8,9
Taylor and coworkers write: ‘In structure comparison, we do not even have an algorithm that guarantees an optimal answer for pairs of structures’.
10
Many efforts have been made to explore efficient pairwise structural alignment. In this regard, SSAP
11
employs a double dynamic programming technique based on atom-to-atom vectors in the structure space. SPalign
12
is another method for pairwise protein structure alignment based on SPscore as a size-independent scoring function to compare protein sequences. Alternatively, several methods use the distance geometry to represent each protein by a pairwise distance matrix between all Cα atoms. DALI
13
is a popular method that uses the Monte Carlo algorithm to obtain the optimal superposition of matrices. Other methods use additional heuristics to produce faster or more accurate alignment, such as CE.
14
MMLigne
15
uses statistical inference and CLICK
16
matches the clique of residues to find one-to-one equivalence residues. Several strategies have been proposed to optimize the previously obtained equivalence set further. These include the Monte Carlo algorithm or simulated annealing,
13
dynamic programming,
8
the incremental combinatorial extension of the optimal path,
14,17
and genetic algorithm.
18-20
Recently, the multi-criteria protein structure comparison tool is developed for combining methods and generating consensus structural similarity scores.
21
The tools additionally are used to generate the training set for a template-based protein structure prediction based on the threading strategy. These methods commonly employ machine learning techniques
22,23
for implementation of their proposed strategy. Recently, some approaches have been proposed to solve the protein classification problem based on two-dimensional multi-view images of the protein structure and learning methods.
32,33
Several methods use iterative dynamic programming over an initial map of corresponding residues to find a transformation and choose the final alignment after some heuristic iterations. STRUCTAL
24
uses five sets of equivalent residues, including start, middle, and end of a chain, sequence identity, and similar Ca torsion angles, to produce the final alignment based on the highest score. TM-align
9
obtains an initial alignment by aligning the secondary structures, and gapless or gapped matching of two structures. SPalign
25
uses similar heuristics as TM-align and gapless threading, secondary structure fitting, and fragment with 20 size matching are used as initial alignment. TS-AMIR
26
uses a text modeling-based technique to match secondary structure elements (SSEs) and then find the starting and ending residues of these elements as the initial alignment. These strategies for optimizing the initial correspondence would be impractical in some conditions like when sequence identity is low or when the SSEs have different sizes. In this paper, we introduce GADP-align as a hybrid algorithm for the optimal alignment of proteins by combining genetic algorithm with iterative dynamic programming technique. The genetic algorithm is a heuristic algorithm that is highly adaptable with dynamic programming. In the proposed method, in addition to the leading operators of genetic algorithm, we add the shift operator for enhancing the genetic algorithm’s global exploring along two protein chains. The main objective of combining these two optimization methods is to explore the global alignment and to avoid trapping in local alignment originated by improper initial alignment.
The paper is organized as follows. Section 2 describes the combination of GA with iterative dynamic programming algorithm in detail. Section 3 shows the evaluated genetic algorithm performance and makes a comparison between TM-align, MMLigne, SPalign, and CLICK methods. Section 4 concludes the proposed algorithm.
Materials and Methods
The GADP-align algorithm
The proposed GADP-align algorithm is introduced in this section. Fig. 1 represents the steps of the algorithm in summary. The algorithm first looks for a match between SSEs of two proteins to produce an initial match between their secondary structures. Then, the algorithm employs a procedure as shown in a flowchart to align two structures at the residue level.
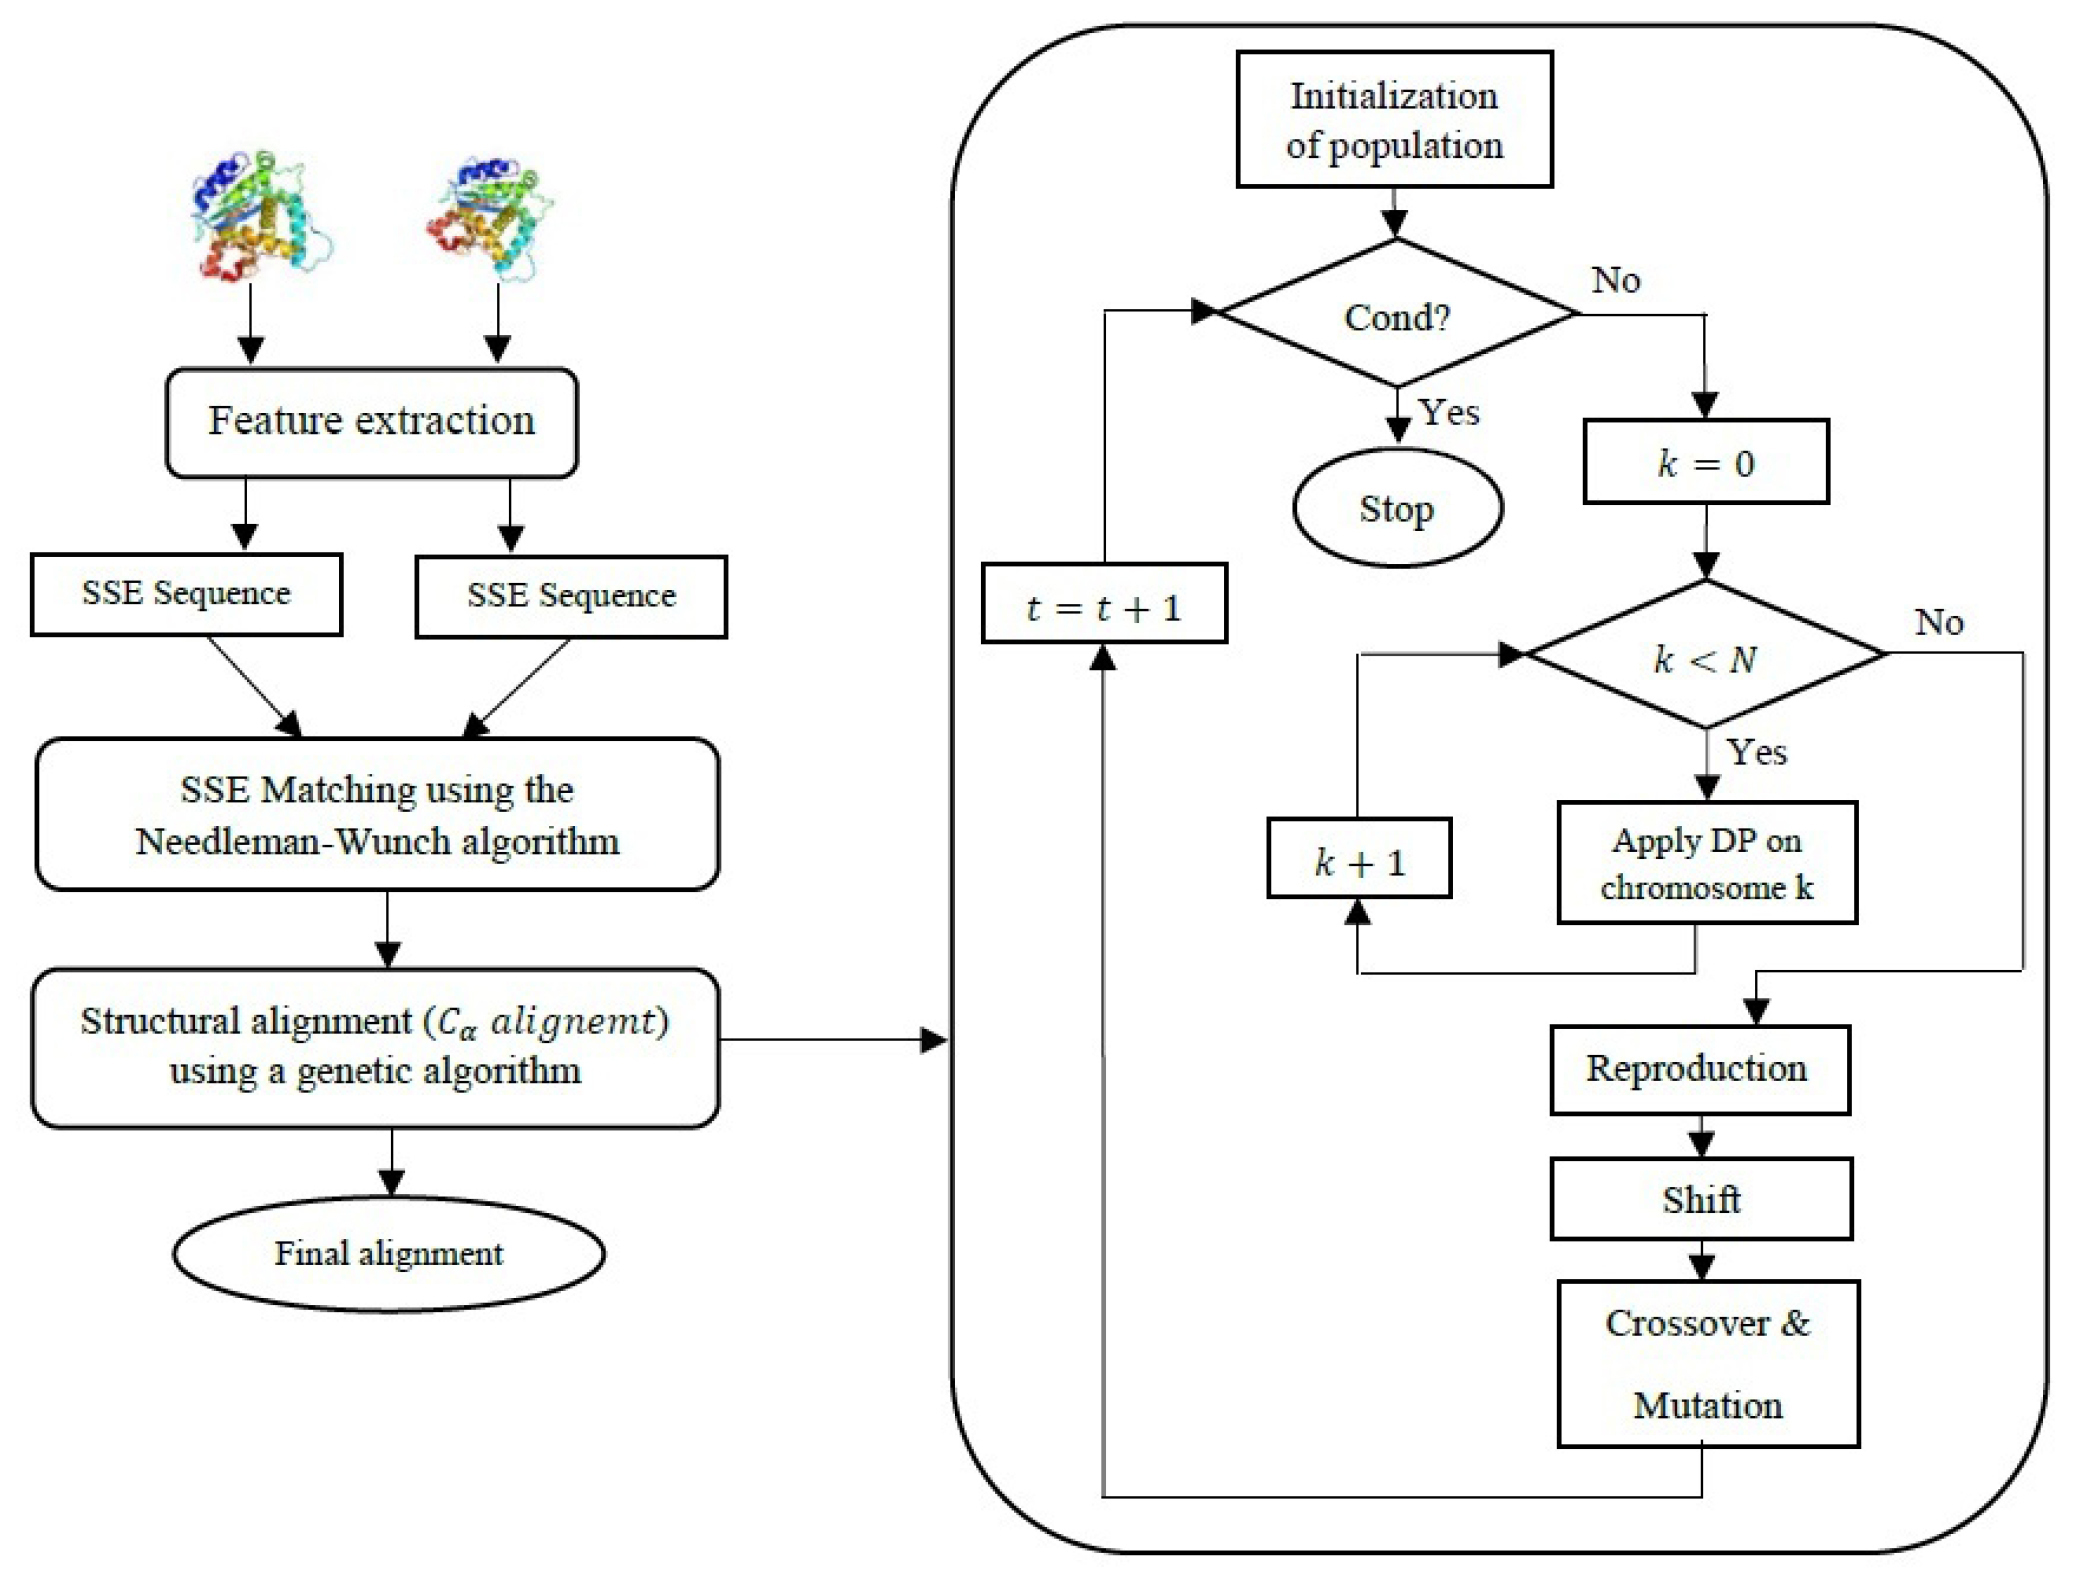
Fig. 1.
The GADP-align algorithm in summary.
.
The GADP-align algorithm in summary.
Matching of the SSE sequences
To find an initial corresponding element between the secondary structures of two proteins, the algorithm encodes each protein secondary structure in an SSE sequence including two letters of the alphabet (H for α-helix and S for β-strand). Then, it employs the Needleman-Wunsch dynamic programming algorithm
27
to create an initial correspondence between two sequences. The algorithm considers a score of +2 for identical SSEs and -1 for non-identical SSEs as well as a score of -2 for the gap-opening penalty. Then, the initial match is submitted to the genetic algorithm to search heuristically for initial corresponding residues within each matched SSEs.
The genetic algorithm
The algorithm starts with a set of chromosomes as the initial map of SSE matching. Fig. 2 represents the structure of a sample chromosome. Each chromosome contains a sequence of matched SSE pairs, and each pair is represented by the SSE type (0 for α-helix and 1 for β-stand), the number of corresponding residues within the SSE, and the list of their position along with the peptide. Coil and loop structures are highly irregular and are ignored in both protein structures. The population size was set to N=100 by default.
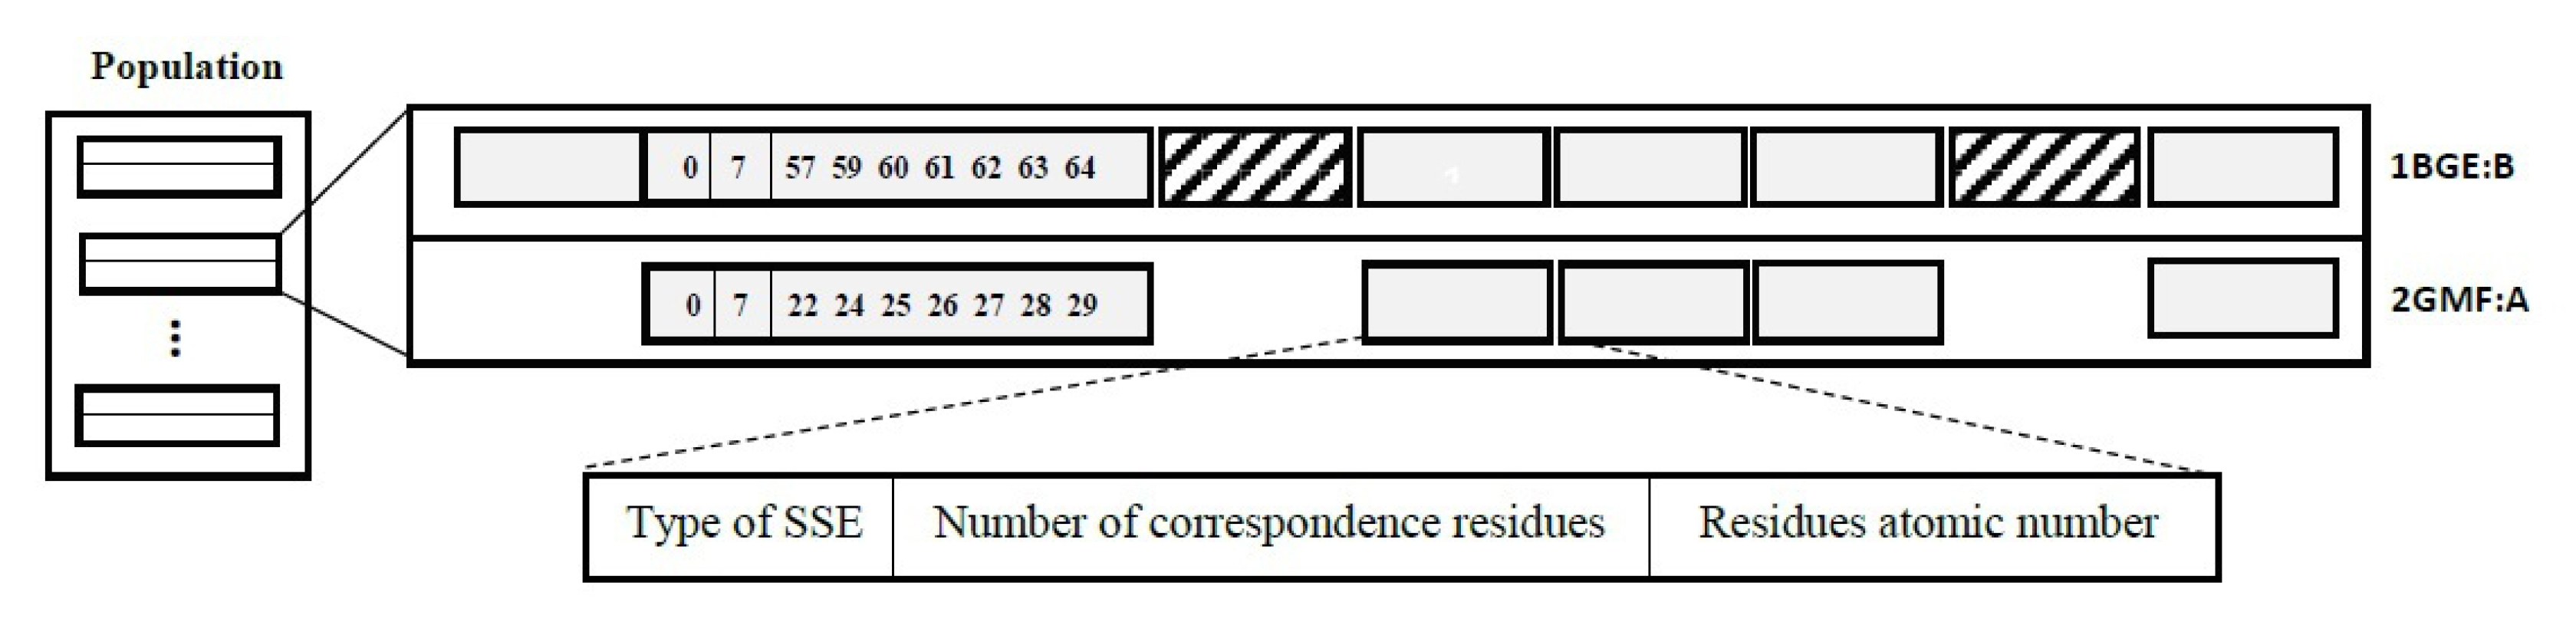
Fig. 2.
The structure of a sample chromosome for aligning 1BGE:B (HHHHH) and 2GMF:A (HHSHHHSH) proteins. The rectangles with diagonal lines represent α-helices and the rest boxes are β-strands. The first SSE of 2GMF:A protein is matched with the second SSE of 1BGE:B using the Needleman-Wunsch algorithm and seven residues are selected randomly as the initial correspondence of these matched SSEs.
.
The structure of a sample chromosome for aligning 1BGE:B (HHHHH) and 2GMF:A (HHSHHHSH) proteins. The rectangles with diagonal lines represent α-helices and the rest boxes are β-strands. The first SSE of 2GMF:A protein is matched with the second SSE of 1BGE:B using the Needleman-Wunsch algorithm and seven residues are selected randomly as the initial correspondence of these matched SSEs.
Initial population
To produce an initial population, the SSE sequences of two proteins are compared and matched using Needleman-Wunsch dynamic programming, and a set of chromosomes is defined based on pairs of matched SSEs. For each pair of matched SSEs in the individuals, an initial list of corresponding residues is randomly selected, ranging between 20% and 100% of the shorter SSE length.
Fitness function
For evaluating each alignment, the TM-Score is used via the formula
9
:
Where LTarget is the length of query protein which is the protein with a lower number of SSEs, Lali is the number of aligned residues, di is the distance between ith pair of aligned residues, and.
. It can be seen that the formula is independent of the protein size.
Selection strategy
The selection process chooses the high-fitness chromosome by using the tournament selection. This means that the chromosome with a higher fitness value has a higher probability of being placed in the intermediate population. The tournament selection randomly selects kindividuals through the substitution of the current population. The best chromosome having the highest score is entered into the middle population. Thisprocess is repeated N (=100)times. In the experiments, the value of kwas set to 3.
Crossover operator
The crossover operator is used to combine the genetic information of two individuals. In the proposed method, the crossover is done at two points along the chromosome with Pc=0.75 as the crossover probability. These two points are chosen randomly, and then, the first and third segments are swapped, as shown in Fig. 3.

Fig. 3.
The crossover operator. The SSEs alongside diagonal lines are swapped.
.
The crossover operator. The SSEs alongside diagonal lines are swapped.
Mutation operator
The mutation operator randomly mutates an individual. It allows the algorithm to search within the solution space and converge the population to the global maximum while it prevents the algorithm from falling into a local optimal trap. In the proposed method, the number of aligned residues within a pair of matched SSEs in the individual may be increased or decreased by 1 with Pm=0.04 as the mutation probability.
Shift operator
The procedure utilizes the shift operator to find an optimal matching between the SSE sequences of two proteins. The operator generates a new matching between SSEs and tries to converge to the global optimal matching instead of a local matching. For each individual in the population, the SSEs are shifted left or right with the shifting probability of Ps=0.45. Fig. 4 shows the shift operator for the proteins 3HHR and 1TEN PDB-ID, whereas the SSEs of 1TEN is shifted right or left along with the 3HHR protein.
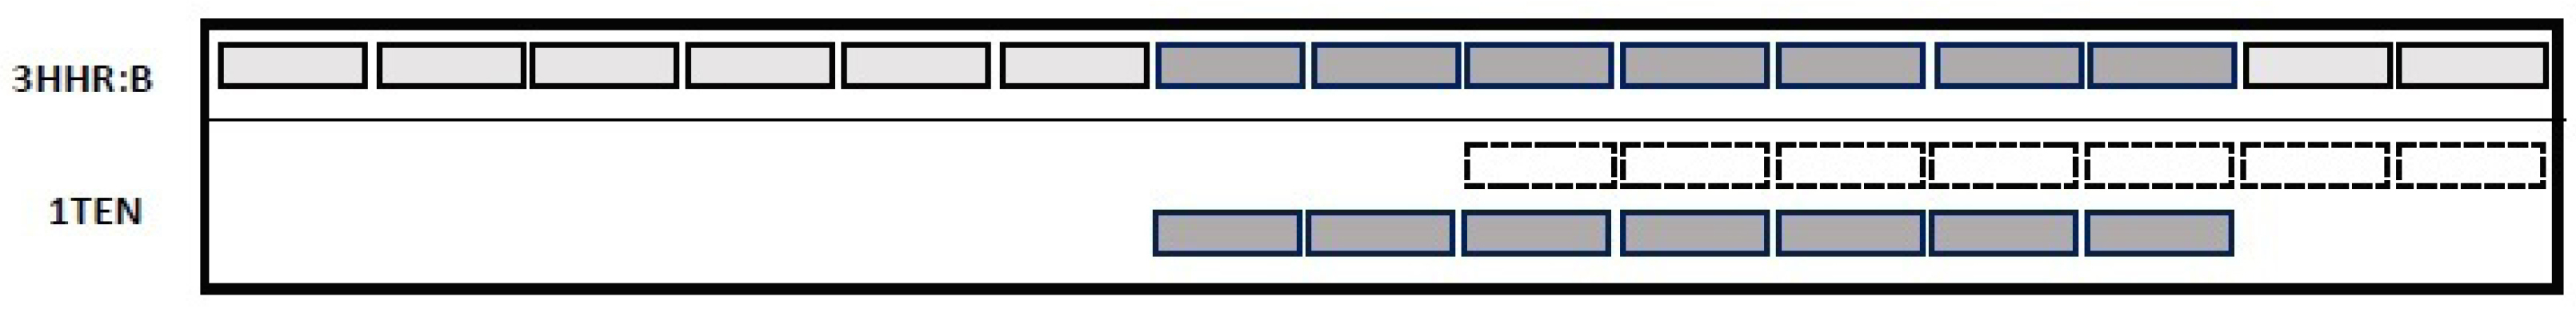
Fig. 4.
The shift operator. Dashed boxes represent the matched SSEs (before applying the shift operator). After two shifts to the left, a new SSE matching has been generated as represented in dark gray.
.
The shift operator. Dashed boxes represent the matched SSEs (before applying the shift operator). After two shifts to the left, a new SSE matching has been generated as represented in dark gray.
Replacement
The generational replacement strategy was used to replace the entire population of the current generation with the generated population after applying the crossover, mutation, and shift operations. To prevent missing the individual with the highest score, the best chromosome is passed to the next generation as an elitism.
Termination
Since the genetic algorithm is a random search approach, the algorithm does not generate an exact solution. Two different criteria were used for the termination of the algorithm. The first criterion is the unchanged maximum score (elitism) for 30 numbers of generation, and the second criterion is the termination of the algorithm after the production of 100 numbers of generation.
Dynamic programming
In each iteration, the algorithm submits the chromosome to a dynamic programming procedure to compute and apply the Kabsch rotation matrix.
28
As a result, a new alignment is created by running the dynamic programming on the score similarity matrix, which is defined as:
Eq. (2)
where dij is the distance of the i and j denote residues from the query and target proteins and
with Lmin is the length of the smaller protein. Furthermore, the gap opening penalty of dynamic programming is defined -0.6. Then, the new rotation matrix and score matrix are computed based on newly aligned residues. This procedure is repeated for n(=5) times to obtain the alignment with the highest score. Algorithm 1 shows the pseudo-code implemented for the above iterative dynamic programming algorithm.
Algorithm 1. Iterative dynamic programming
Input
: a chromosome
Output
: the alignment with the highest score
1: AR ←aligned residues in chromosome k
2: for i=1 to n do
3: Compute Kabsch rotation matrix based on AR
4: Rotate the target protein using the rotation matrix
5: Compute the score similarity matrix using formula 2
6: Run dynamic programming on the score similarity matrix
7: AR←new aligned residue pairs
8: end for
Results
The proposed method was implemented using the C++ programming language within visual studio 2013 on a personal computer having 2.60 GHz Core i5 and 6 GB RAM. The genetic algorithm was evaluated forits convergence and stability. The performance of the proposed method was examined on different datasets and compared with similar state-of-the-art methods, including TM-align, MMLigne, SPalign, and CLICK. In this section, the results have been presented and discussed.
Convergence analysis
The implemented genetic algorithm has been investigated for its convergence to an optimal or near-optimal solution. Fig. 5 represents the convergence graph drawn for three different protein pairs. In each graph, the highest fitness function values are shown by red curves, while the blue curves represent the average fitness values of the generations. As it can be seen from the figure, the fitness curves are swinging during iterations indicating that different initial correspondence causes different values of the scoring function.
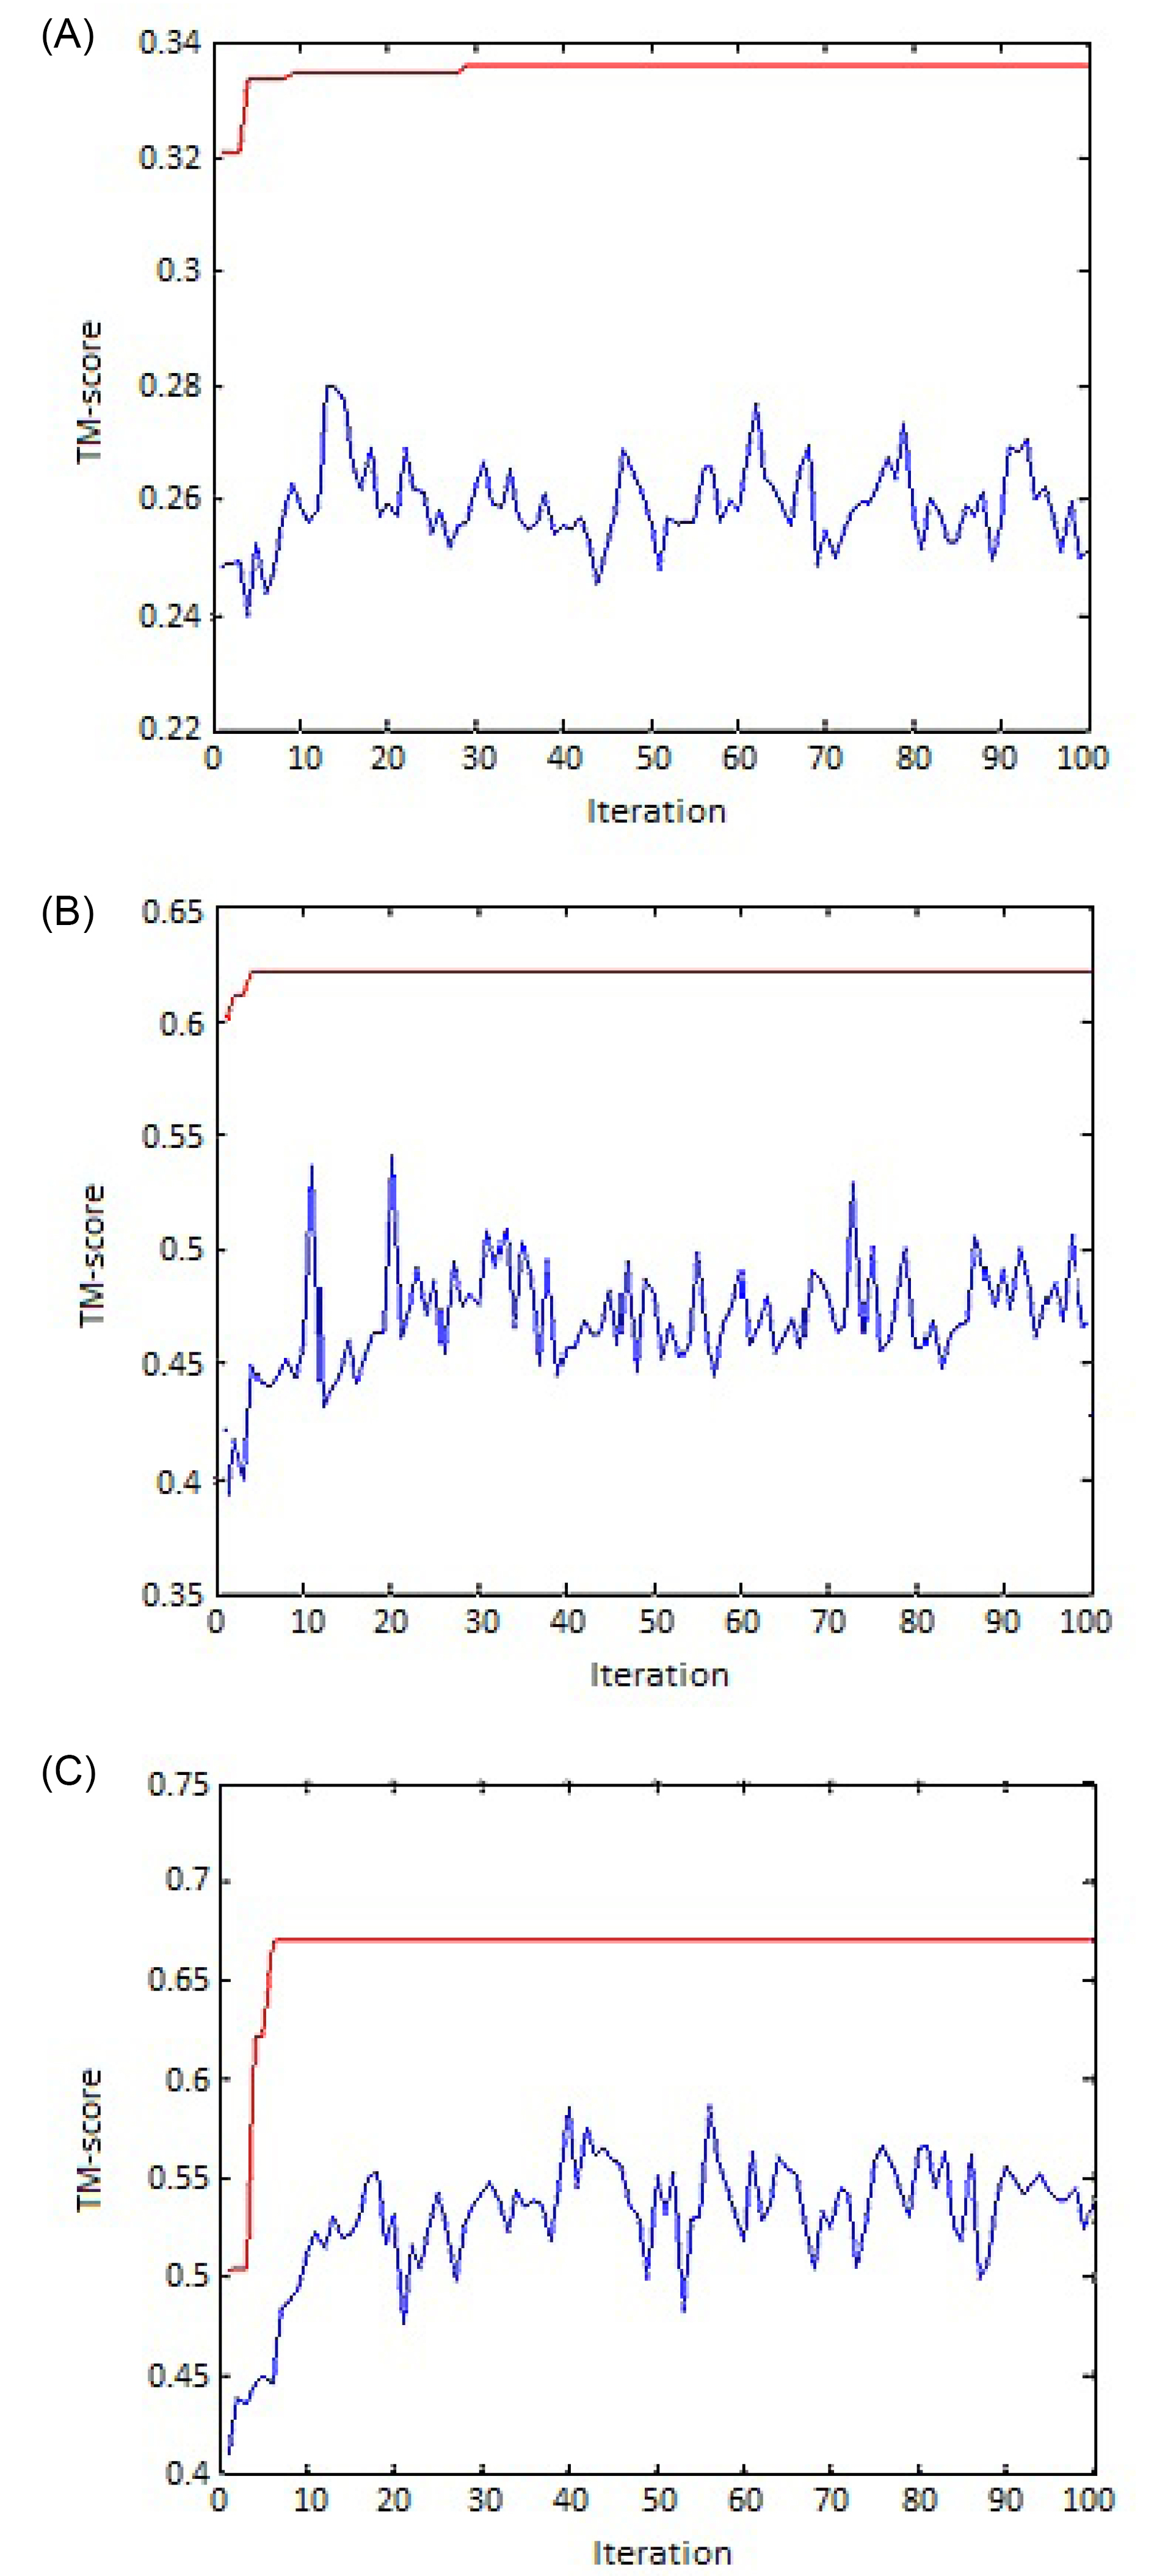
Fig. 5.
The convergence of the algorithm to an optimal solution for (A) 1A8Y & 1A81, (B) 2RHE & 3HLA:B, and (C) 2GMF:A & 1BGE:B. The blue swinging curve shows the average fitness of generations, and the red steps curve represents the best fitness value in the generation.
.
The convergence of the algorithm to an optimal solution for (A) 1A8Y & 1A81, (B) 2RHE & 3HLA:B, and (C) 2GMF:A & 1BGE:B. The blue swinging curve shows the average fitness of generations, and the red steps curve represents the best fitness value in the generation.
Stability analysis
Regarding that genetic algorithms are stochastic search methods, it is necessary to run the algorithm multiple times to examine its stability. A standard deviation of less than average concludes the stability of the algorithm. Fig. 6 shows the stability diagram for three different protein pairs. The TM-score for alignment of 2GMF:A & 1BGE:B is the same for all 20 runs. However, for 1TEN & 3HHR:B and 1A8Y & 1A81 pairs of proteins, the standard deviation differs for different runs. Additionally, for analyzing the stability and effectiveness of randomized algorithms like genetic algorithm, it is essential to use statistical tests such as t test and the Wilcoxon signed-rank test, which are parametric and non-parametric methods, respectively. If the data is approximately normally distributed, the t test would be more reliable to be used. However, the Wilcoxon signed-rank test does not assume the distribution of the data. We use Shapiro-Wilk and Kolmogorov-Smirnov test to assess whether the data is normal or not. Table 1 shows the Shapiro-Wilk and Kolmogorov-Smirnov normality tests obtained by the proposed method. From the results, both tests have a p-value lower than 0.05, which indicates data are not normally distributed. Thus, it is recommended to use a non-parametric statistical test method. The Wilcoxon signed-rank test is used to compare the average of two related samples and assess their difference. A null hypothesis Ho is typically defined to state that there is no median difference between pairs of samples and H1 is considered as an alternative hypothesis whether the median difference is not equal to zero. The P value of the statistical test denotes whether we accept Ho or not. The significant level of α=0.05 is considered for rejecting Ho. The last column in Table 1 shows the results of the Wilcoxon signed-rank test. The asymp. sig. (2-tailed) the value represents the P value of the test. The results indicate that the P value is better than the significance level α (0.05 by default). This observation reveals that there is no statistically significant difference between the first and second 15 runs of the genetic algorithms. As a result, the stability of the genetic algorithm is proven.
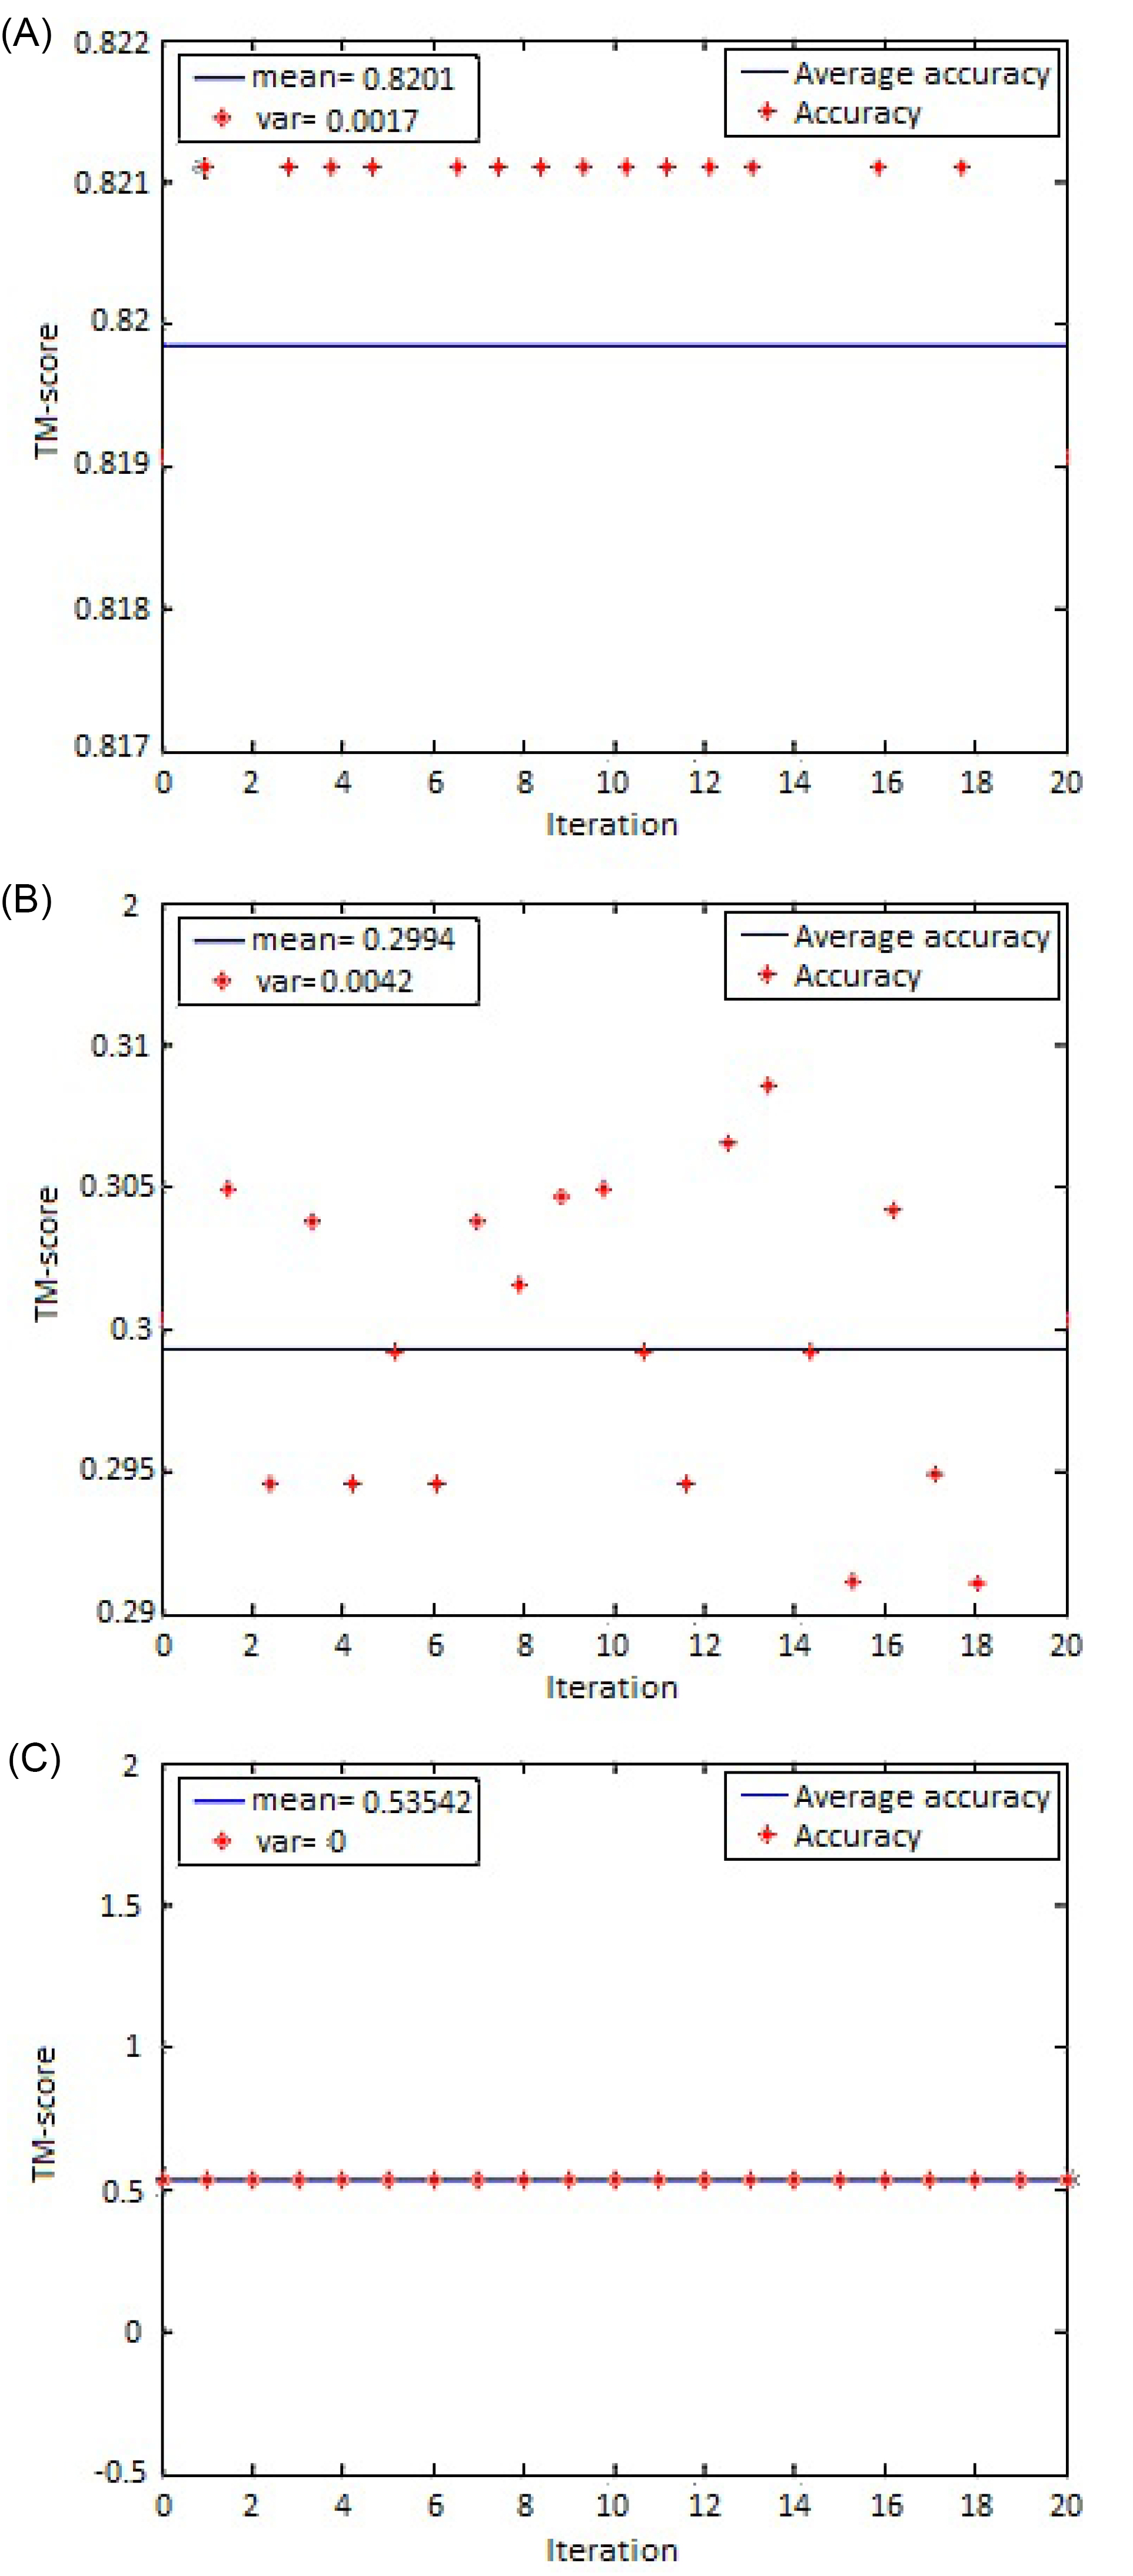
Fig. 6.
GADP-align stability diagram of (A) 1TEN & 3HHR:B, (B) 1A8Y & 1A81, and (C) 2GMF:A &1BGE:B
.
GADP-align stability diagram of (A) 1TEN & 3HHR:B, (B) 1A8Y & 1A81, and (C) 2GMF:A &1BGE:B
Table 1.
The results of the normality test of four instances in 30 runs of the genetic algorithm
|
Query Protein
|
Target Protein
|
Kolmogorov-Smirnov
|
Shapiro-Wilk
|
Wilcoxon signed-rank
|
|
Statistic
|
df*
|
Sig.
|
Statistic
|
df
|
Sig.
|
Z
|
Asymp. Sig (2 tailed)
|
| 3HHR |
1TEN |
0.389 |
30 |
0.000 |
0.624 |
30 |
0.000 |
-0.707 |
0.480 |
| 1A02 |
1A8Y |
0.211 |
30 |
0.002 |
0.859 |
30 |
0.001 |
-0.712 |
0.477 |
| 1ACZ |
1A81 |
0.194 |
30 |
0.005 |
0.811 |
30 |
0.000 |
-1.068 |
0.286 |
| 1A8Y |
1A81 |
0.249 |
30 |
0.000 |
0.812 |
30 |
0.000 |
-1.120 |
0.263 |
*df: The degree of freedom.
Experimental result
To evaluate the performance of the GADP-align algorithm, 10 ‘difficult to align’ protein pairs were used.
29
The results were compared with those of the TM-align algorithm as a state-of-the-art alignment method. In general, the quality of alignment depends on the contradictory necessities of earning a lower RMSD and a higher length of the alignment. TM-score is a reasonable particular score to evaluate the alignment quality by making a balance between the alignment length and its accuracy. As shown in Table 2, GADP-align yields a higher TM-score than TM-align in four cases among ten protein pairs. TM-align could not align significantly with two protein pairs, including 1TEN & 3HHR:B and 2RHE & 3HLA:B whereas the TM-score is less than the threshold of 0.5. This is while GADP-align produces a more significant alignment in terms of TM-score for these two protein pairs. Besides, the results of GADP-align were compared with those of TM-align, MMLigne, SPalign, and CLICK as four online structure alignment tools. Table 3 shows the results in terms of root mean square deviation (RMSD) and length of alignment (Nali). As shown in the table, the proposed method produces a higher length of alignment in all 10 cases than MMLigne, SPalign, and CLICK. The method also produces alignments better than or equal to those of TM-align for nine protein pairs in terms of length of the alignment.
Table 2.
Comparison of structure alignments for 10 ‘difficult’ structures obtained by TM-align and GADP-align methods
|
Query Protein
|
Target Protein
|
TM-align
|
GADP-align
|
|
TM-1
|
TM-2
|
TM-1
|
TM-2
|
| 1UBQ |
1FXI:A |
0.56841 |
0.4793 |
0.5864
|
0.49831
|
| 1TEN |
3HHR:B |
0.2685 |
0.16816 |
0.81947
|
0.40575
|
| 2RHE |
3HLA:B |
0.46138 |
0.23485 |
0.53542
|
0.48751
|
| 1PAZ |
2AZA:A |
0.55969 |
0.52731 |
0.55984
|
0.52735
|
| 1MOL:A |
1CEW:I |
0.68484 |
0.61127 |
0.68484 |
0.61127 |
| 2RHE |
1CID |
0.67452 |
0.46537 |
0.67452 |
0.46537 |
| 1EDE |
1CRL |
0.58509 |
0.36486 |
0.58509 |
0.36486 |
| 1NSB:A |
2SIM |
0.66308 |
0.67683 |
0.66247 |
0.67621 |
| 2GMF:A |
1BGE:B |
0.59183 |
0.48049 |
0.62034
|
0.50198
|
| 4FGF |
1TIE |
0.72732 |
0.56967 |
0.72732 |
0.56967 |
TM-1: TM-Score which is normalized by the length of Chain 1.
TM-2: TM-Score which is normalized by the length of Chain 2.
Table 3.
Comparison of structure alignments for 10 ‘difficult’ structures obtained by TM-align, MMLigner, SPalign, and CLICK methods
|
Query Protein
|
Target Protein
|
TM-align
9
|
MMLigner
15
|
SPalign
25
|
CLICK
16
|
GADP-align
|
|
RMSD
|
N
ali
|
RMSD
|
N
ali
|
RMSD
|
N
ali
|
RMSD
|
N
ali
|
RMSD
|
N
ali
|
| 1UBQ |
1FXI:A |
2.63 |
63 |
2.80077 |
57 |
2.48 |
62 |
1.91 |
58 |
2.63
|
63
|
| 1TEN |
3HHR:B |
5.14 |
51 |
1.65336 |
84 |
1.74
|
86
|
1.47 |
82 |
1.74
|
86
|
| 2RHE |
3HLA:B |
3.39 |
79 |
3.13553 |
79 |
2.73 |
77 |
2.22 |
66 |
3.68
|
86
|
| 1PAZ |
2AZA:A |
2.82 |
86 |
2.12664 |
77 |
2.39 |
83 |
1.92 |
79 |
3.00
|
87
|
| 1MOL:A |
1CEW:I |
2.25 |
82 |
1.91291 |
77 |
2.12 |
81 |
1.57 |
72 |
2.25
|
82
|
| 2RHE |
1CID |
2.90 |
100 |
2.50037 |
90 |
2.56 |
97 |
1.71 |
81 |
2.90
|
100
|
| 1EDE |
1CRL |
4.32 |
235 |
3.05788 |
161 |
2.86 |
202 |
2.32 |
213 |
4.32
|
235
|
| 1NSB:A |
2SIM |
3.82
|
312
|
2.80825 |
273 |
2.86 |
286 |
2.25 |
242 |
3.79 |
311 |
| 2GMF:A |
1BGE:B |
3.44 |
103 |
3.01005 |
96 |
2.70 |
94 |
1.89 |
76 |
3.80
|
110
|
| 4FGF |
1TIE |
2.82
|
117
|
2.73193 |
111 |
2.75 |
115 |
2.03 |
95 |
2.82
|
117
|
Regarding the low differences between the numbers of SSEs of protein pairs in the Fischer set, GADP-align has not remarkably produced different TM-score values except for two cases. Therefore, another experiment was organized using a set of 200 non-homologous protein chains, which were collected by Zhang and Skolnick.
9
Ten pairs of proteins were randomly chosen from the set and GADP-align as well as the above four alignment tools were employed for their alignment. The alignment results are represented in Table 4, including RMSD and the length of the alignment. Besides, the value of TM-Score was calculated for both GADP-align and TM-align methods. The results for GADP-align in Table 4 are the average values calculated based on ten runs of the developed genetic algorithm. As shown in Table 4, the alignment quality in terms of TM-score by GADP-align is higher than that of TM-align for three protein pairs, while both methods obtained a similar TM-score for four cases. In the case of non-homologous protein pair 1ACZ & 1A02N, the TM-Score value obtained by GADP-align (=0.27) is considerably lower than that of TM-align (=0.49 that is very near to similarity threshold of 0.5) indicating that GADP-align precisely identifies non-homologous proteins by using an appropriate initial correspondence map between a protein pair. From Table 4, it can be seen that the alignment quality in terms of RMSD and length of alignment by GADP-align is higher than MMLigne, SPalign, and CLICK methods for the non-homologous protein pairs.
Table 4.
Comparison of structure alignments of selecting randomly five proteins of a set of 200 non-homologous protein chains
|
Query Protein
|
Target Protein
|
MMLigner
15
|
SPalign
25
|
CLICK
16
|
TM-align
9
|
GADP-align
|
|
RMSD
|
N
ali
|
RMSD
|
N
ali
|
RMSD
|
N
ali
|
RMSD
|
N
ali
|
TM-score 1
|
RMSD
|
N
ali
|
TM-score 1
|
|
TM-score 2
|
TM-score 2
|
| 1A02:N |
1AOE:A |
2.05 |
22 |
4.26 |
67 |
2.25 |
102 |
5.75 |
108 |
0.23
0.30
|
5.54 |
111 |
0.26
0.33
|
| 1A81 |
1A8Y |
-
|
-
|
4.47 |
99 |
2.11 |
88 |
6.43 |
119 |
0.25
0.20
|
6.59 |
139 |
0.29
0.24
|
| 1A02:N |
1A81 |
-
|
-
|
4.71 |
90 |
2.38 |
137 |
6.20 |
124 |
0.26
0.27
|
6.22 |
125 |
0.26
0.28
|
| 1ACZ |
1A02:N |
3.52 |
79 |
3.01 |
76 |
2.39 |
122 |
3.29 |
79 |
0.49
0.23
|
5.49 |
114 |
0.27
0.16
|
| 1A81 |
1ACZ |
-
|
-
|
3.51 |
48 |
2.29 |
122 |
4.55 |
96 |
0.18
0.33
|
6.54 |
120 |
0.14
0.25
|
| 1ACZ |
1A8Y |
4.39 |
49 |
3.72 |
49 |
2.49 |
122 |
4.96 |
68 |
0.32
0.14
|
6.58 |
124 |
0.21
0.15
|
| 1ACZ |
1AOE:A |
1.73 |
23 |
3.69 |
52 |
2.43 |
110 |
5.42 |
67 |
0.28
0.19
|
6.23 |
120 |
0.32
0.15
|
| 1AOEA |
1A81 |
-
|
- |
3.79 |
71 |
2.41 |
84 |
5.33 |
105 |
0.32
0.26
|
5.53 |
106 |
0.31
0.25
|
| 1A8Y |
1A02:N |
-
|
-
|
4.12 |
92 |
2.34 |
124 |
6.06 |
123 |
0.23
0.26
|
6.52 |
131 |
0.23
0.26
|
| 1AOE:A |
1A8Y |
3.80 |
56 |
3.51 |
66 |
2.22 |
75 |
6.09 |
118 |
0.32
0.21
|
6.56 |
118 |
0.32
0.21
|
Nali: number of aligned residues, RMSD: root-mean-square deviation
TM-score 1:TM-Score which is normalized by length of Chain 1
TM-score 2: TM-Score which is normalized by length of Chain 2
Discussion
According to the previous comparative analysis,
30,31
conventional methods are not powerful enough for protein structure alignment. Despite the proposition of different methods based on effective biological insights, they mostly employ an unsuitable scoring scheme to assess the quality of alignment. The scoring schemes are commonly work based on two contradictory criteria including RMSD and the length of the alignment. TM-score makes a balance between these two scores in order to provide a reasonable measure for assessing the quality of alignment.
The analysis of the experimental results conducted in this study indicates the effectiveness of the GADP-align method for protein structure alignment. The overall results show the method aligns difficult to align pairs of proteins with a quality better than or equal to other state-of-the-art tools. In addition, examining the methods on a set of 200 non-homologous protein chains demonstrates the high applicability of the method in comparison with other similar tools.
GADP-align combines the advantages of the global exploring ability of the genetic algorithms and fast convergence mechanism of dynamic programming. This combination makes the method free from the typical requirement of the user-supplied initial guess to achieve the optimal alignment. In this way, the method automatically generates a set of initial residue-residue equivalences using a genetic algorithm, and then, searches between sets of residue-residue correspondence maximizing the scoring function. Furthermore, the method iteratively looks for alternative SSE matching instead of relying on the SSE matching initially produced by the Needleman-Wunsch algorithm. GADP-align looks for the optimal alignment of residues within the matched SSEs through a procedure of randomly choosing the aligned residues. The results in Table 4 depict that the methods, which exclusively use the iterative dynamic programming algorithm with an arbitrary initial alignment, converge to the nearest local minimum RMSD.
Conclusion
The developed genetic algorithm utilizes the novel shift operator, particularly in structures with high differences in size to avoid trapping of the search in a local optimal score. Besides, the results demonstrate that a relevant initial guess of corresponding residues is essential to obtain alignment with a high score. Since the protein structure alignment is a discrete optimization problem, other efficient evolutionary algorithms which are suitable for discrete optimization can be employed instead of genetic algorithms.
Funding sources
None.
Ethical statement
The authors declare no ethical issue to be considered.
Competing interests
The authors declare no conflicts of interest.
Authors’ contribution
SM, JR, SL: conceptualization, writing and reviewing; SM, JR; data handling; SM, JR, SL: experiments design; SM, JR: data analysis; SM, JR, SL: provision of study materials and equipment; SM, JR, SL: study validation; SM: data presentation and draft preparation; JR: supervision and project administration; SL: study consultation.
Research Highlights
What is the current knowledge?
simple
-
√ Three-dimensional structure of query and target proteins
-
√ Optimization by dynamic programming approach
-
√ Optimization by genetic algorithms
What is new here?
simple
-
√ Combining genetic algorithm and dynamic programming helps to explore the global alignment and avoid trapping in local alignments
-
√ The shift operator helps to find an optimal matching between the secondary structure elements.
References
- Roy A, Yang J, Zhang Y. COFACTOR: an accurate comparative algorithm for structure-based protein function annotation. Nucleic Acids Res 2012; 40:W471-7. doi: 10.1093/nar/gks372 [Crossref] [ Google Scholar]
- Joung I, Kim JY, Joo K, Lee J. Non-sequential protein structure alignment by conformational space annealing and local refinement. PLoS One 2019; 14:e0210177. doi: 10.1371/journal.pone.0210177 [Crossref] [ Google Scholar]
- Razmara J, Deris SB. A novel text modelling approach for structural comparison and alignment of biomolecules. WSEAS Transactions on Computers 2010; 9:675-85. [ Google Scholar]
- Aslam N, Nadeem A, Babar ME, Pervez MT, Aslam M, Naveed N. The accuracy of protein structure alignment servers. Electronic Journal of Biotechnology 2016; 20:9-13. doi: 10.1016/j.ejbt.2016.01.005 [Crossref] [ Google Scholar]
- Godzik A. The structural alignment between two proteins: is there a unique answer?. PROTEIN SCI 1996; 5:1325-38. doi: 10.1002/pro.5560050711 [Crossref] [ Google Scholar]
- Kolodny R, Linial N. Approximate protein structural alignment in polynomial time. Proc Natl Acad Sci U S A 2004; 101:12201-6. doi: 10.1073/pnas.0404383101 [Crossref] [ Google Scholar]
- Xu J, Jiao F, Berger B. A parameterized algorithm for protein structure alignment. J Comput Biol 2007; 14:564-77. doi: 10.1089/cmb.2007.R003 [Crossref] [ Google Scholar]
- Poleksic A. Algorithms for optimal protein structure alignment. Bioinformatics 2009; 25:2751-6. doi: 10.1093/bioinformatics/btp530 [Crossref] [ Google Scholar]
- Zhang Y, Skolnick J. TM-align: a protein structure alignment algorithm based on the TM-score. Nucleic Acids Res 2005; 33:2302-9. doi: 10.1093/nar/gki524 [Crossref] [ Google Scholar]
- Eidhammer I, Jonassen I, Taylor WR. Structure comparison and structure patterns. J Comput Biol 2000; 7:685-716. doi: 10.1089/106652701446152 [Crossref] [ Google Scholar]
- Taylor WR, Flores TP, Orengo CA. Multiple protein structure alignment. Protein Science 1994; 3:1858-70. doi: 10.1002/pro.5560031025 [Crossref] [ Google Scholar]
- Yang Y, Zhan J, Zhao H, Zhou Y. A new size-independent score for pairwise protein structure alignment and its application to structure classification and nucleic-acid binding prediction. Proteins 2012; 80:2080-8. doi: 10.1002/prot.24100 [Crossref] [ Google Scholar]
- Holm L, Sander C. Protein structure comparison by alignment of distance matrices. J Mol Biol 1993; 233:123-38. doi: 10.1006/jmbi.1993.1489 [Crossref] [ Google Scholar]
- Shindyalov IN, Bourne PE. Protein structure alignment by incremental combinatorial extension (CE) of the optimal path. Protein Eng 1998; 11:739-47. doi: 10.1093/protein/11.9.739 [Crossref] [ Google Scholar]
- Collier JH, Allison L, Lesk AM, Stuckey PJ, Garcia de la Banda M, Konagurthu AS. Statistical inference of protein structural alignments using information and compression. Bioinformatics 2017; 33:1005-13. doi: 10.1093/bioinformatics/btw757 [Crossref] [ Google Scholar]
- Nguyen MN, Tan KP, Madhusudhan MS. CLICK--topology-independent comparison of biomolecular 3D structures. Nucleic Acids Res 2011; 39:W24-8. doi: 10.1093/nar/gkr393 [Crossref] [ Google Scholar]
- Razmara J, Deris S, Parvizpour S. A rapid protein structure alignment algorithm based on a text modeling technique. Bioinformation 2011; 6:344. doi: 10.6026/97320630006344 [Crossref] [ Google Scholar]
- Kolbeck B, May P, Schmidt-Goenner T, Steinke T, Knapp E-W. Connectivity independent protein-structure alignment: a hierarchical approach. BMC Bioinformatics 2006; 7:510. doi: 10.1186/1471-2105-7-510 [Crossref] [ Google Scholar]
- Guerler A, Knapp EW. Novel protein folds and their nonsequential structural analogs. Protein Sci 2008; 17:1374-82. doi: 10.1110/ps.035469.108 [Crossref] [ Google Scholar]
- Szustakowski JD, Weng Z. Protein structure alignment using a genetic algorithm. Proteins 2000; 38:428-40. doi: 10.1002/(sici)1097-0134 [Crossref] [ Google Scholar]
- Sharma A, Manolakos ES. Multi-criteria protein structure comparison and structural similarities analysis using pyMCPSC. PloS one 2018; 13:e0204587. doi: 10.1371/journal.pone.0204587 [Crossref] [ Google Scholar]
- Ma J, Peng J, Wang S, Xu J. A conditional neural fields model for protein threading. Bioinformatics 2012; 28:i59-66. doi: 10.1093/bioinformatics/bts213 [Crossref] [ Google Scholar]
- Ma J, Wang S, Zhao F, Xu J. Protein threading using context-specific alignment potential. Bioinformatics 2013; 29:i257-i65. doi: 10.1093/bioinformatics/btt210 [Crossref] [ Google Scholar]
- Subbiah S, Laurents D, Levitt M. Structural similarity of DNA-binding domains of bacteriophage repressors and the globin core. CURR BIOL 1993; 3:141-8. doi: 10.1016/0960-9822(93)90255-m [Crossref] [ Google Scholar]
- Yang Y, Zhan J, Zhao H, Zhou Y. A new size‐independent score for pairwise protein structure alignment and its application to structure classification and nucleic‐acid binding prediction. Proteins 2012; 80:2080-8. doi: 10.1002/prot.24100 [Crossref] [ Google Scholar]
- Razmara J, Deris S, Parvizpour S. TS-AMIR: a topology string alignment method for intensive rapid protein structure comparison. Algorithm Mol Biol 2012; 7:4. doi: 10.1186/1748-7188-7-4 [Crossref] [ Google Scholar]
- Needleman SB, Wunsch CD. A general method applicable to the search for similarities in the amino acid sequence of two proteins. J Mol Biol 1970; 48:443-53. doi: 10.1016/0022-2836(70)90057-4 [Crossref] [ Google Scholar]
- Kabsch W. A discussion of the solution for the best rotation to relate two sets of vectors. Acta Cryst 1978; 34:827-8. doi: 10.1107/S0567739478001680 [Crossref] [ Google Scholar]
- Fischer D, Elofsson A, Rice D, Eisenberg D. Assessing the performance of fold recognition methods by means of a comprehensive benchmark. Pac Symp Biocomput 1996:300-18.
- Ma J, Wang S. Algorithms, applications, and challenges of protein structure alignment. Adv Protein Chem Struct Biol 2014; 94:121-75. doi: 10.1016/B978-0-12-800168-4.00005-6 [Crossref] [ Google Scholar]
- Slater AW, Castellanos JI, Sippl MJ, Melo F. Towards the development of standardized methods for comparison, ranking and evaluation of structure alignments. Bioinformation 2013; 29:47-53. doi: 10.1093/bioinformatics/bts600 [Crossref] [ Google Scholar]
- Suryanto CH, Saigo H, Fukui K. Structural class classification of 3d protein structure based on multi-view 2d images. IEEE/ACM transactions on computational biology and bioinformatics 2016; 15:286-99. [ Google Scholar]
- Nanni L, Lumini A, Pasquali F, Brahnam S. iProStruct2D: Identifying protein structural classes by deep learning via 2D representations. Expert Systems with Applications 2020; 142:113019. [ Google Scholar]