Bioimpacts. 13(2):109-121.
doi: 10.34172/bi.2022.23383
Original Article
Mode of binding, kinetic and thermodynamic properties of a lipid-like drug (Fingolimod) interacting with Human Serum Albumin
Samira Gholizadeh Investigation, Resources, Writing – original draft, 1 
Hossein Haghaei Formal analysis, Investigation, Resources, 2
Hosna Karami Investigation, Resources, Visualization, 1
Somaieh Soltani Conceptualization, Formal analysis, Funding acquisition, Methodology, Supervision, Writing – original draft, Writing – review & editing, 3, 4, *
Mostafa Zakariazadeh Formal analysis, Resources, Visualization, Writing – review & editing, 5
Javad Shokri Conceptualization, Writing – review & editing, 3
Author information:
1Pharmaceutical Analysis Research Center, Tabriz University of Medical Sciences, Tabriz, Iran
2Faculty of Nutrition and Food Sciences, Tabriz University of Medical Sciences, Tabriz, Iran
3Pharmacy Faculty, Tabriz University of Medical Sciences, Tabriz, Iran
4Drug Applied Research Center, Tabriz University of Medical Sciences, Tabriz, Iran
5Departement of Biology, Faculty of Sciences, Payame Noor University, PO.box 19395-3697, Tehran, Iran
Abstract
Introduction:
Fingolimod is a drug that is used to treat multiple sclerosis (MS). It has pH-dependent solubility and low solubility when buffering agents are present. Multi-spectroscopic and molecular modeling methods were used to investigate the molecular mechanism of Fingolimod interaction with human serum albumin (HSA), and the resulting data were fitted to the appropriate models to investigate the molecular mechanism of interaction, binding constant, and thermodynamic properties.
Methods:
The interaction of Fingolimod with HSA was investigated in a NaCl aqueous solution (0.1 mM). The working solutions had a pH of 6.5. Data was collected using UV-vis, fluorescence quenching titrations, FTIR, and molecular modeling methods.
Results:
According to the results of the fluorescence quenching titrations, the quenching mechanism is static. The apparent binding constant value (KA = 4.26×10³) showed that Fingolimod is a moderate HSA binder. The reduction of the KA at higher temperatures could be a result of protein unfolding. Hydrogen bonding and van der Waals interactions are the main contributors to Fingolimod-HSA complex formation. FTIR and CD characterizations suggested a slight decrease in the α-helix and β-sheets of the secondary structure of HSA due to Fingolimod binding. Fingolimod binds to the binding site II, while a smaller tendency to the binding site I was observed as well. The results of the site marker competitive experiment and the thermodynamic studies agreed with the results of the molecular docking.
Conclusion:
The pharmacokinetic properties of fingolimod can be influenced by its HSA binding. In addition, considering its mild interaction, site II binding drugs are likely to compete. The methodology described here may be used to investigate the molecular mechanism of HSA interaction with lipid-like drugs with low aqueous solubility or pH-dependent solubility.
Keywords: Human serum albumin, Fingolimod, Spectroscopic Techniques, Molecular modeling, pH-dependent solubility, Lipid-like drug
Copyright and License Information
© 2023 The Author(s).
This work is published by BioImpacts as an open access article distributed under the terms of the Creative Commons Attribution Non-Commercial License (
http://creativecommons.org/licenses/by-nc/4.0/). Non-commercial uses of the work are permitted, provided the original work is properly cited.
Introduction
Human serum albumin (HSA) is a 66.5 KD globular protein that spreads in the human blood and extracellular fluid. Due to the high concentration of HSA in plasma and its high binding affinity to small molecules (e.g., drugs), HSA-drug binding is an important factor in designing and developing new drugs.
Beyond HSA’s physiologic functions and its impact on drug ADMET (absorption, distribution. metabolism, excretion, toxicity),1 characteristic such as high drug-binding capacity and plasma half-life (∼19 days) provides ideal facilities for the production of stable bio-therapeutics with improved pharmacokinetic and efficacy.2 Investigation of ligand binding to the HSA, interference of fatty acids (FAs) and other endogenous compounds with ligands, and ligand displacement3 provide fundamental knowledge that could clarify drug pharmacokinetic properties as well as HSA bioconjugation properties in vitro or in vivo.4-6 Different approaches may be used to examine ligand-induced changes in HSA conformation and esterase-like behavior.7-9 Such information help researchers better understand the relationship between drug structure and HSA binding. There are several drug binding sites on HSA, according to reported molecular structures of HSA–ligand complexes.6,10-12 In vivo non-covalent HSA targeting is one of the recent approaches for drug delivery which can be rationalized using available information about the HSA-drug binding molecular mechanisms.13
At pH 4.3–8.0, HSA takes on a neutral, heart-shaped form, and from pH 7 to pH 9.0, it transitions from neutral to base form.3 HSA includes three globular domains (I-III), in which each domain is divided into two subdomains, A and B (Fig. 1). The major drug binding sites are site I (Sudlow I) and site II (Sudlow II) (Fig. 1). These sites are composed of distinct hydrophobic pockets with a rigid and stable three-dimensional structure. The main driving forces of HSA conformational stability are 17 S-S bonds.15
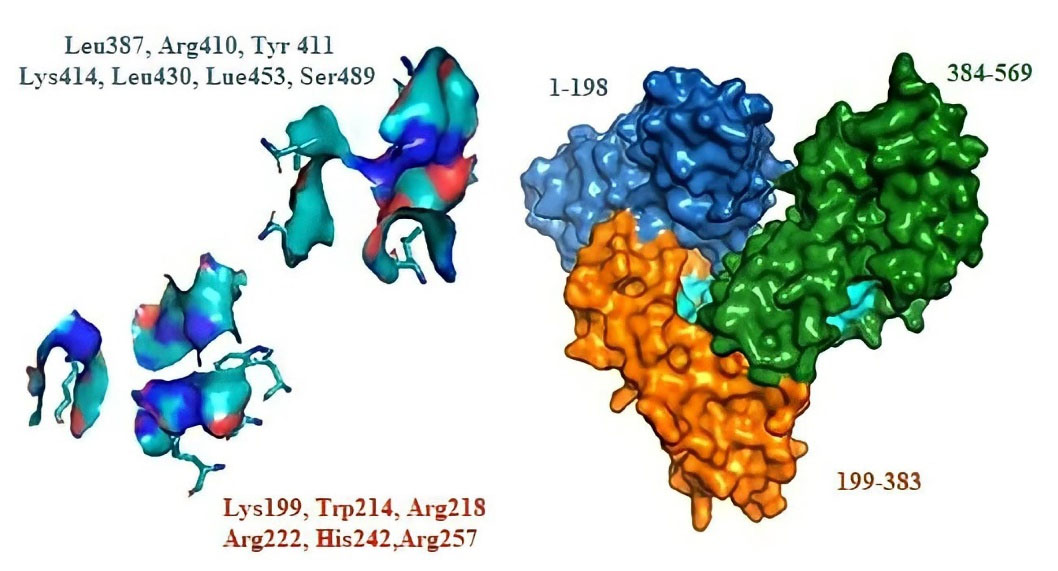
Fig. 1.
2D-structure of Fingolimod, 3D-structure of HSA and the main ligand-binding sites.
.
2D-structure of Fingolimod, 3D-structure of HSA and the main ligand-binding sites.
HSA contains only one tryptophan amino acid (Trp214), while there are other amino acids containing amino or carboxylic functional groups that make the HSA capable of buffering the blood pH. Moreover, these functional groups make HSA stable against denaturing agents and conditions and enable it to bind a large variety of small molecules.16 The binding site I (warfarin binding site) is located in the hydrophobic cavity of the subdomain IIA. The interior environment of the subdomains IIA is mostly polar, but it contains polar residues (e.g., arginine) at the bottom and near the entrance.13 These characteristics, along with the larger size of site I in comparison to site II, make it favorable for the bulky heterocyclic anions or the negatively charged molecules that contain a lipophilic aromatic structure in the middle.2,5,14,17,18 A polar patch is located near one side of the binding site II (located in subdomain IIIA) entrance, and a cationic amino acid is located near the surface.13 Accordingly, site II is preferred by lipophilic (e.g. aromatic) carboxylate derivatives with an extended conformation. Although there is one positive center on the surface of site II, the availability of a negative charge is not necessary for site II binders.5,14,17,18 One of the main endogenous binders of HSA is FA molecules. Multiple binding sites were found for FAs. It is suggested that the binding of long-chain fatty acids to albumin alters its ligand-binding properties.11 FAs possess poor aqueous solubility. Binding to HSA modulates their solubility and enables their transportation in the body. Some drugs are structurally similar to the FAs, and HSA binding is one of the main factors for the efficacy improvement of those drugs. The application of HSA as a modulator for low soluble drug molecules has been of interest in recent years.19 Also, HSA conjugation has been applied for the development of long-acting and more stable therapeutics.19 Due to incompatibility with salts and buffering agents, some drug molecules have low aqueous solubility, pH-dependent solubility, or weak solubility. Investigation of such drugs' HSA-binding will add to the knowledge required for proper formulation and pharmacokinetic study and improvement. Fingolimod (Gilenya, FTY 720) (Fig. 1) is a chemical derivative of sphingosine. It is oral multiple sclerosis (MS) drug. Fingolimod is a sphingosine-1 phosphate receptor modulator. It stops T-cells from going to sites of inflammation by lowering the expression of the sphingosine-1 phosphate receptor on T-cells.20 Fingolimod is incompatible with many excipients, such as buffering agents, in which it is practically insoluble in phosphate buffer.21 Fingolimod hydrochloride is soluble in water (more than 100 mg/mL) at 25°C and 37°C.21 Fingolimod is a weakly basic drug (pKa 7.8). Its solubility is decreased by the pH enhancement from acidic pH to neutral or alkaline pH.22,23 In addition to the solubility, the variation in ionization of drugs has a significant impact on their pharmacokinetic properties.24
Techniques with the capability of real-time monitoring of interaction between two molecules are more interested in protein binding investigations.25 HSA interaction with small molecules has been studied frequently using a multi-spectroscopic approach based on the data obtained from UV-Vis, fluorescence, circular dichroism (CD) and Fourier transform infrared (FTIR) spectroscopy. The ability to detect minor absorbance variations in complexes with high background absorbance is a major advantage of using various spectroscopic methods in protein-drug research.26 Also, surface plasmon resonance27 and electrochemical methods have been utilized for drug-protein binding characterization. UV-Vis absorption and fluorescence emission titrations provide an easy and practical way to detect a significant change in the drug-protein complex's hydrophobicity and structure. Since the aromatic amino acids (tyrosine, tryptophan, and phenylalanine) are present in proteins, they typically have a specific absorption peak around 280 nm and emission peak around 340 nm while exciting at 280 nm. The tryptophan has the highest absorption strength and fluorescence quantum yield among all other aromatic amino acids.4,5,26 Interacting with small molecules lead to the change in the polarity around the chromophore of proteins which in turn leads to the variation in the absorption and fluorescence emission spectra’s intensity and blue or red-shift of their maximum emission wavelength. FTIR and CD techniques have been used to track secondary structural changes in the HSA as a result of interactions with small molecules. The α-helices, β-sheets, and β-turns are the main elements of proteins’ secondary structures.4,5,28,29
We studied the binding of Fingolimod with HSA using spectroscopic techniques (i.e. Fluorescence, UV-Vis, FT-IR, and CD spectroscopy) and molecular modeling methods. To figure out the low solubility of Fingolimod in the presence of the buffering agents, we investigated the compatibility of Fingolimod with commonly utilized buffering agents. Furthermore, we studied the applicability of buffer-free solutions for binding studies. To simulate the ionic strength of the physiologic conditions all experiments were implemented in the presence of 100 mM NaCl. The binding mechanism of Fingolimod to HSA was studied in the optimized medium based on the spectroscopic methods and the obtained data were analyzed based on our previously published papers.4,5,26 To investigate the mode of Fingolimod-HSA interaction and details of binding forces, we utilized computational and in silico methods.
Materials and Methods
Materials
HSA (lyophilized powder, fatty acid-free 585 amino acids (66 kDa), purity ≥99%) and Fingolimod hydrochloride were obtained from Sigma-Aldrich, Warfarin, and Ibuprofen were purchased from Sobhan pharmaceutical company. HSA (0.05 % w/v, 7.77 ×10⁻⁶M) was dissolved in NaCl solution (10-4 M, pH 6.5) to prepare the stock solution. Fingolimod stock solution (3.2×10⁻³M) was prepared by dissolving 0.025 g of drug in 25 mL methanol. Ibuprofen and Warfarin were dissolved in 25 mL methanol to prepare 5×10⁻³M stock solutions. All stock solutions were sealed and stored in the refrigerator (0-4°C). NaCl aqueous solution was used to prepare working solutions to simulate the blood ionic strength, which is routine in similar studies.4,5,26 The investigation of ligand-HSA interaction in buffer-free aqueous solutions with or without NaCl has been reported in several papers.30-32
To generate the Fingolimod-HSA complex, a suitable amount of Fingolimod solution (diluted with 0.1 M NaCl solution) was added to the HSA solution, and the final volume of the mixture was set to 5mL using NaCl aqueous solution (0.1 M). The NaCl was added to the complex medium to simulate partial in vivo ionic strength, as is a common procedure in similar studies.33-35
Methods
Uv-Vis absorbance and fluorescence spectrum
The UV-Vis absorption study was performed using a double beam Shimadzu 1800 (Tokyo, Japan) in the wavelength range of 200-400 nm, at room temperature using a slit of 5 nm. Absorption spectra of HSA-Fingolimod complexes were recorded in the presence of 10-6 -10-4 M of the Fingolimod. The results showed that the spectroscopic behavior of the complex is linear in the Fingolimod concentration of 1.0, 1.5, 2.0, 2.5, 3.0 × 10⁻⁵ M.
Fluorescence quenching titrations were performed using a Shimadzu spectrofluorometer (RF-5301PC) equipped with the temperature control device of and Cytation 5 plate reader. The emission spectra of titrations of HSA and HSA-Fingolimod complexes were recorded in the wavelength range of 300-450 nm after being excited at 278 nm. The emission spectra of Warfarin-HSA and Ibuprofen-HSA have been utilized as a positive control for the fluorescence quenching titrations.4,5 The recorded fluorescence spectra were used to investigate the complex formation and HSA quenching mechanism due to Fingolimod binding. Thermodynamic properties of HSA-Fingolimod complex formation were investigated using the fluorescence spectra at enhanced temperatures i.e. 300, 305, 310, and 315 K. The results were manipulated using suitable mathematical models.
FTIR and CD analysis
The secondary structural and conformational properties of the HSA were studied using FTIR and CD. Spectral shifts in the amide I and II peptide bands could be investigated using FTIR spectra.36 FTIR spectra of free HSA and HSA-Fingolimod complexes were recorded using the Tensor 27 FTIR spectrometer (Brucker Company, Germany) equipped with an attenuated total reflection accessory. The spectra were recorded at the resolution of 4 cm-1 in the range of 400-4000 cm-1 at 298 K. Free drug spectra and blank solution spectra were recorded as well. Each sample was measured two times and blank sample spectra were subtracted before analysis. To obtain the extent of conformation variation, CD spectra of free HSA and HSA-Fingolimod complexes were monitored at 298 K in two different concentrations of the drug (1, 3 ×10⁻⁵Μ) in the range of 200–260 nm using a 0.01 cm quartz cell under a nitrogen atmosphere with Aviv, CD spectrometer (USA). The CD spectrum of each sample was recorded two times.
Competitive interaction of the HSA-Fingolimod in the presence of site markers
The Fingolimod binding site was investigated using specific site marker drugs. Warfarin and Ibuprofen were utilized as markers of site I (Subdomain IIA) and site II (Subdomain IIIA) respectively.37 Fingolimod was added to the solution of the HSA-site marker and the variations in the fluorescence emission spectra of HSA-site markers due to the Fingolimod addition were studied to investigate the major binding site of the Fingolimode on the HSA. To accomplish this, stock solutions of site-markers (5×10⁻³M) were prepared, and five enhanced concentrations (1.0, 1.5, 2.0, 2.5, 3.0 × 10⁻⁵ M) of them were added to Fingolimod-HSA solutions while the fingolimod concentration remained unchanged. Furthermore, increased Fingolimod concentrations were added to the Warfarin-HSA and Ibuprofen-HSA solutions during the analysis, while warfarin and ibuprofen concentrations remained unchanged.4,5,26
Molecular modeling
The molecular interaction between Fingolimod and HSA was studied using molecular modeling methods. The X-ray structure of HSA (PDB ID code: 1N5U) was obtained from the RCSB protein data bank (http://www.RCSB.org/PDB) and viewed and prepared by AutoDockTools1.5.6 software.38 AutoDock Vina was used for docking simulations.4,26,39 The chemical structure of Fingolimod was drawn with ChemBioDraw software and energy-optimized using Chembioultra MM2 and AM1 methods.40,41 Polar hydrogens and Kollman charges were added to the HSA structure before modeling. Also, water molecules were removed. The grid box of site I (Subdomain IIA) and site II (Subdomain IIIA) was designed based on the available information about the relevant amino acids.4,26,39 The grid box is defined separately for the site I and site II HSA with dimension size 20.25×20.25×20.25 Å3 in the X×Y×Z directions with 1Å grid spacing.
Results
Fingolimod solubility in buffer solutions
Fingolimod solubility was studied in different buffer solutions and the results are shown in Fig. 2. The results showed that Fingolimod hydrochloride is practically insoluble in PBS (0.04 M pH 7.4). Also, its solubility decreased in the presence of Tris (0.2 M), Sodium di Phosphate (0.05 M), and HEPES (0.1 M) buffers. The aqueous NaCl solution (0.1 M) was utilized as an alternative for buffer solutions and the results showed that the pH of the prepared solutions before and after the HSA addition was 6.5 for all studied concentrations of Fingolimod. The existence of NaCl in the solution could interfere with electrostatic-driven complex formation.34 To evaluate the probable influence of NaCl on the fluorescent emission of the Fingolimod-HSA complex and we recorded the fluorescence emission spectra of Fingolimod-HSA in the presence and absence of NaCl and we observed no significant variation in the studied NaCl concentration (0.1 M). The results showed that the contribution of electrostatic forces in the Fingolimod-HSA complex formation is not highly probable.33-35 The effect of the higher concentrations of NaCl on complex formation was not evaluated in the current study. Consequently, all experiments were performed in an aqueous NaCl (0.1 M, pH 6.5) solution.
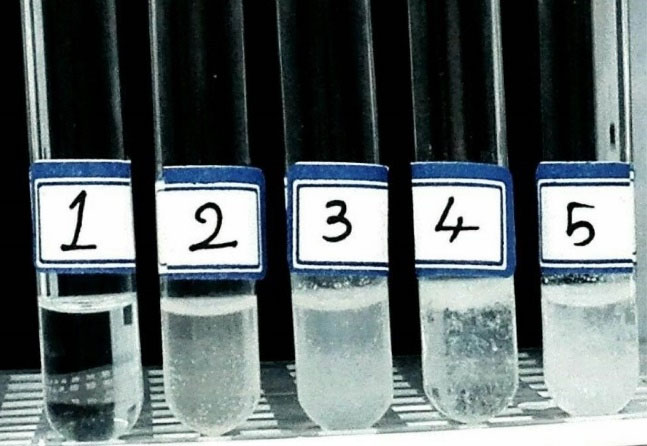
Fig. 2.
Solubility of Fingolimod in NaCl (1), HEPES (2), PBS (3), Sodium Phosphate (4), and Tris (5) buffer solutions.
.
Solubility of Fingolimod in NaCl (1), HEPES (2), PBS (3), Sodium Phosphate (4), and Tris (5) buffer solutions.
Fingolimod–HSA complex formation study using UV-Vis
UV-Vis absorption spectra of HSA and HSA-Fingolimod solutions showed in Fig. 3A. Proteins show a UV-Vis absorption at 280 nm which is a result of aromatic residues like tryptophan (Trp). Trp is responsible for the great molar absorptivity and intrinsic high fluorescence quantum yield of HSA.10 Ligand binding to the HSA can change the intensity of the HSA fluorescence emission and maximum absorption wavelength. The extent of this variation depends on the concentration of bound ligand, binding constant, and binding mechanism. The average distance between HSA and bound ligands has a significant role in the polarity around Trp.29,42 Variation in the microenvironment polarity leads to the alteration of the HSA spectroscopic properties due to the ligand binding. HSA shows a strong absorption peak at 278 nm (Fig. 3A), and its intensity increased following the addition of an enhanced concentration of Fingolimod. Also, a significant shift of HSA maximum absorption wavelength was observed toward shorter wavelengths (from 278 to 273). These results confirmed the complex formation between Fingolimod and HSA.
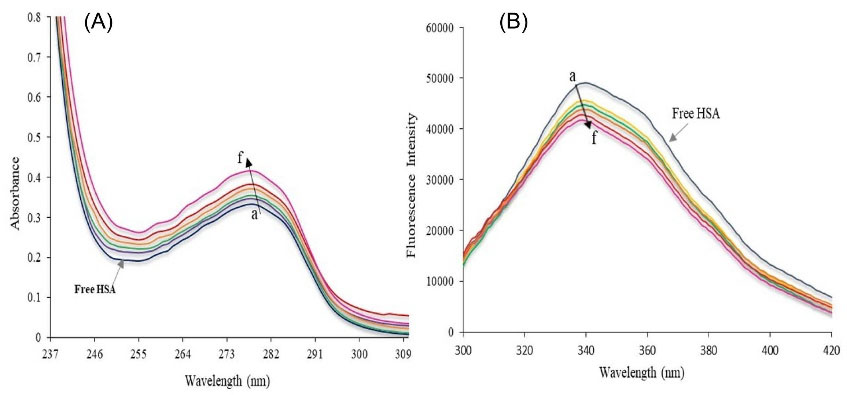
Fig. 3.
(A) UV-Vis absorption of free HSA and HSA-Fingolimod complex and (B) Fluorescence spectra of free HSA and HSA-Fingolimod complex due to the addition of enhanced Fingolimod concentration (a→f) 0, 1× 10⁻⁵, 1.5×10⁻⁵, 2×10⁻⁵, 2.5×10⁻⁵, 3×10⁻⁵M.
.
(A) UV-Vis absorption of free HSA and HSA-Fingolimod complex and (B) Fluorescence spectra of free HSA and HSA-Fingolimod complex due to the addition of enhanced Fingolimod concentration (a→f) 0, 1× 10⁻⁵, 1.5×10⁻⁵, 2×10⁻⁵, 2.5×10⁻⁵, 3×10⁻⁵M.
Binding mechanism and binding constant
The mechanism of complex formation was studied using fluorescence quenching titrations. Fig. 3B shows the maximum emission wavelength of HSA at 339 nm after excitation at 278 nm. The decreased fluorescence emission intensity of HSA due to the addition of enhanced concentration of Fingolimod is obvious in Fig. 3B. Also, a maximum wavelength shift from 339 nm to 341 nm was observed which could be attributed to the results showing that Fingolimod interacts with HSA and quenches the fluorescence emission intensity of HSA.
The quenching rate constant (association constant of the quencher) could be calculated using the Stern-Volmer plot (Fig. 4A). To study the fluorescence quenching rate, the Stern–Volmer equation (equation 1) was utilized:
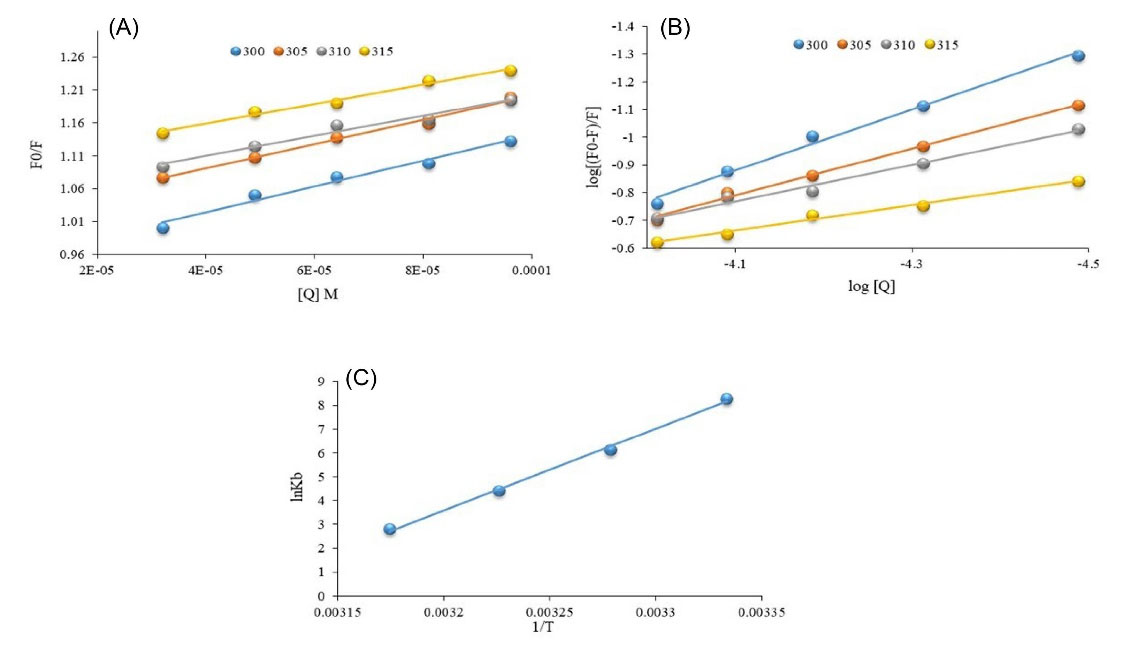
Fig. 4.
(A) Stern-Volmer and (B) Hill plot of HSA fluorescence quenching titrations in the presence of the enhanced concentration of Fingolimod, (C) Vant Hoff plot at 300. 305, 310, and 315 K.
.
(A) Stern-Volmer and (B) Hill plot of HSA fluorescence quenching titrations in the presence of the enhanced concentration of Fingolimod, (C) Vant Hoff plot at 300. 305, 310, and 315 K.
where Fo and F stand for fluorescence emission intensity of HSA in the absence and presence of quencher (Fingolimod), respectively. [Q], Ksv, Kq, and τ0 denote the concentration of quencher, quenching constant, the quenching rate constant, and the average lifetime of the HSA fluorescence without the quencher. The obtained intercept for the fittings at 300 K was 0.98 which indicates a 1:1 interaction mechanism between HSA and Fingolimod. Assuming the τ0 value for HSA is 10-8 s,43 we calculate Kq (Table 1). The natural lifetime of HSA and the rate at that the excited state is deactivated by non-radiative processes (collisions and other mechanisms) are determinant factors of the fluorescence emission intensity. The obtained Kq value (1.88×10¹¹ L mol−1 s−1) was 10 times greater than the maximum value of scattering collision quenching constant (2.0×10¹⁰ L mol−1 s−1).28
Table 1.
Ksv, Kq, Kb and n values of HSA-Fingolimod interaction at different temperatures
|
T (K)
|
Stern-Volmer model
|
Hill model
|
|
Ksv ×103 (M-1) |
Kq ×1011 (M-1 S-1) |
b (intercept)
|
R2
|
Kb (M-1) |
n
|
R2
|
| 300 |
1.88 |
1.88 |
0.98 |
0.98 |
4.26×10³ |
1.09 |
0.99 |
| 305 |
1.84 |
1.84 |
1.01 |
0.99 |
4.89×10² |
0.84 |
0.99 |
| 310 |
1.52 |
1.52 |
1.04 |
0.97 |
8.51×101 |
0.65 |
0.98 |
| 315 |
1.49 |
1.49 |
1.09 |
0.98 |
1.73×101 |
0.46 |
0.98 |
As shown in Table 1, Ksv values slightly decreased due to the temperature enhancement. The interaction between Fingolimod and HSA is slightly weakened at higher temperatures.
When small molecules bind to several binding sites on a macromolecule such as HSA, the Hill plot (equation 2) could be used to calculate the binding constant (Kb) and cooperativity factor (n) that also represents the number of binding sites.44
Kb of the HSA-Fingolimod complex was 4.26×10³ L mol-1, which was decreased significantly with temperature enhancement. n was 1.1, which shows that there is one major binding site in HSA for Fingolimod at 300 K and there is slight positive cooperativity for Fingolimod binding.45
Thermodynamic parameters and binding forces
Fig. 4C shows the Van't Hoff plot of Fingolimod binding to the HSA. The obtained ΔH°, ΔS°, and ΔG° values are listed in Table 2. The thermodynamic parameters such as the standard enthalpy change (∆H0) and standard entropy change (∆S0) were calculated using the Van't Hoff model (equation 3):
where Kb shows the binding constant, and R is the universal gas constant. ∆H0 and ∆S0 were calculated from the slope and intercept of the Van't Hoff plot. The standard free energy change (∆G0) was calculated using equation (4):
The obtained ΔH° (-2.86×10⁵ J/mol) and ΔS° (-8.8×10² Jmol−1 K−1) values were used to calculate the ΔGof the interaction at different temperatures. Increased ΔG° at higher temperatures indicates that the binding is less favorable at higher temperatures which is consistent with binding constant reduction at higher temperatures.
Table 2.
Thermodynamic parameters of interaction between HSA and Fingolimod at different temperatures
|
T (K)
|
∆G (J.mol-1) |
∆H (J.mol-1) |
∆S (J.mol-1K-1) |
| 300 |
-2.25×10⁴ |
-2.86×10⁵ |
-8.83×10² |
| 305 |
-1.81×10⁴ |
-2.86×10⁵ |
-8.83×10² |
| 310 |
-1.37×10⁴ |
-2.86×10⁵ |
-8.83×10² |
| 315 |
-9.34×10³ |
-2.86×10⁵ |
-8.83×10² |
Förster energy transfer (FRET) analysis
Fig. 5shows the overlapping between the Fingolimod absorption spectrum and the HSA emission spectrum. Calculated distance (r) and R° were calculated using the equation (5):
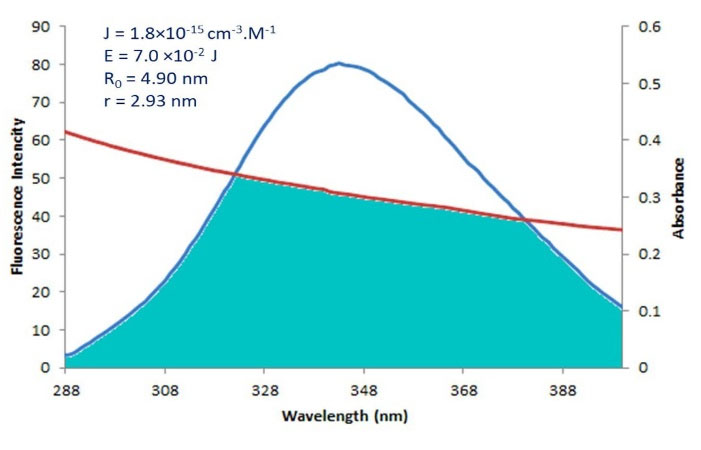
Fig. 5.
The overlap of the fluorescence spectrum of HSA and the absorption spectrum of Fingolimod, and calculated FRET energies and distances.
.
The overlap of the fluorescence spectrum of HSA and the absorption spectrum of Fingolimod, and calculated FRET energies and distances.
where E is the effectiveness of energy transfer between acceptor and donor, r is the distance between the acceptor and donor; R° is the critical distance for the occurrence of 50% of energy transfer and other symbols are as described previously. R° can be calculated with equation (6):
where K2 is the dipole-dipole orientation factor, N and Φ are the refractive index of the medium, and the quantum yield of the donor without the acceptor, and J is the spectral overlap integral between the donor’s fluorescence emission and acceptor’s UV-Vis absorption spectra. For a random orientation, K2=2.3, N=1.33, Φ=0.15 and J can be obtained in equation (7):
F(λ) is the fluorescence intensity of the fluorescent donor (Trp214) without acceptor and ε (λ) is the acceptor’s molar absorption coefficient.4,26 Obtained J, R0, E, and r values are shown in Fig. 5. The calculated distance between the Fingolimod and HSA (r = 2.93 nm) is less than 8 nm and 0.5R0 <2.93< 1.5R0.
Site marker competitive experiments
Fig. 6A illustrates the fluorescence spectra of the HSA – Ibuprofen complex. The addition of Fingolimod to the HSA-Ibuprofen solution leads to a significant reduction in the fluorescence intensity of the HSA-Ibuprofen complex (Fig. 6B). The fluorescence intensity of the Warfarin-HSA shown in Fig. 6C system was almost the same as Warfarin-HSA-Fingolimod complexes (Fig. 6D). According to the results of Fig. 6, a significant blue shift was observed which shows that the binding of Ibuprofen to HSA reduces the hydrophobic nature of tyrosine or tryptophan residues microenvironment in the HSA-Fingolimod complex. There is no red or blue shift for the Warfarin-HSA fluorescence spectra in the presence of the Fingolimod.
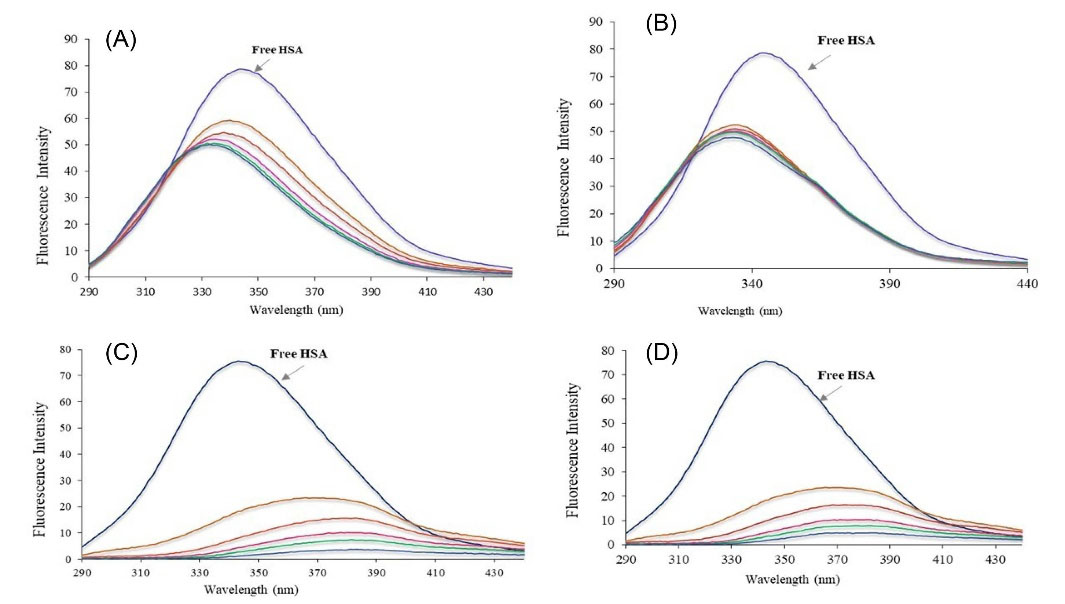
Fig. 6.
The fluorescence spectra of the HSA in the presence of Ibuprofen (A), Ibuprofen+Fingolimod (B) Warfarin (C), and Warfarin+Fingolimod (D).
.
The fluorescence spectra of the HSA in the presence of Ibuprofen (A), Ibuprofen+Fingolimod (B) Warfarin (C), and Warfarin+Fingolimod (D).
Conformational variation of HSA due to the Fingolimod binding
Fig. 7 shows the FTIR spectrum of free HSA and HSA-Fingolimod complexes. The CD spectra for HSA in the absence and presence of Fingolimod were recorded (190–260 nm) (Fig. 8). The infrared spectra of proteins are determined by intense absorptions in two spectral regions for the amide I band (1600 to 1700 cm−1) and for the amide II band (1550 to 1570 cm−1). Amid I contains C=O stretch and amid II includes CN stretch coupled with NH bending mode.46 As results show the peak position of amid I and II bands of HSA shifted from 1696.7 to 1691.6 cm-1 and 1541.5 to 1544.5 cm-1 respectively due to Fingolimod binding to HSA. These shifts indicate a slight change in the secondary structure of HSA α-helix and β-sheets.47 The extent of conformational variation was further analyzed using CD spectroscopy. CD has been widely used to determine the secondary structure of biomolecules and their conformational changes caused by mutations, heat, and binding interactions.48,49 According to the results (Fig. 8) the obtained spectra displayed two negative double peaks absorption at 210 and 220 nm. These double peaks are characteristic peaks of the α-helical structure of proteins which are contributed to π→π* and n→π* electron transfer of peptide bond.50 The α-helical content of the studied moieties was calculated by CDNN software. A reduction of α-helix substructure was observed (59.50% in free HSA to 47.80% in HSA-Fingolimod complexes). Besides, β-sheets and the random coil content increased from 13.50% to 15.40% and from 22.10% to 26.20% respectively.43,51
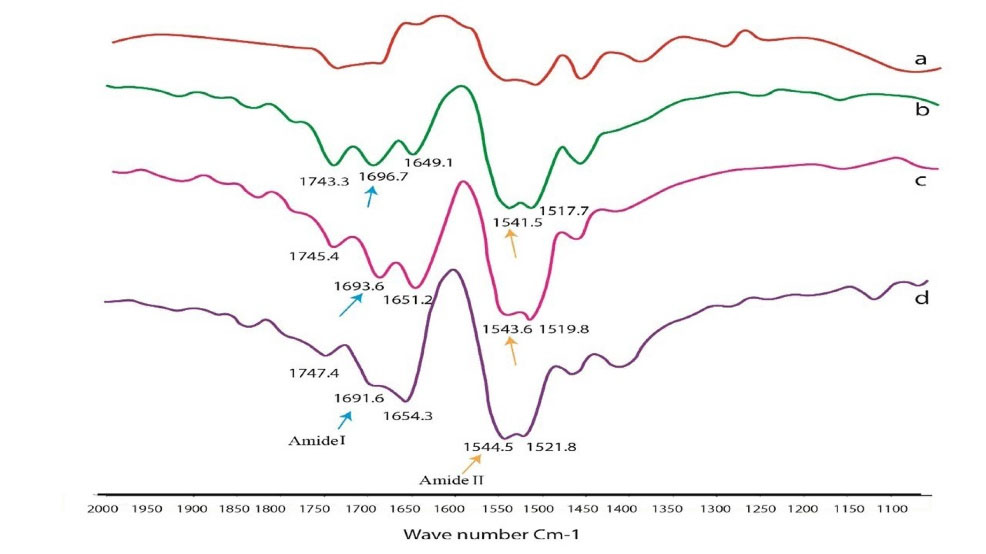
Fig. 7.
FTIR spectra of HSA-Fingolimod complex; a (HSA), b (1 HSA: 0.5×10⁻⁵M), c (1 HSA:1× 10⁻⁵M), d (1 HSA:1.5× 10⁻⁵M) and e (Fingolimod).
.
FTIR spectra of HSA-Fingolimod complex; a (HSA), b (1 HSA: 0.5×10⁻⁵M), c (1 HSA:1× 10⁻⁵M), d (1 HSA:1.5× 10⁻⁵M) and e (Fingolimod).
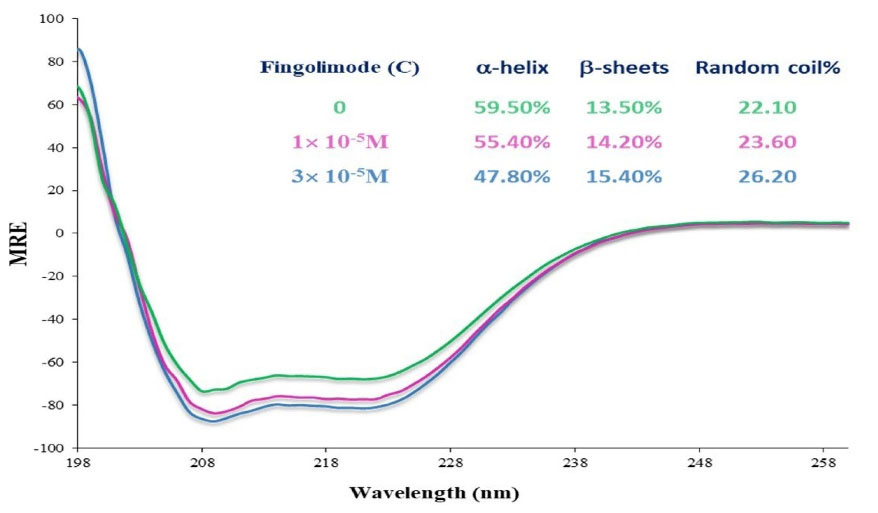
Fig. 8.
CD spectra of HSA in the presence of Fingolimod in two different concentrations.
.
CD spectra of HSA in the presence of Fingolimod in two different concentrations.
Molecular modeling of HSA-Fingolimod interaction
The mode of the interaction between Fingolimod and HSA was studied using molecular docking methods. The binding mode of Fingolimod with amino acids of binding sites I and II in the lowest energy conformers are shown in Fig. 9A. Due to the lipid-like properties of Fingolimod chemical structure, the docked pose of Fingolimod compared with Myristic Acid in site II. Some common FAs such as Myristic acid (14:0), Palmitic acid (16:0), and Stearic acid (18:0) with crystallographic PDB code 1N5U, 4Z69, and 1E7I, respectively, occupy the binding site II (IIIA) of HSA. In Fig. 9B, the lowest energy docked conformer of Fingolimod was compared with crystallographic Myristic Acid interacted with HSA. According to this figure, both structures are completely oriented in the same mode in the hydrophobic cavity of site II. The hydrophobic hydrocarbon tails were oriented towards the outside of HSA whereas the polar groups were headed towards the inside of HSA. Fingolimod shows almost the FA similar binding mode in the binding site II HSA. Beyond the hydrophobic interactions, Fingolimod binds via hydrogen bonds to Lys199 and His242 (subdomain IIA) and Asn391, Arg410, and Tyr411 (subdomain IIIA). Also, the contribution of the Arg257, Ser342, Tyr411, Val433, Leu481, Arg485, and Ser489 in the hydrogen bonding was observed in other conformers (Fig. 10A, B). Arg257 residue participates in the formation of cation-π non-covalent interaction with benzene ring of Fingolimod in site I. The calculated binding energy for the interaction of Fingolimod with the binding site I and II were -27.63 KJ.mol-1 and -32.23 KJ.mol-1 respectively. Also, Myristic Acid was docked to the native binding site in the site II HSA (Fig. 10 C) for validation and comparison with Fingolimod. The calculated binding energy of Myristic Acid to HSA is -26.37 KJ.mol-1.

Fig. 9.
The 3D representation of Fingolimod binding with the site I and II of HSA (A), the superimposed crystallographic Myristic Acid conformer with a docked conformer of Fingolimod in site II (B).
.
The 3D representation of Fingolimod binding with the site I and II of HSA (A), the superimposed crystallographic Myristic Acid conformer with a docked conformer of Fingolimod in site II (B).
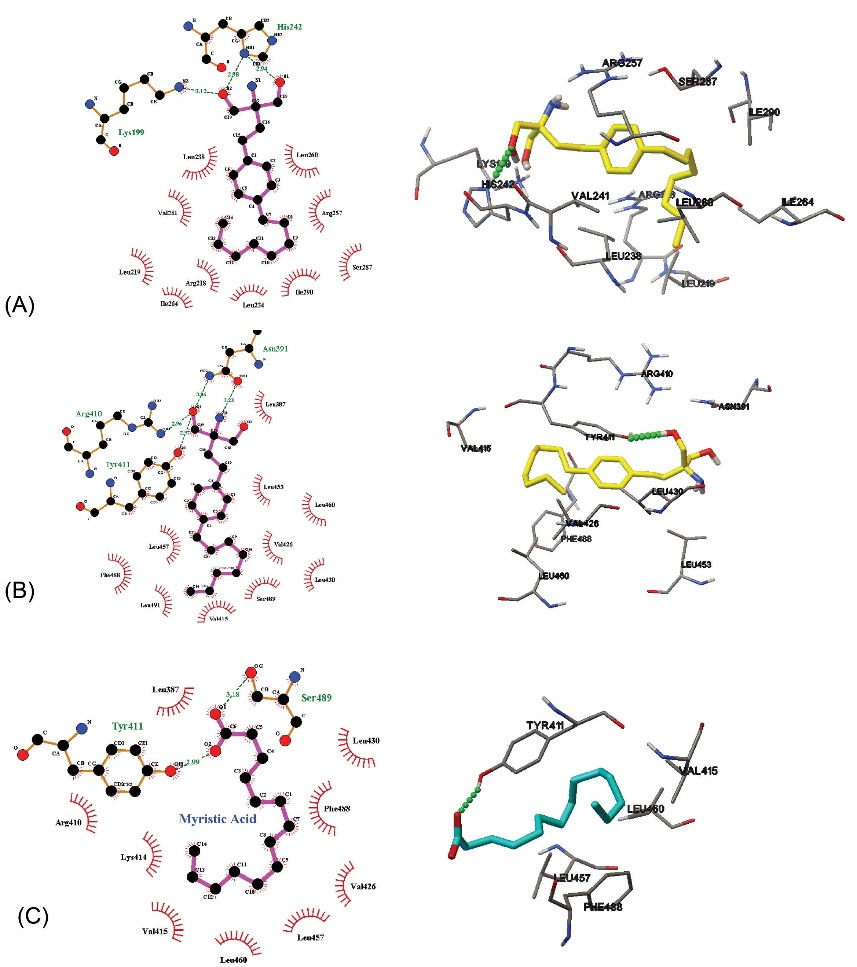
Fig. 10.
Fingolimod located at the binding site I (A), binding site II (B), and Myristic Acid located in binding site II (C).
.
Fingolimod located at the binding site I (A), binding site II (B), and Myristic Acid located in binding site II (C).
Discussion
As described in the results section buffering agents leads to significant Fingolimod reduction in aqueous solubility. Consequently, all experiments were performed in the presence of NaCl, while the pH of the complex solutions was 6.5.pH is a determinant factor of HSA conformation and binding properties. Variation of HSA ionization state depends mainly on its histidine moieties ionization state. HSA is in the normal structural form in physiologic pH 7.4. Reversible conformational transitions of HSA from neutral to base (N→B) that is suitable for HSA function as a carrier occurs in pH 7-9.3 HSA possesses a normal structural form in pH 6.5 which is similar to its form in the physiologic pH 7.4.
The complex formation between Fingolimod and HSA was confirmed using UV-Vis spectroscopic studies in which,increased absorption intensity and blue shift of λmax due to the addition of enhanced concentration of Fingolimod to the HSA solution, indicate the changes of the chromophore microenvironment polarity and hydrophobicity due to the ligand binding.4 Blueshift occurs due to an increase in the energy gap between the excited and ground state of the chromophore. The increased energy gap is a result of the polarity enhancement of the chromophore microenvironment. The higher polarity of the microenvironment leads to the stabilization of the excited state of the electron and accordingly the needed energy for the excitation increases and the absorption maximum wavelength of the chromophore decreases.52,53 The higher polarity occurs due to the binding of the ligand to the macromolecule.
The mechanism of complex formation was further studied using fluorescent quenching titrations. The obtained results were consistent with the contribution of the static quenching mechanism and ground-state complex formation between HSA and Fingolimod.54-56 Stern-Volmer constant (Ksv) is a measure of the effectiveness of the Fingolimod as a quencher. Ksv value of the studied interaction was 1.88×10³ M-1 at 300 K which is lower than the moderately strong binders of HSA (Ksv >104 M-1).57 Moreover the weaker quenching efficacy at higher temperatures could be a result of HSA unfolding (conformational change).58 Besides, when the quencher does not bind to the fluorophore, quenching occurs due to the variation in the micro-environment of the fluorophore as a result of the variation in the interaction of other amino acids with a fluorophore that could affect the quenching efficiency at different conditions. Also, the accessibility of the fluorophore could be changed as a result of the conformational change of the protein.
By fitting the obtained fluorescence quenching titrations results to the Hill equation, we found that temperature enhancement leads to the significant reduction of the n (cooperativity coefficient) value that is consistent with negative cooperativity of Fingolimod binding at higher temperatures. The molecules are more disturbed and vibrate fast at higher temperatures which can make the complex unstable.45 Also, it was assumed from Stern-Volmer analysis that complex formation contributes slightly to the quenching and quenching occurs mainly due to collisional mechanism. The results were consistent with previous findings of the 1:1 interaction between Fingolimod and HSA. Static quenching is subsided at higher temperatures, while dynamic quenching is accelerated.59
To investigate the contribution of different binding forces in the Fingolimod-HSA complex formation, the obtained binding constants were fitted to the Van't Hoff model and the obtained thermodynamic parameters were evaluated to discuss the binding forces. It is well-known that the enthalpy contribution to the ∆G reflects the contribution of the different binding forces, while the entropic contribution is a measure of the dynamics of the overall system.60 Hydrogen bonds, hydrophobic forces, electrostatic interaction, and Van der Waals forces are the main players in the interaction between biomolecules and small molecules. If ∆H›0 and ∆S›0 signify a hydrophobic interaction, ∆H<0 and ∆S<0 indicate hydrogen bonding and Van der Waals interactions, and if ∆H ~ 0 and ∆S>0 electrostatic forces are involved.61-63 Hydrogen bonds are consistent with favorable enthalpy, while hydrophobic interactions are characteristic of favorable entropy. Conformational changes are entropically unfavorable.64 The negative sign of ΔH° and ΔS° show that hydrogen bonds and Van der Waals forces play a dominant role in the HSA-Fingolimod complex formation. Besides the interaction is enthalpy driven. The negative signs for ΔG° indicate that the binding is spontaneous in all studied temperatures.43 Increased ΔG° at higher temperatures indicates that the binding is less favorable at higher temperatures which is consistent with binding constant reduction at higher temperatures.
To obtain more information about the distance between Fingolimod and Trp residues the FRET analysis was performed. The intermolecular energy transfer efficiency of drug-HSA interactions represents the distance between ligand and Trp residues. The molecular distance plays a critical role in complex formation. FRET explains the distance between quencher and fluorophore using the non-radiative energy transfer.65 FRET occurs when a fluorescence emission of the donor (fluorophore, Trp-214 residue in HSA) is quenched by a ligand (the acceptor). FRET is possible when the donor-acceptor pair has a dipolar overlap. Dipolar overlap occurs when the fluorescence emission spectrum of the donor overlaps with the absorption spectrum of the acceptor (Fingolimod). FRET occurs when the calculated distance (r) between the Fingolimod and HSA is less than 8 nm and it is between 0.5 R° and 1.5 R°. R° or Förster radius is the critical distance when the energy transfer is 50%. The results indicate that the energy transfer between HSA and Fingolimod occurred. If r=0.5 R0, the FRET efficiency becomes larger than 0.984 and for r beyond 1.5 R0, the efficiency of energy transfer is very low (<0.81).66 According to the results, r is about 0.6 R0, which indicates that the FRET efficiency is higher than 0.81 in the studied system.
In addition to the FRET study, we also performed site marker competitive studies to evaluate the probable binding site of the Fingolimod on the HSA. According to the results, the binding of Fingolimod to HSA was interfered with by the addition of ibuprofen. The results indicate that the hydrophobic nature of the microenvironment around ibuprofen increased due to the competitive binding of Fingolimod to site II (subdomain IIIA).43
The conformational changes of HSA due to the complex formation with Fingolimod were studied using CD analysis. Due to the results, the observed reduction in α-helix content along with the increase of the β-sheets and the random coil content confirms the conformation change of HSA structure. Such variation in the substructures' content could be a result of HSA unfolding due to the Fingolimod binding.43,51
The binding mode of Fingolimod with amino acids of binding sites I and II was studied using molecular docking studies and the results indicated that, beyond the hydrophobic interactions. Fingolimod binding in comparison to Myristic Acid is stronger because Fingolimod has an extra electronegative nitrogen atom and benzene aromatic ring in its structure that facilitate the formation of more hydrogen bonds and extra van der Waals interactions with HSA. The results are in agreement with the findings from the thermodynamic and site marker studies that indicated the tendency of Fingolimod to the binding site II mainly via hydrogen bond and van der Waals forces.
Research Highlights
What is the current knowledge?
√ Fingolimod is a lipid-like anti-MS drug that it's binding to HSA has not been studied until now.
√ Fatty acids bind to the HSA via specific binding sites.
√ Fingolimod possesses pH-dependent solubility that makes binding study difficult.
What is new here?
√ Fingolimod solubility in the presence of PBS and other buffers decreases significantly.
√ Fingolimod is soluble in an aqueous HSA solution containing 0.1 M NaCl.
√ Fingolimod binds using hydrogen and van der Waals bonds to site II, while the interaction is enthalpy driven.
√ Fingolimod binds to the fatty acid binding site on the HSA, using a similar mode of interaction.
√ The current study suggested a buffer-free method for the study of drugs’ interaction with proteins.
Conclusion
The interaction between Fingolimod (a lipid-like drug) and HSA was investigated using spectroscopic techniques and molecular modeling methods. Fingolimod as a derivative of sphingosine possesses pH-dependent solubility. Also, it is incompatible with buffering agents. Accordingly, all studies were performed using NaCl 10-4 M aqueous solution. The final pH of the working solutions was 6.8. The results of quenching titrations suggested that Fingolimod interacts with HSA with low affinity (Kb = 4.26×10³). The calculated binding distance using FRET was 2.93 nm, indicating that non-radiative energy transfer occurs between Fingolimod and HSA. FTIR and CD spectroscopic studies showed that Fingolimod may induce conformational changes in HSA upon interaction. Thermodynamic analysis suggests that Fingolimod could bind to HSA using hydrogen bonding and Van der Waals forces. Results of site marker competitive experiments showed that Fingolimod binds to site II (subdomain IIIA). Molecular docking studies confirmed the experimental results of binding forces and binding sites. Fingolimod binding to the HSA may possess a role in its pharmacokinetic properties. Also, despite its moderate interaction, competing with the site II binding drugs is probable. The reported methodology could be used to study the molecular mechanism of drug-protein interaction of lipid-like drugs with poor aqueous solubility or pH-dependent solubility. The current study provided information about the interaction of a lipid-like drug with HSA. The results could be used for a better understanding of the pharmacodynamics and pharmacokinetic properties of Fingolimod. Also, the results would be helpful for the designing of the improved formulation of Fingolimod.
Acknowledgment
The authors would like to acknowledge the Tabriz University of Medical Sciences for providing partial financial support under grant number 5/79/2645.
Funding sources
Tabriz University of Medical Sciences, Tabriz, Iran.
Ethical statement
Non to be declared.
Competing interest
Non to be declared.
References
- Jouyban A, Soltani S. Blood brain barrier permeation. In: Toxicity and Drug Testing. IntechOpen; 2012. 10.5772/20360.
- Zorzi A, Linciano S, Angelini A. Non-covalent albumin-binding ligands for extending the circulating half-life of small biotherapeutics. Medchemcomm 2019; 10:1068-81. doi: 10.1039/c9md00018f [Crossref] [ Google Scholar]
- Diaz N, Suarez D. Role of the Protonation State on the Structure and Dynamics of Albumin. J Chem Theory Comput 2016; 12:1972-88. doi: 10.1021/acs.jctc.5b01001 [Crossref] [ Google Scholar]
- Poureshghi F, Ghandforoushan P, Safarnejad A, Soltani S. Interaction of an antiepileptic drug, lamotrigine with human serum albumin (HSA): Application of spectroscopic techniques and molecular modeling methods. J PhotochemPhotobiol B 2017; 166:187-92. doi: 10.1016/j.jphotobiol.2016.09.046 [Crossref] [ Google Scholar]
- Safarnejad A, Shaghaghi M, Dehghan G, Soltani S. Binding of carvedilol to serum albumins investigated by multi-spectroscopic and molecular modeling methods. J Lumin 2016; 176:149-58. doi: 10.1016/j.jlumin.2016.02.001 [Crossref] [ Google Scholar]
- Maciążek-Jurczyk M, Szkudlarek A, Chudzik M, Pożycka J, Sułkowska A. Alteration of human serum albumin binding properties induced by modifications: A review. Spectrochim Acta A Mol BiomolSpectrosc 2018; 188:675-83. doi: 10.1016/j.saa.2017.05.023 [Crossref] [ Google Scholar]
- Watanabe H, Tanase S, Nakajou K, MARUYAMA T, KRAGH-HANSEN U, OTAGIRI M. Role of Arg-410 and Tyr-411 in human serum albumin for ligand binding and esterase-like activity. Biochem J 2000; 349:813-9. doi: 10.1042/bj3490813 [Crossref] [ Google Scholar]
- Kowacz M, Warszyński P. Kowacz M, Warszyński PBeyond esterase‐like activity of serum albuminHistidine‐(nitro) phenol radical formation in conversion cascade of p‐nitrophenyl acetate and the role of infrared light. J Mol Recognit 2019; 32:e2780. doi: 10.1002/jmr.2780 [Crossref] [ Google Scholar]
- Esmaeili S, Almasi M, Vaisi-Raygani A, Moradi S, Ashrafi-Kooshk MR, Shahlaei M. Exploring the interaction between “site-markers, aspirin and esterase-like activity” ternary systems on the human serum albumin: direct evidence for modulation of catalytic activity of the protein in different inhibition modes. Journal of the Iranian Chemical Society 2018; 15:555-73. doi: 10.1007/s13738-017-1256-0 [Crossref] [ Google Scholar]
- Mukherjee S, Ganorkar K, Kumar A, Sehra N, Ghosh SK. Switching of Trp-214 intrinsic rotamer population in human serum albumin: An insight into the aftermath of embracing therapeutic bioorganic luminophore azapodophyllotoxin into sudlow site I. Biochem J 2019; 84:63-75. doi: 10.1016/j.bioorg.2018.11.015 [Crossref] [ Google Scholar]
- Yamasaki K, Hyodo S, Taguchi K, Nishi K, Yamaotsu N, Hirono S. Long chain fatty acids alter the interactive binding of ligands to the two principal drug binding sites of human serum albumin. PloS One 2017; 12:e0180404. doi: 10.1371/journal.pone.0180404 [Crossref] [ Google Scholar]
- Yang F, Zhang Y, Liang H. Interactive association of drugs binding to human serum albumin. Int J Mol Sci 2014; 15:3580-95. doi: 10.3390/ijms15033580 [Crossref] [ Google Scholar]
- Liu Z, Chen X. Simple bioconjugate chemistry serves great clinical advances: albumin as a versatile platform for diagnosis and precision therapy. Chem Soc Rev 2016; 45:1432-56. doi: 10.1039/C5CS00158G [Crossref] [ Google Scholar]
- Fasano M, Curry S, Terreno E, Galliano M, Fanali G, Narciso P. The extraordinary ligand binding properties of human serum albumin. IUBMB life 2005; 57:787-96. doi: 10.1080/15216540500404093 [Crossref] [ Google Scholar]
- Frei E. Albumin binding ligands and albumin conjugate uptake by cancer cells. DiabetolMetabSyndr 2011; 3:1-4. doi: 10.1186/1758-5996-3-11 [Crossref] [ Google Scholar]
- Yousefi R, Jamshidi M, Shahsavani MB, Nabavizadeh SM, Haghighi MG, Rashidi M. Study on the interaction of three structurally related cationic Pt (II) complexes with human serum albumin: importance of binding affinity and denaturing properties. Journal of the Iranian Chemical Society 2016; 13:617-30. doi: 10.1007/s13738-015-0773-y [Crossref] [ Google Scholar]
- Maruyama T, Lin C, Yamasaki K, Miyoshi T, Imai T, Yamasaki M. Binding of suprofen to human serum albumin: role of the suprofen carboxyl group. BiochemPharmacol 1993; 45:1017-26. doi: 10.1016/0006-2952(93)90245-R [Crossref] [ Google Scholar]
- Graciani FS, Ximenes VF. Investigation of human albumin-induced circular dichroism in dansylglycine. PLoS One 2013; 8:e76849. doi: 10.1371/journal.pone.0076849 [Crossref] [ Google Scholar]
- AlQahtani AD, O’Connor D, Domling A, Goda SK. Strategies for the production of long-acting therapeutics and efficient drug delivery for cancer treatment. Biomed Pharmacother 2019; 113:108750. doi: 10.1016/j.biopha.2019.108750 [Crossref] [ Google Scholar]
- Shrestha J, Ki SH, Shin SM, Kim SW, Lee J-Y, Jun H-S. Synthesis of novel FTY720 analogs with anticancer activity through PP2A activation. Molecules 2018; 23:2750. doi: 10.3390/molecules23112750 [Crossref] [ Google Scholar]
- Tablets ER, Leader T, Uppoor R, Reviewer P, Gobburu J, Wang PTLY. Clinical Pharmacology/Biopharmaceutics Review. 2006.
- Chun J, Brinkmann V. A mechanistically novel, first oral therapy for multiple sclerosis: the development of fingolimod (FTY720, Gilenya). Discov Med 2011; 12:213. [ Google Scholar]
- Correale J, Chiquete E, Milojevic S, Frider N, Bajusz I. Assessing the potential impact of non-proprietary drug copies on quality of medicine and treatment in patients with relapsing multiple sclerosis: the experience with fingolimod. Drug Des DevelTher 2014; 8:859. doi: 10.2147/DDDT.S66398 [Crossref] [ Google Scholar]
- Shayanfar A, Soltani S, Jouyban A. Prediction of blood–brain distribution: effect of ionization. Biol Pharm Bull 2011; 34:266-71. doi: 10.1248/bpb.34.266 [Crossref] [ Google Scholar]
- Zhang G, Zhao N, Wang L. Fluorescence spectrometric studies on the binding of puerarin to human serum albumin using warfarin, ibuprofen and digitoxin as site markers with the aid of chemometrics. J Lumin 2011; 131:2716-24. doi: 10.1016/j.jlumin.2011.07.011 [Crossref] [ Google Scholar]
- Farsad SA, Haghaei H, Shaban M, Zakariazadeh M, Soltani S. Investigations of the molecular mechanism of diltiazem binding to human serum albumin in the presence of metal ions, glucose and urea. J Biomol Struct Dyn 2021; 1-12. 10.1080/07391102.2021.1891137.
- Haghaei H, Hosseini SRA, Soltani S, Fathi F, Mokhtari F, Karima S. Kinetic and thermodynamic study of beta-Boswellic acid interaction with Tau protein investigated by surface plasmon resonance and molecular modeling methods. Bioimpacts 2020; 10:17-25. doi: 10.15171/bi.2020.03 [Crossref] [ Google Scholar]
- Suo Z, Sun Q, Yang H, Tang P, Gan R, Xiong X. Combined spectroscopy methods and molecular simulations for the binding properties of trametinib to human serum albumin. RSC Adv 2018; 8:4742-9. doi: 10.1039/C7RA12890H [Crossref] [ Google Scholar]
- Vaneková Z, Hubčík L, Toca-Herrera JL, Furtműller PG, Valentová J, Mučaji P. Study of interactions between amlodipine and quercetin on human serum albumin: spectroscopic and modeling approaches. Molecules 2019; 24:487. doi: 10.3390/molecules24030487 [Crossref] [ Google Scholar]
- Xu Z, Grassian VH. Bovine serum albumin adsorption on TiO2 nanoparticle surfaces: Effects of ph and coadsorption of phosphate on protein–surface interactions and protein structure. J Phys Chem C 2017; 121:21763-71. doi: 10.1021/acs.jpcc.7b07525 [Crossref] [ Google Scholar]
- Poderys V, Matulionyte M, Selskis A, Rotomskis R. Interaction of water-soluble CdTe quantum dots with bovine serum albumin. Nanoscale Res Lett 2011; 1:9. doi: 10.1007/s11671-010-9740-9 [Crossref] [ Google Scholar]
- Grigoryan K, Zatikyan A, Shilajyan H. Effect of monovalent ions on the thermal stability of bovine serum albumin in dimethylsulfoxide aqueous solutions. Spectroscopic approach. J Biomol Struct Dyn 2021; 39:2284-8. doi: 10.1080/07391102.2020.1743759 [Crossref] [ Google Scholar]
- Guo Q, Liu M, Zhao Y, Wu Y, Liu J, Cai C. Spectroscopic and cytotoxicity studies on the combined interaction of (−)-epigallocatechin-3-gallate and anthracycline drugs with human serum albumin. Spectrochim Acta A Mol BiomolSpectrosc 2019; 222:117213. doi: 10.1016/j.saa.2019.117213 [Crossref] [ Google Scholar]
- Agrawal R, Thakur Y, Tripathi M, Siddiqi MK, Khan RH, Pande R. Elucidating the binding propensity of naphthyl hydroxamic acid to human serum albumin (HSA): multi-spectroscopic and molecular modeling approach. J Mol Struct 2019; 1184:1-11. doi: 10.1016/j.molstruc.2019.01.067 [Crossref] [ Google Scholar]
- Ràfols C, Amézqueta S, Fuguet E, Bosch E. Molecular interactions between warfarin and human (HSA) or bovine (BSA) serum albumin evaluated by isothermal titration calorimetry (ITC), fluorescence spectrometry (FS) and frontal analysis capillary electrophoresis (FA/CE). J Pharm Biomed Anal 2018; 150:452-9. doi: 10.1016/j.jpba.2017.12.008 [Crossref] [ Google Scholar]
- Abbott GW, Ramesh B, Srai SK. Interaction between soluble and membrane-embedded potassium channel peptides monitored by fourier transform infrared spectroscopy. PloS one 2012; 7:e49070. doi: 10.1371/journal.pone.0049070 [Crossref] [ Google Scholar]
- Na N, Zhao D-Q, Li H, Jiang N, Wen J-Y, Liu H-Y. DNA binding, photonuclease activity and human serum albumin interaction of a water-soluble freebase carboxyl corrole. Molecules 2016; 21:54. doi: 10.3390/molecules21010054 [Crossref] [ Google Scholar]
- Xu L, Hu Y-X, Li Y-C, Liu Y-F, Zhang L, Ai H-X. Study on the interaction of paeoniflorin with human serum albumin (HSA) by spectroscopic and molecular docking techniques. Chem Cent J 2017; 11:1-12. doi: 10.1186/s13065-017-0348-3 [Crossref] [ Google Scholar]
- Trott O, Olson AJ. AutoDock Vina: improving the speed and accuracy of docking with a new scoring function, efficient optimization, and multithreading. J Comput Chem 2010; 31:455-61. doi: 10.1002/jcc.21334 [Crossref] [ Google Scholar]
- Mozaffarnia S, Parsaee F, Payami E, Karami H, Soltani S, Rashidi MR. Design, Synthesis and Biological Assessment of Novel 2‐(4‐Alkoxybenzylidine)‐2, 3‐dihydro‐5, 6‐dimethoxy‐1H‐inden‐1‐one Derivatives as hAChE and hBuChE Enzyme Inhibitors. ChemistrySelect 2019; 4:9376-80. doi: 10.1002/slct.201901973 [Crossref] [ Google Scholar]
- Tatardar S, Jouyban A, Soltani S, Zakariazadeh M. QSAR analysis of cyclooxygenase inhibitors selectivity index (COX1/COX2): Application of SVM-RBF and MLR methods. Pharm Sci 2015; 21:86-93. doi: 10.15171/PS.2015.22 [Crossref] [ Google Scholar]
- Chaves OA, Amorim APdO, Castro LH, Sant’Anna CMR, De Oliveira MC, Cesarin-Sobrinho D. Fluorescence and docking studies of the interaction between human serum albumin and pheophytin. Molecules 2015; 20:19526-39. doi: 10.3390/molecules201019526 [Crossref] [ Google Scholar]
- Chen Y-C, Wang H-M, Niu Q-X, Ye D-Y, Liang G-W. Binding between saikosaponin C and human serum albumin by fluorescence spectroscopy and molecular docking. Molecules 2016; 21:153. doi: 10.3390/molecules21020153 [Crossref] [ Google Scholar]
- Naik KM, Kolli DB, Nandibewoor ST. Elucidation of binding mechanism of hydroxyurea on serum albumins by different spectroscopic studies. SpringerPlus 2014; 3:1-13. doi: 10.1186/2193-1801-3-360 [Crossref] [ Google Scholar]
- Wani TA, Bakheit AH, Zargar S, Hamidaddin MA, Darwish IA. Spectrophotometric and molecular modelling studies on in vitro interaction of tyrosine kinase inhibitor linifanib with bovine serum albumin. PLoS One 2017; 12:e0176015. doi: 10.1371/journal.pone.0176015 [Crossref] [ Google Scholar]
- Amir RM, Anjum FM, Khan MI, Khan MR, Pasha I, Nadeem M. Application of Fourier transform infrared (FTIR) spectroscopy for the identification of wheat varieties. J Food Sci Technol 2013; 50:1018-23. doi: 10.1007/s13197-011-0424-y [Crossref] [ Google Scholar]
- Alhazmi HA. FT-IR spectroscopy for the identification of binding sites and measurements of the binding interactions of important metal ions with bovine serum albumin. Sci Pharm 2019; 87:5. doi: 10.3390/scipharm87010005 [Crossref] [ Google Scholar]
- Garab G, van Amerongen H. Linear dichroism and circular dichroism in photosynthesis research. Photosynth Res 2009; 101:135-46. doi: 10.1016/0005-2728(79)90180-4 [Crossref] [ Google Scholar]
- Zamanian-Azodi M, Rezaei-Tavirani M, Vafaee R. Critical concentration of Glucose changes human serum albumin conformation: Circular Dichroism (CD) and UV Spectroscopyapproaches. Archives of Advances in Biosciences 2013; 4. 10.22037/jps.v4i3.4658.
- Greenfield NJ. Using circular dichroism spectra to estimate protein secondary structure. Nat Protoc 2006; 1:2876. doi: 10.1038/nprot.2006.202 [Crossref] [ Google Scholar]
- Liu J, Strzalka J, Tronin A, Johansson JS, Blasie JK. Mechanism of interaction between the general anesthetic halothane and a model ion channel protein, II: fluorescence and vibrational spectroscopy using a cyanophenylalanine probe. Biophys J 2009; 96:4176-87. doi: 10.1016/j.bpj.2009.01.055 [Crossref] [ Google Scholar]
- Guo M, Wang X, Lu X, Wang H, Brodelius PE. α-Mangostin extraction from the native mangosteen (Garcinia mangostana L) and the binding mechanisms of α-mangostin to HSA or TRF. PloS One 2016; 11:e0161566. doi: 10.1371/journal.pone.0161566 [Crossref] [ Google Scholar]
- Fan Y, Zeng G, Liu J, Chen H, Xue J, Wu Y. Spectroscopic studies on the interaction of chromium (VI) and chromium (III) with keyhole limpet hemocyanin. Luminescence 2017; 32:190-4. doi: 10.1002/bio.3166 [Crossref] [ Google Scholar]
- Shi J-h, Pan D-q, Jiang M, Liu T-T, Wang Q. In vitro study on binding interaction of quinapril with bovine serum albumin (BSA) using multi-spectroscopic and molecular docking methods. J Biomol Struct Dyn 2017; 35:2211-23. doi: 10.1080/07391102.2016.1213663 [Crossref] [ Google Scholar]
- Li Y, Yang G, Mei Z. Spectroscopic and dynamic light scattering studies of the interaction between pterodontic acid and bovine serum albumin. Acta Pharm Sin B 2012; 2:53-9. doi: 10.1016/j.apsb.2011.12.001 [Crossref] [ Google Scholar]
- Alsamamra H, Khalid I, Alfaqeh R, Farroun M, Abuteir M, Darwish S. Spectroscopic investigation of procaine interaction with human serum albumin. iMedPub Journals 2018. 10.4172/2254-609X.100087.
- Moradi SZ, Moradi S, Nowroozi A, Sadrjavadi K, Farhadian N, Ehzari H. Insights from a combination of theoretical and experimental methods for probing the biomolecular interactions between human serum albumin and clomiphene. RSC Adv 2018; 8:40663-75. doi: 10.1039/C8RA08237E [Crossref] [ Google Scholar]
- Suryawanshi VD, Walekar LS, Gore AH, Anbhule PV, Kolekar GB. Spectroscopic analysis on the binding interaction of biologically active pyrimidine derivative with bovine serum albumin. J Pharm Anal 2016; 6:56-63. doi: 10.1016/j.jpha.2015.07.001 [Crossref] [ Google Scholar]
- Li J, Li J, Jiao Y, Dong C. Spectroscopic analysis and molecular modeling on the interaction of jatrorrhizine with human serum albumin (HSA). Spectrochim Acta A Mol BiomolSpectrosc 2014; 118:48-54. doi: 10.1016/j.saa.2013.07.029 [Crossref] [ Google Scholar]
- Bronowska AK. Thermodynamics of ligand-protein interactions: implications for molecular design. In: Thermodynamics-Interaction Studies-Solids, Liquids and Gases. IntechOpen; 2011. 10.5772/19447.
- Garbett NC, Chaires JB. Thermodynamic studies for drug design and screening. Expert Opin Drug Discov 2012; 7:299-314. doi: 10.1517/17460441.2012.666235 [Crossref] [ Google Scholar]
- Shahabadi N, Khorshidi A, Moghadam NH. Study on the interaction of the epilepsy drug, zonisamide with human serum albumin (HSA) by spectroscopic and molecular docking techniques. Spectrochim Acta A Mol BiomolSpectrosc 2013; 114:627-32. doi: 10.1016/j.saa.2013.05.092 [Crossref] [ Google Scholar]
- Ross PD, Subramanian S. Thermodynamics of protein association reactions: forces contributing to stability. Biochemistry 1981; 20:3096-102. doi: 10.1021/bi00514a017 [Crossref] [ Google Scholar]
- Huddler DP, Zartler E, Wiley J. Applied biophysics for drug discovery. Wiley; 2017. 10.1002/9781119099512.
- Yasseen Z, El-Ghossain M. Studies on binding of widely used drugs with human serum albumin at different temperatures and PHs. J Biomedical Sci 2016; 5. 10.1002/9781119099512.
- Müller SM, Galliardt H, Schneider J, Barisas BG, Seidel T. Quantification of Förster resonance energy transfer by monitoring sensitized emission in living plant cells. Front Plant Sci 2013; 4:413. doi: 10.3389/fpls.2013.00413 [Crossref] [ Google Scholar]