Bioimpacts. 12(6):533-548.
doi: 10.34172/bi.2022.23393
Original Research
Simulation and fabrication of an integrating well-aligned silicon nanowires substrate for trapping circulating tumor cells labeled with Fe3O4 nanoparticles in a microfluidic device
Vahid Ghafouri , *  , Majid Badieirostami , Morteza Fathipour
Author information:
MEMS Lab, School of Electrical and Computer Engineering, College of Engineering, University of Tehran, Tehran, Iran
Abstract
Introduction:
Circulating tumor cells (CTCs) are the transformed tumor cells that can penetrate into the bloodstream and are available at concentrations as low as 1-100 cells per milliliter. To trap CTCs in the blood, one valid and mature technique that has been developed is the magnetophoresis-based separation in a microfluidic channel. Recently, nanostructured platforms have also been developed to trap specific targeted and marker cells in the blood. We aimed to integrate both in one platform to improve trapping.
Methods:
Here, we developed a numerical scheme and an integrated device that considered the interaction between drag and magnetic forces on paramagnetic labeled cells in the fluid as well as interaction of these two forces with the adhesive force and the surface friction of the nanowires substrate. We aimed on developing a more advanced technique that integrated the magnetophoretic property of some Fe3O4 paramagnetic nanoparticles (PMNPs) with a silicon nanowires (SiNWs) substrate in a microfluidic device to trap MDA-MB231 cell lines as CTCs in the blood.
Results:
Simulation indicated assuming that the nanoparticles adhere perfectly to the white blood cells (WBCs) and the CTCs, the magnetic moment of the CTCs was almost one order of magnitude larger than that of the WBCs, so its attraction by the magnetic field was much higher. In general with significant statistics, the integrated device can trap almost all of the CTCs on the SiNWs substrate. In the experimental section, we took advantage of the integrated trapping techniques, including micropost barriers, magnetophoresis, and nanowires-based substrate to more effectively isolate the CTCs.
Conclusion:
The simulation indicated that the proposed device could almost trap all of the CTCs onto the SiNWs substrate, whereas trapping in flat substrates with magnetophoretic force was very low. As a result of the magnetic field gradient, magnetophoretic force was applied to the cells through the nanoparticles, which would efficiently drive down the nanoparticle-tagged cells. For the experimental validation, anti-EpCAM antibodies for specific binding to tumor cells were used. Using this specific targeting method and by statistically counting, it was shown that the proposed technique has excellent performance and results in the trapping efficiency of above 90%.
Keywords: Well-aligned silicon nanowires, Fe3O4 paramagnetic nanoparticles, Magnetophoresis, Anti-EpCAM antibody, Circulating tumor cells
Copyright and License Information
© 2022 The Author(s).
This work is published by BioImpacts as an open access article distributed under the terms of the Creative Commons Attribution Non-Commercial License (
http://creativecommons.org/licenses/by-nc/4.0/). Non-commercial uses of the work are permitted, provided the original work is properly cited.
Introduction
Cancer cells detached from their parent tumors may permeate into the bloodstream as circulating tumor cells (CTCs) and consequently create distant metastatic sites in other organs which may also proliferate and form secondary tumors.
1
CTCs encountered cellular mutations that led to the loss of cellular cohesion and cellular polarity and thus gained increased mobility and invasion to be able to leak into the bloodstream.
2
CTCs exist in very rare numbers in the blood of carcinoma patients and their concentration is an indication of the future cancer metastasis.
3,4
The assessment and examination of the CTCs extracted from the blood of cancer patients should be beneficial for the development of patient-specific treatments.
5
Practically, the CTCs are available at concentrations as low as 1-100 cells per milliliter in the peripheral blood where the ratio of the red blood cells (RBCs) to the white blood cells (WBCs) is around 1000 and the minimum specimen volume needed for the CTC analysis is 5 to 10 mL. Moreover, prospective studies have reported that patients with 5% CTCs per 7.5 mL of blood volume would have very low chance of long term survival.
6
Therefore, by the enumeration of the CTCs in a sample blood volume of a cancer patient we can accomplish a substantial biomarker to monitor for real-time prognosis and further for exclusion of return and prevention of metastatic relapses.
Right now, CellSearch® is the only FDA approved system which is accepted as the “gold standard” amid emerging CTC isolation mechanisms, which is based on specific targeting of EpCAM cell surface markers.
7
Nonetheless, since the EpCAM biomarkers are not available in all carcinoma and are likely to be lost when cells suffer the epithelial to mesenchymal transition, the CellSearch® procedure is not always applicable.
8
To discover CTCs in blood, diverse novel devices have been developed in the last few years, including size-based filtration,
9
microfluidics approaches,
10
and immunomagnetic separation.
11
Despite technological progress, it is yet technically very challenging to come up with a standard clinical method for the detection of the CTCs because of their very rare numbers present in the blood volume, that is, 1–100 CTCs/mL.
12
Besides, the CTCs’ extremely heterogeneous morphologies have made their isolation extremely hard.
13,14
Although immunoaffinity-based isolation methods have some benefits such as high purity, high recovery, and high cell viability, their disadvantages like deficiency of cancer-specific markers, heterogeneous expression of markers in cells, and some difficulties with the antibody affinity or specificity restrict their use. Therefore, a very sensitive detection device is required to accurately identify, separate, and enumerate the CTCs.
Among the methods of cell separation, pillar-type filtration is the most common method, which is made of microposts with specified gap intervals to separate particles according to their size. This method is usually avoided because cells trapped along the fluid flow direction will lead to fouling or clogging.
15
Along this method and with the same structural classification, membrane microfilters have also been used to separate spiked cells in the blood and have been incorporated with electrolysis for genomic analysis by integrating large arrays of pores.
16
Filter separators that operate by size face numerous challenges, such as cell size inhomogeneities within a population, clogging, or fouling. Rare deformable cells, such as CTCs, where extrusion from the pores occurs, may be damaged or destroyed.
17
The most significant advantages of using microfluidic devices are: excellent purity, high capture rates, little cell disturbance, low sample volume, high cell viability, and high efficiency. However, the main disadvantage of this method is that it is time consuming in the volume of analysis. To overcome this issue, a purely hydrodynamic procedure of fractionating a sample by size was proposed.
18
Hydrodynamic manipulation of particles was also performed using micropost arrays and laminar flow.
In the dielectrophoresis (DEP) method, an external electric field source is used to move and separate CTCs in the microfluidic channel. This technique permits the rearrangement of the external electric field to gain accurate isolation results. Besides, the high conductivity of the blood suspension is reported to cause remarkable heating within a DEP compliant with cell phenotypes, by the way of increasing flexible control of the microenvironment for a wide range of cells. Albeit the considered DEP method shows a successful CTCs’ isolation result, there are some restrictions reported through various studies. The first and the substantial problem of the DEP microfluidic systems is the low efficiency of this method, such that the accessible amelioration amount for tumor cells is lower than 80%. Such a scenario is largely resulting in the high electric conductivity of the blood.
19
In most cases this particular feature causes cells dragging negative DEP, and so it is difficult to implement the DEP separation process (e.g., tough to get a high purity product).
20
In addition, reports have shown that the high conductivity of the blood suspension significantly heats up the DEP microfluidic device. This leads to unfavorable lysing of cells.
20
Another widely used method for size-based particle separation applies laminar flow via an alternative array of barriers in micrometer scale. These arrays use a well-known principle known as deterministic lateral displacement (DLD) in order to continuously separate particles in size, since the movement of cells or particles perpendicular to the prime flow direction is accomplished by the scheme of the arrangement.
21
Particles that are smaller than the critical size when passing through the array slot follow the main stream without any displacement, whereas particles overhead the critical size are “thumped ” sideward to cross consecutive streamlines with each tier moving at an angle prearranged by the post departure spacing.
Field-flow fractionation (FFF) is associated to methods where a field as flow, electric, gravitational, centrifugal, and particle-shaped objects operates in a vertical orientation of prim channel streamline. In a microfluidic device, the particles with the greatest force applied are near the walls where the flow velocity is slower, thus allowing them to stay there longer. Particles under influence of a small vertical force are quickly driven out of the channel due to the fluid momentum. In opposition to lots of common techniques, FFF is an elution method where differential conservation in the microchannel put through separation, rather than direction down different outlet channels.
22
Likewise, Herringbone grooves are used to produce a flow pattern proper for separating particles of the same size based on density.
23
However, the output arrangements for separating cells or particles are not really suitable in this device.
Magnetophoresis-based separation process with microfluidic technology is a proven and perfect technique that has been established in recent years for identification and isolation of rare cells.
24-26
In this technique, in order to efficiently and selectively separate cells labeled with biocompatible magnetic particles in a microfluidic device, a magnetic field gradient is applied, hence known as the immunomagnetic technique. The advantage of this method over passive hydrodynamic methods is that it is less dependent on fluid flow and particle-particle interaction. The magnetophoresis process has higher specificity than other techniques and it is possible to process whole blood and isolate cells with higher throughput.
27,28
Moreover, the immunomagnetic habitude is a biocompatible attitude with a little harm to the cells. Despite of the high-gradient magnetic field, the force is only applied to the particles labeled on the cell and pushes the cell to the desired position. The cells viability in this method is almost 100%.
29
The most important limitation of this method is the need for a pre-preparation sample and cell labeling with the magnetic particles.
Recently, Kim et al used magnetophoretic micro-separation to isolate CTCs from peripheral blood.
29
With this kind of device for a diluted blood sample spiked with the CTCs at a flow rate of 5 mL/h, the recovery and the purity rates were ~90% and 97%, respectively. Furthermore, Zhang et al separated rare cells from a continuous blood sample flow without any buffer flow.
30
Alongside with the development of these particle separation techniques, various nanostructure materials including nanowires, nanorods, and nanotubes of single element, oxide, and compound semiconductors have been successfully synthesized.
31-37
In a recent study, a nanostructure-based platform has been proposed to isolate specific targeted and marked cells from a cell line or from whole blood. They suggested that this nanostructure-based platform is capable of considerably improving cell separation performance due to its 3-dimensional (3D) nanotopographic feature that increases its local interactions with the surface of the cells and thus enhances its cell-capture tendency. What we can conclude from this report is that separation efficiency of greater than 90% can be achieved by trapping the targeted cells with a nanostructured substrate.
38,39
Although numerous methods have been reported for the detection and isolation of CTCs, and single-agent, multifactorial, and integrated approaches have been considered as well, the simultaneous use of separation techniques, including micropost barriers in a microfluidic channel, magnetophoretic properties, and especially nanowire-based substrate trapping methods yet remain to be investigated. In this report, we took the advantage of this combined trapping mechanism to more effectively isolate the MDA-MB231 cell lines as CTCs. In this work, we used anti-EpCAM antibodies to prove the performance of our device, which binds specifically to epithelial cells while having no binding to blood cells. Moreover, we developed a model for simulation of CTCs in a microfluidic device which employs magnetophoresis integrated with Si nanowires substrate. We further demonstrated that our proposed device can dramatically increase CTC trapping efficiency.
Materials and Methods
All chemical materials if not explicitly mentioned were purchased from Sigma-Aldrich, Germany.
Synthesis and functionalization of magnetic nanoparticles
In this work, we synthesized paramagnetic nanoparticles (PMNPs) based on the Masart method in aqueous solution of ammonia using iron salts (II) and (III).
40
In order to protect the ferrous ions oxidation, deionized (DI) water was first mixed with nitrogen gas for 30 minutes. Thereafter, 4 g of FeCl3.6H2O was dissolved with 2 g of FeCl2.4H2O in 200 mL of DI water in the presence of nitrogen gas stirring vigorously at 80°C. The solution was then stirred for 40 minutes with the same conditions, then 20 mL of NH3¯.H2O (28%) was slowly poured into the solution to reach pH 10 and stirred for another 50 minutes. Adding ammonium to the solution resulted in changing the solution color from brown to black. After the synthesized adsorbent temperature was reduced, the adsorbent was rinsed several times with ethanol until pH 7 and then dried in an oven at 105°C for 4 hours.
The PMNPs were then coated with silica through the following Stöber process.
41
PMNP solution of 0.25 M (160 mL) was provided by interspersing PMNPs in ethanol at 40°C. Just after the suspension was prepared, it was blended with 8 mL of ammonia, 15.0 mL of DI water and 1.12 mL of TEOS for 2 hours. The suspension was then exposed to ultrasound for one hour. The composite was segregated from the suspension utilizing a magnet and afterward interspersed in 60 mL of ethanol. To ameliorate the Si-O-Fe bond, the solution was held in a 60°C water bath for 6 hours. Then, it was washed several times with ethanol to neutralize its pH; and it was also collected utilizing an external magnet and desiccated in vacuum at 75°C for 10 hours. The final solution stored in an air tight vessel.
We functionalized the magnetite nanoparticles with (3-aminopropyl)-triethoxysilane (APTES, Sigma-Aldrich, USA) in the following way: 60 mL of the suspension of Fe3O4 NPs in water (3 g/L) was mixed with 60 mL of ethanol and 2.4 mL of 2% APTES v/v solution. In this process, the temperature was kept constant at 50°C and the interaction time lasted about 24 hours. Then, 1.5 mL of Fe3O4@SiO2 (90 mg/L) in water was mixed with 1.5 mL of ethanol and 65 μL of APTES (2% v/v); we maintained the temperature and time as stated in previous report.
42
Fabrication and functionalization of Si nanowires substrate together with microfluidic channel
In this work, we used chemical etching process on p-type wafers (100), which have resistivity of 10 Ωcm to create silicon nanowire (SiNW) arrays. This way is a relatively simple and favorable method to produce well-aligned SiNW arrays.
43,44
First, a 2-inch Si wafer was sliced into 2.5 cm × 1 cm, which using ultrasonic waves, they were purified in acetone, isopropyl alcohol (IPA), and DI water for 10 minutes, respectively. The cleaned wafer slices were plunged in 10 wt% hydrofluoric (HF) acid for 5 minutes to eliminate the residential oxide layer, and next treated in boiling RCA solution (H2O:NH4OH:H2O2 = 5:1:1) for 1 hour to transform the surface into a hydrophilic surface.
Silicon patterning was performed using positive resist (MICROPOSIT® Shipley1813® Photoresist) using conventional lithography. The cut wafers were first placed on the spin coater. Then, 5 mL of positive resist was resuspended on a dropper and spin at 3000 rpm for 30 seconds. After coating the wafers with a photoresist, they were placed in a contact UV lithography system. After exposure, the samples were placed in 0.1 M NaOH solution to form the desired design by the photoresist. Afterward, using an electric deposition method, a pattern of Ag film (30 nm) was coated on Si substrates at room temperature for 5 minutes in an aqueous solution containing 10% HF and AgNO3 solution 5×10 -3 M. The Ag-coated Si substrates were then plunged in an aqueous solution comprising 10% HF and 0.3% H2O2 at 27oC for 30 minutes. Eventually, the Ag metallic film residual on the Si substrates was quite lifted off by aquaregia (HCl:HNO3 = 3:1) for 1 hour, followed by amorphous etching silicone for 30 minutes in a mixture of etchant buffer oxide solution (BOE, NH4F:HF = 6:1). The sizes of the SiNWs were about 50–100 nm in diameter and 4–10 μm in height. These dimensions thoroughly depends on the size of Ag nanoparticles and the etching time, respectively.
45
Before surface functionalization, the Si patterned substrate with SiNW arrays on it were rinsed delicately with H2O2: H2SO4 (1:1) for 10 minutes to eliminate all organic compounds and contaminations from the surface. Then, using acetone, isopropyl alcohol and distilled water, we washed the substrates, respectively and then dried them in hot air. In order to sterilize the Si patterned substrate with SiNW arrays, we first immersed the Si patterned substrate in 100% ethanol for 2–3 hours and then kept it under UV irradiation overnight before use.
The surface cleaning process was performed with piranha (96% H2SO4: 30% H2O2 = 1: 1) for 10 minutes and then the surface was treated with O2 plasma for 20 seconds to form hydroxyl groups on the SiNW surface. The surface was then functionalized by a three-step process; the first step was subjected to 1% (v/v) APTES in ethanol for 30 minutes at room temperature. The second step subjected to12.5% (v/v) glutaraldehyde (GA, Sigma-Aldrich, USA) for 4 hours in distilled water and finally 50 μg/mL streptavidin (STR, Sigma-Aldrich, USA) solution in phosphate buffered saline (PBS) in an incubator at 37°C in 5% CO2 for 12 hours.
46
Design and fabrication of microfluidic channel
Briefly, the mold of the microfluidic device was formed with SU-8 photoresist on Si wafers, according to the standard protocol of photolithography. Subsequently, the polydimethylsiloxane (PDMS, Sylgard 184, Dow Corning, USA) with the mixing ratio (i.e., 10:1) was cast onto the master mold to replicate the master patterns and the device was fabricated by following a conventional procedure of soft lithography. Afterwards the cured PDMS was peeled from the master mold, and the inlets and outlets for flowing in the chemical fluids and biological specimens were cut out using a sharp puncher. The PDMS device was treated with oxygen plasma for 20 seconds, and aligned with the patterned substrate containing arrays of SiNWs and bonded together to form an irreversible seal.
47
The hybrid devices were built after a process of bonding at 65 °C on a hot plate. A standard syringe pump was connected to the inlet of the PDMS microchip by tubing and used to transited blood sample with a syringe. The reservoir was connected to the outlet through tubing.
Magnet configuration and magnetic field distribution
We put a magnetoid block of NdFeB that produces a field of 42 MGOe and dimensions of 20 mm × 20 mm × 2 mm just under the SiNWs substrate in the middle part of the microfluidic channel that contains PDMS micropores. In order to eliminate the effects of the magnetic field near the sample and buffer entry port, we placed a spacer and a gap between the magnet and the inlet microchannel. For the uptake of cancer cells labeled with MNPs (each PMNP acts as a superparamagnetic bipolar) we needed a magnetic field gradient, which was provided by the magnet in the embedded location.
We simulated the motion of the fluid, which is the blood diluted with PBS, in the presence of CTCs labeled with MNPs as well as the magnetic field applied to the cells in the microfluidic channel using a commercially available finite element method (FEM) software COMSOL. We employed the measured quantities to specify parameters in the simulation.
Breast cancer cell culture
In this study, we used the MDA-MB231 cell lines taken apart from breast tumors from standard cell banks of the National Bank of Iran (NCBI) located at the Pasteur Institute of Iran.
48
They were kept at 37oC (5% CO2, 95% air) in RPMI-1640 medium (Sigma 8758, Sigma-Aldrich, USA) supplemented with 5% fetal bovine serum (Gibco, Thermo Fisher Scientific, Waltham, MA, USA), and 1% penicillin/streptomycin (Gibco). Cells were counted with a hemacytometer and diluted in PBS to prepare a solution with approximately 2000 cells/mL.
Conjugation of antibodies to PMNPs and labeling tumor cells with the functionalized antibodies
Blood samples collected in Ethylenediaminetetraacetic acid (EDTA) tubes were distributed into conical tubes, each with 2.5 mL of blood sample. MDA-MB231 cell lines were used for spiked experiments to characterize the capture efficiency of the developed trapping system. To label tumor cells with the APTES-functionalized PMNPs, 100 μL of tumor cells was added in 2.5 mL of whole blood and incubated for 2 hours. Unbounded nanoparticles were filtered using a magnetic dx2`1`field to input only labeled tumor cells into the microfluidic channel.
Conjugation of antibodies to nanoparticles Anti-EpCAM antibody (0.1 mg/mL) was attached to the APTES-functionalized PMNPs. Firstly, 1 mL of APTES-functionalized PMNPs (1 mg/mL) was mixed with PBS (pH 7.4). Anti-EpCAM antibody was thiolated by reacting with the Traut's Reagent (2-iminothiolane, Pierce) in PBS (pH 7.4) at a molar ratio of 1:2 at 4°C for 2 hours. Last, the PMNPs and thiolated antibody were mixed in PBS at a mass ratio of PMNPs: antibody = 10:1. After 24 hours reaction at 4°C, excess antibodies were removed by centrifugation. Then, APTES-functionalized PMNPs, which were functionalized with cancer specific antibodies anti-EpCAM, were added to the blood samples to label the MDA-MB231 cells.
Sample preparation
Blood samples collected in EDTA tubes were distributed within cone-shaped tubes, each with 2.5 mL of blood sample. MDA-MB231 cell lines were used for spiked experiments to specify the capture yield of the developed trapping system. A solution with almost 200 cells (100 μL cell suspension) was spiked into 2.5 mL aliquot of blood sample. The same volume of cell suspension (100 μL) was laved on two glass slides and used as control samples. A suspension of functionalized Fe3O4 PMNPs was incubated in a strong magnetic field.
Separation process
We used a syringe pump attached to the microfluidic channel to transfer blood samples to spiked CTCs. Flow rate was 2.0 mL/h. After the labeled cell separation was performed in the microfluidic channel and the desired CTCs were stuck in the SiNWs substrate, the flushing step was performed with PBS solution to remove the undesired RBCs and WBCs. After peeling the PDMS microchip off the Si substrate, the sample slide was stocked at 4 °C before the following exploration process.
Identification process
To take SEM images of the cells stuck in the nanowires substrate before peeling off the microfluidic channel from the substrate, we injected 99% ethanol solution into the channel to immobilize the cells in the substrate and extract the intracellular water from them. Afterward, 2 mL PBS was used to wash the chip twice. After the separation step, the cells in the in vivo imaging system were analyzed using an inverter microscope connected to a CCD camera. The captured cells could be released from the microchip by PBS washing and stained with 4’,6-diamidino-2-phenylindole (DAPI), anti-CD45, and EpCAM for fluorescent imaging.
Characterization
The as-prepared products (PMNPs, SiO2-coating PMNPs and well aligned SiNWs) were characterized utilizing field-emission scanning electron microscopy (FESEM) and energy-dispersive X-ray spectroscopy (EDS) (HITACHI, S-4160), SEM (TESCAN, VEGA II), and transmission electron microscopy (TEM) (Philips, CM-30). TEM samples were provided by dropping the as-prepared products in ethanol and plunging them in an ultrasonic bath for 20 minutes, then dropping a few drops of resulting suspension, including the synthesized structures, onto a TEM grid. The selected area diffraction (SAD) patterns of a single crystal PMNPs and SiO2-coating PMNPs were taken with the same TEM instrument.
Results
Theoretical modeling and simulation
To model the behavior of cancer cells inside a microfluidic channel, some assumptions should be made for physical parameters and forces applied to the cells. A CTC is a viscoelastic object that flows in the microfluidic channel in presence of other cells and constituent particles of blood and other fluids. In addition, cell motions may be cumulative and in cellular colonies that further complicate the situation. Within the channel, various forces, such as those caused by the side walls, dams and barriers, like the embedded microposts, should be considered as well. Besides, the fluid parameters such as velocity, pressure, density, viscosity, and so on should be taken into account. All these parameters not only should be considered for cancer cells but also for all other cells in the whole blood, including platelets, WBCs, and RBCs. Practically, it is quite impossible to include all these parameters in the modeling and simulation of the motion of the cancer cells inside the microfluidic channel.
With some simplifications, to include the major forces acting on the cells and neglecting the rest, one can study the desired physical parameters of the cells. Since the blood constituents (e.g., WBCs, RBCs, and platelets) in buffer solution do not have a significant effect on the flow of cancer cells and CTCs, we can approximately model the blood in presence of EDTA and PBS as Newtonian fluid.
We first proposed the theoretical frame and numerical scheme, based on the transport processes, for prospect of magnetophoretic separation and trapping the Si nanowires substrate. In order to apply transverse force to the magnetically labeled target cells, we considered a permanent magnet perpendicular to the direction of flow. In this scheme, we considered dilute samples of cells, in which cells were almost as solid microspheres and bead-bead interactions were omitted. For CTCs and paramagnetic labeled target cells with diameters on the scale of microns, in this microfluidic system, the Pecklet number was large (ul/D), so that the diffusion and deposition time scales were much longer than other related processes (process and magnetophoresis) and could therefore be ignored.
We developed the governing equations for the flow of a typical single particle, that is, cell, PMNPs, or cell nanoparticles complex, relied on a Lagrangian particle tracking method and Newton’s Law:
where, mp and up are the mass and velocity of the particle. Fmag and Fdrag are the magnetic and drag forces confronted with the particle and Ffriction & adhesion is the force resulting from the interaction of the cell with the surface of the nanowires substrate due to the surface adhesion and the friction between the cell and the surface of the nanowires substrate.
The drag force Fdrag can be described using the Stokes drag for small spherical particles in a fluid with a small Reynolds number (Re < 1) as follows:
Here, Rp is the effective particle radius, η is the fluid viscosity, and uf is the fluid velocity.
49
The drag force is straightly proportional to the hydrodynamic radius of the particle or the cell.
The magnetic force Fmag experienced by a magnetic particle within an applied magnetic field
B
is given by the following equation:
where,
N is the number of nanoparticles on the surface of CTC or WBC, Vp is the volume of the nanoparticle, and Mp is the magnetization of the nanoparticle.
50
Neglecting the effects of the around medium on the particle magnetic virtues, the magnetic force on each PMNP is defined by,
50
where χp is the magnetic susceptibility of the nanoparticle and μ0 is the permeability of the free space.
51,52
Fig. 1 shows the scheme of the microfluidic device with a magnet placed under the interaction part of the device in which SiNWs patterned substrate is located. For a further discussion of the magnetic flux density and its distribution in the microfluidic channel see Supplementary file 1 and Fig. S1.
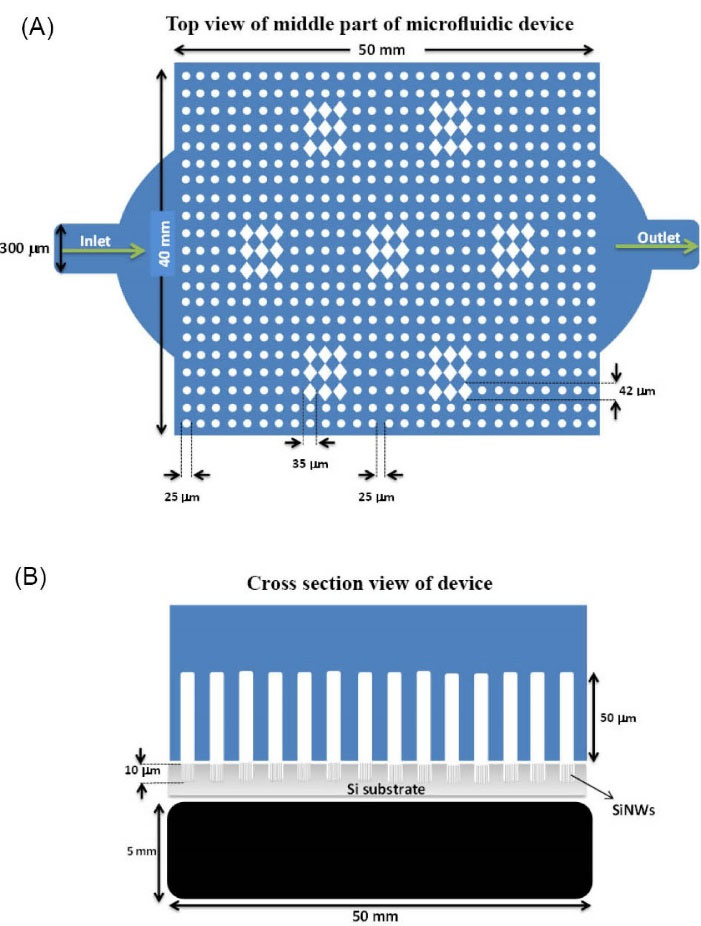
Fig. 1.
Schematic of the microfluidic device. (A) Top view of the middle part of the microfluidic device (B) Cross section of the middle part of the microfluidic device showing a magnet under the middle part of the Si nanowires substrate of the device.
.
Schematic of the microfluidic device. (A) Top view of the middle part of the microfluidic device (B) Cross section of the middle part of the microfluidic device showing a magnet under the middle part of the Si nanowires substrate of the device.
In Fig. 2A, we examined the behavior of a rigid object, namely, a cell, at a time instance under the influence of the forces generated by the Navier-Stokes fluid and the force applied by the magnetic field caused by a fixed magnet. We considered the cell to be a rigid spherical object surrounded by iron oxide spherical nanoparticles. It was assumed that the magnetic iron oxide nanoparticles cover the circular surface of the cell quite uniformly. The simulation parameters are listed in Table 1.
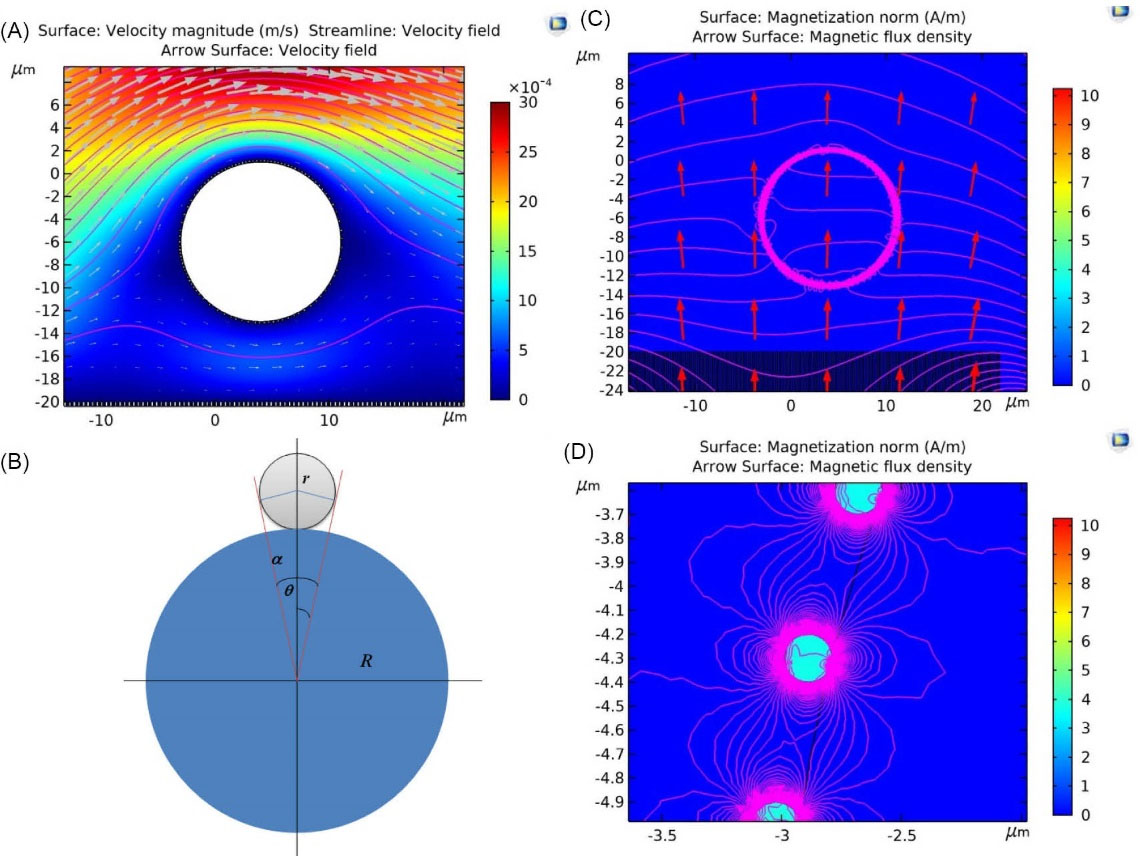
Fig. 2.
(A) The behavior of a rigid object, i.e., a cell, at a time instance under the influence of the forces generated by the Navier-Stokes fluid and the force applied by the magnetic field caused by a fixed magnet. (B) The schematic diagram for paramagnetic nanoparticles bound on circulating tumor cells and white blood cells. (C) Simulation of the magnetization and the magnetic flux density in the presence of a constant magnet with magnitude of 50 G per cell. (D) The highlighted box in (C) is magnified.
.
(A) The behavior of a rigid object, i.e., a cell, at a time instance under the influence of the forces generated by the Navier-Stokes fluid and the force applied by the magnetic field caused by a fixed magnet. (B) The schematic diagram for paramagnetic nanoparticles bound on circulating tumor cells and white blood cells. (C) Simulation of the magnetization and the magnetic flux density in the presence of a constant magnet with magnitude of 50 G per cell. (D) The highlighted box in (C) is magnified.
Table 1.
The simulation parameters of CTC flow in the microfluidics channel in presence of the magnetophoretic force and the SiNWs substrate
|
Parameter description
|
Quantity
|
Unit
|
| Overall microfluidic device length |
23 |
mm |
| Overall microfluidic device width |
5 |
mm |
| Middle part of device length |
5 |
mm |
| Middle part of device width |
4 |
mm |
| Microfluidic channel height |
50 |
µm |
| Sample inlet channel width |
100 |
µm |
| Buffer inlet channel width |
150 |
µm |
| Fluid input speed |
0.1 |
mm/s |
| Fluid inlet pressure |
105
|
Pa |
| Average density of blood |
1060 |
kg/m3
|
| The viscosity of blood at 37 °C in presence of EDTA and PBS |
~1.5 × 10⁻³
|
Pa.s |
| Viscosity of labeled cells with nanoparticles |
~5- 50 |
Pa.s |
| CTC diameter |
15 |
µm |
| WBC diameter |
5 |
µm |
| Diameter of magnetic core-shell nanoparticles on a cancer cell |
70 |
nm |
| Magnets magnetic susceptibility |
2×10⁵
|
- |
|
Effective magnetic moment of CTC (~NχpVp)
|
1.6×10⁴
|
µm3
|
|
Effective magnetic moment of WBC (~NχpVp)
|
1.8×10³
|
µm3
|
| Magnetic susceptibility of nanoparticles |
250 |
- |
| Magnetic fluid susceptibility (including blood plasma and buffer solutions) |
1 |
- |
To simplify the modeling, we assumed just a single cell and included only the part of the substrate that was directly below the cell. We also included only a portion of the magnet under the nanowire substrate to create the field. The channel height is 50 μm, which is in perfect agreement with our experimental work. The height of the vertical nanowires inside the channel is considered to be 5 μm. The diameter of each nanowire is about 200 nm. We also assumed that the diameter of the core-shell PMNPs on the cell surface is around 70 nm. Fig. 2B indicates the schematic diagram for PMNPs bound on CTC and WBC. As seen in Fig. 2B,
Assuming R = qr, where q is an integer, N is the number of the small circles viz the nanoparticles, over the large circle, which is the cells. Then calculating for a solid angle, the number of particles on the sphere is:
The average sizes of the RBCs and the MDA-MB231 are 8 µm and 20 µm, respectively. Although there are various types of leukocytes, the average size of neutrophils and lymphocytes, which accounted for most leukocytes (>75%), is around 8 µm.
53
So for the MDA-MB231 cell lines as CTC there are 362403 nanoparticles covering its surface (q ~ 300), while they are 40 803 for the WBC (q ~ 100). Although there are very rare numbers of CTCs that are smaller than WBCs, this is statistically insignificant and hence ignored in our calculation.
53
Fig. 2C and Fig. 2D show the simulations of the magnetization and the magnetic flux density due to the presence of a constant magnet with magnitude of 50 G per cell. As a result of the nonuniform magnetic field presence, the magnetophoretic force is applied to the cells tagged with MNPs and thus attracts the cells toward the substrate. Assuming that the nanoparticles adhere perfectly to the WBC and the CTC, the magnetic moment of the CTC is about 9 times larger than that of the WBC, so its attraction by the magnetic field is much higher. Since the mass of the CTC is also much higher than the WBC, the number of CTCs falling down the channel will be much higher.
For a further discussion on the2D simulation of fluid velocity (blood cells and buffer) in the microfluidic channel around the microposts and the nanowires substrate refer to the supplementary information and see Fig. S2 (Supplementary file 1) and Video S1 (Supplementary file 2).
Experimental results
Fig. 3A shows FESEM images of Fe3O4 PMNPs that were not yet coated with silica. Due to the morphological considerations, what seen in these images are very fine-grained nanoparticles. The images taken with the transmission electron microscope (TEM) are more precise and distinct, as shown in Fig. 3B. The diameter of the nanoparticles in the TEM images was around 5-20 nm. The inset image in Fig. 3B was the selected area diffraction (SAD) pattern that confirmed the paramagnetic nanoparticles were single crystal. Although iron oxide II and III nanoparticles were biocompatible, for preventing damage to the cell membrane and hence jeopardizing the cell viability and further to physically and chemically protect the nanoparticles against environmental factors such as loss of magnetic properties in the presence of salts in a saline solution that was required for the cell viability, there was a need for a silica coating on the surface of the PMNPs. Fig. 3C indicates the SEM image of the silica-coated Fe3O4 PMNPs where the silica coating created a fully spherical shell around the PMNPs, where the diameter of the Fe3O4 PMNPs with the silica shell was around 60-180 nm. Fig. 3D indicates the TEM image of the core-shell PMNPs. In this figure, the full spherical iron oxide nanoparticles were observed. Fig. 3E shows the FESEM image of the Fe3O4 PMNPs with silica coating having a pyramid shape and right- angle corner. The TEM image is shown in Fig. 3F. The inset image in Fig. 3F indicates the SAD pattern of PMNPs with single crystalline structure. As the diffraction pattern confirmed, the crystal structure of these nanoparticles was single crystalline. For a further discussion on EDX analysis of the sample of silica-coated PMNPs in Fig. 3 and the hysteresis loops measured for non-coated and silica-coated magnetite nanoparticles, refer to the supplementary information and Fig. S4.
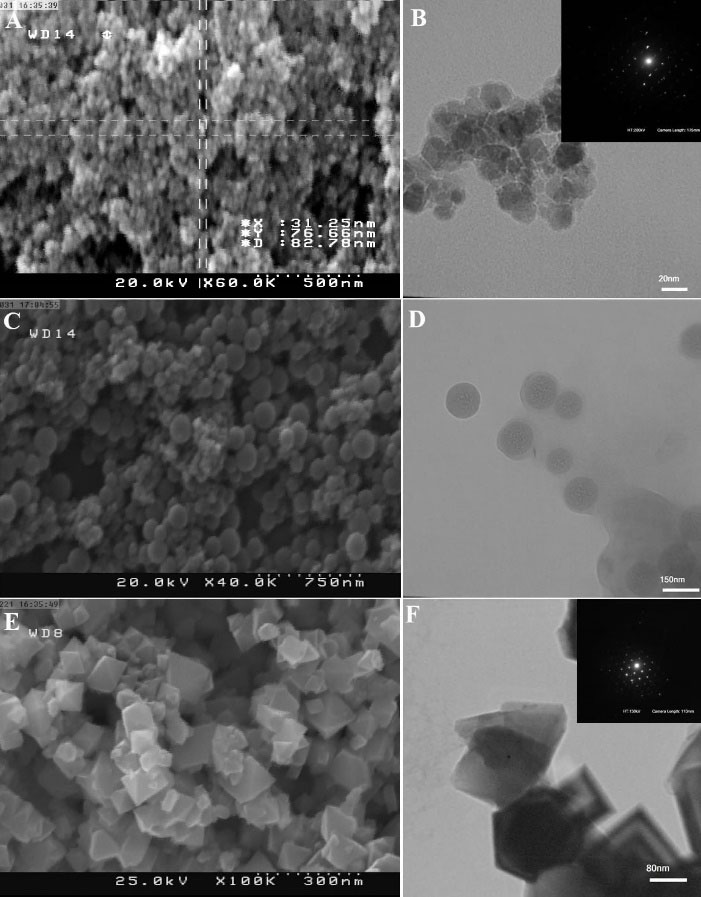
Fig. 3.
(A) Field-emission scanning electron microscopy (FESEM) image of the silica-free Fe3O4 paramagnetic nanoparticles (PMNPs). (B) Transmission electron microscopy (TEM) image of the Fe3O4 PMNPs. The diameter of the synthesized Fe3O4 PMNPs is around 5-20 nm. The inset image indicates the selected area diffraction (SAD) pattern of the as-synthesized Fe3O4 PMNPs. (C) FESEM image of the silica-coated Fe3O4 PMNPs. The diameter of the Fe3O4 PMNPs with the silica coating is around 60-180 nm. (D) TEM image of the core-shell PMNPs. (E) FESEM image of the Fe3O4 PMNPs with the silica coating having a pyramid shape and right-angle corners. (F) TEM image of these nanoparticles where the inset indicates the SAD pattern of PMNPs with single crystalline structure.
.
(A) Field-emission scanning electron microscopy (FESEM) image of the silica-free Fe3O4 paramagnetic nanoparticles (PMNPs). (B) Transmission electron microscopy (TEM) image of the Fe3O4 PMNPs. The diameter of the synthesized Fe3O4 PMNPs is around 5-20 nm. The inset image indicates the selected area diffraction (SAD) pattern of the as-synthesized Fe3O4 PMNPs. (C) FESEM image of the silica-coated Fe3O4 PMNPs. The diameter of the Fe3O4 PMNPs with the silica coating is around 60-180 nm. (D) TEM image of the core-shell PMNPs. (E) FESEM image of the Fe3O4 PMNPs with the silica coating having a pyramid shape and right-angle corners. (F) TEM image of these nanoparticles where the inset indicates the SAD pattern of PMNPs with single crystalline structure.
In Fig. 4, we showed a schematic representation of the functionalized antibodies with the Fe3O4 PMNPs and then surface functionalization of SiNWs with streptavidin. As Fig. 4A shows, after that the nanoparticles were coated with silica, biocompatible materials that had the potential to form antibody-antigen bonds with cellular receptors should have been utilized to subsequently enable biological function with the cell membrane.
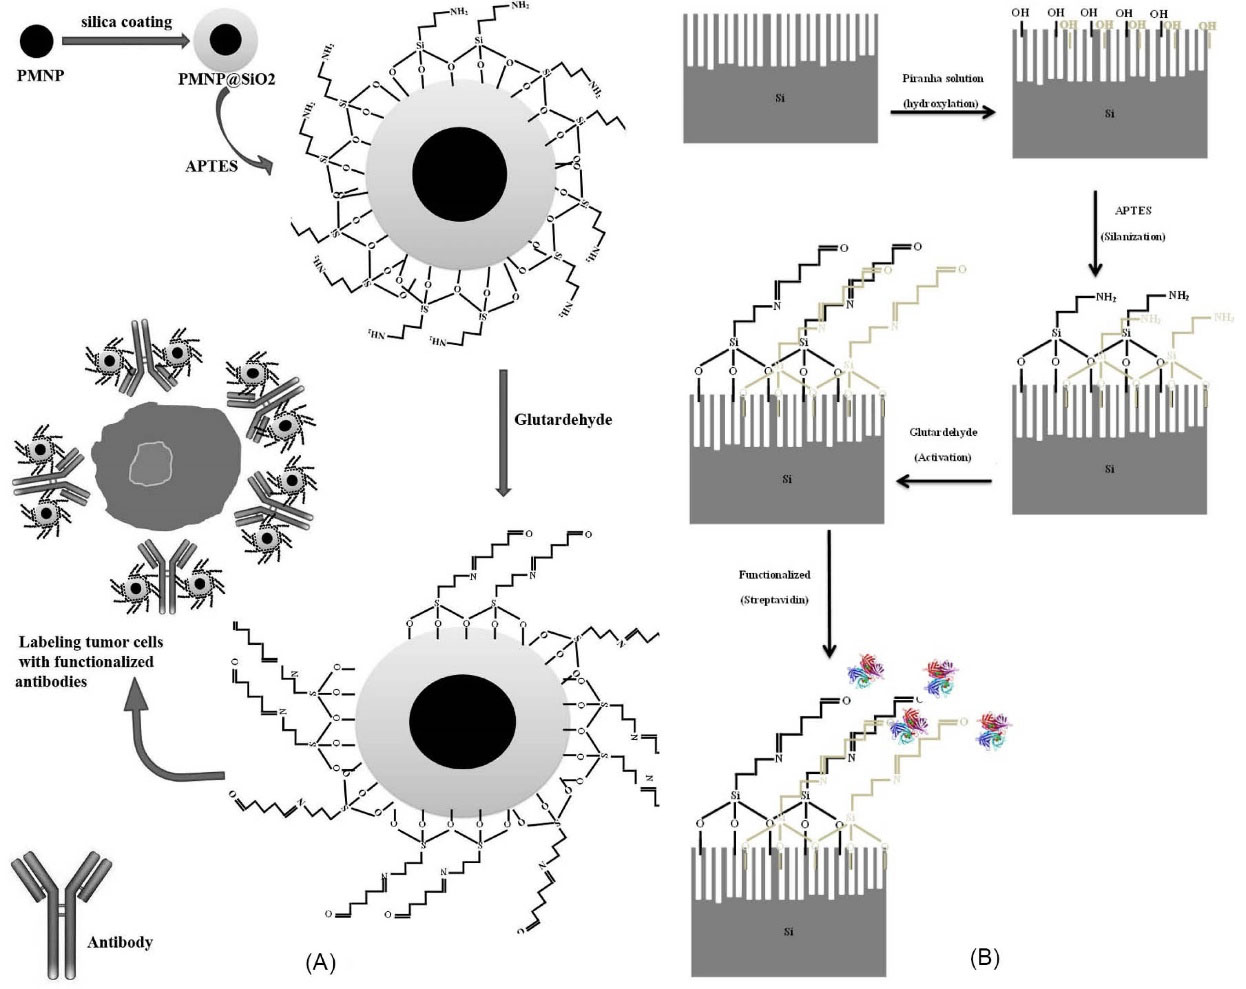
Fig. 4.
(A) Schematic representation of the surface functionalization of antibodies with the Fe3O4 paramagnetic nanoparticles and ultimately the tumor cell labeled with the functionalized antibodies is illustrated. (B) Schematic image of the process of the surface functionalization of the Si nanowires by streptavidin.
.
(A) Schematic representation of the surface functionalization of antibodies with the Fe3O4 paramagnetic nanoparticles and ultimately the tumor cell labeled with the functionalized antibodies is illustrated. (B) Schematic image of the process of the surface functionalization of the Si nanowires by streptavidin.
After that the nanoparticles were coated with TEOS, the surface silanization was applied by APTES. We then used glutaraldehyde to activate the surface of the coated and silanizated nanoparticles and then functionalize the antibody anti-EpCAM with the PMNPs. Finally, the tumor cells (MDA-MB231 cells here) were labeled with functionalized antibodies for magnetophoretic trapping. Fig. 4B indicates the hydroxylated nanowires with the solution of piranha after the desired design on the silicon substrate. They were then silanized with APTES followed by glutardehyde activation, and finally, with the use of streptavidin (STR), the nanowires were functionalized.
In Fig. 5A, top view, and in Fig. 5B, tilted view of the SEM images of the well-aligned vertical SiNWs on the Si substrate in the middle part of the microfluidic channel are shown. The diameter of the nanowires was roughly 100-200 nm and their height was larger than 10 µm. Figs. 5C and 5D show the top view (80°) and Figs. 5E and 5F show the tilted view (30°) SEM images of the middle part of the silicon substrate with low and high magnification. The middle part of the substrate was designed to have circular pillars or discs with the radius of ~15 µm and the spacing between these discs was large enough to accommodate for a cell size of ~20 µm. These spacings were populated with vertical SiNWs to more efficiently capture CTCs. Because of the embedded magnet under this section, cancer cells labeled with functionalized magnetic nanoparticles were effectively pulled toward the substrate and trapped in the nanowires.
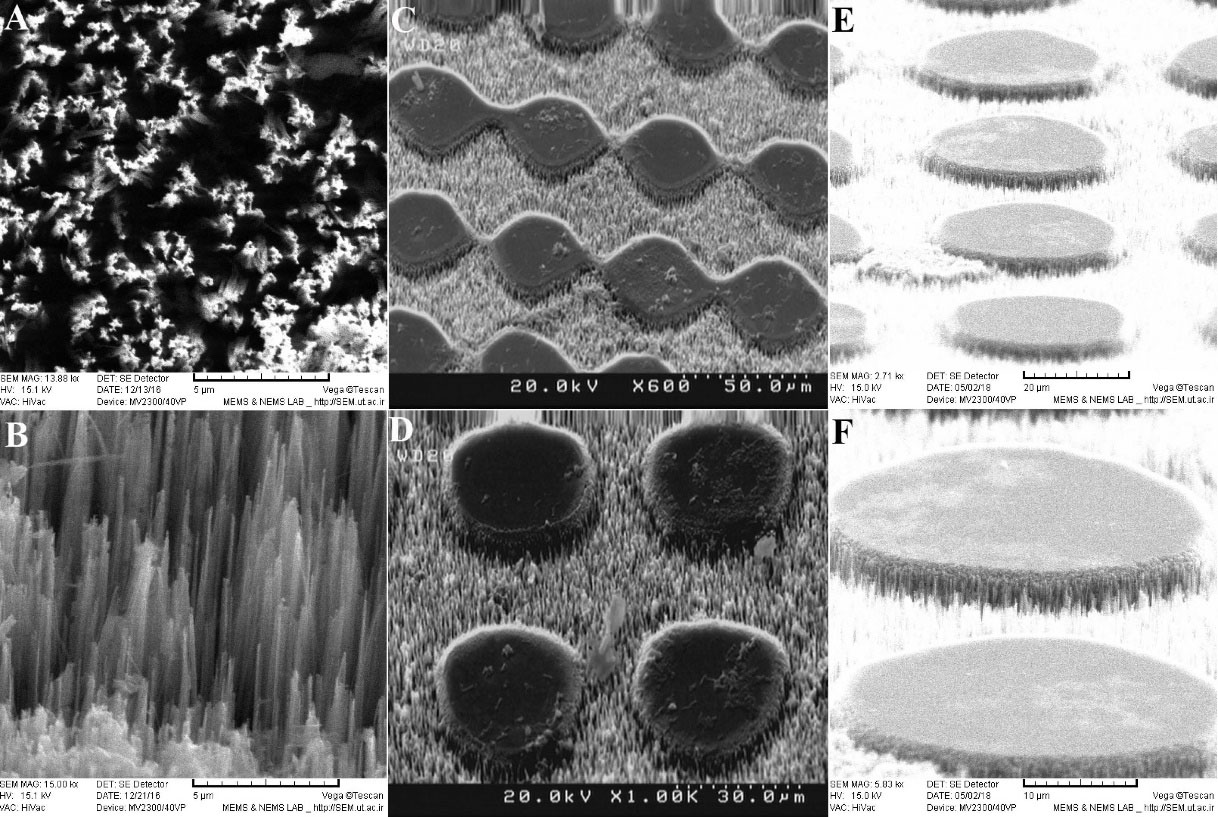
Fig. 5.
(A) Top view and (B) the cross-section of well-aligned vertical nanowires on the Si substrate with high magnification. (C) and (D) Top view (80°) scanning electron microscopy (SEM) images of the middle part of the Si substrate with well-aligned Si nanowires (SiNWs) with low and high magnification, respectively. (E) and (F) Tilted view (30°) SEM images of the middle part of the Si substrate with well-aligned SiNWs with low and high magnification, respectively.
.
(A) Top view and (B) the cross-section of well-aligned vertical nanowires on the Si substrate with high magnification. (C) and (D) Top view (80°) scanning electron microscopy (SEM) images of the middle part of the Si substrate with well-aligned Si nanowires (SiNWs) with low and high magnification, respectively. (E) and (F) Tilted view (30°) SEM images of the middle part of the Si substrate with well-aligned SiNWs with low and high magnification, respectively.
Fig. 6 shows the side view and the top view of the middle portion of the microfluidic device which was the core of the interaction between the magnetic field, the microposts, and the SiNWs. Figs. 6A-6C indicate the side view SEM images of microposts from low to high resolution. The height of the microposts in the middle part was about 46 µm. Fig. 6D shows the low-resolution image of microposts and Fig. 6E shows the high-resolution image of microposts with a circular cross-section of less than 25 µm. Fig. 6F indicates the high-resolution, rhombus image of microposts in which the small and large diagonals of rhombus are 35 µm and 42 µm, respectively. Microposts created by PDMS caused cells to move in certain directions at specified conditions. In addition, it effectively displaced CTCs in specified paths. Mreover, given that some microposts were not in full contact with the surface, they caused CTCs to become trapped below these microposts or close to the magnetic field and eventually trapped by sharp tips of nanowires. Here, however, the impression may arise that this is due to the defect during demolding of PDMS channel from SU-8 master as some part of PDMS microposts stuck inside master, but in fact, this is something that was desirable and we had deliberately created it.
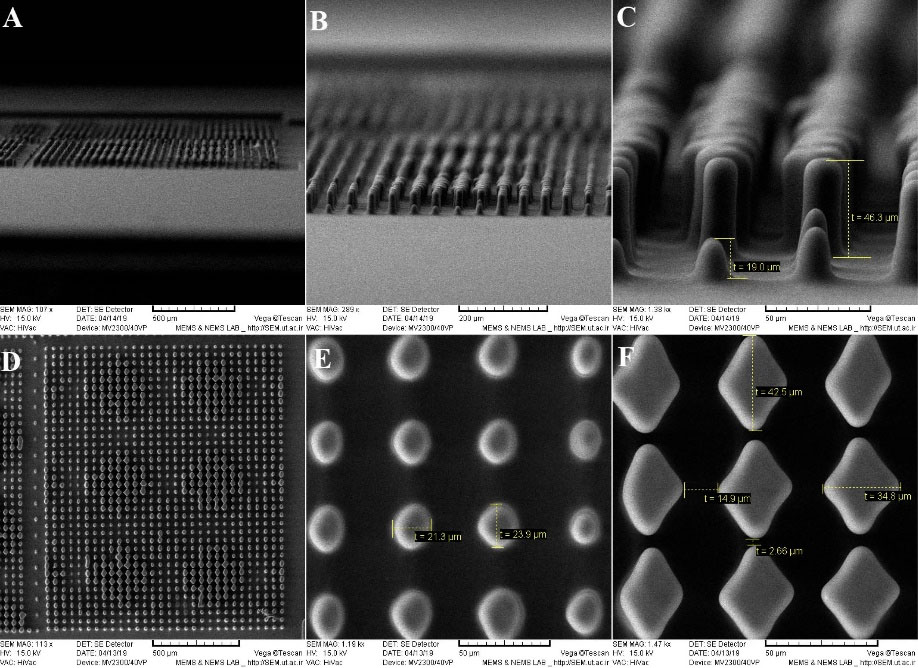
Fig. 6.
(A)-(C) Side view scanning electron microscopy (SEM) images of microposts from low to high resolution. The height of the microposts in the middle part is about 46 micron. (D) Low-resolution SEM images of microposts (E) High-resolution SEM image of microposts with a circular cross-section of less than 25 micron. (F) High-resolution rhombus SEM image of microposts which the small and large diagonal of rhombus are 35 and 42 micron, respectively.
.
(A)-(C) Side view scanning electron microscopy (SEM) images of microposts from low to high resolution. The height of the microposts in the middle part is about 46 micron. (D) Low-resolution SEM images of microposts (E) High-resolution SEM image of microposts with a circular cross-section of less than 25 micron. (F) High-resolution rhombus SEM image of microposts which the small and large diagonal of rhombus are 35 and 42 micron, respectively.
Figs. 7A and 7C show the top view SEM images of the trapping region on the SiNWs substrate inside the microfluidic channel. It is clearly seen that the CTCs have been stuck on the nanowires substrate and stayed there. Figs. 7D and 7F show the SEM images with different magnifications of the tilted view of cancer cells trapped on the nanowires substrate microfluidic channel. A previous work has also used SEM analysis to quantify the morphological properties of A549 cells bound to the SiNW substrate using rapid cryopreservation.
46,54
Fig. 7G shows the SEM image of the cancer cells with the magnetic nanoparticles covering its surface. It is worth noting that the blood cells can also be trapped in this region, however due to the previous surface functionalization mainly the cancer cells that are also larger in size are trapped. Fig. 7H shows the SEM image of cancer cells trapped on a functional nanowire substrate on which the magnetic nanoparticles also have ligands. Figs. 7I and 7J show the SEM images to compare trapping of CTCs with RBCs or WBCs. As shown in these pictures, the size of the CTCs was 3-4 times larger than that of the WBCs or RBCs. Although there was a chance for WBCs to be labeled with magnetic nanoparticles and dragged by the field toward the nanowires substrate, the structural morphology of the RBCs prevented binding to the nanoparticles due to the lack of filopodia.
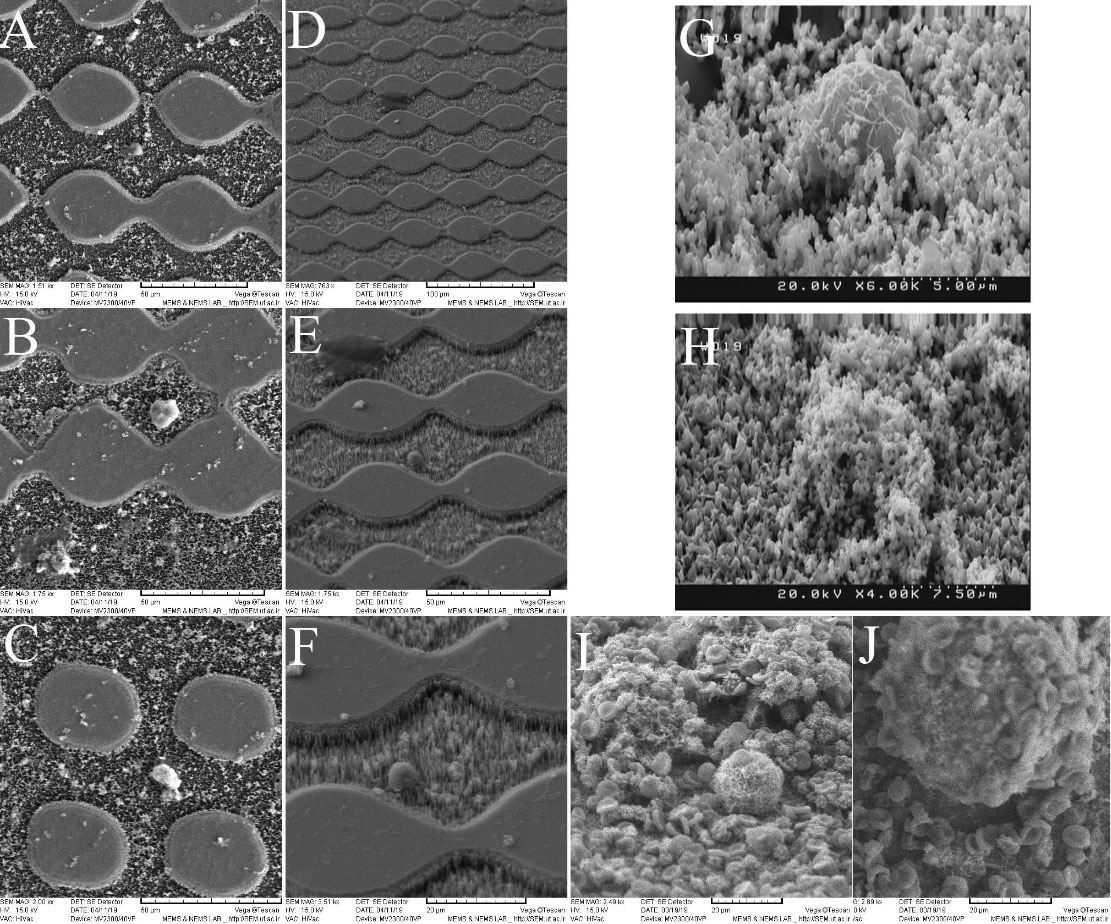
Fig. 7.
(A)-(C) Top view scanning electron microscopy (SEM) images of the circulating tumor cells (CTCs) trapped on the Si nanowires substrate in the microfluidic channel. (D-F) Low to high magnifications SEM images of the tilted view of cancer cells trapped on the nanowires substrate microfluidic channel. (G) The SEM image of cancer cells with the magnetic nanoparticles covering its surface. (H) The SEM image of cancer cells trapped on a functional nanowires substrate on which the magnetic nanoparticles also have ligands. (I-J) Low and high magnification SEM images to compare trapping of CTCs with blood cells.
.
(A)-(C) Top view scanning electron microscopy (SEM) images of the circulating tumor cells (CTCs) trapped on the Si nanowires substrate in the microfluidic channel. (D-F) Low to high magnifications SEM images of the tilted view of cancer cells trapped on the nanowires substrate microfluidic channel. (G) The SEM image of cancer cells with the magnetic nanoparticles covering its surface. (H) The SEM image of cancer cells trapped on a functional nanowires substrate on which the magnetic nanoparticles also have ligands. (I-J) Low and high magnification SEM images to compare trapping of CTCs with blood cells.
To further validate our device, we tried some spiked blood samples made by mixing pre-counted MDA-MB231 cancer cells with the blood taken from healthy applicants. Then a suspension of anti-EpCAM conjugated PMNPs (100 mL, 0.1 mg/mL) was enhanced into each blood sample. After incubation for 2 hours at 23°C, free PMNPs were eliminated by centrifugation. The cells resuspended in 2 mL PBS and then pumped into the microfluidic channel through the magnetic field. The extricated cells could be recognized using fluorescent staining to specify cancer cells from WBCs. In our experiment, the cells were stained with DAPI, anti-CD45, and anti-EpCAM, which are specific for nucleated cells, WBCs, and epithelial cells, respectively.
Fig. 8 indicates the dark field and the fluorescent images of MDA-MB231 cells and WBCs at the inlet and in the sample taken out from the outlet. The selected sample was specifically stained with DAPI (blue), anti-CD45 (red), and anti-EpCAM (green) markers. Fig. 8A shows the whole blood sample with MDA-MB231 cells when injected into the microfluidic channel. Fig. 8B indicates the absence of MDA-MB231 cells at the outlet of the microfluidic channel confirming that the microfluidic device integrated with SiNWs had an excellent efficiency for trapping CTCs.
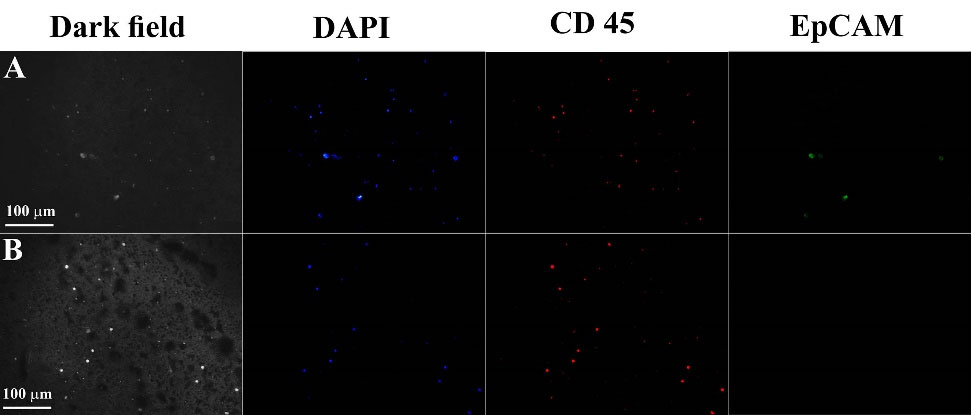
Fig. 8.
Dark field and fluorescent images of MDA-MB231 cells and white blood cells at the inlet, in the middle of the microfluidic channel, and in the sample taken out from the outlet. The selected sample is specifically stained with 4′,6-diamidino-2-phenylindole (DAPI) (blue), CD45 (red), and Epithelial Cell Adhesion Molecule (EpCAM) (green) markers. (A) Whole blood sample with MDA-MB231 cells when injected into the microfluidic channel. (B) The absence of MDA-MB231 cells at the outlet of the microfluidic channel confirms that the microfluidic device integrated with Si nanowires has an excellent efficiency for trapping circulating tumor cells.
.
Dark field and fluorescent images of MDA-MB231 cells and white blood cells at the inlet, in the middle of the microfluidic channel, and in the sample taken out from the outlet. The selected sample is specifically stained with 4′,6-diamidino-2-phenylindole (DAPI) (blue), CD45 (red), and Epithelial Cell Adhesion Molecule (EpCAM) (green) markers. (A) Whole blood sample with MDA-MB231 cells when injected into the microfluidic channel. (B) The absence of MDA-MB231 cells at the outlet of the microfluidic channel confirms that the microfluidic device integrated with Si nanowires has an excellent efficiency for trapping circulating tumor cells.
According to the numerous experiments performed and different enumerations with the same method as in Fig. 8, the statistical census results were obtained and shown in Fig. 9. We prepared four different configurations to evaluate the functionality of the device and to quantify the cell trapping. Two arrangements were made without the use of magnetic field, and two arrangements were made using magnetic field for capture. Fig. 9A shows the total number of CTCs trapped per the total number of CTCs entered into each microfluidic device. Based on the data in this panel, we found a strong correlation between the number of CTCs trapped in the device and the number of CTCs in whole blood (for Si substrate with micropost: standard deviation, σ =105.7098, coefficient of determination, r2= 0.9957and P value < 0.00001; for SiNWs substrate with micropost: σ = 124.9471, r2= 0.9925 and P value < 0.00001; for Si substrate with micropost plus magnetophoresis: σ =158.2901, r2= 0.9998 and P value < 0.00001; for SiNWs substrate with micropost plus magnetophoresis: σ = 180.0405, r2= 0.9998 and P value < 0.00001). Figs. 9B and 9C show the performance percentage of each device. In Fig. 9B, from statistical analysis, we found σ = 1.6330 and P value = 0.0116 for Si substrate with micropost; σ = 1.3273 and P-value = 0.009 for SiNWs substrate with micropost; σ = 3.7862 and P value < 0.00001 for Si substrate with micropost plus magnetophoresis; and σ = 1.6990 and P value = 0.00011 for SiNWs substrate with micropost plus magnetophoresis.
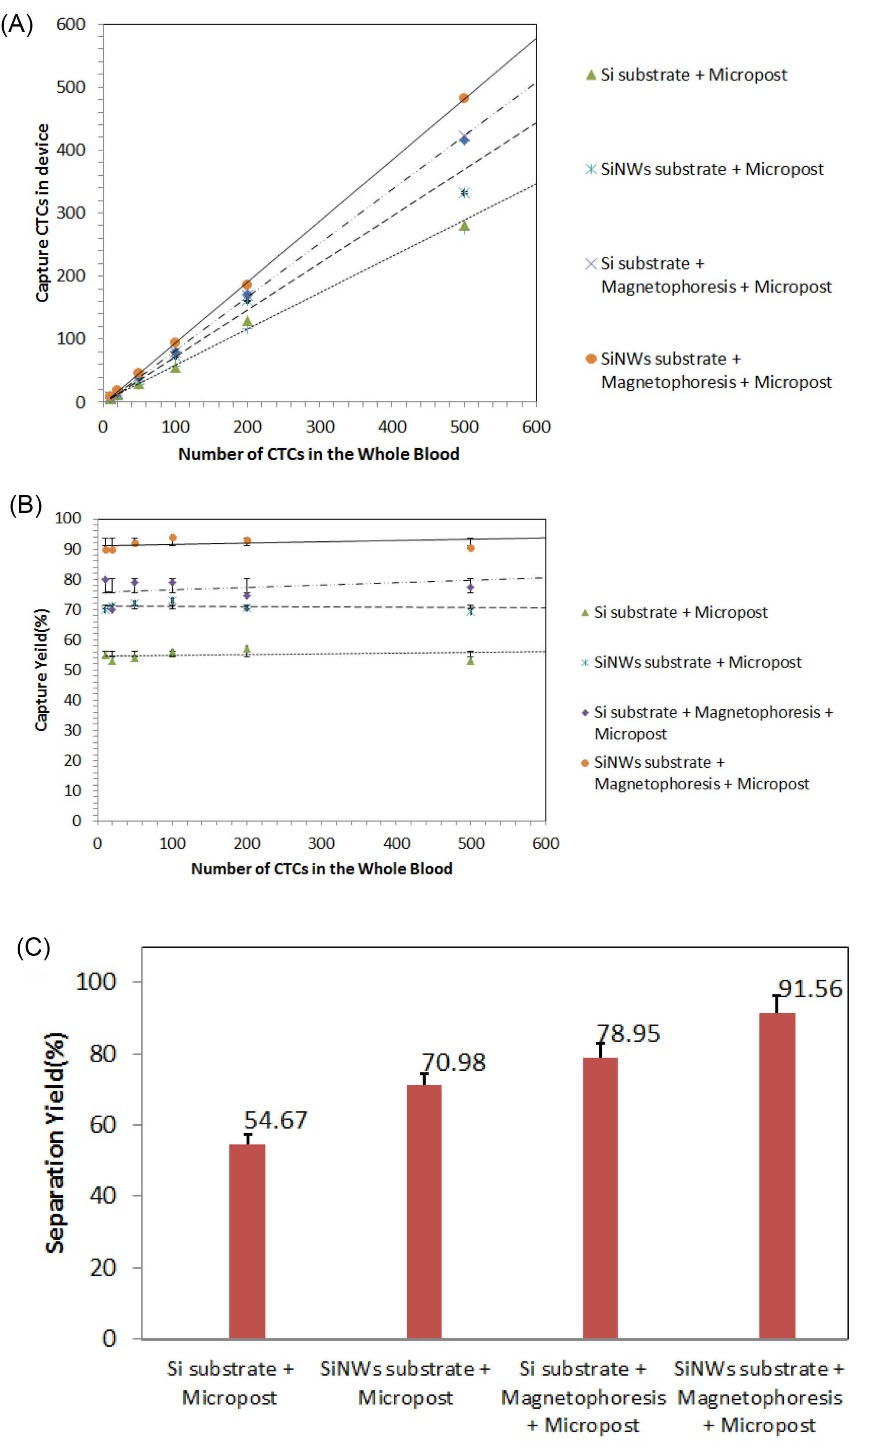
Fig. 9.
(A) The total number of circulating tumor cells (CTCs) trapped per the total number of CTCs entered into each microfluidic device. For all configuration r2 > 0.99 and P value < 0.00001. (B-C) The performance percentages of each device. In (B) for all configuration P value < 0.005.
.
(A) The total number of circulating tumor cells (CTCs) trapped per the total number of CTCs entered into each microfluidic device. For all configuration r2 > 0.99 and P value < 0.00001. (B-C) The performance percentages of each device. In (B) for all configuration P value < 0.005.
Discussion
For the numerical simulation, we considered the interaction between the drag and magnetic forces on the paramagnetic labeled target cells in the fluid as well as the interaction of these two forces with the adhesive forces and the surface friction of the nanowires on the substrate. The ratio of these forces is a function of the cell type (i.e., size) and the amount of magnetic labelling, which is the number of PMNPs bound to target cells. Magnetically labeled cells are modelled as spheres with an “effective” drag radius and magnetic susceptibility proportional to the number of bound nanoparticles.
Based on the simulation, when the vertical distance from the substrate decreases, the magnetic field strength increases, and the maximum field strength happens at the two ends of the magnet. Besides, the microposts act as barriers and result in fluid flow fluctuation above the SiNWs substrate and cause the cells to be pulled down, preparing them to be trapped by the magnetophoretic force and capturing them through the friction and adhesion with the SiNWs. In other words, the cells encounter two obstacles along the channel. One is the SiNWs embedded in the bottom of the channel and the other is the magnetic force applied to the PMNPs covering the cells. The embedded arrangement causes the magnetization to first form on the nanoparticles and eventually on the cells and attracts them toward the nanowires substrate. After the cells are pulled down to the nanowires substrate, the rough surface of the nanowires causes the cell membrane to stick in the nanowires and be trapped there. It is worth mentioning that although the fluid velocity increases below the microposts, the cells will fall further due to their morphologies and their dimensions. Ultimately, this configuration can increase the efficiency of trapping.
Based on the images taken with the electron microscope, the size of the CTCs was three times that of the WBCs. Assuming that the nanoparticles adhere perfectly to the WBCs and the CTCs, the magnetic moment of the CTCs was almost one order of magnitude larger than that of the WBCs, and since the mass of the CTCs was also much higher, the number of CTCs falling down through the channel would be much higher. Though there were very rare numbers of the CTCs that were smaller than the WBCs, this was statistically insignificant and hence was ignored in our calculation. We also would like to add that given the size of the RBCs, we expected them not to be trapped in this way.
Per experimental validation, we observed that almost all of the CTCs were trapped on the SiNWs substrate within the region where the magnetophoresis was effectively applied. Based on the observations, there was much less number of the WBCs (<10%) that were trapped. In the case of flat substrates, although CTCs and WBCs were attracted toward the substrate, since there was no friction or adhesion to the nanowires, they slid on the surface of the substrate and finally exited the channel.
If we increased the intensity of the magnetic field, the probability of the CTCs being trapped at the beginning of the channel would increase and thus there was a chance of clogging. At the same time, the number of the trapped WBCs was also increasing. Besides, the choice of a strong magnetic field required very large magnets, which practically imposed many limitations on both the design of the device and on the measurements of the cellular trapping. On the opposite side, if we chose a weak magnetic field or increased the velocity of the fluid flow, the trapping rate would diminish and most of the cells would exit the channel.
The surface functionalization enables strong biochemical linkage between the surface of the nanowires and the cells labeled with the PMNPs and results in the trapping with higher selectivity. It has been previously shown that BT-20 breast cancer cell-line strongly stuck in the STR-SiNWs by cell filopodia, causing the SiNWs to bend toward the center of the cells.
55
Furthermore, the magnetic nanoparticles can increase the effective surface area for the CTCs binding.
56
According to Fig. 5, the tips of the nanowires were sharp and straight. When the magnetic nanoparticles covering the surface of the CTCs drag toward the SiNWs by the magnet, these sharp nanometer tips penetrate the cell membrane and cross with the cell’s filopodia, eventually making the cells to be stuck there. It is well understood that the penetration efficiency would be reduced if the nanowires were inclined or lying on the substrate, thus resulting in a lower efficiency of CTC trapping. The Si substrate has very tall nanowires to capture the cancer cells before entering the middle part of the channel where the magnetic field can boost the cell trapping with the nanowires. We would rather mention that other blood components, like the WBCs, can also be trapped in this process; but due to the previous functionalization process only the CTCs are selectively trapped and they are isolated from the WBCs.
Research Highlights
What is the current knowledge?
√ One of the challenges in diagnostic cancer research is the problem of trapping and identifying CTCs in the bloodstream.
√ Effective trapping is one of the critical issues in clinical research in this field to be accurate with minimal use of expensive antibodies and biomarkers.
√ Some antibodies that specifically bind to epithelial cells can be used to diagnose tumor cells.
What is new here?
√ The magnetophoretic force integrated with Si nanowires was modeled and simulated in a microfluidic device.
√ Combined trapping techniques, including micropost barriers, magnetophoresis, and especially nanowire-based substrates were used to isolate and trap CTCs more effectively.
√ The performance of the device was proved with Anti-EpCAM antibody which specifically bonded to epithelial cells but not to blood cells.
Conclusion
To identify and trap rare number of CTCs in the blood, one valid and mature technique that has been developed over the years is the magnetophoresis-based separation in a microfluidic channel. Here, a more advanced technique was demonstrated that combined the magnetophoresis with a SiNWs substrate in a microfluidic device to more effectively trap and isolate the CTCs in the blood. The proposed device helped eliminating the need for antibody affinity or specificity markers that are otherwise required in most of the earlier techniques.
We developed a numerical scheme to simulate the drag and the magnetic forces applied to the cells labeled with PMNPs inside the fluid and analyze their interaction with the other two forces of the adhesion and the surface friction of the nanowires on the substrate. Our simulation suggested that the integrated device results in almost all of the CTCs being trapped on the SiNWs substrate, while trapping with a bulk substrate and with the magnetophoretic force alone is not promising.
In this report, we took advantage of the combined trapping technique, including micropost barriers, magnetophoresis, and especially nanowires-based substrate to more effectively isolate and trap the CTCs. For the experimental validation, we used anti-EpCAM antibody for the specific binding of PMNPs to tumor cells. Through this integrated approach, in the middle part of this microfluidic device, a series of microposts were designed that in addition to slowing down the movement of the cells, directed them to the bottom of the microfluidic channel. Besides microposts, we labeled cancer cells with anti-EpCAM conjugated with PMNPs. As a result of the nonuniform magnetic field presence, the magnetophoretic force was applied to the cells tagged with PMNPs and thus attracted the cells toward the SiNWs substrate. Using this method and by statistically counting well, we showed that our integrated technique has excellent performance and results of the trapping efficiency of above 90%, being about 12% more efficient than a flat silicon substrate with the magnetophoresis.
Acknowledgements
The authors would like to thank the Nano-bioelectronics Laboratory and the Thin Film Laboratory, Faculty of Electrical and Computer Engineering, University of Tehran, for their contribution to the research. We also would like to acknowledge the efforts of Atin Bakhshi and Ehsan Hosseininasab.
Funding sources
There is no funding.
Ethical statement
This article does not comprise any research and studies involving animals or human participants accomplished by any of the authors.
Competing interests
The authors announced and confirmed no conflict of interests in publishing this paper.
Authors’ contribution
VG conceptualized and presented the original idea. He simulated, designed, and fabricated the microfluidic devices. He Also drafted and wrote the manuscript. MB was the first supervisor, who prepared some of the study materials. Moreover, he reviewed and edited the manuscript. MF was the second supervisor, who prepared some of the study materials and provided some of the equipment in the Lab.
Supplementary Materials
Supplementary file 1 contains Figs. S1- S4.
(pdf)
Supplementary file 2 contains Video S1.
(avi)
References
- Cristofanilli M. The biological information obtainable from circulating tumor cells. Breast 2009; 18:S38-S40. doi: 10.1016/S0960-9776(09)70270-X [Crossref] [ Google Scholar]
- Allen JE, El-Deiry WS. Circulating tumor cells and colorectal cancer. Curr Colorectal Cancer Rep 2010; 6:212-220. doi: 10.1007/s11888-010-0069-7 [Crossref] [ Google Scholar]
- Danila DC, Fleisher M, Scher H I. Circulating Tumor Cells as Biomarkers in Prostate Cancer. Clin Cancer Res 2011; 17:3903-3912. doi: 10.1158/1078-0432.CCR-10-2650 [Crossref] [ Google Scholar]
- Meropol N J. The significance of circulating tumor cells as prognostic markers for colon cancer. Clin Adv Hematol Oncol 2009; 7:247-248. [ Google Scholar]
- Yu M, Bardia A, Wittner B, Stott SL, Smas ME, Ting DT. Circulating breast tumor cells exhibit dynamic changes in epithelial and mesenchymal composition. Science 2013; 339:580-584. doi: 10.1126/science.1228522 [Crossref] [ Google Scholar]
- Dalum GV, Holland L. Terstappen LWMetastasis and circulating tumor cells. J Int Fed Clin Chem Lab Med 2012; 23:1-11. [ Google Scholar]
- Miller MC, Doyle GV, Terstappen LW. Significance of circulating tumor cells detected by the CellSearch system in patients with metastatic breast colorectal and prostate cancer. J Oncol 2010; 2010:617421. doi: 10.1155/2010/617421 [Crossref] [ Google Scholar]
- Bonnomet A, Syne L, Brysse A, Feyereisen E, Thompson EW, Noel A. A dynamic in vivo model of epithelial-to-mesenchymal transitions in circulating tumor cells and metastases of breast cancer. Oncogene 2012; 31:3741-3753. doi: 10.1038/onc.2011.54 [Crossref] [ Google Scholar]
- Huang T, Jia CP, Yang J, Sun W, Wang W, Zhang H. Highly sensitive enumeration of circulating tumor cells in lung cancer patients using a size-based filtration microfluidic chip. Biosens Bioelectron 2014; 51:213-218. doi: 10.1016/j.bios.2013.07.044 [Crossref] [ Google Scholar]
- Stott SL, Hsu CH, Tsukrov DI, Yu M, Miyamoto DT, Waltman BA. Isolation of circulating tumor cells using a microvortex-generating herringbone-chip. Proc Natl Acad Sci U S A 2010; 107:18392. [ Google Scholar]
- Talasaz AH, Powell AA, Huber DE, Berbee JG, Roh KH, Yu W. Isolating highly enriched populations of circulating epithelial cells and other rare cells from blood using a magnetic sweeper device. Proc Natl Acad Sci U S A 2009; 106:3970. [ Google Scholar]
- Lee SK, Kim GS, Wu Y, Kim DJ, Lu Y, Kwak M. Nanowire substrate-based laser scanning cytometry for quantitation of circulating tumor cells. Nano Lett 2012; 12:2697-2704. doi: 10.1021/nl2041707 [Crossref] [ Google Scholar]
- Khoo BL, Chaudhuri PK, Ramalingam N, Tan DS, Lim CT, Warkiani ME. Single-cell profiling approaches to probing tumor heterogeneity. Int J Cancer 2016; 139:243-255. doi: 10.1002/ijc.30006 [Crossref] [ Google Scholar]
- Kallergi G, Papadaki MA, Politaki E, Mavroudis D, Georgoulias V, Agelaki S. Epithelial to mesenchymal transition markers expressed in circulating tumour cells of early and metastatic breast cancer patients. Breast Cancer Res 2011; 13:1-11. doi: 10.1186/bcr2896 [Crossref] [ Google Scholar]
- Crowley TA, Pizziconi V. Isolation of plasma from whole blood using planar microfilters for lab-on-a-chip applications. Lab Chip 2005; 5:922-929. doi: 10.1039/b502930a [Crossref] [ Google Scholar]
- Zheng S, Lin H, Liu J, Balic M, Datar R, Cote RJ, Tai Y. Membrane microfilter device for selective capture, electrolysis and genomic analysis of human circulating tumor cells. J Chromatogr A 2007; 1162:154-161. doi: 10.1016/j.chroma.2007.05.064 [Crossref] [ Google Scholar]
- Kuo JS, Zhao Y, Schiro PG, Ng L, Lim DSW, Shelby JP, Chiu DT. Deformability considerations in filtration of biological cells. Lab Chip 2010; 10:837-842. doi: 10.1039/b922301k [Crossref] [ Google Scholar]
- Yamada M, Nakashima M, Seki M. Pinched flow fractionation: continuous size separation of particles utilizing a laminar flow profile in a pinched microchannel. Anal Chem 2004; 76:5465-5471. doi: 10.1021/ac049863r [Crossref] [ Google Scholar]
- Vykoukal DM, Gascoyne PR, Vykoukal J. Dielectric characterization of complete mononuclear and polymorphonuclear blood cell subpopulations for label-free discrimination. Integr Biol 2009; 1:477-484. doi: 10.1039/B906137A [Crossref] [ Google Scholar]
-
Leu TS, Liao ZF. Separating plasma and blood cells by dielectrophoresis in microfluidic chips. Int J Mod Phys Conf Ser 2012; 19; 185–189. 10.1142/S2010194512008732.
-
Huang LR, Cox EC, Austin RH, Sturm JC. Continuous Particle Separation Through Deterministic Lateral Displacement. Science 2004; 304; 987–990. 10.1126/science.1094567.
- Giddings JC. Field-flow fractionation: analysis of macromolecular, colloidal, and particulate materials. Science 1993; 260:1456-1465. doi: 10.1126/science.8502990 [Crossref] [ Google Scholar]
- Hsu CH, Carlo DD, Chen C, Irimia D, Toner M. Microvortex for focusing, guiding and sorting of particles. Lab Chip 2008; 8:2128-2134. doi: 10.1039/b813434k [Crossref] [ Google Scholar]
- Chen CL, Chen KC, Pan YC, Lee TP, Hsiung LC, Lin CM. Separation and detection of rare cells in a microfluidic disk via negative selection. Lab Chip 2011; 11:474-483. doi: 10.1039/C0LC00332H [Crossref] [ Google Scholar]
-
Kang JH, Krause S, Tobin H, Mammoto A, Kanapathipillai M, Ingber DE. A combined micromagnetic-microfluidic device for rapid capture and culture of rare circulating tumor cells. Lab Chip 2012, 12: 2175– 2181. 10.1039/C2LC40072C.
- Plouffe BD, Mahalanabis M, Lewis LH, Klapperich CM, Murthy SK. Clinically relevant microfluidic magnetophoretic isolation of rare-cell populations for diagnostic and therapeutic monitoring applications. Anal Chem 2012; 84:1336-1344. doi: 10.1021/ac2022844 [Crossref] [ Google Scholar]
- Hoshino K, Huang YY, Lane N, Huebschman M, Uhr JW, Frenkel EP, Zhang X. Microchip-based immunomagnetic detection of circulating tumor cells. Lab Chip 2011; 11:3449-3457. doi: 10.1039/C1LC20270G [Crossref] [ Google Scholar]
- Earhart CM, Hughes CE, Gaster RS, Ooi CC, Wilson RJ, Zhou LY. Isolation and mutational analysis of circulating tumor cells from lung cancer patients with magnetic sifters and biochips. Lab Chip 2014; 14:78-88. doi: 10.1039/c3lc50580d [Crossref] [ Google Scholar]
- Kim S, Han SI, Park MJ, Jeon CW, Joo YD, Choi IH, Han KH. Circulating tumor cell microseparator based on lateral magnetophoresis and immunomagnetic nanobeads. Anal Chem 2013; 85:2779-2786. doi: 10.1021/ac303284u [Crossref] [ Google Scholar]
- Hoshino K, Chen P, Huang YY, Zhang X. Computational analysis of microfluidic immunomagnetic rare cell separation from a particulate blood flow. Anal Chem 2012; 84:4292-4299. doi: 10.1021/ac2032386 [Crossref] [ Google Scholar]
- Park JH, Choi HJ, Choi YJ, Sohn SH, Park JG. Ultrawide ZnO nanosheets. J Mater Chem 2004; 14:35-36. doi: 10.1039/b312821k [Crossref] [ Google Scholar]
- Ghafouri V, Ebrahimzad A, Shariati M. The effect of annealing time and temperature on morphology and optical properties of ZnO nanostructures grown by a self-assembly method. Sci Iran 2013; 20:1039-1048. doi: 10.1016/j.scient.2013.02.025 [Crossref] [ Google Scholar]
- Ghafouri V, Shariati M, Ebrahimzad A. Photoluminescence investigation of crystalline undoped ZnO nanostructures constructed by RF sputtering. Sci Iran 2012; 19:934-942. doi: 10.1016/j.scient.2012.04.017 [Crossref] [ Google Scholar]
- Dai ZR, Gole JL, Stout JD, Wang ZL. Tin oxide nanowires, nanoribbons, and nanotubes. J Phys Chem B 2002; 106:1274-1279. doi: 10.1021/jp013214r [Crossref] [ Google Scholar]
- Shariati M, Ghafouri V. In2O3-ZnO heterostructure development in electrical and photoluminescence properties of In2O3 1-D nanostructures. Int J Mod Phys B 2014; 28:1450101. doi: 10.1142/S021797921450101X [Crossref] [ Google Scholar]
-
Shariati M, Ghafouri V. The annealing investigation on morphology and photoluminescence properties of In2O3 1-D nanostructures in resistive evaporation mechanism. Eur Phys J Appl Phys2014; 65: 20404. 10.1051/epjap/2014130374
- Ghafouri V, Shariati M, Ebrahimzad A. The effect of substrate distance to evaporation source on morphology of ZnO:In nanorods fabricated by means of a vapor transfer route and the study of their optical and electrical properties. J Nanopart Res 2014; 16:2309. doi: 10.1007/s11051-014-2309-2 [Crossref] [ Google Scholar]
- Lee SK, Kim GS, Wu Y, Kim DJ, Lu Y, Kwak M. Nanowire substrate-based laser scanning cytometry for quantitation of circulating tumor cells. Nano Lett 2012; 12:2697. doi: 10.1021/nl2041707 [Crossref] [ Google Scholar]
- Lee SK, Kim DJ, Lee G, Kim GS, Kwak M, Fan R. Specific rare cell capture using micro-patterned silicon nanowire platform. Biosens Bioelectron 2014; 54:181. doi: 10.1016/j.bios.2013.10.048 [Crossref] [ Google Scholar]
- Massart R. Preparation of aqueous magnetic liquids in alkaline and acidic media. IEEE Trans Magn 1981; 17:1247-1250. doi: 10.1109/TMAG.1981.1061188 [Crossref] [ Google Scholar]
-
Stober W, Fink A, Bohn E. Controlled growth of mono-disperse silica spheres in the micron size range. J Colloid Interface Sci 1968; 26: 62–69. 10.1016/0021-9797(68)90272-5
- Yamaura M, Camilo RL, Sampaio LC, Macedo MA, Nakamura M, Toma HE. Preparation and characterization of (3-aminopropyl) triethoxysilane-coated magnetite nanoparticles. J Magn Magn Mater 2004; 279:210-217. doi: 10.1016/j.jmmm.2004.01.094 [Crossref] [ Google Scholar]
- Lee SK, Kim GS, Wu Y, Kim DJ, Lu Y, Kwak M. Nanowire substrate-based laser scanning cytometry for quantitation of circulating tumor cells. Nano Lett 2012; 12:2697-2704. doi: 10.1021/nl2041707 [Crossref] [ Google Scholar]
- Peng KQ, Wang X, Lee ST. Silicon nanowire array photoelectrochemical solar cells. Appl Phys Lett 2008; 92:163103. doi: 10.1063/1.2909555 [Crossref] [ Google Scholar]
- Peng KQ, Hu JJ, Yan YJ, Wu Y, Fang H, Xu Y. Fabrication of single crystalline silicon nanowires by scratching a silicon surface with catalytic metal particles. Adv Funct Mater 2006; 16:387-394. doi: 10.1002/adfm.200500392 [Crossref] [ Google Scholar]
- Kim ST, Kim DJ, Kim TJ, Seo DW, Kim TH, Lee SY. Novel streptavidin-functionalized silicon nanowire arrays for CD4+ T lymphocyte separation. Nano Lett 2010; 10:2877-2883. doi: 10.1021/nl100942p [Crossref] [ Google Scholar]
- Schlautmann S, Besselink GAJ, Radhakrishna Prabhu G, Schasfoort RBM. Fabrication of a microfluidic chip by UV bonding at room temperature for integration of temperature-sensitive layers. J Micromech Microeng 2003; 13:81-84. [ Google Scholar]
- Abdolahad M, Mohajerzadeh S, Janmaleki M, Taghinejad H, Taghinejad M. Evaluation of the shear force of single cancer cells by vertically aligned carbon nanotubes suitable for metastasis diagnosis. Integr Biol 2013; 5:535-542. doi: 10.1039/C2IB20215H [Crossref] [ Google Scholar]
- Bird R, Stewart W, Lightfoot E. Transport Phenomena. Hoboken, NJ, USA: John Wiley & Sons; 1960.
-
Shevkoplyas SS, Siegel AC, Westervelt RM, Prentiss MG, Whitesides GM. The force actingon a superparamagnetic bead due to an applied magnetic field. Lab Chip 2007, 7: 1294–1302. 10.1039/B705045C.
- Yellen BB, Friedman G. Analysis of repulsive interactions in chains of superparamagnetic colloidal particles for magnetic template-based self-assembly. J Appl Phys 2003; 93:8447-8449. doi: 10.1063/1.1543134 [Crossref] [ Google Scholar]
- Furlani EP, Ng KC. Analytical model of magnetic nanoparticle transport and capture in the microvasculature. Phys Rev E 2006; 73:061919. doi: 10.1103/PhysRevE.73.061919 [Crossref] [ Google Scholar]
- Moon HS, Kwon K, Hyun KA, Sim TS, Park JC, Lee JG, Jung HI. Continual collection and re-separation of circulating tumor cells from blood using multi-stage multi-orifice flow fractionation. Biomicrofluidics 2013; 7:014105. doi: 10.1063/1.4788914 [Crossref] [ Google Scholar]
- Kim DJ, Seol JK, Wu Y, Ji S, Kim GS, Hyung JH. A quartz nanopillar hemocytometer for high-yield separation and counting of CD4+ T lymphocytes. Nanoscale 2012; 4:2500-2507. doi: 10.1039/C2NR11338D [Crossref] [ Google Scholar]
- Autebert J, Coudert B, Champ J, Saias L, Guneri ET, Lebofsky R. High purity microfluidic sorting and analysis of circulating tumor cells: towards routine mutation detection. Lab Chip 2015; 15:2090-2101. doi: 10.1039/C5LC00104H [Crossref] [ Google Scholar]
- Kim DJ, Seol JK, Lee G, Kim GS, Lee SK. Cell adhesion and migration on nanopatterned substrates and their effects on cell-capture yield. Nanotechnology 2012; 23:395102. doi: 10.1088/0957-4484/23/39/395102 [Crossref] [ Google Scholar]