Bioimpacts. 12(2):89-105.
doi: 10.34172/bi.2022.23467
Original Research
To detect potential pathways and target genes in infantile Pompe patients using computational analysis
Aynur Karadağ Gürel 1, *  , Selçuk Gürel 2
Author information:
1Department of Medical Biology, School of Medicine, Usak University, Usak, Turkey
2Department of Pediatrics, School of Medicine, Bahcesehir University, İstanbul, Turkey
Abstract
Introduction:
Pompe disease (PD) is a disease caused by pathogenic variations in the GAA gene known as glycogen storage disease type II, characterized by heart hypertrophy, respiratory failure, and muscle hypotonia, leading to premature death if not treated early. The only treatment option, enzyme replacement therapy (ERT), significantly improves the prognosis for some patients while failing to help others. In this study, the determination of key genes involved in the response to ERT and potential molecular mechanisms were investigated.
Methods:
Gene Expression Omnibus (GEO) data, accession number GSE38680, containing samples of biceps and quadriceps muscles was used. Expression array data were analyzed using BRB-Array Tools. Biceps group patients did not receive ERT, while quadriceps received treatment with rhGAA at 0, 12, and 52 weeks. Differentially expressed genes (DEGs) were deeply analyzed by DAVID, GO, KEGG and STRING online analyses, respectively.
Results:
A total of 1727 genes in the biceps group and 1198 genes in the quadriceps group are expressed differently. It was observed that DEGs were enriched in the group that responded poorly to ERT in the 52nd week. Genes frequently changed in the weak response group; the expression of 530 genes increased and 1245 genes decreased compared to 0 and 12 weeks. The GO analysis demonstrated that the DEGs were mainly involved in vascular smooth muscle contraction, lysosomes, autophagy, regulation of actin cytoskeleton, inflammatory response, and the WNT signaling pathway. We also discovered that the WNT signaling pathway is highly correlated with DEGs. Several DEGs, such as WNT11, WNT5A, CTNNB1, M6PR, MYL12A, VCL, TLN, FYN, YES1, and BCL2, may be important in elucidating the mechanisms underlying poor response to ERT.
Conclusion:
Early diagnosis and treatment of PD are very important for the clinic of the disease. As a result, it suggests that the enriched genes and new pathways emerging as a result of the analysis may help identify the group that responds poorly to treatment and the outcome of the treatment. Obtained genes and pathways in neonatal screening will guide diagnosis and treatment.
Keywords: Pompe Disease, GEO data, Bioinformatics, Differentially expressed genes, Enzyme replacement treatment, Wnt signaling pathway
Copyright and License Information
© 2022 The Author(s)
This work is published by BioImpacts as an open access article distributed under the terms of the Creative Commons Attribution License (
http://creativecommons.org/licenses/by-nc/4.0/). Non-commercial uses of the work are permitted, provided the original work is properly cited.
Introduction
Pompe disease (PD) (OMIM 232300), an autosomal recessive disease caused by pathogenic variants of the GAA gene, is a metabolic disease caused by a deficiency of acid α-glucosidase (GAA), a lysosomal enzyme that provides glycogen degradation.
1
Functional GAA deficiency causes accumulation of glycogen in many organ systems, led by the heart and skeletal muscle.
1,2
PD phenotypes differ according to the starting age, severity, and tissue involvement. Three types of infantile-onset Pompe disease (IOPD) beginning before 12 months, Late-onset Pompe disease (LOPD) beginning over 12 months, and adult-onset were determined.
3,4
Classic infantile Pompe is the most serious form of the disease and is defined by cardiomyopathy due to insufficient cardio respiration at 12 months, generalized muscle weakness and hypotonia, hepatomegaly, and death. Non-classic infantile PD occurs in the first year of life, progresses more slowly, and causes less severe cardiomyopathy. LOPD dominantly affects skeletal muscles and causes weakness of the skeletal muscles, and slowly progressing myopathy leads to respiratory failure. Respiratory system complications are the major cause of mortality. LOPD has a heterogeneous clinical tableau and can be confused with other neuromuscular diseases. Additionally, early diagnosis is critical for more effective ERT in the early stages of the disease.
4-6
Until ERT was permitted in 2006, there was no disease-specific treatment for PD.
5,7
The treatment aims to replace missing enzymes and thus prevent disease symptoms. Studies have shown that children treated in the early period of the disease have a lower risk of broad tissue injury and better quality of life.
3,5,6,8,9
Additionally, the response of patients receiving recombinant human GAA (rhGAA) therapy to ERT is highly variable. Enzyme replacement therapy (ERT) for IOPD is effective for longer than ten years, transforming a deadly disease into a treatable disease. Though ERT caused a revolution in treatment for IOPD patients and considerably advanced scientifically, quality of life continued to fall because of physical disorders. Although highly powerful in some patients and for some factors of the sickness (maximum clear on survival and cardiomyopathy in infantile sufferers and on motor and respiration capabilities in LOPD forms), in some patients it produced minor effects on symptoms and positive muscle tissue with continued disease development.
10-13
Because of this variability, evaluation of response to ERT and assessment of patient status is an important step in the management of the disease. ERT reduces glycogen levels, improves morphology, and restores muscle function and strength; however, the response to treatment varies between patients.
13,14
Recent publications have shown that early diagnosis and beginning treatment early provide better clinical outcomes.
7,15
With the advent of high technologies, the number of studies to find effective treatments to identify metabolic diseases clinically, improve their management, and explain metabolic mechanisms has increased significantly. Systematic analysis of metabolic disorders with human genome sequencing, transcriptome, proteome, and metabolome analyses offers strong opportunities to develop current approaches. In this study, detailed bioinformatics analyzes were performed using mRNA microarray profile data for the biceps muscles, quadriceps muscles, and quadriceps muscle group receiving ERT at different weeks in infantile-onset Pompe patients.
The study downloaded the data set with profile access number (GSE38680) from the GEO database and performed detailed bioinformatic analysis to research DEGs in 2 different muscle groups and varying pathways and genes after treatment. Thus, we hope to reveal the main target genes included in the pathologic process in PD, identify genes and pathways changed during the treatment process, and determine the molecular mechanisms of operation. Additionally, the biological functions, the affected signaling pathways, and the protein-protein interaction network of these DEGs were analyzed and debated. Our study provides potential molecular markers for effective drug targets that can be used in gene therapy for Pompe therapy, as well as for early diagnosis and prognosis of the disease.
Materials and Methods
Microarray data
The gene expression profiling data with the series number GSE38680 was obtained from the public functional genomics data repository GEO (https://www.ncbi.nlm.nih.gov/geo/), which is based on the Affymetrix Human Genome U133 plus 2.0 Array. GSE38680 was provided by Palermo et al. It used two different datasets for the study.
16
The first data included 9 patients and 10 control samples taken from biceps tissue. The second data compared quadriceps biopsies of 11 Pompe patients to biopsies of 7 controls, either 0, 12, or 52 weeks after initiation of rhGAA therapy. The number of patients and their characteristics are given in Table 1.
Table 1.
Patient information
|
GEO access number: GSE38680
16
|
|
Pompe patient
|
Sample number
|
Age mean
|
Gender
|
|
|
| Biceps biopsies |
9 |
2m-7m |
5M-4F |
|
|
| Biceps controls |
10 |
2m-3y |
5M-5F |
|
|
| Quadriceps biopsies |
11 |
|
7M-4F |
|
|
| Quadriceps controls |
7 |
6m-9y |
4M-3F |
|
|
|
In the quadriceps group, the situation at 52nd week of ERT treatment
|
|
|
|
Motor status
|
Change in glycogen content
|
|
|
Sample number and Patient number
|
Age mean
|
Gender
|
|
|
| Poor outcome |
4 (1,3,4,11) |
5m-2.2m |
2M-2F |
No gains |
Stable/Decreased |
| Positive outcome |
7 (2,5,6,7,8,9,10) |
1.2-6.9m |
5M-2F |
Standing/walking |
Increased |
F: female, M: male, m: month, y: year.
Microarray data preprocessing and identification of DEG analysis
In the study, DEGs from each dataset were identified using BRB-ArrayTools software (version 4.5.1). BRB-Array Tools is a bioinformatics program used to develop statistical methodologies related to microarray research and microarray data. BRB-ArrayTools provides a wizard that helps the user to import data files quickly. Raw data uploaded as preprocessing for the cell intensity (CEL) files were entered into an Excel table and included expression values and phenotype data. Using an Excel-integrated package, BRB-ArrayTools pre-processes the hybridization data of each probe in the probe set, including filtering and calculation. The calculation is carried out by programs written in the R statistical programming language. It uses the robust multiarray average (RMA) method for normalization and SAM (statistical analysis of microarray) method to analyze Transcription profiles. The BRB-Array tool also uses a t test to compare classes. This independent t test is based on the comparison of the variations between groups in mean log rates (logA-logB) or log intensities as opposed to the predicted variance in mean differences. Data then had probe set expression summaries calculated, background correction, and data undergo pre-processing involving normalization, filtering, and calculation of quality control indices. Normalization and filtering transform the data into a comparable format. Then differentially expressed genes (DEGs) are identified between the compared groups. Later, a gene set is obtained within the framework of the study hypothesis with fold change (FC) and p statistical significance values.
17
The following comparisons have been considered for the identification of DEG: Bicepsc vs Control (B vs C), Quadriceps 0 week (baseline) vs Control (Q 0 week vs C), B vs Q, 12 wk vs C, 52 wk vs C and 52 wk poor vs pos (positive).
The DEGs between biceps and quadriceps samples were identified using the unpaired t test. DEGs with statistical significance were established as P value <0.05 and |Log2Foldchange| ≥1.5. The DEGs with statistical significance between the biceps and quadriceps were selected and identified. A volcano plot of the DEGs from each dataset was subsequently generated using BRB-ArrayTools (Fig. 1). In order to identify genes with similar levels of expression and compare them in various samples, a hierarchical clustering analysis was conducted. The Venn diagram showing the intersection of these DEGs was visualized using venny between two data and their groups (https://bioinfogp.cnb.csic.es/tools/venny/).
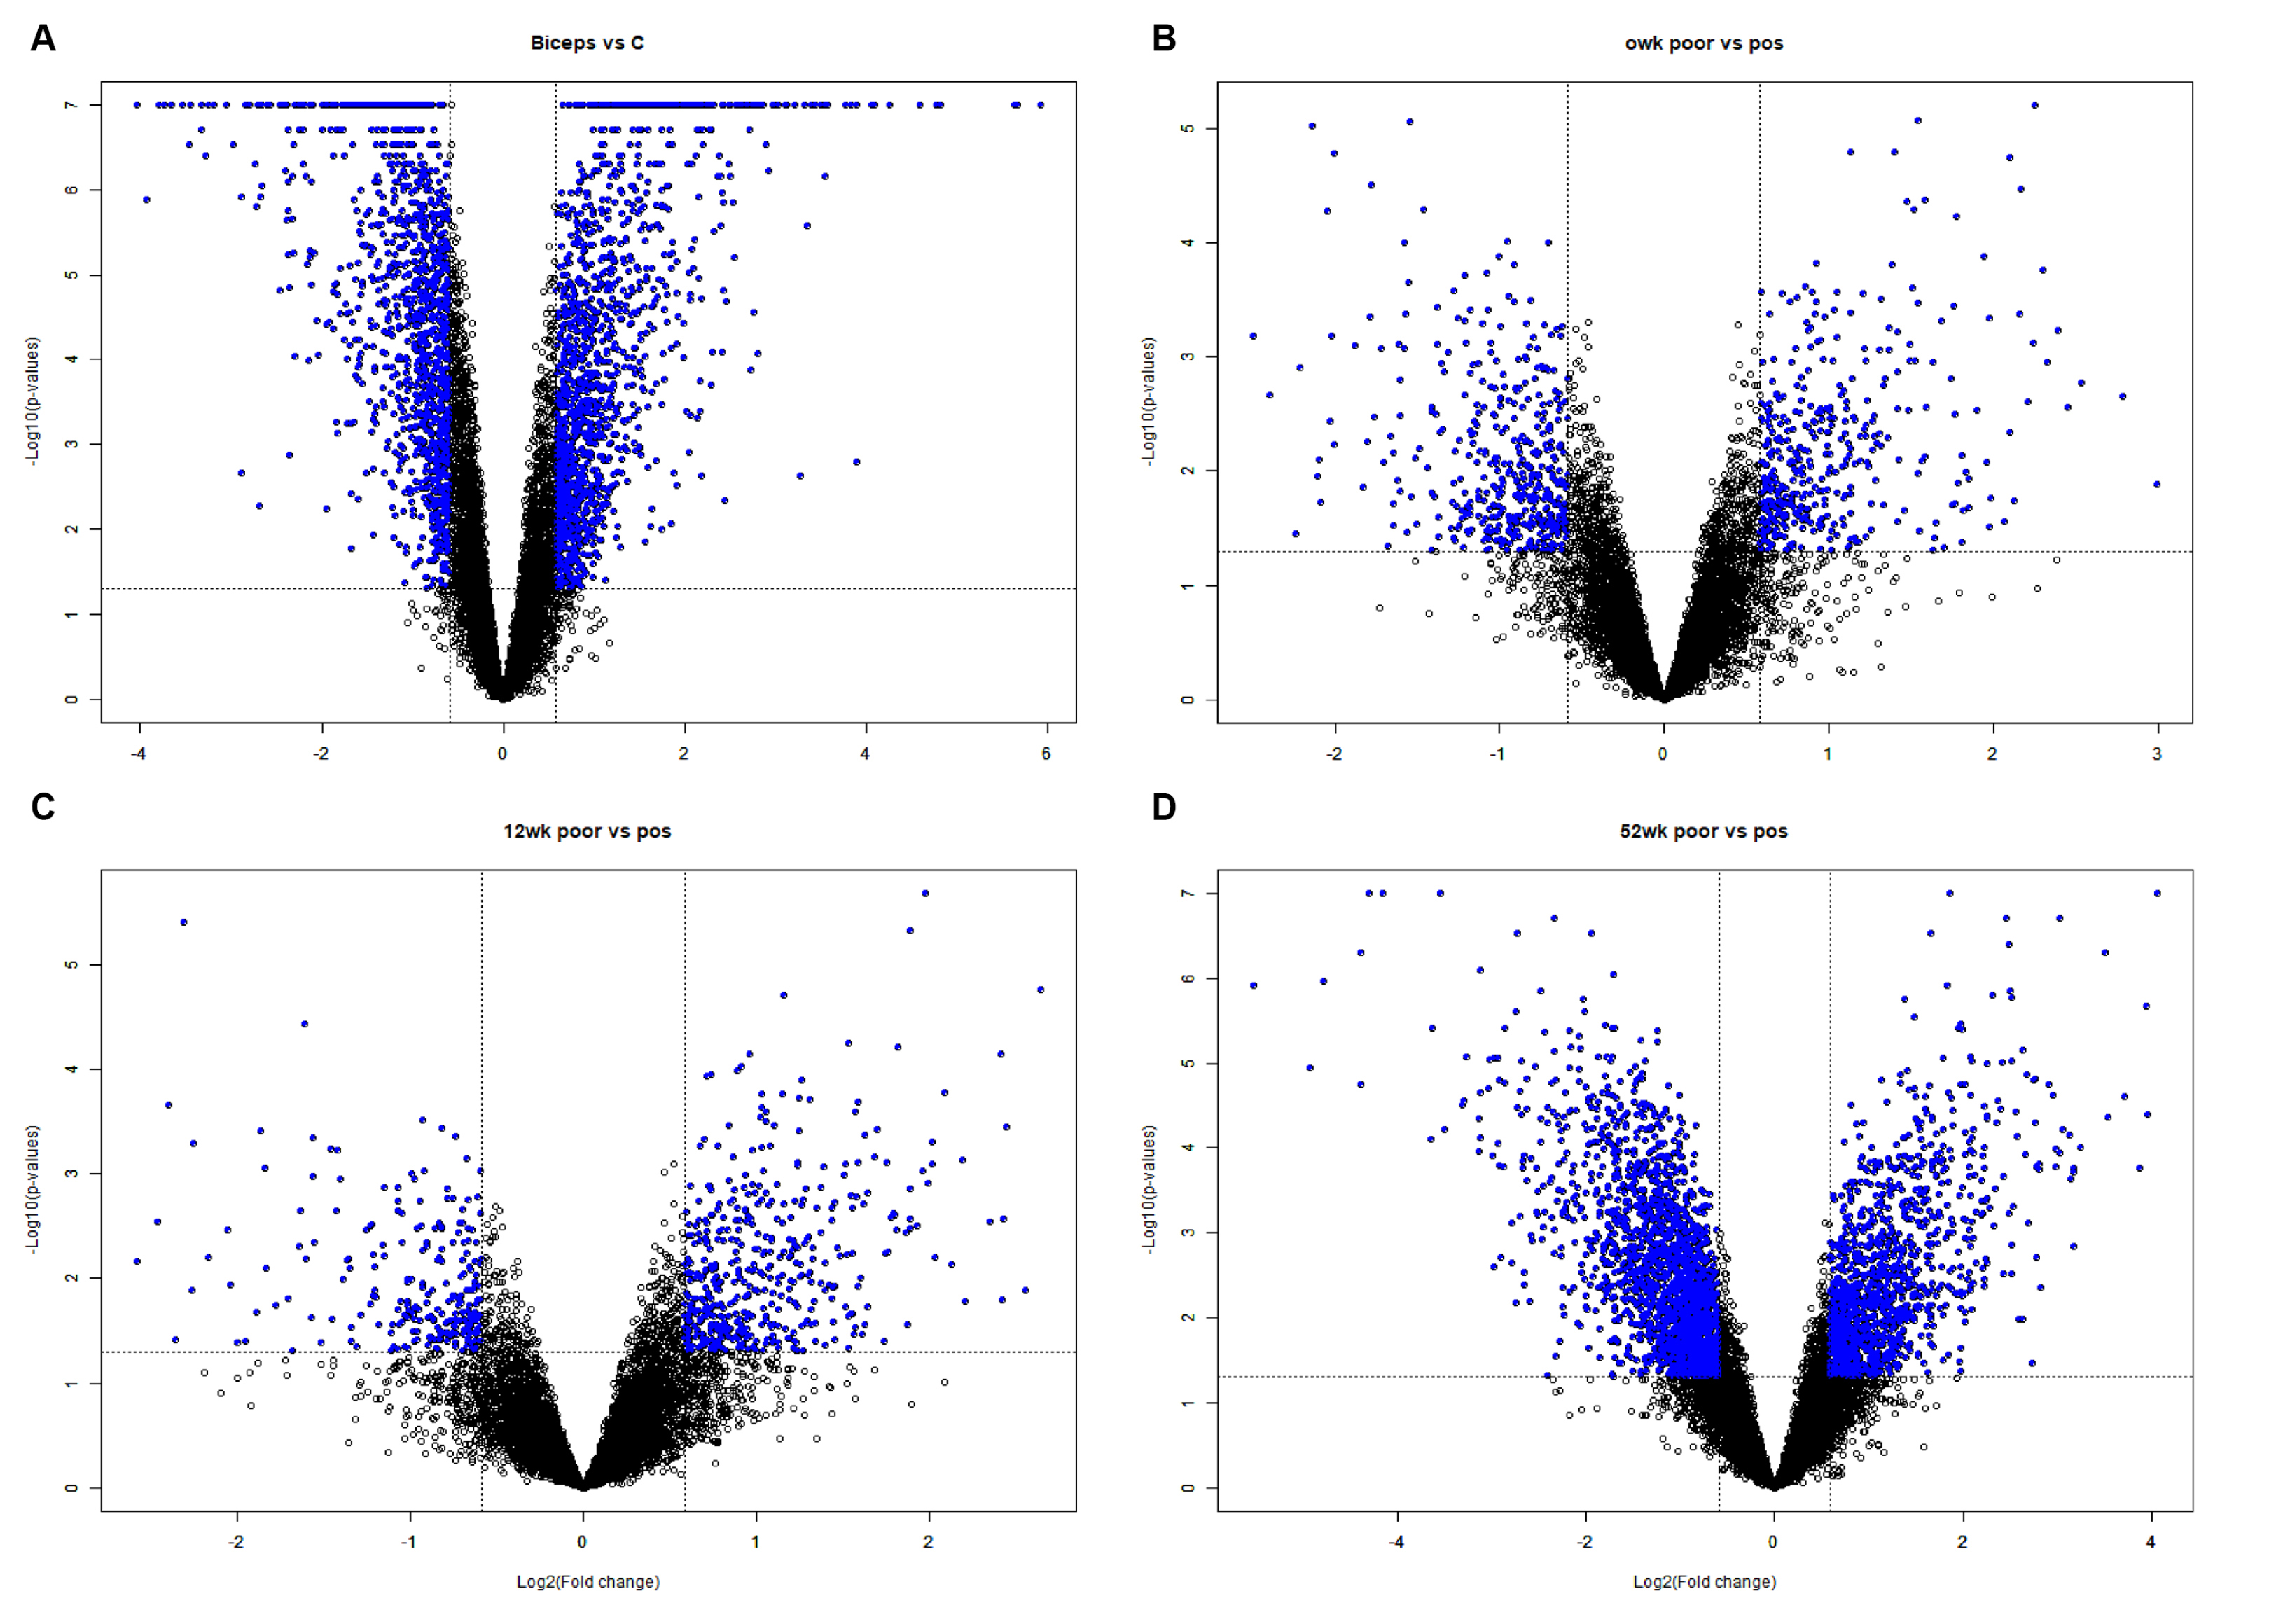
Figure 1.
Volcano plot representing the DEGs of Biceps vs C, 0wk poor vs pos, 12wk poor vs pos and 52wk poor vs pos satisfying the criteria of with p value <0.05 and |Log2Foldchange| ≥1.5. Significantly expressed genes are represented as blue dots.
.
Volcano plot representing the DEGs of Biceps vs C, 0wk poor vs pos, 12wk poor vs pos and 52wk poor vs pos satisfying the criteria of with p value <0.05 and |Log2Foldchange| ≥1.5. Significantly expressed genes are represented as blue dots.
Gene ontology and pathway enrichment analyses
Gene Ontology (GO) and Kyoto Encyclopedia of Genes and Genomes (KEGG) pathway enrichment analysis was performed on the Database for Annotation Visualization and Integrated Discovery (DAVID) (version 6.8) (https://david.ncifcrf.gov/). P<0.05 was considered to indicate a statistically significant difference.
Construction of protein-protein interaction network
The Search Tool for the Retrieval of Interacting Genes/Proteins (STRING) database v10.0 (http://www.string-db.org/) has been used to analyze the relationships of DEGs and explore the molecular interactions involved in PD. Protein-protein interactions (PPs) were performed for significantly regulated mRNAs. Interaction networks were prepared using high confidence scores of 0.9, and non-interacting nodes were removed. A P value of less than 0.05 was considered statistically significant. STRING data were imported into Cytoscape software (version 3.8.2, www.cytoscape.org) to map the network's visual properties to experimental variables and the effects of differential expression analysis. In addition, Network Analyzer and the Molecular Complex Detection (MCODE) plugin in Cytoscape version 3.6.1 were used to screen modules of the PPI network in Cytoscape (degree cutoff = 2, node score cutoff = 0.2, k-core = 2, and max. depth =100). In Cytoscape, betweenness centrality degrees were determined to recognize candidate 'hub' proteins. Cytoscape is an open public software tool that is useful for the visual assessment of biomolecule interaction networks comprising protein, gene, and other interactions. Nodes that are typically related to the proteins are defined as proteins of the hub and are crucial in the network. For up-regulated and down-regulated genes, a network of protein-protein interactions (PPIs) of differentially expressed target genes has been developed separately.
Results
Explaining the working groups and the patients receiving treatment
The study was completed on two muscle groups: the biceps and quadriceps. The first group collected quadriceps muscle biopsies from 11 patients treated with Myozyme®. Patients included in the study were chosen according to whether there were improvements in motor function between baseline (0 week) and post-treatment biopsy samples after 12 and 52 weeks of treatment. A patient without any motor gain was described during the study as a patient with bad clinical gain, whereas patients with motor gain were defined as patients with strong clinical gain, such as walking or standing. The second group collected biceps biopsies from 9 untreated patients (not treated with Myozyme®) with infantile-onset PD. Control biopsies were taken from age-matched individuals with no identifiable muscle pathology (7 quadriceps and 9 biceps).
Identification of DEGs
A total of 54 640 human genes were subjected to appropriate filtering and DEGs were determined for the following comparisons: Biceps vs C, Quadriceps 0wk vs C, Quadriceps 0wk poor vs Pos, Quadriceps 12wk poor vs pos and Quadriceps 52wk poor vs pos. The BRB array tools were used to identify DEGs between the biceps and quadriceps groups and between patients receiving enzyme treatment (Fig. 1). Volcano plots show the distribution of DEGs for each comparison. To assess the gene expression differences occurring in PD, 2 separate comparisons were made for infantile-onset patients and the findings were compared to the determination of expression patterns between types of muscle. When comparing patients at biceps and controls, the expression levels of 1727 genes differed based on the criteria P < 0.05 and |Log2Foldchange| ≥1.5. As shown on the Venn diagram, when the untreated biceps group is compared with their own control group, 1727 genes were differentially expressed; of these 877 had increased gene expression and 850 had reduced gene expression (Table 2).
Table 2.
Genes count with differentially expressed after bioinformatic analysis for comparison of between groups (P value <0.05 and |Log2Foldchange| ≥1.5)
|
Groups
|
DEGs
|
Upregule
|
Downregule
|
| Biceps vs controls |
1727 |
877 |
850 |
| Quadriceps 0 wk (baseline) vs controls |
1198 |
859 |
339 |
| Biceps vs Quadriceps 0 wk (baseline) |
664 |
464 |
200 |
|
Comparison according to the response given after ERT
|
|
|
|
|
Poor vs positive outcome (3 poor vs 7 positive)
|
DEGs
|
Upregule
|
Downregule
|
| 0 wk (baseline) vs controls |
530 |
247 |
283 |
| 12 wk vs controls |
507 |
339 |
168 |
| 52 wk vs controls |
2243 |
739 |
1504 |
The genes that are top upregulated and downregulated in the biceps vs control group are listed in Table 3. When the untreated or baseline quadriceps group (0 week) is compared with their controls, 1198 genes (339 down- and 859 up-regulated genes) were expressed differentially. When the biceps group is compared with the quadriceps baseline group (0 week: untreated) using the Venn diagram, 664 genes were common and differentially expressed with 449 genes up-regulated and 200 down-regulated; in other words, observed to change in the same direction. The volcano plot and heat map of DEGs associated with biceps and quadriceps are presented respectively in Fig. 1A, Fig. 2A, and Fig. 2B. While the expression of 7 genes increased in the quadriceps group, they reduced in the biceps group. Four genes increased in the biceps and reduced in the quadriceps group. These results show that biceps and quadriceps groups have common pathways activated; hence, they have a common pathophysiology. Table 2 summarizes results obtained for gene counts with differential expression after bioinformatics analysis for comparison between groups.
Table 3.
The top 10 upregulated and downregulated DEGs in Biceps Muscle with P value <0.05 and |Log2Foldchange| ≥1.5
|
Biceps-Upregulated DEGs
|
Biceps-Downregulated DEGs
|
|
Gene symbol
|
Log FC
|
P
value
|
Gene symbol
|
Log FC
|
P
value
|
| IGFN1 |
60.43 |
<1e-07 |
CALML6 |
0.061 |
<1e-07 |
| CHI3L1 |
50.6 |
<1e-07 |
PDE11A |
0.072 |
<1e-07 |
| PRUNE2 |
49.49 |
<1e-07 |
LGR5 |
0.086 |
<1e-07 |
| ARHGAP36 |
27.35 |
<1e-07 |
IL17D |
0.091 |
0.0000003 |
| ANKRD1 |
24.02 |
<1e-07 |
MYLK4 |
0.092 |
<1e-07 |
| MEG3 |
19.03 |
<1e-07 |
PAIP2B |
0.1 |
<1e-07 |
| MEG9 |
16.66 |
<1e-07 |
MYLK3 |
0.1 |
0.0000002 |
| CD79A |
14.89 |
<1e-07 |
MLF1 |
0.11 |
<1e-07 |
| LBP |
11.88 |
<1e-07 |
SMTNL1 |
0.11 |
<1e-07 |
| STC2 |
11.7 |
<1e-07 |
LRRC3B |
0.13 |
0.0000003 |
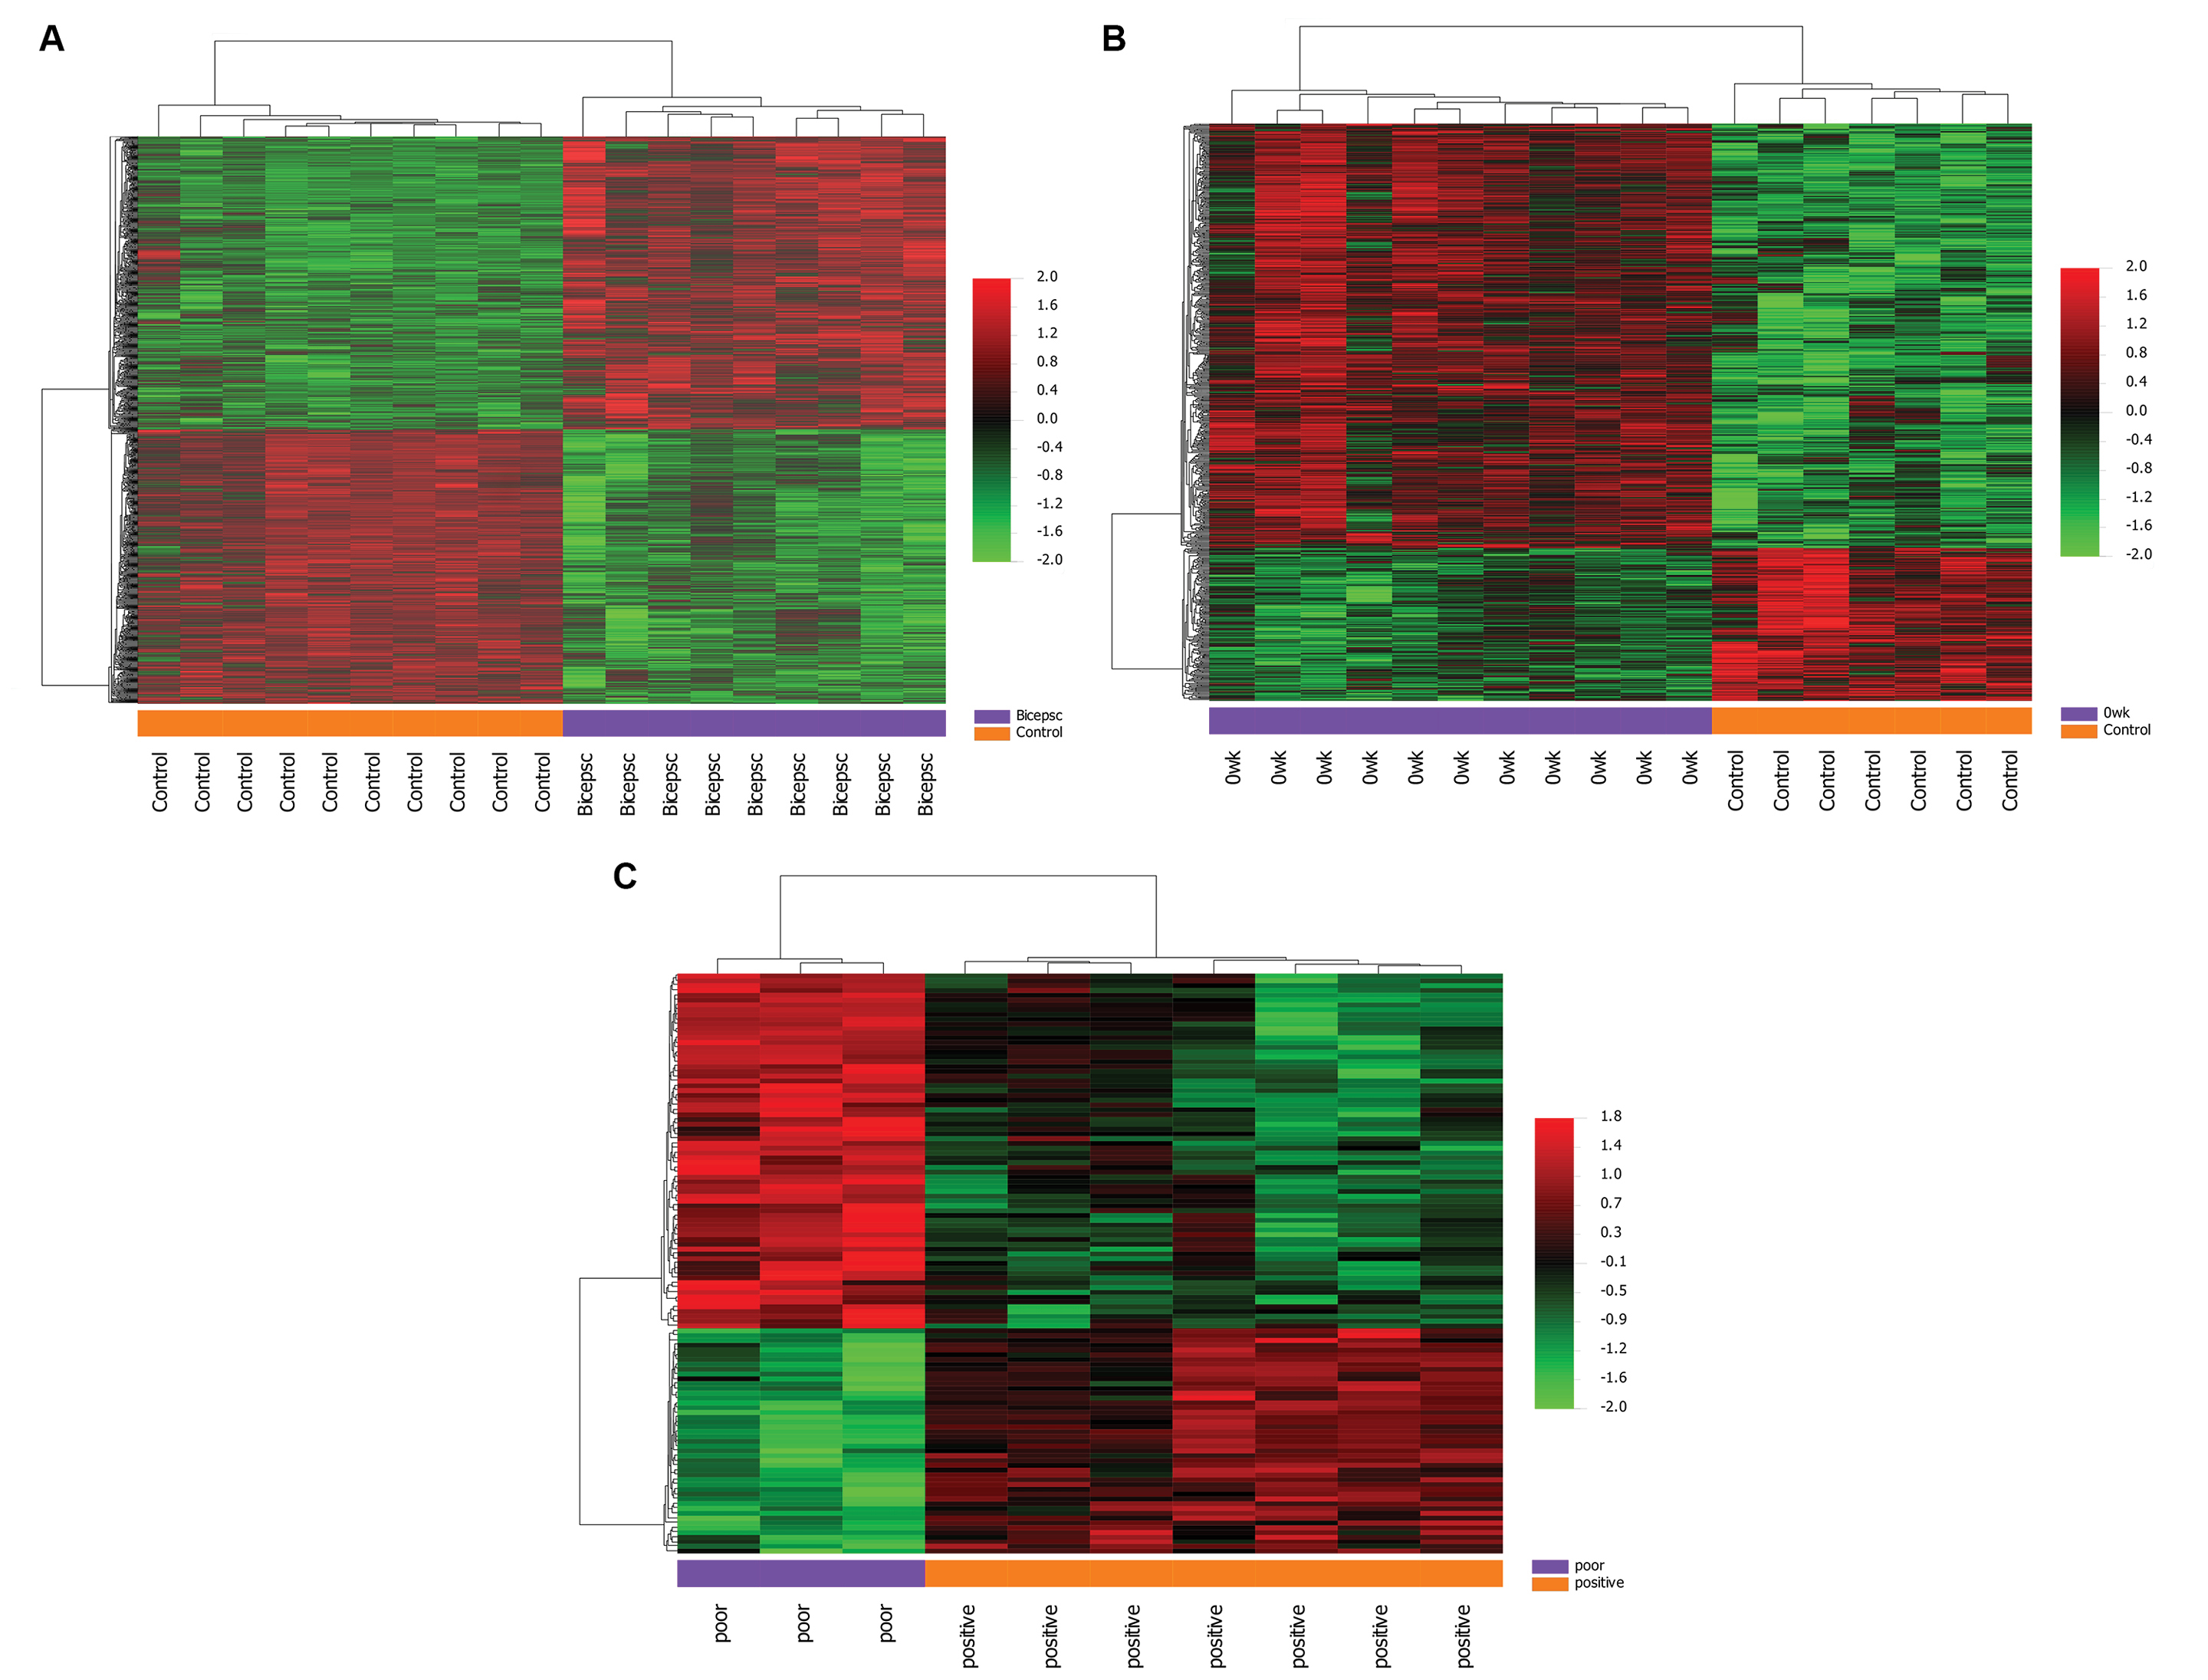
Figure 2.
Hierarchical clustering heatmap of DEGs screened on the basis of with P value <0.05 and |Log2Foldchange| ≥1.5. Red shows that the expression of genes is upregulated; green shows that the expression of genes is downregulated, and black shows no significant changes in gene expression.
.
Hierarchical clustering heatmap of DEGs screened on the basis of with P value <0.05 and |Log2Foldchange| ≥1.5. Red shows that the expression of genes is upregulated; green shows that the expression of genes is downregulated, and black shows no significant changes in gene expression.
Comparison – Quadriceps 0, 12, and 52 week’s vs controls
When the patients treated for 0, 12, and 52 weeks in the quadriceps group are compared with controls, 687 genes (501 up-regulated, 186 down-regulated) were observed to change in the same direction in common during the treatment. The expression of 1143 genes (779 upregulated and 363 downregulated) differentiated in the 12th week after beginning treatment and expression of 1278 genes (799 up-regulated, 479 down-regulated) differentiated in the 52nd week.
The genes that are top upregulated and downregulated in the quadriceps vs control group are listed in Table 4. The volcano plot and heat map of DEGs associated with a poor diagnosis are presented respectively in Fig. 1B, C, D, and Fig. 2C.
Table 4.
The top 10 upregulated and downregulated DEGs in Quadriceps Muscle (0week baseline) with P value <0.05 and |Log2Foldchange| ≥1.5
|
Quadriceps-Upregulated DEGs
|
Quadriceps-Downregulated DEGs
|
|
Gene symbol
|
Log FC
|
P
value
|
Gene symbol
|
Log FC
|
P
value
|
| PRUNE2 |
26.9 |
<1e-07 |
CALML6 |
0.073 |
0.0000008 |
| CHI3L1 |
16.56 |
0.0000056 |
PDLIM1 |
0.17 |
<1e-07 |
| IGFN1 |
11.85 |
0.000145 |
TSPAN8 |
0.17 |
0.0031557 |
| SNORD114-3 |
11.45 |
0.0000003 |
PVALB |
0.22 |
0.004674 |
| ARHGAP36 |
10.37 |
0.0002162 |
TPM2 |
0.23 |
0.0000002 |
| SLC26A9 |
9.12 |
<1e-07 |
SMTNL1 |
0.24 |
0.0000007 |
| ANKRD1 |
8.37 |
0.0002528 |
MYLK2 |
0.24 |
0.0000113 |
| S100A2 |
8.06 |
<1e-07 |
PFKFB1 |
0.3 |
0.0000484 |
| TNNT2 |
7.94 |
<1e-07 |
UGT3A1 |
0.3 |
0.0004174 |
| HLA-DQA1 |
7.87 |
0.0003413 |
LRRC3B |
0.3 |
0.001807 |
Gene Ontology, DAVID and KEGG pathways analysis
To better understand the function and mechanism of DEGs identified after microarray data analysis, functional and path enrichment analyses of genes with increasing or reducing expression were completed using GO, DAVID and KEGG software for pathway analyses. To research functional changes in the pathologic progression, the identified DEGs were matched to the GO database. Groups are compared with their control groups.
Comparison – Biceps vs control groups
GO analysis results show variations in the biological processes of upregulated DEGs significantly enriched upregulated genes related to cell adhesion, inflammatory response, actin cytoskeleton organization, calcium ion binding, and endoplasmic reticulum. Significant enrichment in down-regulated genes has been in the tricarboxylic acid cycle, ubiquitin-protein ligase binding, muscle myosin complex, regulation of cardiac conduction, and structural components of the muscle (Fig. 3). To obtain more information about biological pathway changes in the biceps group, the KEGG pathway was analyzed and it appeared many DEGs in the KEGG path were significantly enriched. Significant pathway enrichment results are listed in Table S1. As shown in Table S1, the emerging pathways were NF-kappa B signaling pathway, lysosome, natural killer cell-mediated cytotoxicity, adrenergic signaling in cardiomyocytes, Wnt signaling pathway, and TGF-beta signaling pathways (Table S1).
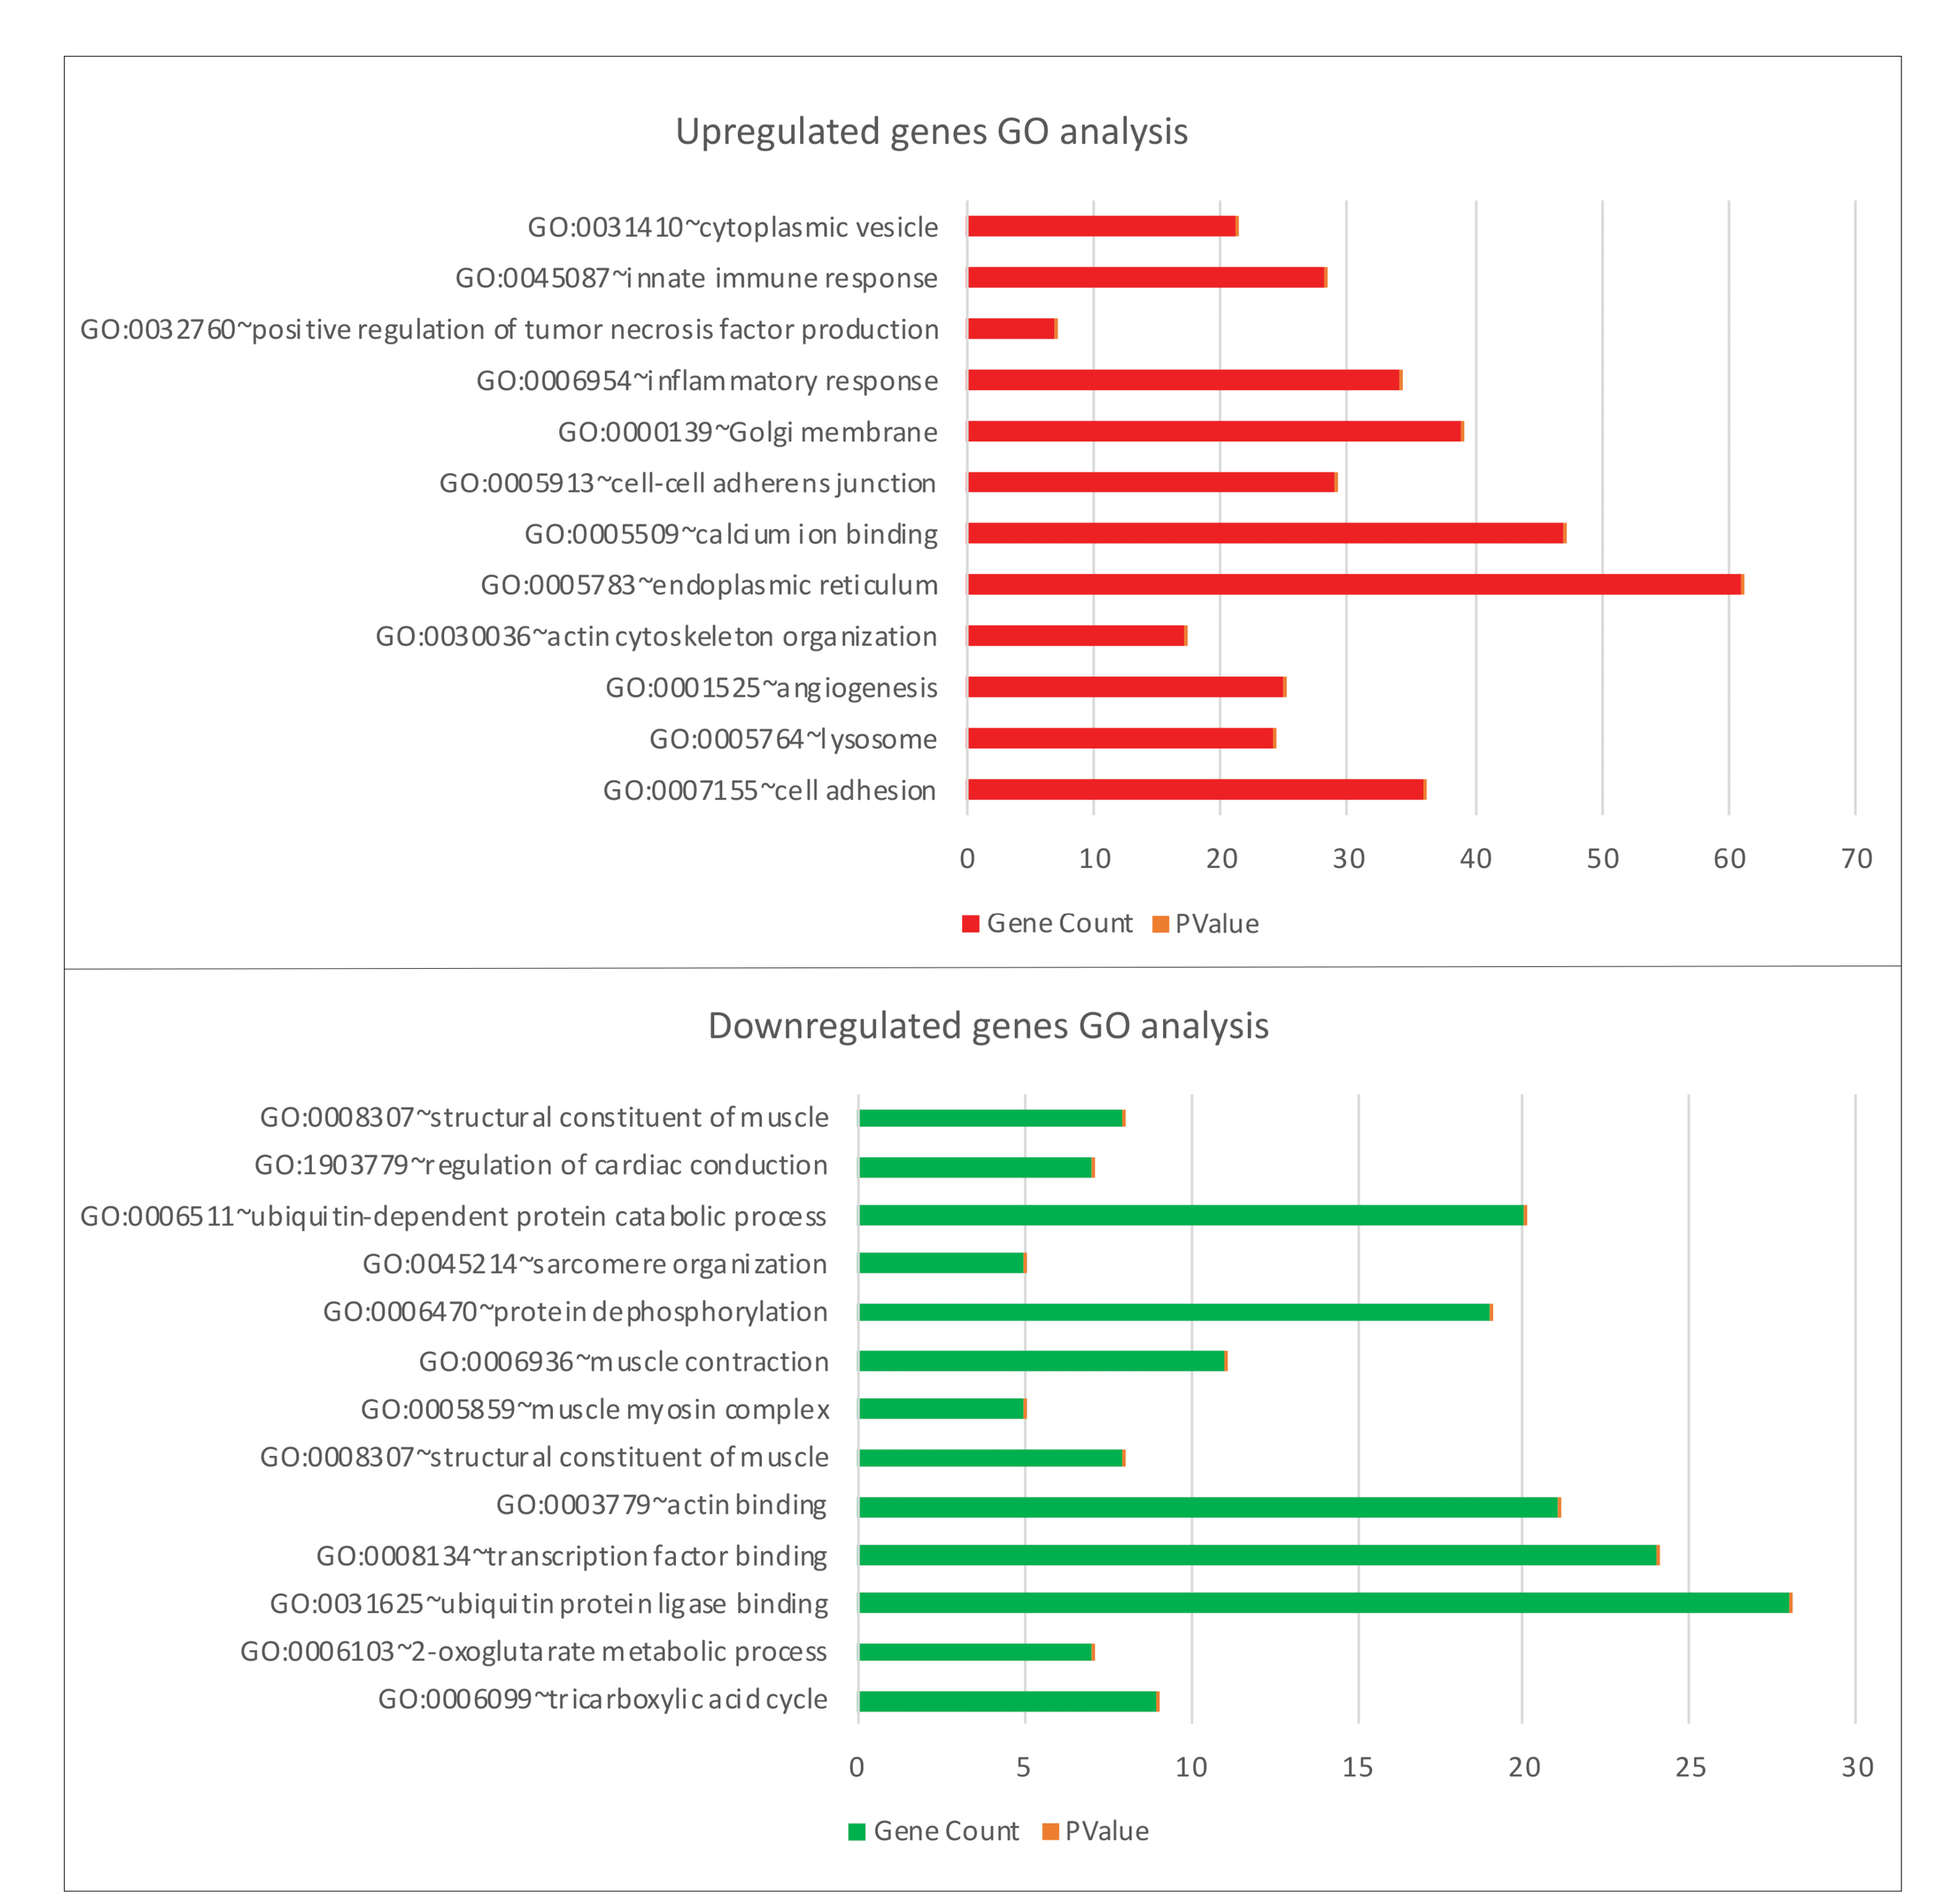
Figure 3.
GO enrichment analysis of upregulated and downregulated genes in Biceps vs controls.
.
GO enrichment analysis of upregulated and downregulated genes in Biceps vs controls.
Comparison – Quadricep 0-week vs control group
GO analysis of the identified DEGs revealed enrichment of innate immune response, lysosome, transport vesicle membrane, endoplasmic reticulum, muscle organ development, and calmodulin-binding processes (Fig. 4). KEGG analysis results show enrichment in lysosome and antigen processing presentation pathways, focal adhesion, calcium signaling pathway, vascular smooth muscle contraction, ubiquitin-mediated proteolysis, adrenergic signaling in cardiomyocytes, cell adhesion molecules (CAMs), and NF-kappa B signaling pathway (Table S2).
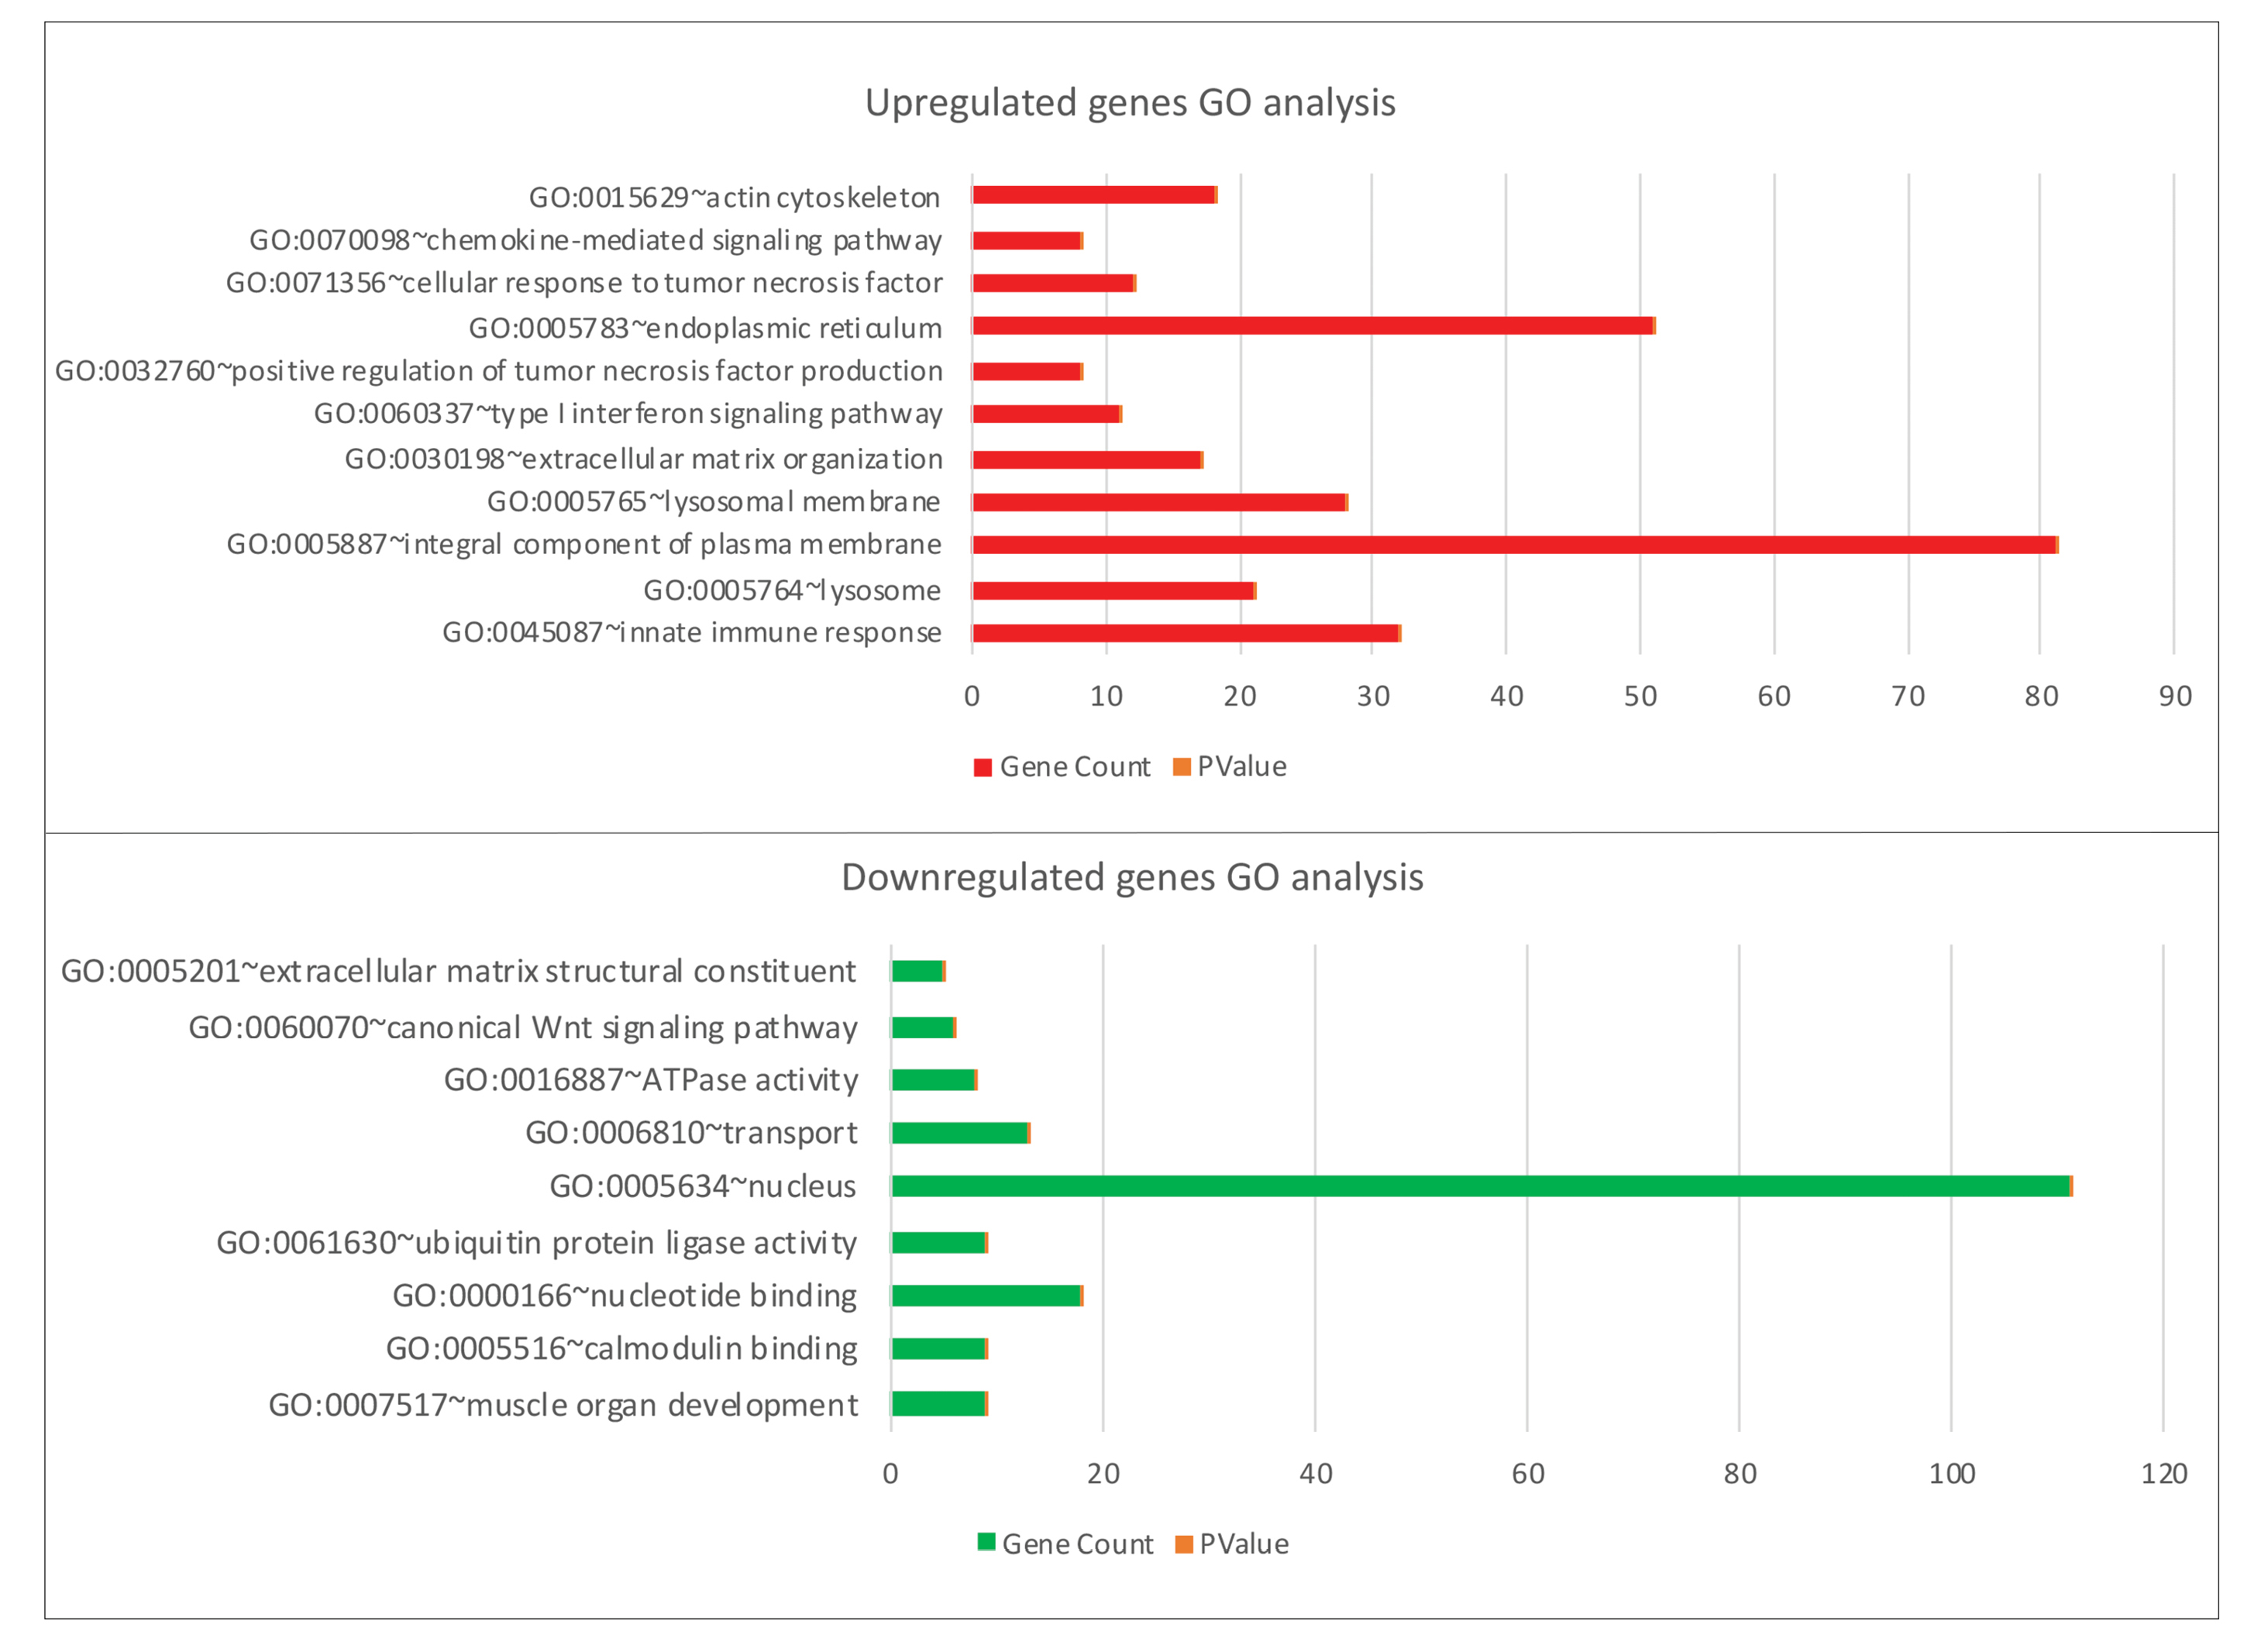
Figure 4.
GO enrichment analysis of upregulated and downregulated genes in Quadriceps 0wk (baseline) vs controls.
.
GO enrichment analysis of upregulated and downregulated genes in Quadriceps 0wk (baseline) vs controls.
Comparison – Biceps vs Quadriceps 0wk (baseline) groups
Comparison between the two muscle groups with a Venn diagram found 4 genes increased in the biceps group and reduced in the quadriceps group (RBPMS, ACTR2, XBP1, UBE2D3), while 7 genes increased in the quadriceps group and decreased in the biceps group (PROX1, GAS2, ASPH, OSGIN2, TNFAIP6, UBE3B, TFRC). While 464 genes increased in common in both groups, 200 genes reduced in common in both groups. GO analyses and KEGG pathways showed commonly affected pathways in both groups (Fig. 5). When examined in general, similar pathways were affected in situations before treatment in both muscle groups. This shows they have a common pathophysiology.
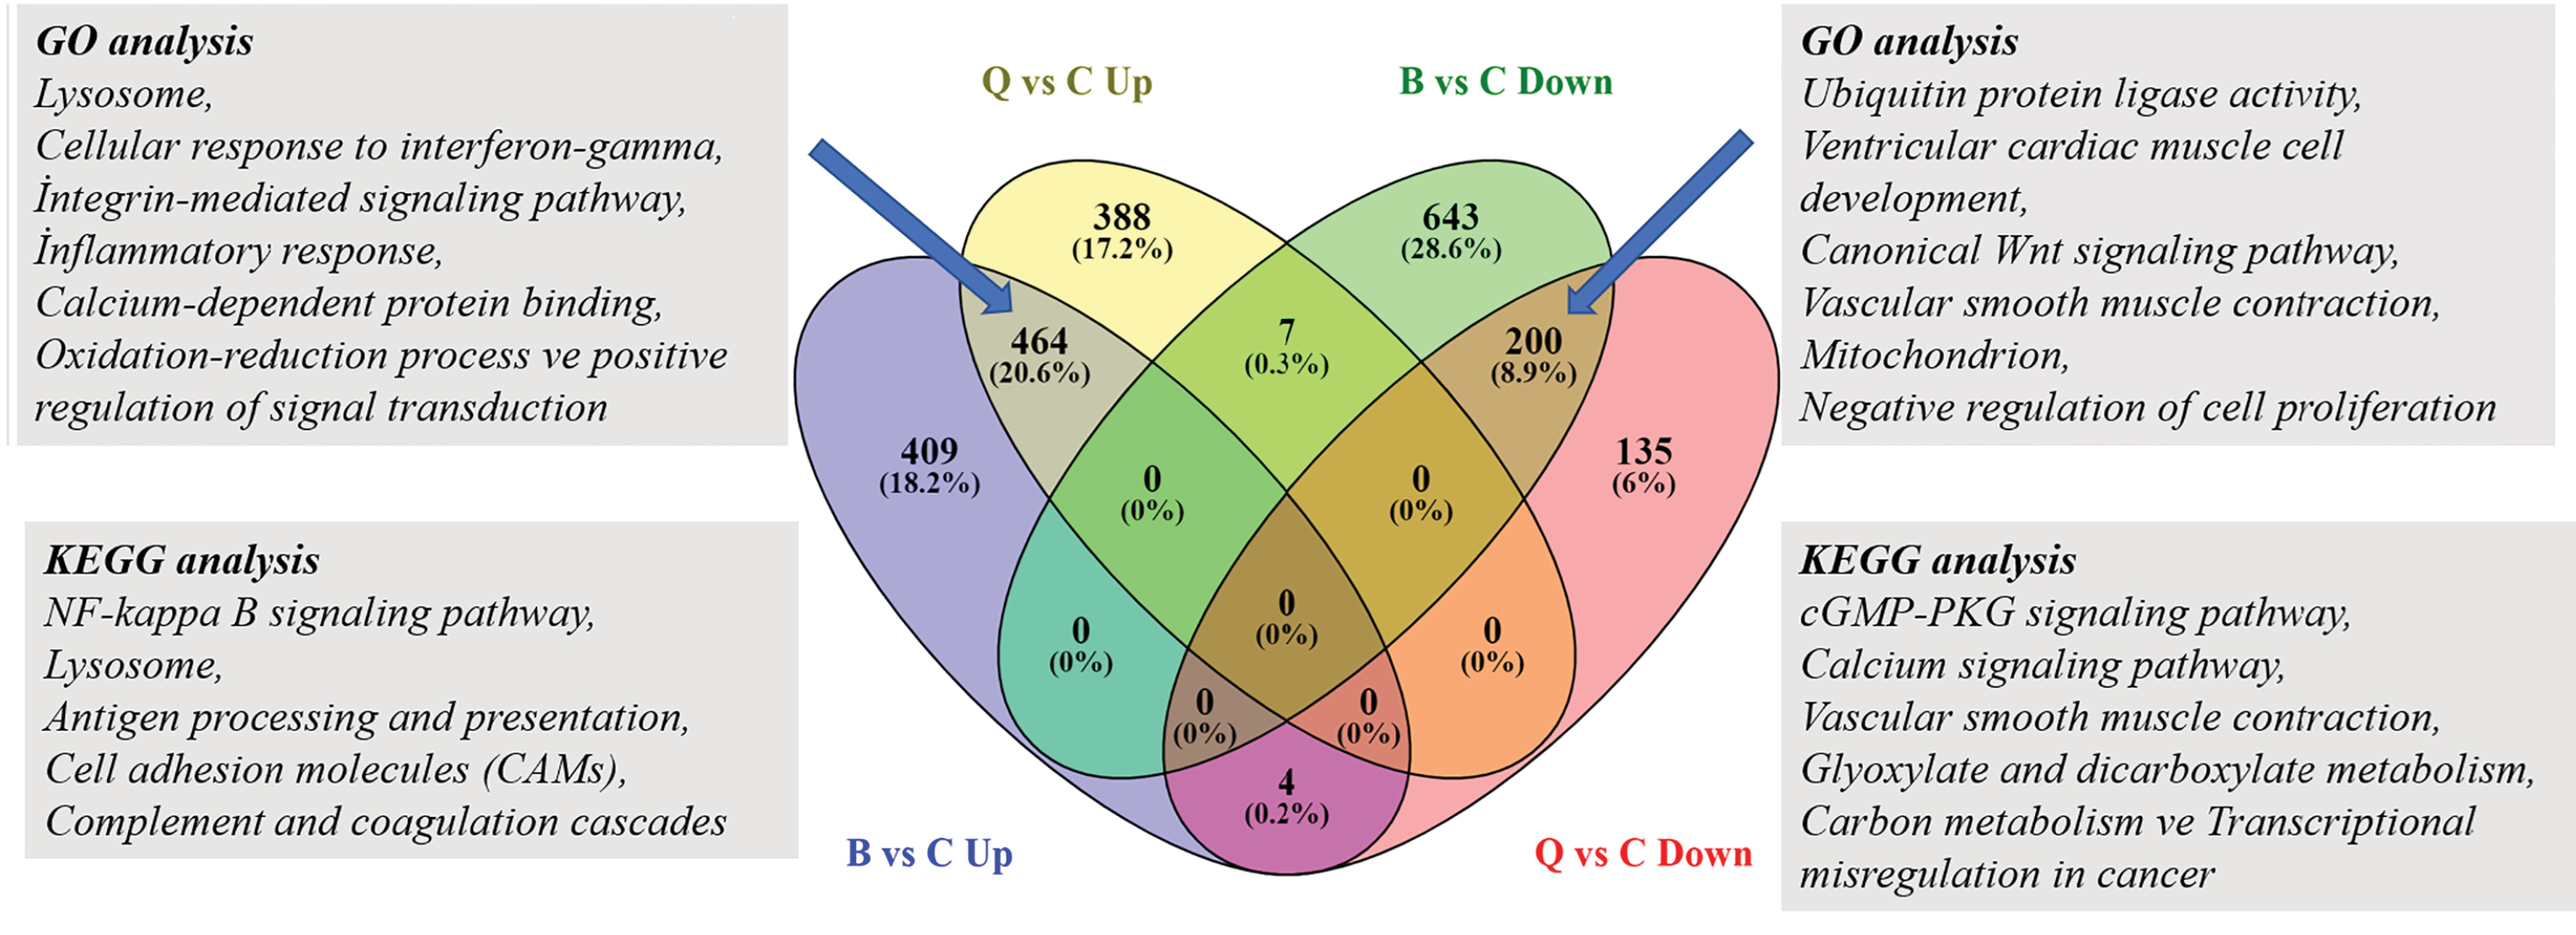
Figure 5.
464 common elements in "Biceps -Up" and "Quadriceps-Up", 200 common elements in "Biceps-Down" and "Quadriceps-Down" Venn diagram. Identification of the differentially expressed upregulated and downregulated genes in the Biceps and Quadriceps groups.
.
464 common elements in "Biceps -Up" and "Quadriceps-Up", 200 common elements in "Biceps-Down" and "Quadriceps-Down" Venn diagram. Identification of the differentially expressed upregulated and downregulated genes in the Biceps and Quadriceps groups.
Comparison – according to clinical response after ERT- Quadriceps 0, 12, and 52. Week’s poor response vs. positive response
Basal gene expression data from rhGAA (Myozyme®) patients were compared as patient data related to positive clinical response and poor clinical response based on general response to treatment, to predict ERT response and determine potential biomarkers to reveal genes potentially related to disease progression during the treatment process and ERT. In the treated quadriceps group, some variations in gene expression profiles are expected according to treatment response in the 12th and 52nd weeks of treatment. For this, patient data from four cases with poor responses and seven cases with positive responses were compared. However, while one patient with a poor response had data for 0 and 12 weeks, there was no data for the 52nd week, so they were removed from the group to ensure an accurate comparison of outcomes. As shown in Fig. 6, in the 52nd week varying gene numbers (upregulated and downregulated) in the group with poor clinical response to treatment had increased compared to 0 and 12 weeks. When the gene expression profiles are compared, there were variations in 530 genes (247 up-283 down) in 0 week between those who did not respond and those who did, with variations in expression profiles for 507 genes (339 up-168 down) in the 12th week and 2243 genes (739 up-1504 down) in the 52nd week (Table 2). After beginning treatment, 52 reducing-85 increasing genes were shown to vary in the same direction before and after treatment in all three groups. In the 52nd week, apart from commonly changing genes in the poor response group, expression of 530 genes increased and 1245 genes reduced compared to 0 and 12 weeks (Fig. 6A-B).
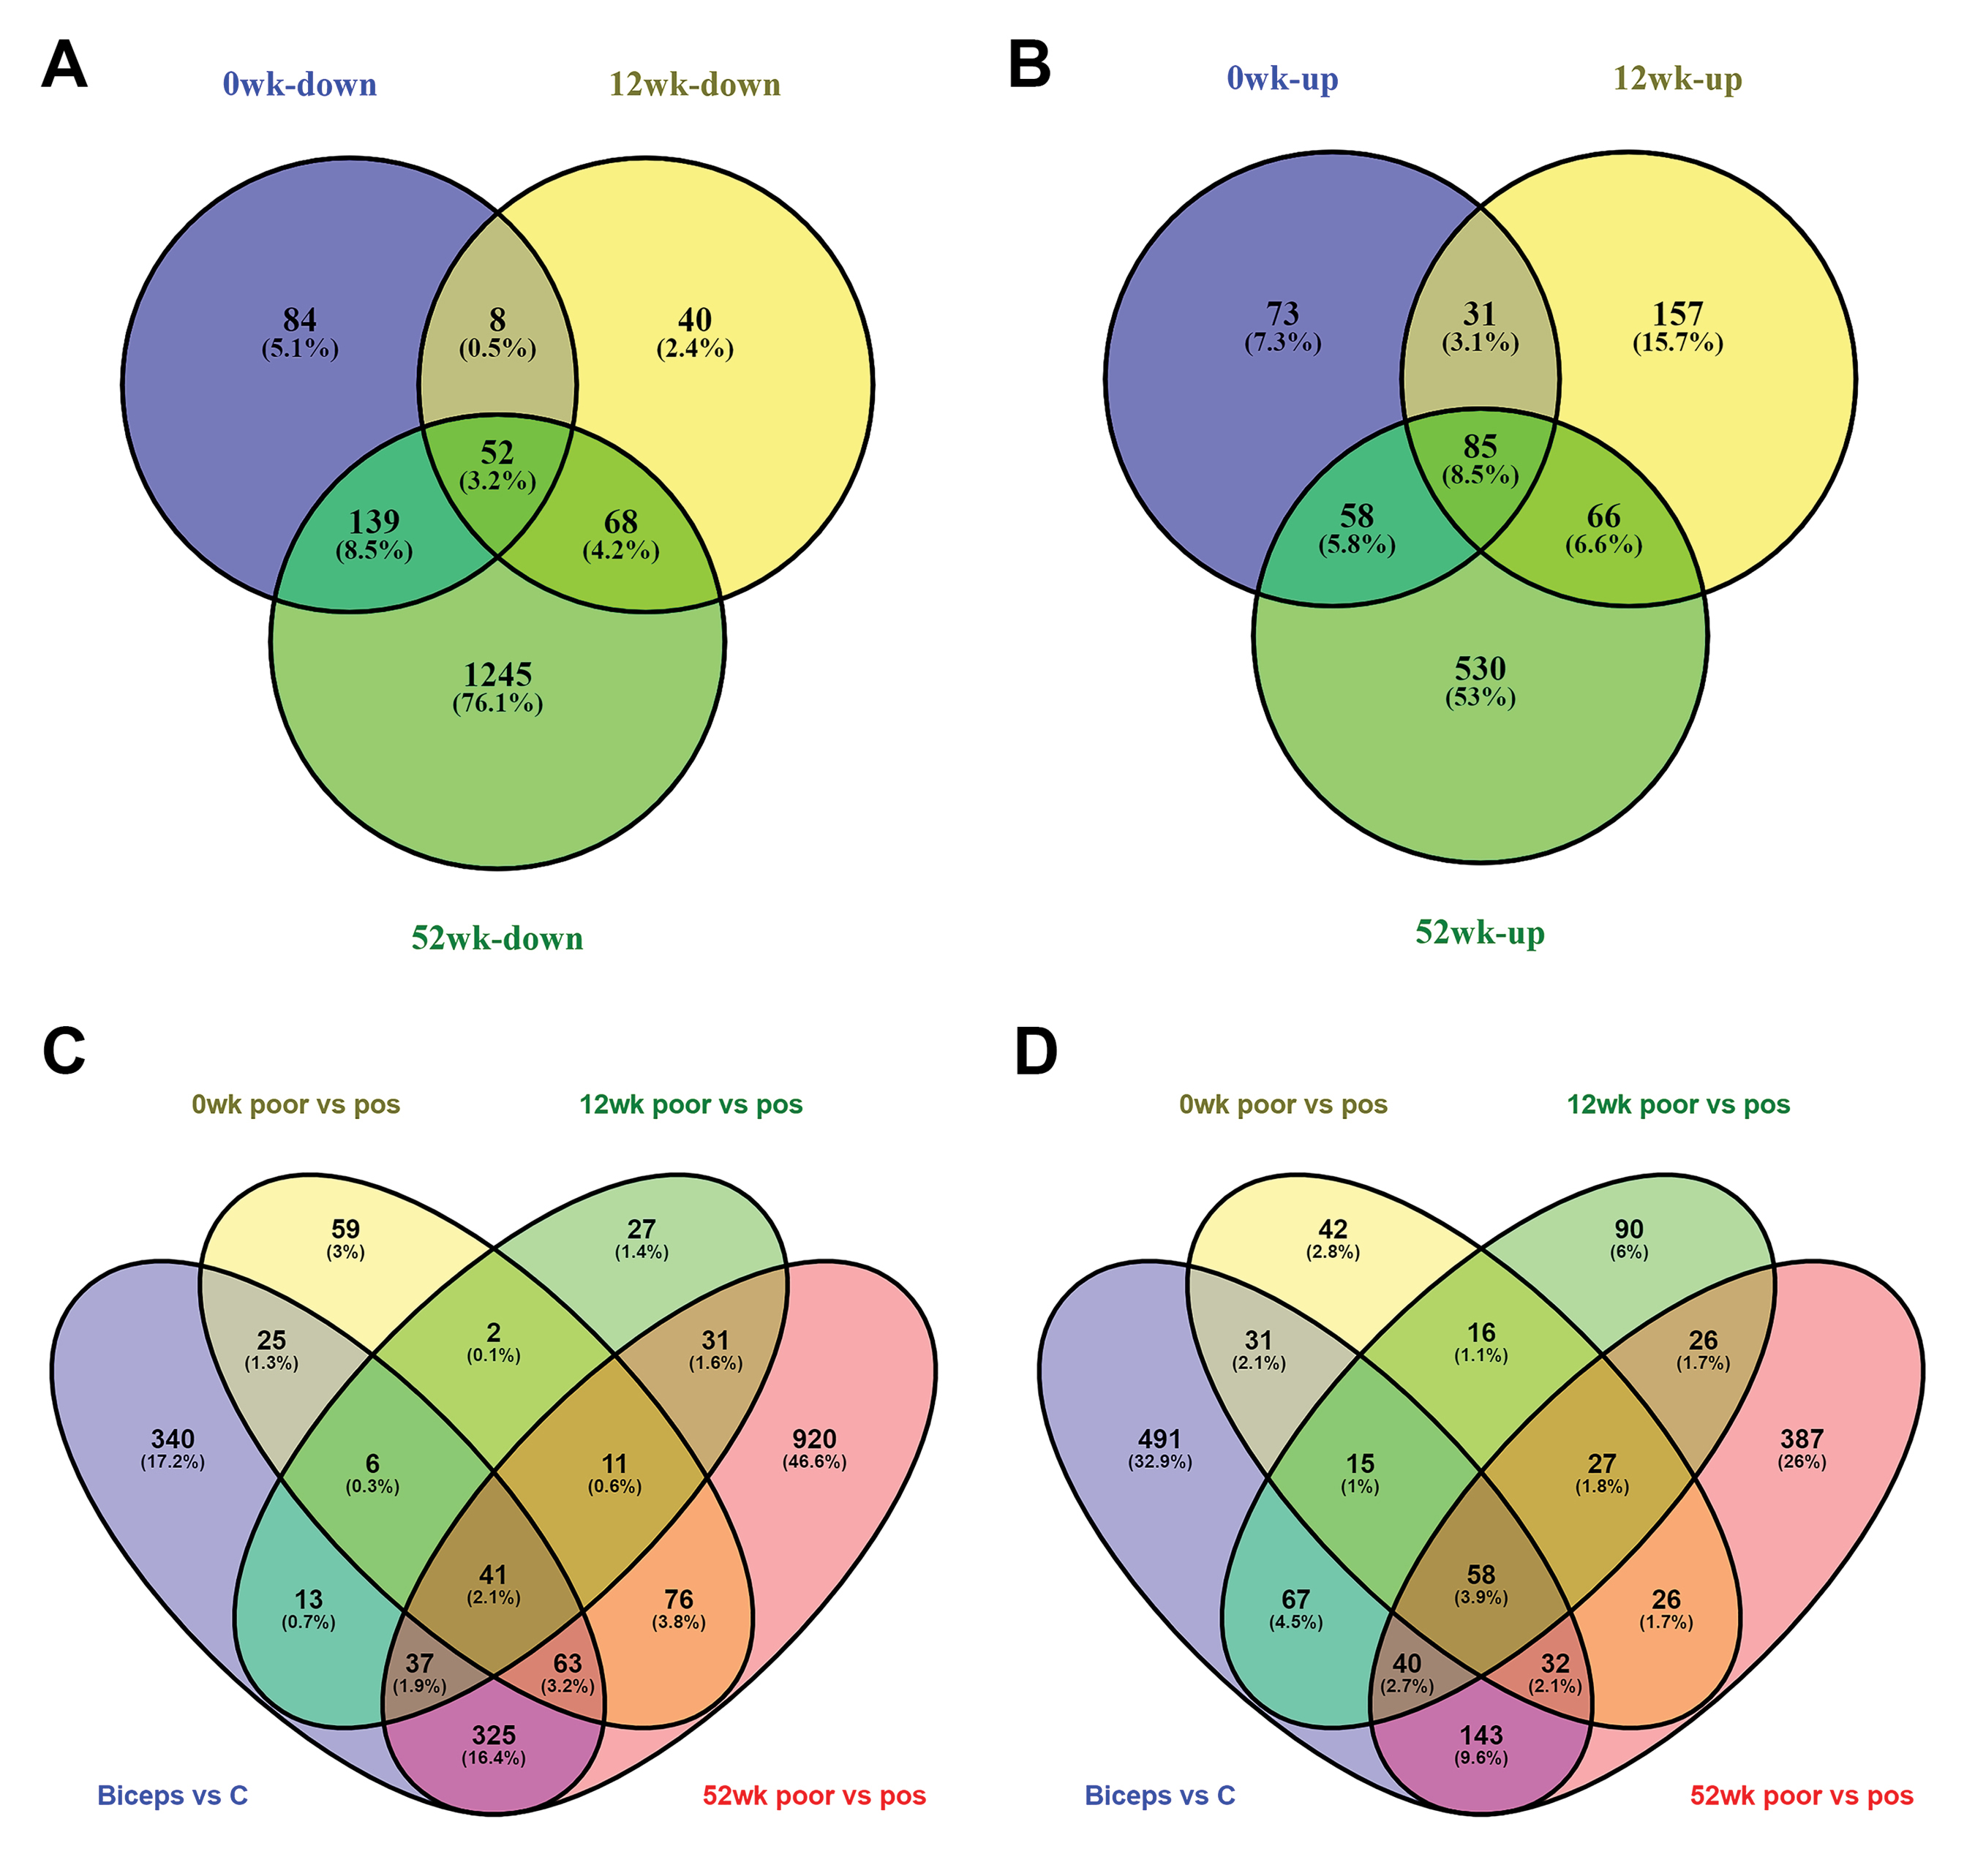
Figure 6.
Panels A–B show the Venn diagrams of differentially expressed genes for poor vs pos comparison for 0, 12, 52 weeks. Panels C-D show the Venn diagrams of the overlapping DEGs, including up-regulated (C) and down-regulated (D), among the four datasets.
.
Panels A–B show the Venn diagrams of differentially expressed genes for poor vs pos comparison for 0, 12, 52 weeks. Panels C-D show the Venn diagrams of the overlapping DEGs, including up-regulated (C) and down-regulated (D), among the four datasets.
The majority of DEGs were enriched especially by Wnt-signaling pathways, autophagy-lysosomal pathways, actin cytoskeleton regulation, and vascular smooth muscle contraction signaling pathways.
Wnt signaling pathway
Another pathway that only emerged in the 52nd week is the Wnt signaling pathway. While no variations were observed at 0 and 12 weeks, the expression of 25 genes changed in the 52nd week in the group with poor response. The 20 downregulated significant genes were CREBBP, CSNK1A1; CSNK2A1, CTNNB1, DKK2, FBXW11, FZD10, FZD7, MAPK8, MAPK9, NFATC2, PRICKLE1, ROCK2, RSPO3, RYK, SIAH1, SMAD3, TBL1XR1, TCF7L2, and WNT11. The 6 upregulated significant genes were APC, CAMK2D, DAAM2, MAP3K7 MYC, and PRKACA (Fig. 7).
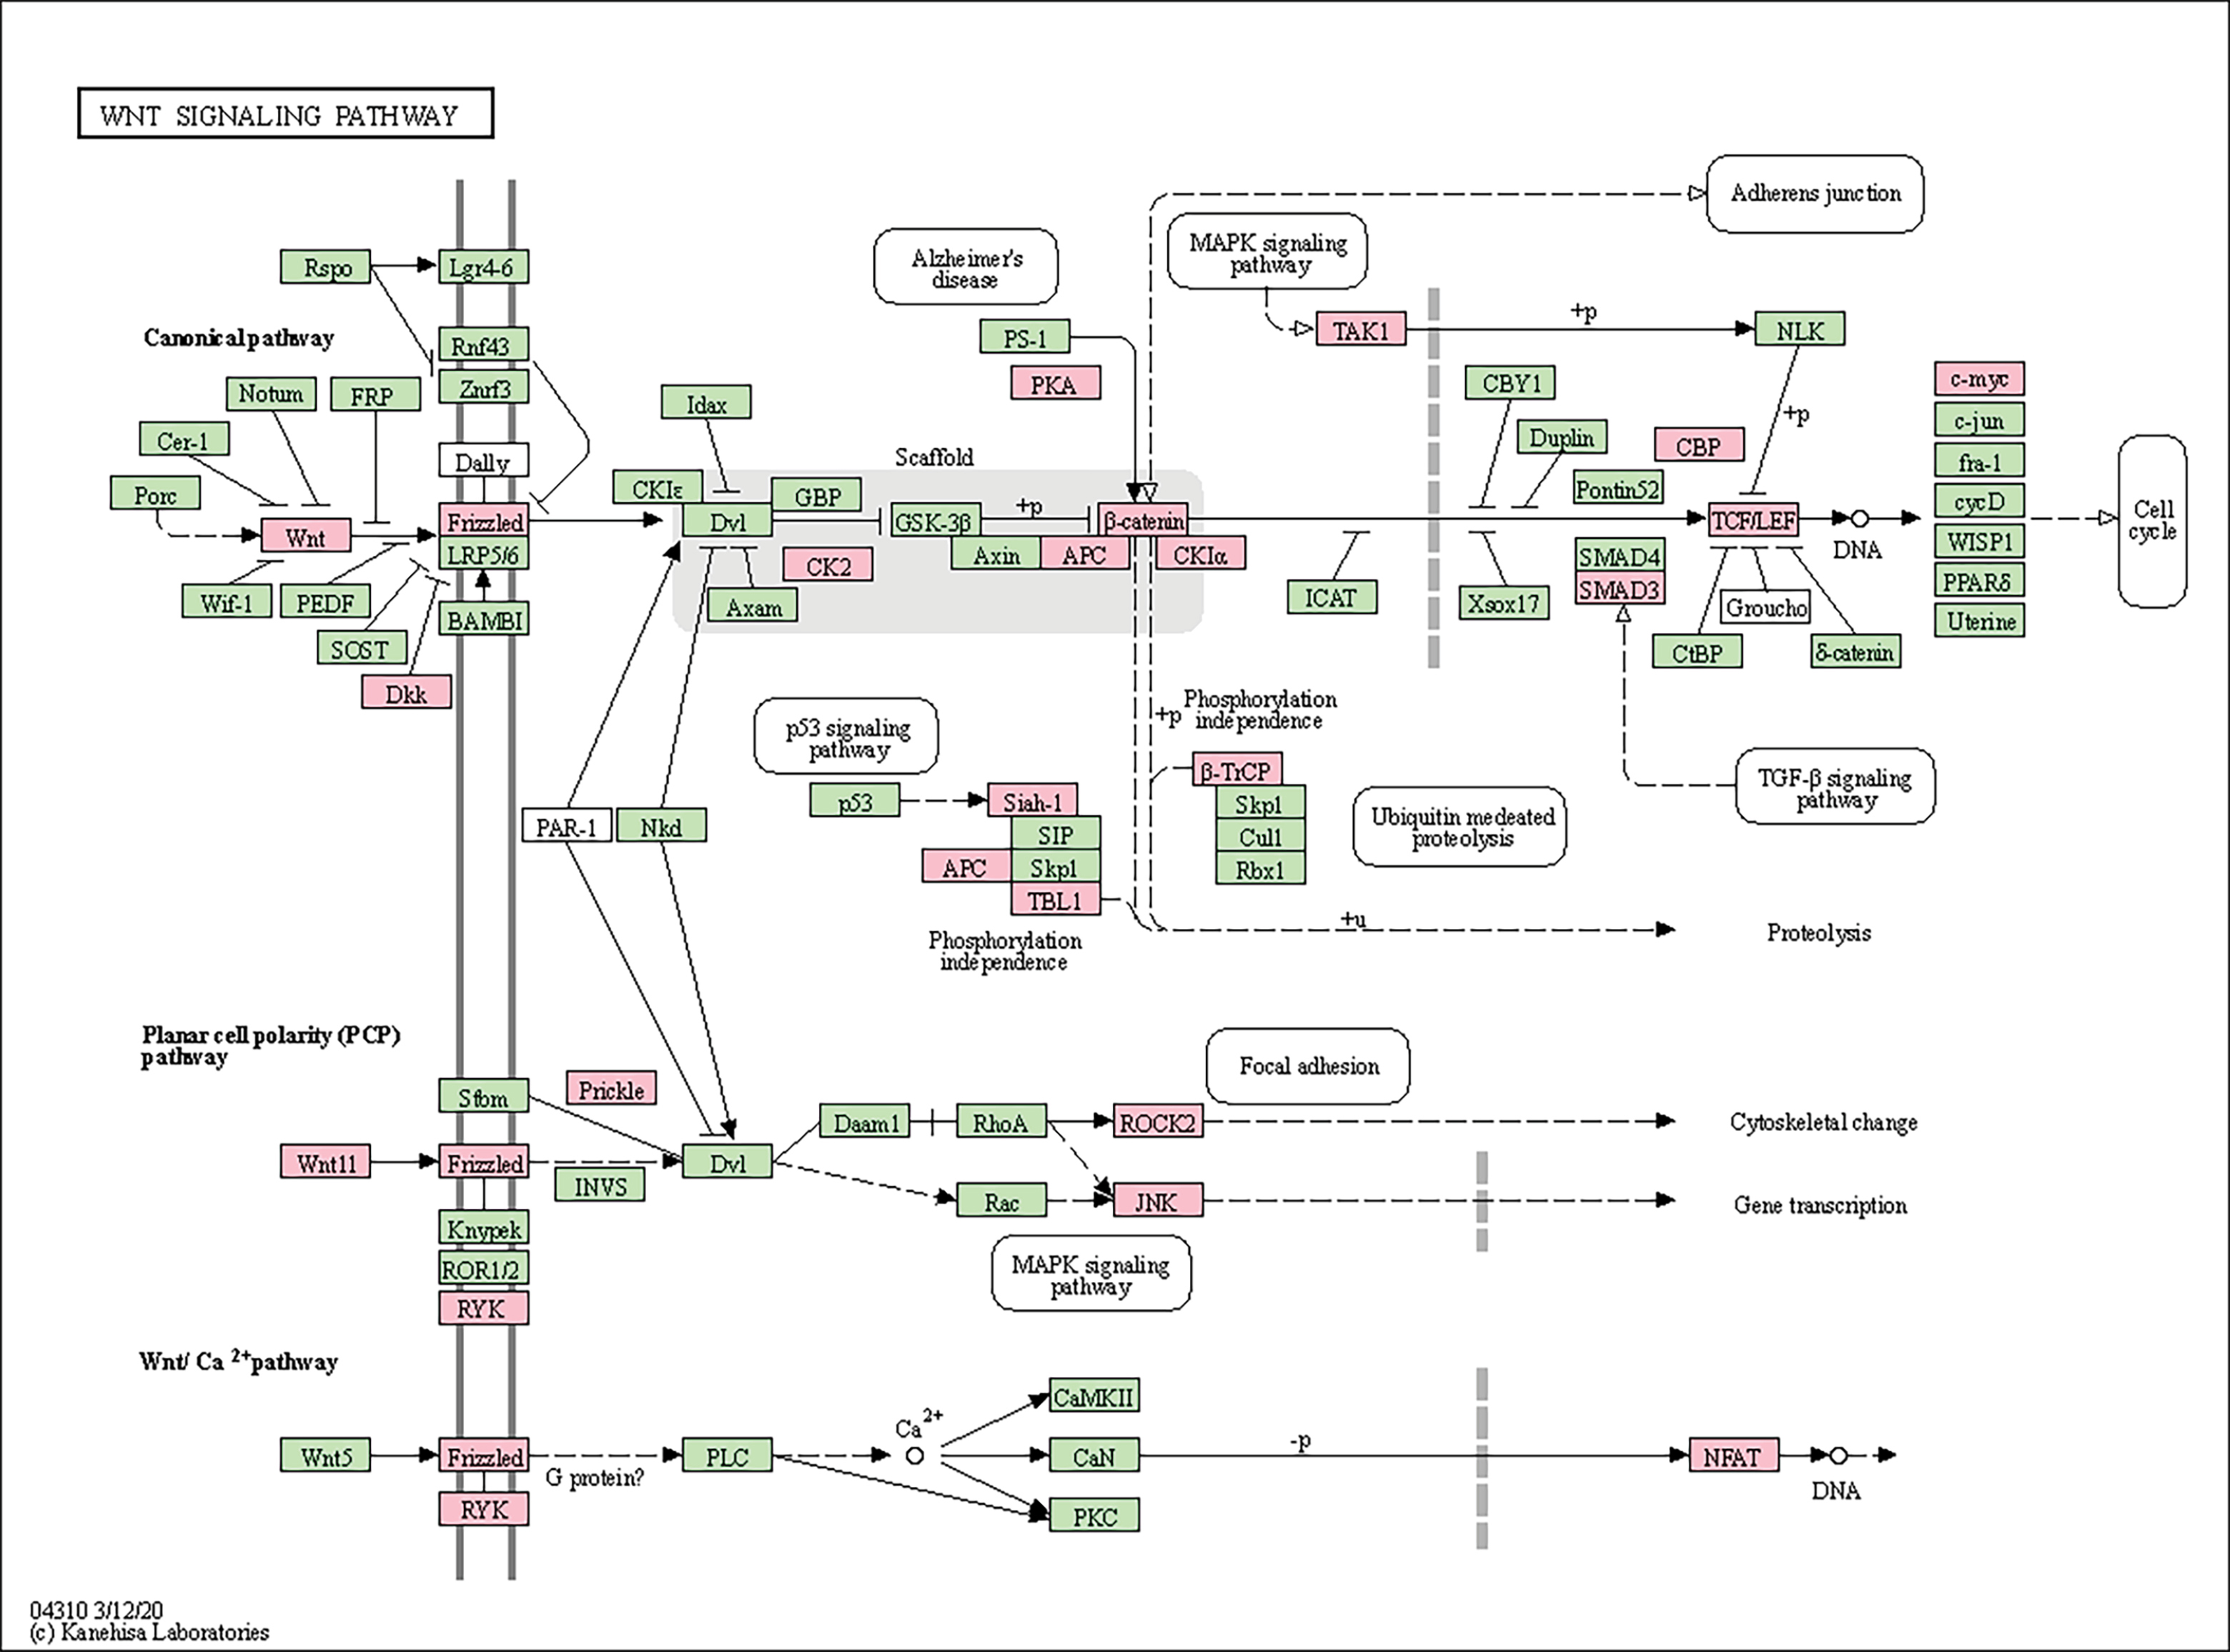
Figure 7.
KEGG pathway functional analysis of differentially expressed genes on WNT signaling pathway.
.
KEGG pathway functional analysis of differentially expressed genes on WNT signaling pathway.
Autophagy-lysosomal pathway
Many gene groups associated with the autophagy-lysosomal pathway were found to be differentially expressed in our study. Genes with increased and decreased expression in the autophagic pathway during ERT treatment were compared between weeks. When the group with poor response to treatment and the group with good response were compared, it was found that expression of the DEPTOR gene decreased and the expression of CFLAR, IRS2, MRAS, TANK genes increased at week 0. It was observed that the expression of the MTMR3 gene decreased and the expression of the PIK3R3 gene increased in the 12th week, while the number of genes whose expression was changed increased in the 52nd week of the treatment. The 13 downregulated significant genes were ATG4C, ATG7, EIF2S1, HMGB1, ITPR1, MAPK8, MAPK9, PIK3C3, PIK3R3 PPP2CA, PTEN, RAB33B, SNAP29, and 8 upregulated significant genes were BCL2, MAP3K7, MAPK1, MRAS, PIK3CB, PRKACA, TANK, and VMP1 (Fig. S1). Genes involved in the KEGG lysosome pathway were expressed more in poor responders to ERT than good responders. Poor patients exhibited increased expression of lysosome-associated genes. In week 0, the lysosomal pathway had increased ASAH1, GNS, LITAF, and SORT1 gene expression, with increased expression of ARSB, GM2A, GNPTAB, GNS, LITAF, SLC11A2, and TPP1 gene in the 12th week (Fig. S2).
Regulation of actin cytoskeleton pathway
Another pathway in which genes are enriched in significant amounts is the regulation of the actin cytoskeleton pathway. While the expression of 17 genes increased, the expression of 32 genes decreased. The 17 upregulated significant genes were ENAH, VAV3, LIMK2, LIMK1, FGF9, DIAPH1, PIK3CB, MRAS, MYL10, MYL12A, ARHGEF12, ITGB1, VCL, MAPK1, EZR, ITGA5, and APC. The 32 downregulated significant genes were FGFR2, FGFR1, MYL5, RDX, GNG12, ITGB3, CDC42, TIAM1, GSN, SOS2, PIKFYVE, PDGFC, PDGFD, FGF1, PIK3R3, FGF2, FN1, EGFR, ROCK1, ARHGEF7, ROCK2, MYLK3, MYLK4, MYLK2, ACTN2, PPP1CC, PPP1CB, CRKL, CFL2, ITGA8, WASL, and CRK (Fig. S3).
Vascular smooth muscle contraction pathway
While expression of eight genes on the vascular smooth muscle contraction pathway was reduced at 0 weeks, by the 52nd week, expression of 19 genes had been reduced. Six genes (MYLK3, MYLK4, MYLK2, PLA2G12A, PLCB1, and CALML6) showed reductions at 0, 12, and 52 weeks, while expression of 13 genes was reduced in the 52nd week (ADCY1, ROCK1, ROCK2, CALD1, PRKCH, PPP1CC, PPP1CB, ITPR1, EDNRA, AGTR1, MYL6B, AVPR1A, and CALCRL) (Fig. S4).
Protein-protein interaction network analysis
Protein-protein interaction networks in which all protein-coding genes in the genome are grouped and coordinated are useful in identifying patients in many studies. To research the molecular pathogenesis of PD, we analyzed differentiated gene expression between Pompe patients and healthy controls using gene expression profiling data with many bioinformatics methods including enrichment analysis and PPI analysis. To research the underlying mechanism for the differing responses to ERT, the 530 genes with increased expression and 1245 genes with reducing expression in the group without response to medication in the 52nd week were additionally examined with STRING and PPI analysis using gene expression profiling data with many bioinformatics methods including enrichment analysis and PPI analysis. All genes were queried in the STRING database and a gene network modeling the functional relationships between these genes were obtained. The minimum required interaction score had the highest confidence chosen as 0.9. Interaction analyses used 504 nodes, 722 edges, 2.87 mean node degree and 0.31 mean. DEGs for increasing genes in the 52nd week had an average local clustering coefficient chosen as 0.31 (PPI enrichment P value <1.0e-16) (Fig. S5-A). Additionally, when networks are examined after protein-protein interaction analysis, of the 15 hub genes with different expressions on the lysosome pathway (M6PR, STX16, AGFG1, LDLR, RHOBTB3, DNM2, AP1S2, CLTB, DAB2, ACTR2, AAK1, ARPC4, ARPC3, CTTN, FNBP1), the M6PR gene, in particular, was identified to have a central role (Fig. S5-B). Seven genes in the focal adhesion pathway interacted (BCL2, ITGB1, MAPK1, ET, MYL12A, TLN1, and VCL), and PPI analysis revealed that the VCL and TLN1 genes had the most interactions (Fig. S5-A).
Of the 1245 genes with reduced expression in the group without response to medication in the 52nd week, STRING and PPI analyses were separately examined and it was found that the number of nodes was 1214, the number of edges was 2544, and the average node degree was 4.19 avg. PPI enrichment p-value: 1.96e-08; expected number of edges: 2276. Six genes playing a role in focal adhesion (YES1, CRK, CRKL, CTNNB1, EGFR, FYN, PIK3R3, and CDC42) interacted, and the FYN gene was shown to have a central role. The YES1 and FYN genes were the two genes with the strongest interactions (Fig. S5-C).
To find key (hub) genes in this PPI network, the significant module was analyzed by using the plug-in MCODE of Cytoscape software. PPI results were made using Cytoscape MCODE and hub genes are shown in decreasing and increasing gene groups. Here, we calculated the degree of connectivity of each node for both the PPI networks. The top 15 proteins with the highest connectivity ratings are identified as hub nodes in PPI networks. The top 15 hub nodes are represented by a circular layout around the other nodes. Among the down-regulated target genes, UBE2D1, ELOC, CUL3, SMURF2, UBE2V2, UBE2B, CDC26, CDC23, FBXL3, FBXW11, RCHY1, ATG7, FBXW2, ASB1, and KLHL20 were shown to have the highest node degree. UBE2D1 (leucine-rich repeat kinase-2) was shown as the core gene according to the MCODE score and the highest physical interactions with adjacent nodes (degree = 47) (Fig. 8). For the upregulated target genes, ANAPC5, FBXO9, HUWE1, HERC5, FBXO32, FBXO10, RBBP6, SPSB1, RNF213, SOCS3, DTX3L, RNF130, HERC6, LMO7, and WSB1 were associated with the highest node degree and the MCODE score. ANAPC5 (anaphase-promoting complex subunit 5) was shown as the core gene according to the MCODE score and the highest physical interactions with adjacent nodes (degree = 18) (Fig. 9).
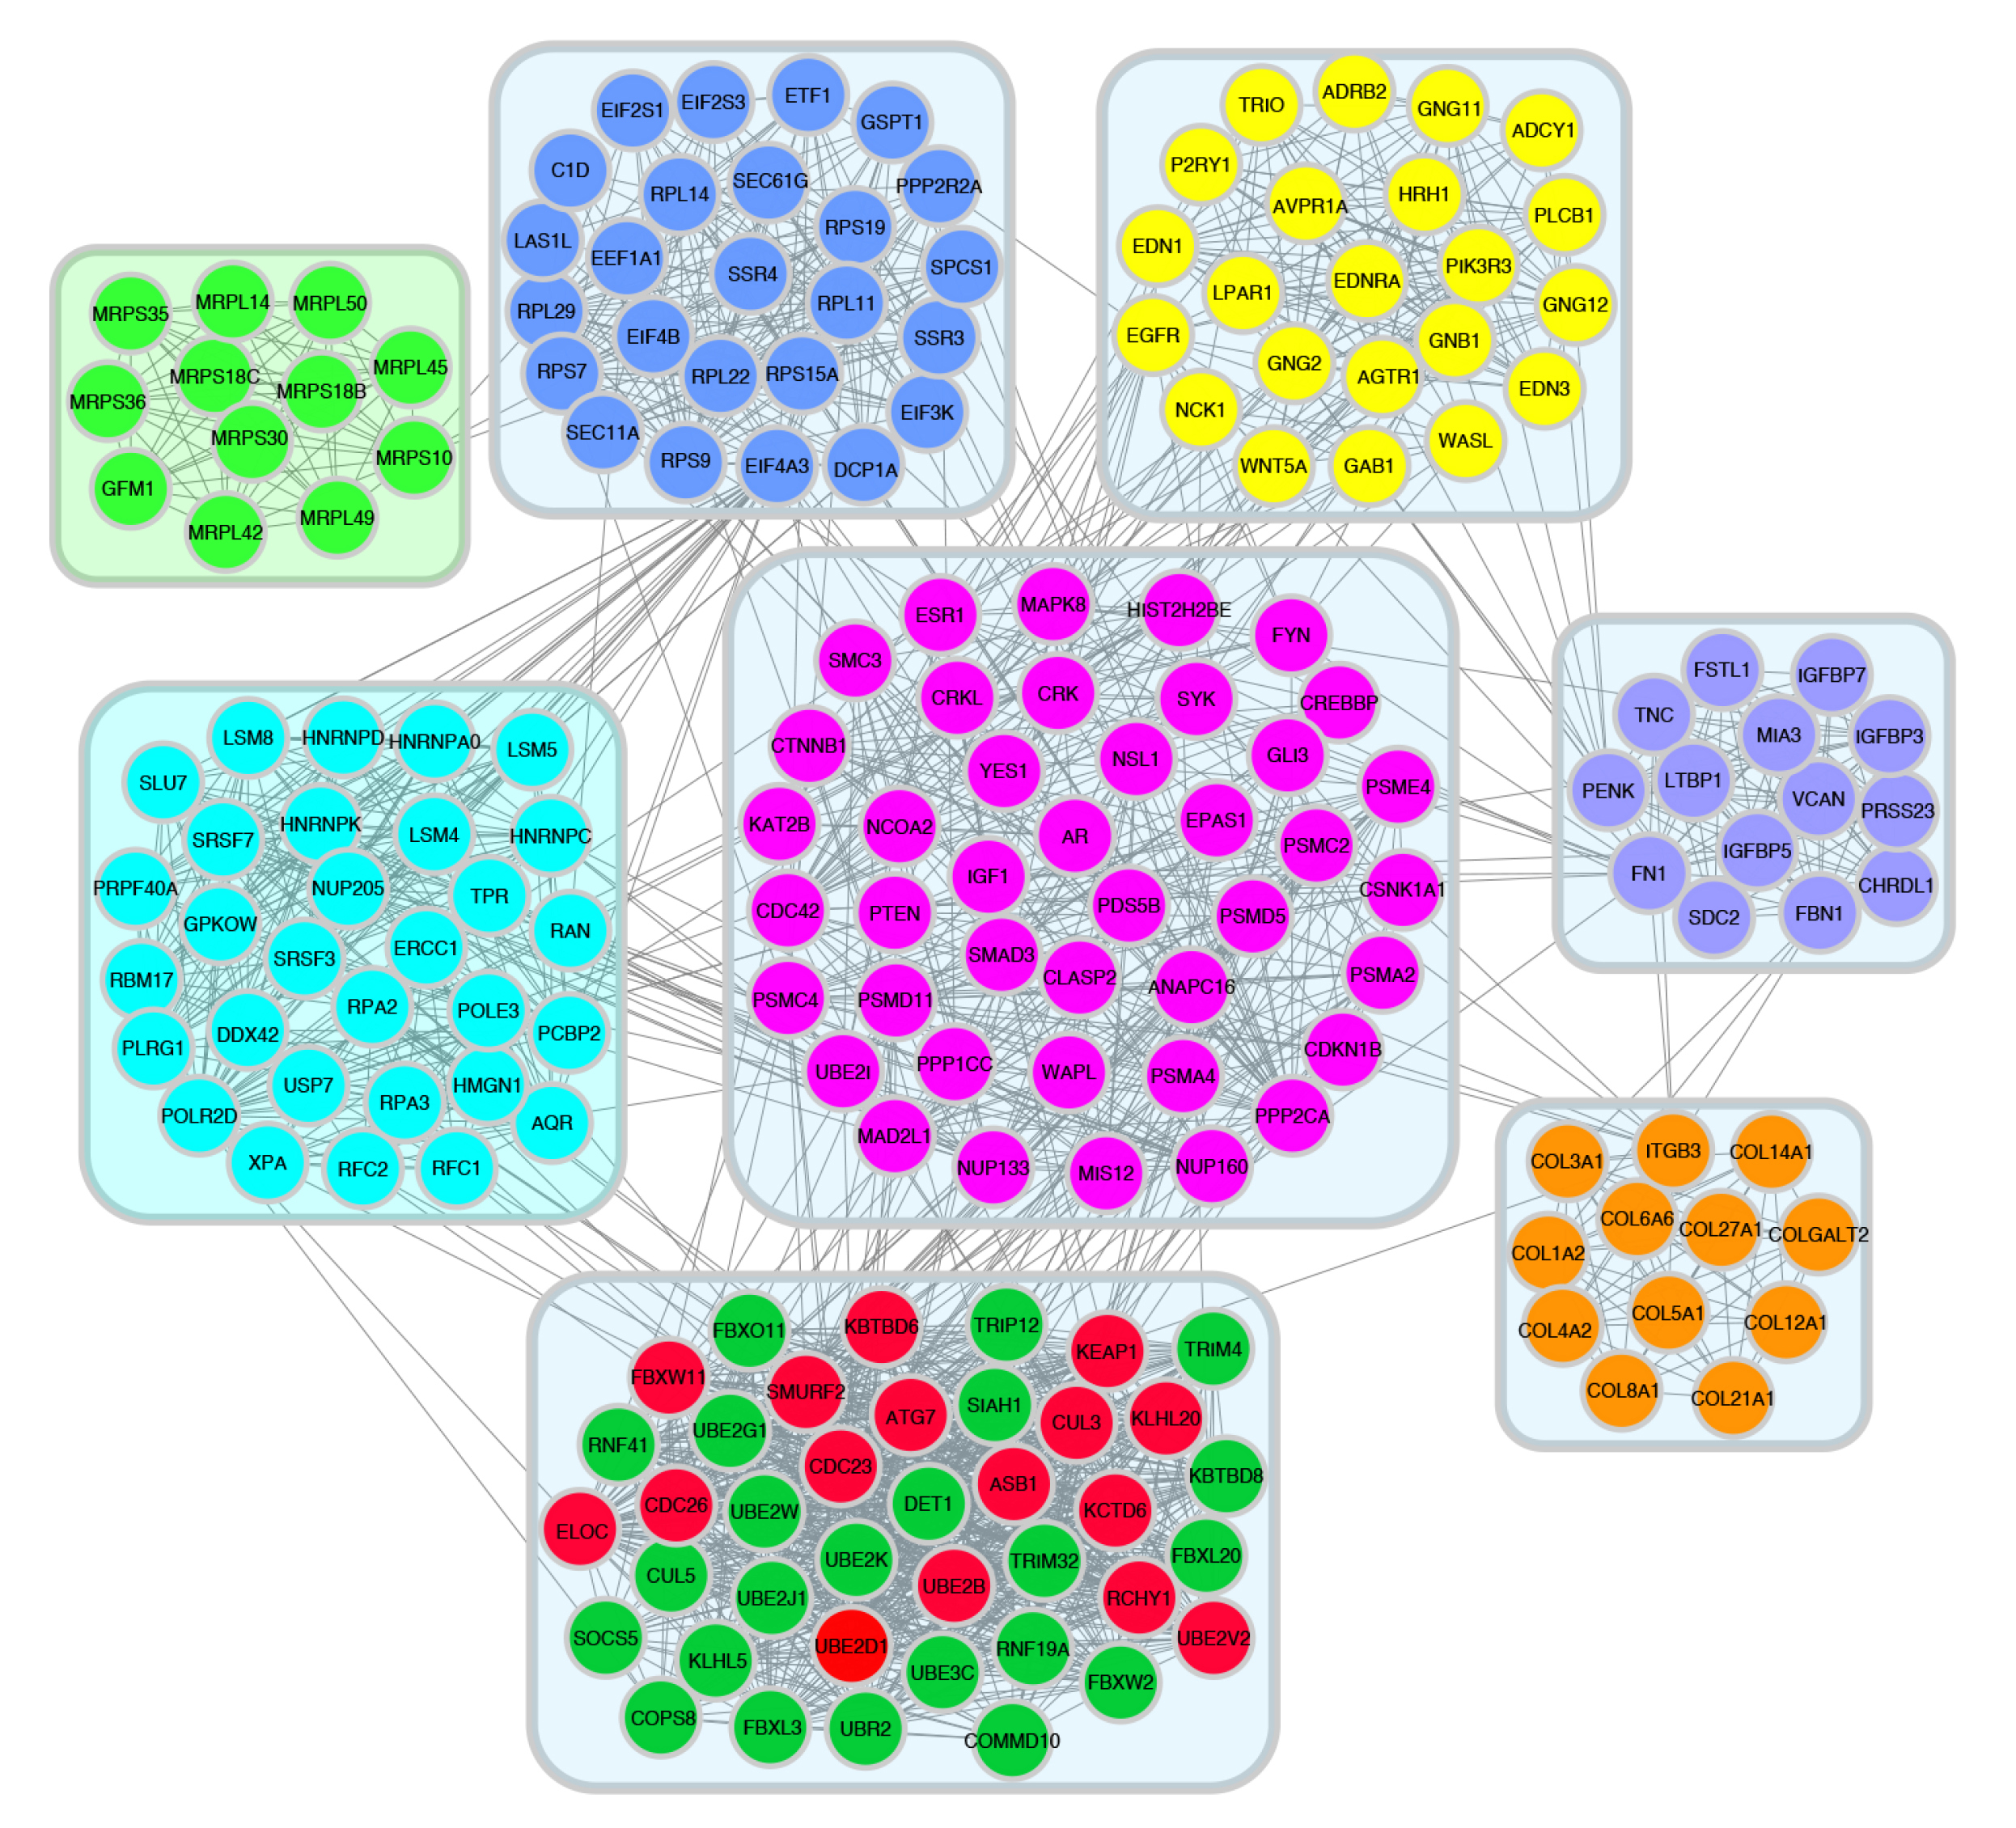
Figure 8.
52wk poor vs pos downregulated PPI network was analyzed by MCODE plugin in cytoscape software.
.
52wk poor vs pos downregulated PPI network was analyzed by MCODE plugin in cytoscape software.
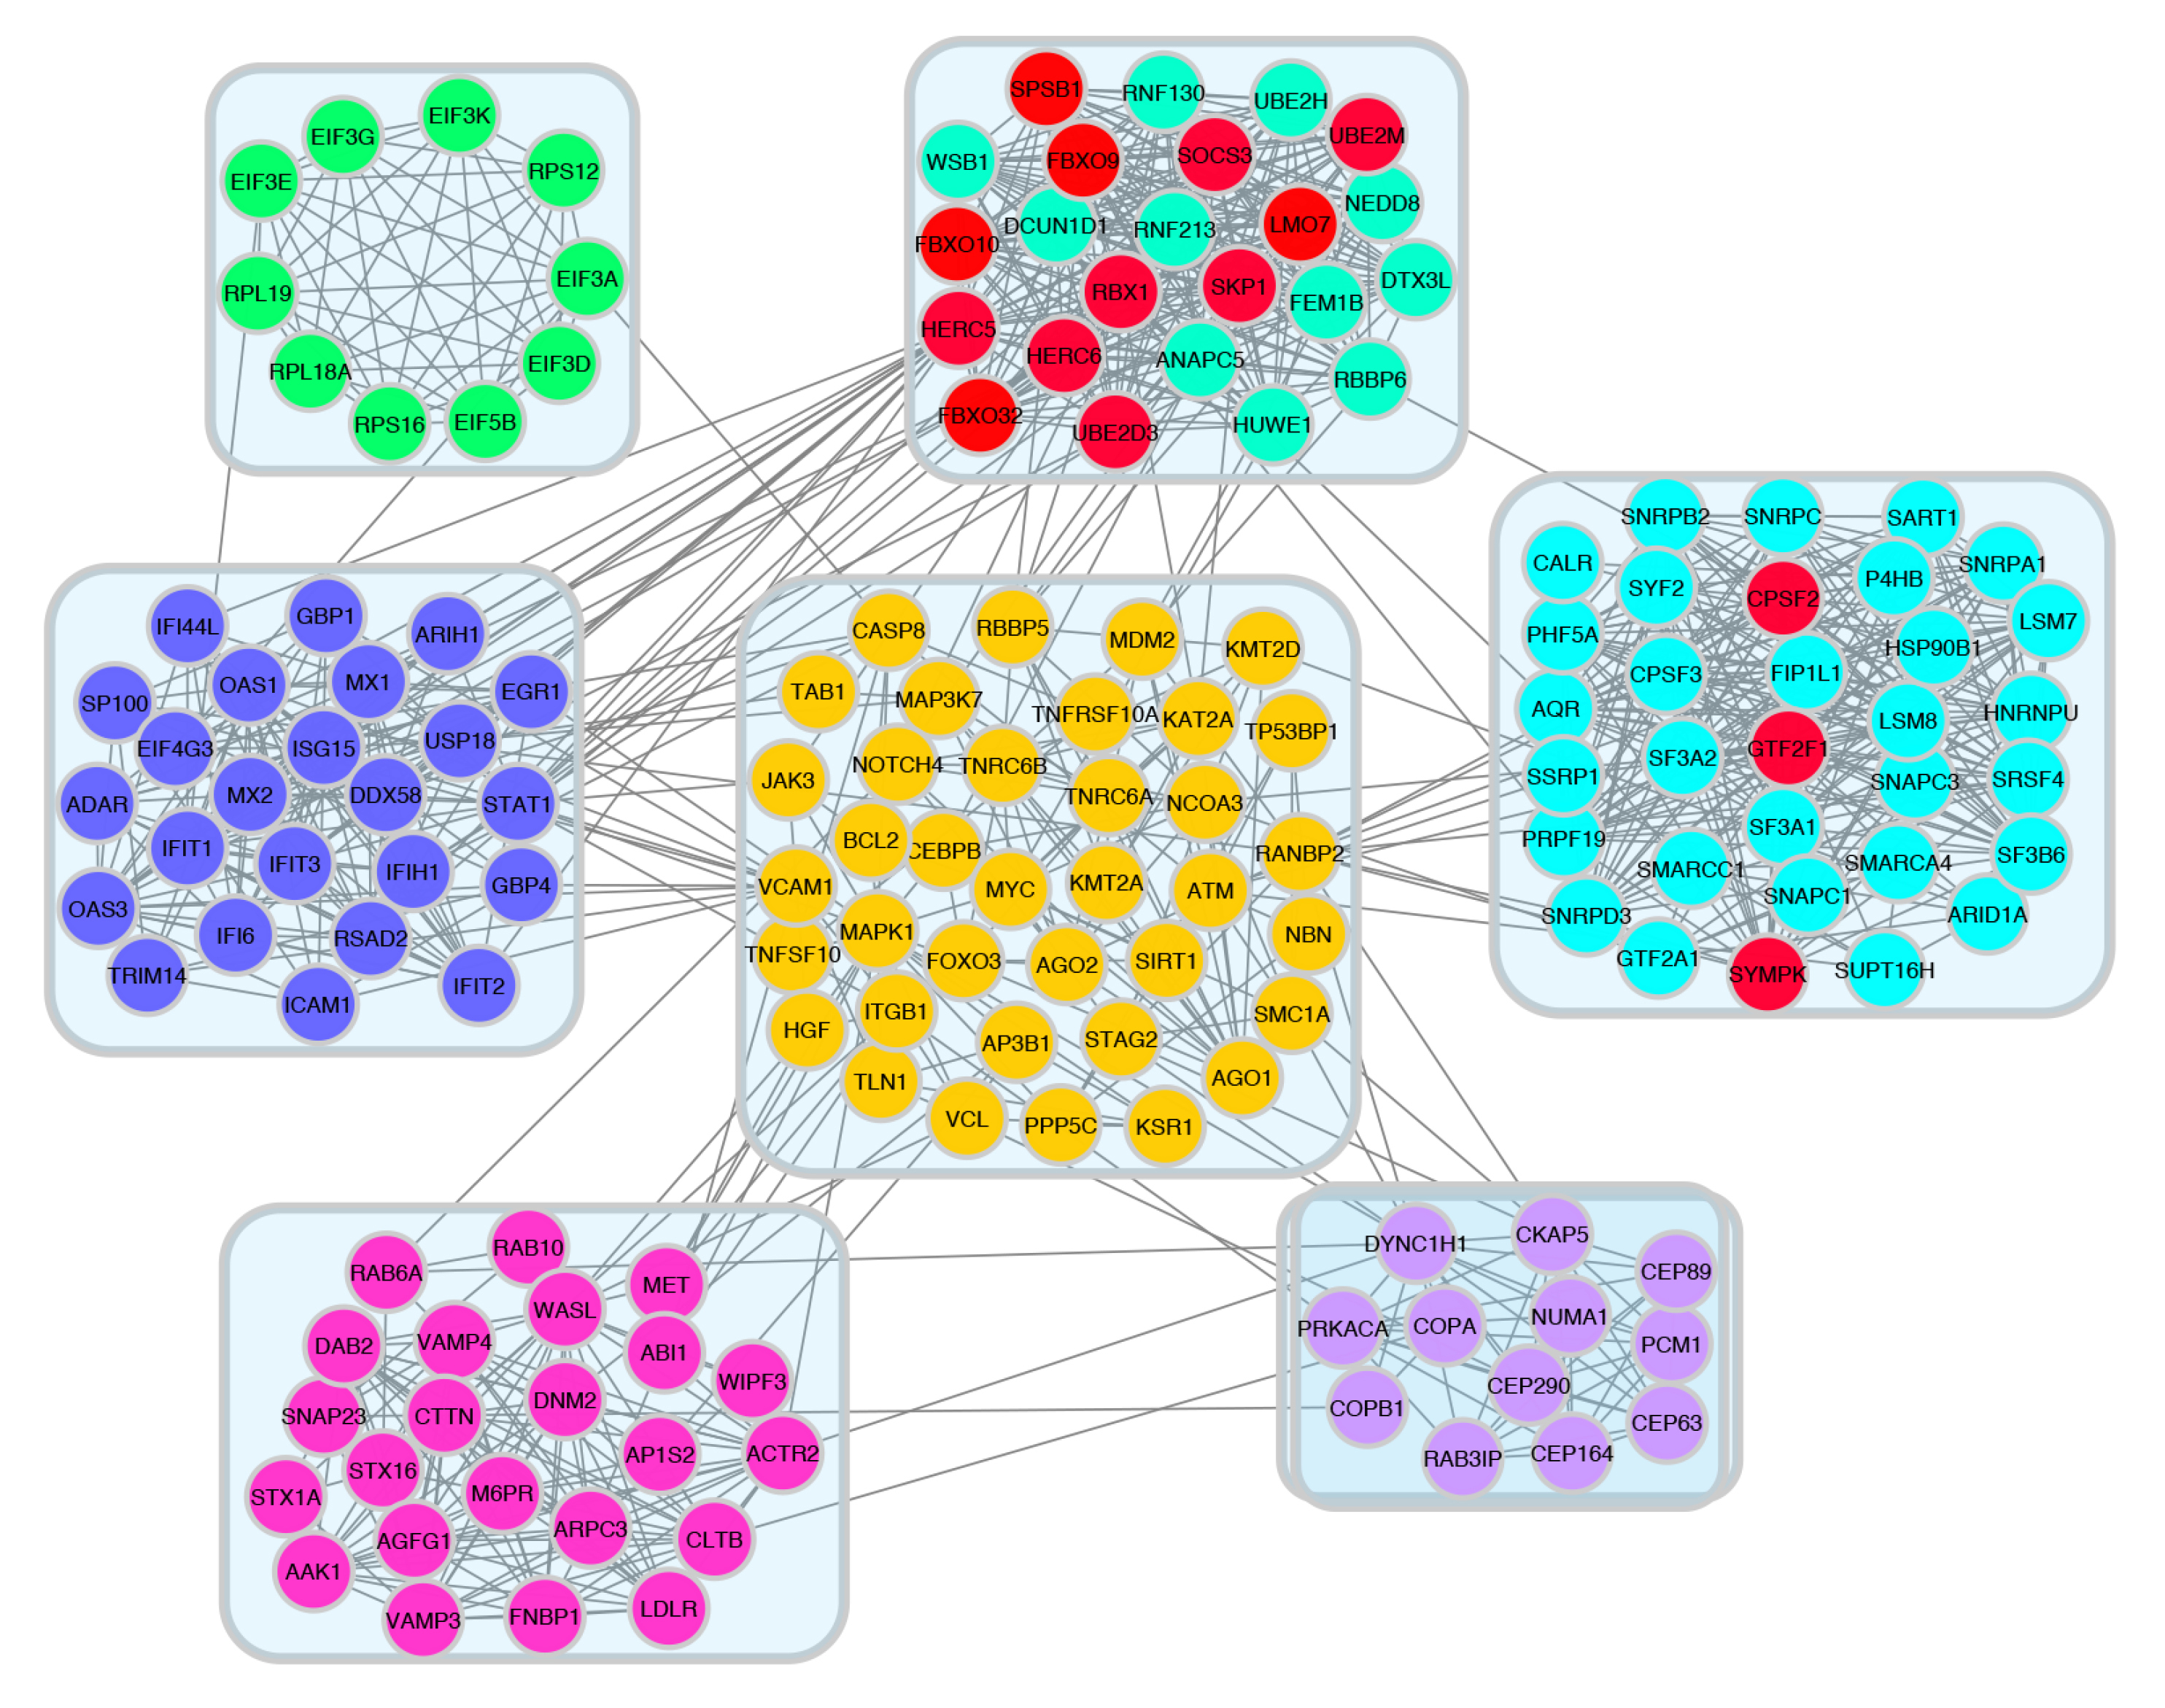
Figure 9.
52wk poor vs pos upregulated PPI network was analyzed by MCODE plugin in cytoscape software.
.
52wk poor vs pos upregulated PPI network was analyzed by MCODE plugin in cytoscape software.
Discussion
Transcriptomics technology is an effective tool to reveal variations in gene expression and thus enlighten the molecular mechanisms of complicated diseases.
18
In recent times, rapidly developing microarray technology has provided new opportunities to compare expression levels of genes, to predict disease progression, to make accurate diagnoses, to assess prognosis, and to discover disease-specific mechanisms. In this study, the goal was to understand the molecular effects of disease processes in tissues with PD and with ERT and to identify possible biomarkers effective in disease progression. The dataset with gene expression profile access number GSE38680 in the GEO database was downloaded and transcriptome profiles for genes expressed in 2 different muscle groups were compared. Microarray data analysis-bioinformatics methods were used to analyze samples from the biceps and quadriceps muscle groups with well-characterized patterns and disease patterns. To assess differences between muscle groups, each group was compared with their controls and with each other. The gene expression profiles for biceps, quadriceps and patients receiving ERT treatment were determined.
Infantile-onset PD is a rarely seen mortal muscle disease. In spite of the disease being known clinically for over 75 years, there is still no effective treatment, though there have been advances recorded during this period.
2,19
The most promising therapeutic approach for the PD of ERT was developed; though evidence about optimal dose, dose frequency, and treatment resistance is insufficient.
20
The most important limitation in relation to accurate research into the pathophysiology of PD is the need for muscle tissue samples. The use of samples from different muscle groups to investigate the pathophysiological progression of disease and medication effects makes this study valuable. The study simultaneously compared two different muscle groups in addition to those receiving ERT treatment and those not, and those responding to treatment or not (poor response and good response). It is important to understand pathophysiological development more comprehensively at the cellular level to develop effective treatments. We completed gene expression analysis at the comparative genome level for data obtained from muscle tissues to research biomarkers that may be beneficial to monitoring the therapeutic effects of medications in PD. When evaluated with our results, these genes may be used as molecular markers to assess the effectiveness of medication treatments.
GAA deficiency in PD, along with other genetic and environmental factors, causes a range of transcriptional responses contributing to the disease process and clinical spectrum. Identifying transcriptional differences that contribute to the disease phenotype will guide treatment. ERT with rhGAA, showing interesting variable efficacy in various PD patients, is the only treatment for PD. When patient groups with poor and good responses to ERT in the quadriceps group are compared, the increase in variable gene counts in the 52nd week in the group with poor response to treatment is notable (Table 2). Detailed analysis was performed on genes other than the ones with common changes in 0, 12, and 52 weeks, to research whether they play a role in treatment resistance. When analyses are performed on genes with increasing and reducing expression, it will allow the possibility to assess the emerging genes and pathways in the treatment process and show genes and/or gene groups that are biomarker candidates. Assessment of genes in the patient group with poor response to treatment will be beneficial to find a transcriptional biomarker for infantile-onset PD pathology.
The complexity of the pathogenic cascade in PD makes it important to analyze pathways in detail to target specific aspects of pathogenesis. Two of the pathways identified in our study are the autophagy-lysosomal pathway and the Wnt signaling pathway. Many gene sets associated with the autophagy-lysosomal pathway were found to be differentially expressed in our study. Defective autophagy is a clear feature in PD. Autophagic debris accumulation and growth of lysosomes filled with glycogen in skeletal muscle are histological indicators of PD. Several studies have shown that non-functional autophagy contributes to muscle damage or weakness in a variety of diseases, including PD. Different expression levels of genes, which play important roles in autophagy pathway induction, explain the resistance to therapy in the group with poor responses during ERT treatment.
The lysosomal pathway, which is among the most affected pathways in PD, is among the pathways in which genes whose expression is decreased in the group that responds poorly to treatment at 52 weeks. The lysosomal pathway with reduced expression of genes is among the most affected pathways in PD. In PD, the lysosomal function is disrupted in skeletal muscle because of excessive glycogen storage; this blocks autophagic flow and causes autophagic accumulation in type II muscle fibers. Disruption of the lysosomal-autophagic system prevents intracellular traffic, obstructing disruption of dysfunctional organelles, accumulating undisrupted material, and disrupting muscle fine structure, significantly affecting muscle functions. Recent publications in infants with early diagnosis and early treatment initiation have been shown to have more positive clinical outcomes.
7,15
However, there is variability reported among treatment responses in patients.
21-23
A study by Drost et al researched whether there was treatment resistance in people with type II fibers and whether the motor function improvement in patients with good responses was only based on the reaction of type I muscle fibers. When muscle biopsies before and after treatment in an infant beginning treatment at 3 months and with a good response at 17 months were compared with healthy infants, with late initiation of treatment, type II glycolytic muscle fibers (fast-twitch) were resistant to treatment and displayed a negative response, and this lowered the efficacy of enzyme treatment.
24
In our study, the increase in the number of DEGs in the group with poor treatment response in the 52nd week may explain treatment resistance in muscles related to these genes and accumulation in the lysosomal pathway. In a PD knockout mouse model, glycolytic muscle fibers (type II) were more resistant to oxidative fibers (heart and skeletal muscle type I) during treatment. During 2 months of treatment, type II fibers were reduced by 35% compared to healthy mouse fibers, while type I fibers were observed at normal dimensions.
25
Additionally, the lower reduction in lysosomal glycogen and lower regain of lysosomal division in type II was less than in type I fibers.
25,26
Fukuda et al showed that type II fibers were resistant to treatment based on these findings.
27
Analysis of the lysosomal pathway revealed significant differentiation in gene expression in the group with poor response to treatment. While there were 4 genes expressed differently in week 0, the expression of 7 genes differentiated in the 12th week of treatment, and the expression of 14 genes differed in the 52nd week. It appeared that differentiation of important genes with duties in the transport of lysosomal enzymes synthesized with treatment occurred in this pathway. The differentiating genes can be said to be candidate genes playing a role in enzyme treatment resistance or may be associated with the onset of resistance. When M6PR expression is down-regulated specific to the liver, rhGAA conduction efficiency in muscle tissues increases, and it was shown that in addition to ERT in PD, M6PR-mediation may increase the efficacy of ERT in other lysosomal storage diseases.
28
In the group with a poor response to treatment, M6PR expression increased in week 52. Monitoring the expression of genes determined in the treatment response will provide information about the clinical response (Fig. S2). GNPTAB catalyzes the first step in the synthesis of mannose-6phosphate identification markers in certain oligosaccharides in newly synthesized lysosomal enzymes in the Golgi apparatus. GNPTAB expression began to increase from the 12th week in the group with poor response to the drug. SCARB2 expression coding for LIMP2 is reduced, and studies show reduced expression of LIMP2 in a variety of tissues causes a severe reduction in GCase activity and most enzymes are released in the extracellular compartment.
29
Fibroblasts providing LIMP2 support appear to regulate both GCase activity and lysosomal traffic. SCARB2 gene mutations cause myoclonus-renal failure syndrome of action and myoclonus epilepsy, which is rarely observed. Myoclonus-renal failure syndrome is a part of the phenotypic range of Gaucher disease, and it was emphasized that SCARB2 may act as a modifier in Gaucher disease in the functional relationship between LIMP2 and GCase.
30
Another notable pathway is the Wnt signaling pathway. In previous infantile or late-onset PD transcriptome studies, DEGs were not associated with the Wnt signaling pathway. Especially in the group with poor response to ERT and the biceps control comparison, the DEGs were enriched in the Wnt signal pathway. The result of our detailed bioinformatics analysis showed that various genes on this pathway were enriched in the patient group with poor response to ERT (Fig. 7). Only two genes in PLCB1 and RSPO3 were reduced in weeks 0, 12, and 52. When we examined the literature, we did not encounter any data showing a correlation between PD and the Wnt signal pathway. Wnt signaling has an important role during cardiac development in vertebrates and maybe re-stimulated in response to heart injury. Cardiac findings are an important comorbid clinical problem in most pediatric metabolic diseases. In fact, cardiac findings may be the first clinical symptom of some metabolic diseases. Cardiac involvement in congenital metabolic diseases may be in the form of hypertrophic, dilated, or restrictive cardiomyopathy, rhythm disorders, valve disorders, or congenital cardiac structural disorders. Cardiac findings cause a significant increase in morbidity and mortality during disease progression. Diagnosis of PD may be made prenatally with the identification of hypertrophic cardiomyopathy.
31
In our study, activation of this pathway in the group with poor response to ERT may be a marker of reduced expression of many genes and cause resistance to treatment. Potential therapeutic approaches may be considered that increase cardiac repair after injury using Wnt/β-catenine signal pathway modulators.
Many signal conduction pathways, including the Wnt signaling pathway, were shown to be broadly affected. When we examine Fig. 7, differentiation of expression of genes (DKK2, FZD10, FZD7, RSPO3, TCF7L2, and WNT11) in the triggering stages for activation of Wnt signaling leads to the consideration that this pathway may be important. We believe genes emerging from our microarray data are a good starting point for future research. More effort is required to determine the mechanism with separate studies on a pathway basis. A potential novel therapeutic target for PD may be the Wnt signaling pathway.
ERT is the only treatment available for PD, especially regained cardiac function, significantly prolongs life for patients with infantile-onset.
14
However, the effect on skeletal muscle is much less. Though treatment in late-onset patients stabilizes neuromuscular and respiratory functions, the effect is generally of short duration and is followed by a fall.
32-34
Furthermore, most surviving infants experience muscle weakness and most have a motor and respiratory functions that gradually worsen. Those who develop high CRIM-negative recombinant antibody titers have particularly poor treatment results.
6,10,35,36
The clinical range extends from fatal hypertrophic cardiomyopathy and myopathy of the skeletal muscle in children to moderately weakened types of advanced myopathy without cardiac intervention. The available ERT is successful in reversing cardiac muscle damage. However, it has not been proven for skeletal muscle abnormalities. The pathophysiology of muscle injury in the disease is not fully understood.
To research the underlying mechanisms for the variable response to ERT, enrichment analysis and PPI analysis results revealed the interaction of many gene groups, and a gene network was obtained by modeling the functional relationships between these genes. PPI networks were mapped to find the correlations between PD prognostic biomarkers and prognostic DNA biomarkers in PD. Many genes are associated with KEGG pathways. In the focal adhesion pathway, the three nodes with the most interactions on PPI analysis were the VCL and TLN1 genes. The genes talin (TLN1) and vinculin (VCL) encode various structural proteins and ensure interactions with actin filaments on integrins. VCL is expressed in all sites binding actin cell skeletons to sarcoma and is a membrane-linked protein that indirectly binds to integrins via talin. A study by Zemljic-Harpf et al found talin-1 expression in cardiomyocytes in patients with heart failure was increased compared to control cells.
37
The reduction in cardiomyocytes' TLN1 expression was shown to assist cardiac remodeling.
38
Vasile et al showed that obstructive hypertrophic cardiomyopathy was associated with reduced VCL expression in intercalation disks. In our study, the increase in expression of these two genes leads to the consideration that they play a role in the resistance and lead to cardiac disruption. In previous studies, these two genes were not associated with PD.
39
The increased VCL and TLN1 expression in the group without response to medication may be associated with worsened prognosis (Fig. 10A). Additionally, when networks are examined after protein-protein interaction analysis, the differentially expressed M6PR gene was identified to have a central role among genes with increased expression in the lysosome pathway (Fig. 10B). As a result, they may act as a marker for PD diagnosis. The FYN gene related to focal adhesion was shown to play a central role among genes with reduced expression in the unresponsive group in week 52. Two genes, YES1 and FYN, were found to have the strongest interaction (Fig. 10C). Some components of the focal adhesion molecules participate in structural interactions between membrane receptors and the actin cell skeleton. This leads to the consideration that it may be an important pathway requiring research for disruption of structures related to muscle structure and response to medication. Another emerging pathway in string analysis of reducing genes is the cell cycle. Among nine genes (CDC20, CDC23, CDC26, CREBBP, MAD2L1, RBL1, SMAD3, SMC3, and TFDP1) in the cell cycle pathway with differential expression, CDC20, CDC23 and CDC26 were found to have the highest node numbers. In the IOPD iPS-based skeletal muscle model created by Yoshida et al previously, the cell cycle or cell proliferation pathways emerged among 175 genes and increased expression of MYBL2, NDC80, CCNB2, GINS2, MAD2L1, CCNA2, TPX2, BUB1B, CCNB1, and UHRF1 was shown in the group receiving ERT.
40
The reduction in expression of cell cycle genes in the group without a response to ERT indicates that a detailed study of this pathway will be beneficial.

Figure 10.
Protein-protein interaction (PPI) network of 52wk poor vs pos downregulated and upregulated DEGs by STRING. A. VCL and TLN1 genes PPI interactions B. M6PR gene PPI interactions C. YES1 and FYN genes interactions PPI. Circles define genes, lines show protein interaction between genes, and the structure of proteins is defined by the results inside the circle. The color of the line shows indications of protein interaction.
.
Protein-protein interaction (PPI) network of 52wk poor vs pos downregulated and upregulated DEGs by STRING. A. VCL and TLN1 genes PPI interactions B. M6PR gene PPI interactions C. YES1 and FYN genes interactions PPI. Circles define genes, lines show protein interaction between genes, and the structure of proteins is defined by the results inside the circle. The color of the line shows indications of protein interaction.
It has been revealed that the genes with decreasing expression (first 15 hub genes) and increasing expression (first 15 genes) have the highest degree of nodes, especially "Ubiquitin mediated proteolysis, cell cycle, protein processing in the endoplasmic reticulum, Wnt signaling pathway." (Fig. S5 A-B) It has been observed that the genes with increased expression are divided into 7 modules, and the genes with decreasing expression are collected into 8 modules (Fig. 8). The ubiquitin-proteasome system, autophagy-lysosomal, and calcium-dependent pathways (ribosome) regulate muscle proteolysis. Protein degradation through the ubiquitin-proteasome pathway is largely responsible for the loss of muscle mass in a wide variety of systemic disorders, including diabetes, renal failure, immobility, and cancer. The pathways in which hub genes are effective suggest that the normal balance between protein synthesis and degradation in diseased muscle is disturbed, resulting in a loss of contractile protein and reduced muscle function.
41-43
This explains that it contributes to resistance to ERT. In biological processes such as the cell cycle, the DEGs in the sub-net were considerably enriched, and pathway research showed that they were substantially enriched in the cell cycle. In the PPI network study, the hub genes that were discovered could play important roles in the aberrant signaling pathways and are possible targets for future research.
Tarallo et al investigated miRNA expression levels using RNA-seq as potential biomarkers in PD and showed that 55 microRNAs were expressed differently. These microRNAs are known to modulate the expression of genes involved in related pathways (autophagy, muscle regeneration, muscle atrophy) for PD pathophysiology. One of these microRNAs, miR-133a, was found to be significantly higher in Pompe patients than controls. It was found to correlate with phenotype severity and higher levels of expression in infants compared to late-onset patients. It has been shown that after the initiation of ERT in three infantile patients, miR133a expression decreased and clinical improvement occurred. They suggested that circulating microRNAs may represent additional biomarkers of the severity of PD and response to treatment.
44
In our work, we extracted the target genes of miR133a using the miRWalk tools. We compared the target genes of miR133a with the lists of down-regulated and up-regulated genes that we suggested as hub genes after PPI analysis. When we compared the miR133a target gene list with the 30 genes in our up-regulated gene list (MCODE score≥10), it was seen that 22 genes were among the targets and 12 of them (RNF130, FBXO10, ANAPC5, FBXO9, FBXO32, HERC6, LMO7, WSB1, HUWE1, RBBP6, RNF213, DTX3L) were within the 15 hub genes we showed. When we compared it with 97 genes of down-regulated genes (MCODE score ≥10), it was found that 70 genes are common and 11 of these genes (CUL3, SMURF2, ELOC, CDC26, FBXW2, UBE2V2, UBE2B, CDC23, ASB1, KLHL20, ATG7) are included in the 15 hub genes we suggested after PPI analysis. Tarallo et al showed that miR-133a was significantly elevated in LOPD patients, but the levels observed in IOPD with the weakened phenotype were significantly higher. This suggests that there is a correlation between miR-133a levels and clinical forms of the disease. An important finding in the study is that miR-133a levels tend to decline in response to ERT. A clear miR-133a reduction was seen with clinical improvement in IOPD even after a single injection after ERT treatment. They showed that their results could represent an additional marker of ERT effects for use in combination with clinical and biochemical measurements of miR-133a.
43
When we compare it with the results of our study, it has once again confirmed that miR-133a targets genes of genes whose expression has increased and decreased in the patient group that does not respond to ERT and that these genes may be effective in resistance to ERT. In addition, disease markers that provide information about the pathophysiology of PD may allow the identification of impaired pathways, new therapeutic targets, and possibly the development of new therapeutic strategies.
This investigation represents an important starting point for understanding the pathophysiology of Pompe. In other studies, it has been shown that autophagic, lysosomal, and muscle-related pathways are impaired at the Pompe. In addition to the affected pathways, this study has shown for the first time that important genes of the Wnt signaling pathway are affected and the mechanisms in the pathway are disrupted in PD. Studies on this pathway may reveal potential therapeutic strategies. This study highlights hub genes and related signaling pathways that could potentially serve as diagnostic markers and therapeutic biomarkers for PD and thus improves our understanding of the molecular mechanisms involved in resistance to ERT in PD.
Interest in lysosomal storage diseases (LD) is increasing as they are now more treatable or expected to be treatable soon with different approaches such as hematopoietic stem cell transplantation, enzyme replacement, small molecules, and gene therapy.
45
The discovery of molecular pathways related to lysosomal disease pathophysiology is increasing the importance of research in this area and paving the way for new biomarkers in the diagnosis and treatment of the disease.
46
Biomarkers and screening tests are of great importance in the diagnosis of LDs. In LDs associated with enzyme deficiencies, diagnosis is usually made by directly measuring the activity of the disease-associated enzyme. To determine which enzyme test should be done, it is useful to measure the biomarkers shown in the clinical picture. Biomarkers often provide information about the existence and/or extent of a biological process that is directly related to the clinical symptoms and outcome of a particular disease.
47
To assess the efficacy of treatments, it is useful to use biomarkers that allow us to analyze the evolution of disease over time and determine how the accumulation of products has decreased. The advent of recombinant human ERT has improved quality of life and reduced morbidity and mortality in most patients with both infantile-onset PD and later-onset PD. A diagnosis of infantile-onset PD is suspected in any infant with hypertrophic cardiomyopathy, muscular hypotonia, and moderate elevations in creatine kinase levels.
48
Any delay in diagnosis is unacceptable as it is now well understood that early diagnosis and timely initiation of ERT will have a serious impact on the course of the disease. Delayed initiation of ERT by just a few weeks significantly increases morbidity in affected infants.
49,50
For example, tetrasaccharide glucose (Glc4), although the best known biomarker for PD, is not specific and its diagnostic use may be limited. There is a good correlation between urinary excretion of Glc4 and response to treatment.
51,52
Two other serum biomarkers, myostatin and insulin-like growth factor I, can be used for PD and increase after treatment.
47
Biomarkers are an important component not only in diagnosis, but also in monitoring patients and choosing the best therapeutic option in each situation. Biomarkers are also important in the case of so-called deficiencies, as they can provide information about the functional consequences of the detected enzyme abnormality.
48
Conclusion
Treatment decisions are increasingly based on clinical, laboratory, and prognostic markers. While explaining the variability of prognostic markers independent of treatment, our study aimed to determine predictive markers to explain outcome variability in treatment response. The goal of this research was to describe comprehensive bioinformatics analyses of DEGs, provide molecular mechanisms and potential biomarkers, and reveal genes that will predict treatment progression. It is important to more comprehensively understand the pathophysiological development of PD at the cellular level to develop effective treatments by sampling different muscle groups to investigate the pathophysiological progression of the disease and medication effects and to simultaneously compare medications used and groups that respond or do not respond to treatment. In this study, we assessed differentiation in gene expression according to response and variations after ERT treatment in different muscle groups. Our findings will contribute to understanding pathophysiological irregularities in Pompe patients, mechanisms underlying ERT response, and genes at the RNA level.
The possibility of a biomarker that can predict response to rhGAA therapy can provide insight regarding clinical outcomes prior to treatment. It suggests that DEGs may be associated with disease progression and response to ERT during treatment. Inclusion of the obtained genes and pathways in neonatal screening will guide diagnosis and treatment. Additionally, lysosomal, autophagy, Wnt signaling, and muscle-related pathways may play important roles in the progression of disease and treatment response. As a result, these pathways and genes may be potential therapeutic targets for the targeted treatment of PD. Our data will be beneficial to classifying patients more accurately into subtypes and allowing clinicians and pathologists to distinguish aggressive basal-like subtypes. In addition, to validate the roles of genes, more sophisticated laboratory experiments are needed. These results will provide the basis for biological exploration and the creation of biomarkers to enhance PD treatment.
Acknowledgments
The authors gratefully acknowledge the NCBI-GEO for the use of raw data and the KEGG for permission to use KEGG figures.
Founding Sources
This work was not supported by any organization.
Ethical statement
Not applicable. This paper does not involve research on humans.
Competing interests
The authors declare no competing interests.
Authors’ contribution
In the design of this study, AKG participated and conducted the bioinformatics research. SG gathered considerable information from the context and contributed to the acquisition of data. Both authors took part in writing and editing the manuscript.
Supplementary Materials
Supplementary file 1 contains Fig. S1-S7 and Tables S1-S2.
(pdf)
Research Highlights
What is the current knowledge?
√ To date, few transcriptome studies have been conducted in PD and cell culture models. However, there are no studies that provide explanatory guidance on the ERT response.
√ ERT with rhGAA, which has demonstrated interesting and variable efficacy in various PD patients, is the only treatment for PD. The heterogeneity underlying the reactions of patients to medication, however, is unclear.
What is new here?
√ Obtained genes and pathways in neonatal screening will guide diagnosis, and treatment and these pathways and genes may be potential therapeutic targets for targeted treatment of PD. Identifying transcriptional differences that contribute to the disease phenotype will guide treatment.
√ Our findings will contribute to understanding pathophysiological irregularities in Pompe patients, mechanisms underlying ERT response, and genes at the RNA level.
√ We also discovered that the Wnt signaling pathway is highly correlated with DEGs in poor response to ERT. The Wnt signaling pathway has not been previously described in transcriptome studies performed in Pompe patients. This has been shown for the first time with these analyzes that it can be important.
References
- Mori M, Haskell G, Kazi Z, Zhu X, DeArmey SM, Goldstein JL. Sensitivity of whole exome sequencing in detecting infantile- and late-onset Pompe disease. Mol Genet Metab 2017; 122:189-97. doi: 10.1016/j.ymgme.2017.10.008 [Crossref] [ Google Scholar]
- Kohler L, Puertollano R, Raben N. Pompe Disease: From Basic Science to Therapy. Neurotherapeutics 2018; 15:928-42. doi: 10.1007/s13311-018-0655-y [Crossref] [ Google Scholar]
- Kishnani PS, Corzo D, Leslie ND, Gruskin D, Van der Ploeg A, Clancy JP. Early treatment with alglucosidase alpha prolongs long-term survival of infants with Pompe disease. Pediatr Res 2009; 66:329-35. doi: 10.1203/PDR.0b013e3181b24e94 [Crossref] [ Google Scholar]
- Cupler EJ, Berger KI, Leshner RT, Wolfe GI, Han JJ, Barohn RJ. Consensus treatment recommendations for late-onset Pompe disease. Muscle Nerve 2012; 45:319-33. doi: 10.1002/mus.22329 [Crossref] [ Google Scholar]
- Disease AWGoMoP, Kishnani PS, Steiner RD, Bali D, Berger K, Byrne BJ. Pompe disease diagnosis and management guideline. Genet Med 2006; 8:267-88. doi: 10.109701/gim.0000218152.87434.f3 [Crossref] [ Google Scholar]
- Turner SMF, Falk DJ, Byrne BJ, Fuller DD. Transcriptome assessment of the Pompe (Gaa-/-) mouse spinal cord indicates widespread neuropathology. Physiol Genomics 2016; 48:785-94. doi: 10.1152/physiolgenomics.00075.2016 [Crossref] [ Google Scholar]
- Chien YH, Lee NC, Huang HJ, Thurberg BL, Tsai FJ, Hwu WL. Later-onset Pompe disease: early detection and early treatment initiation enabled by newborn screening. J Pediatr 2011; 158:1023-7 e1. doi: 10.1016/j.jpeds.2010.11.053 [Crossref] [ Google Scholar]
- Amalfitano A, Bengur AR, Morse RP, Majure JM, Case LE, Veerling DL. Recombinant human acid alpha-glucosidase enzyme therapy for infantile glycogen storage disease type II: results of a phase I/II clinical trial. Genet Med 2001; 3:132-8. doi: 10.1097/00125817-200103000-00007 [Crossref] [ Google Scholar]
- Klinge L, Straub V, Neudorf U, Schaper J, Bosbach T, Gorlinger K. Safety and efficacy of recombinant acid alpha-glucosidase (rhGAA) in patients with classical infantile Pompe disease: results of a phase II clinical trial. Neuromuscul Disord 2005; 15:24-31. doi: 10.1016/j.nmd.2004.10.009 [Crossref] [ Google Scholar]
- Prater SN, Banugaria SG, DeArmey SM, Botha EG, Stege EM, Case LE. The emerging phenotype of long-term survivors with infantile Pompe disease. Genet Med 2012; 14:800-10. doi: 10.1038/gim.2012.44 [Crossref] [ Google Scholar]
- Desai AK, Walters CK, Cope HL, Kazi ZB, DeArmey SM, Kishnani PS. Enzyme replacement therapy with alglucosidase alfa in Pompe disease: Clinical experience with rate escalation. Mol Genet Metab 2018; 123:92-6. doi: 10.1016/j.ymgme.2017.12.435 [Crossref] [ Google Scholar]
- Niyazov D, Lara DA. Improvement in Cardiac Function With Enzyme Replacement Therapy in a Patient With Infantile-Onset Pompe Disease. Ochsner J 2018; 18:413-6. doi: 10.31486/toj.18.0049 [Crossref] [ Google Scholar]
- van der Ploeg AT, Clemens PR, Corzo D, Escolar DM, Florence J, Groeneveld GJ. A randomized study of alglucosidase alfa in late-onset Pompe's disease. N Engl J Med 2010; 362:1396-406. doi: 10.1056/NEJMoa0909859 [Crossref] [ Google Scholar]
- Kishnani PS, Corzo D, Nicolino M, Byrne B, Mandel H, Hwu WL. Recombinant human acid [alpha]-glucosidase: major clinical benefits in infantile-onset Pompe disease. Neurology 2007; 68:99-109. doi: 10.1212/01.wnl.0000251268.41188.04 [Crossref] [ Google Scholar]
- Kishnani PS, Goldenberg PC, DeArmey SL, Heller J, Benjamin D, Young S. Cross-reactive immunologic material status affects treatment outcomes in Pompe disease infants. Mol Genet Metab 2010; 99:26-33. doi: 10.1016/j.ymgme.2009.08.003 [Crossref] [ Google Scholar]
- Palermo AT, Palmer RE, So KS, Oba-Shinjo SM, Zhang M, Richards B. Transcriptional response to GAA deficiency (Pompe disease) in infantile-onset patients. Mol Genet Metab 2012; 106:287-300. doi: 10.1016/j.ymgme.2012.05.004 [Crossref] [ Google Scholar]
- Simon R, Lam A, Li M-C, Ngan M, Menenzes S, Zhao Y. Analysis of Gene Expression Data Using BRB-Array Tools. Cancer Informatics 2007; 3:11-7. [ Google Scholar]
- Fan J, Saha S, Barker G, Heesom KJ, Ghali F, Jones AR. Galaxy Integrated Omics: Web-based Standards-Compliant Workflows for Proteomics Informed by Transcriptomics. Mol Cell Proteomics 2015; 14:3087-93. doi: 10.1074/mcp.O115.048777 [Crossref] [ Google Scholar]
- Bellotti AS, Andreoli L, Ronchi D, Bresolin N, Comi GP, Corti S. Molecular Approaches for the Treatment of Pompe Disease. Mol Neurobiol 2020; 57:1259-80. doi: 10.1007/s12035-019-01820-5 [Crossref] [ Google Scholar]
- Chen M, Zhang L, Quan S. Enzyme replacement therapy for infantile-onset Pompe disease. Cochrane Database Syst Rev 2017; 11:CD011539. doi: 10.1002/14651858.CD011539.pub2 [Crossref] [ Google Scholar]
- Van den Hout JM, Kamphoven JH, Winkel LP, Arts WF, De Klerk JB, Loonen MC. Long-term intravenous treatment of Pompe disease with recombinant human alpha-glucosidase from milk. Pediatrics 2004; 113:e448-57. doi: 10.1542/peds.113.5.e448 [Crossref] [ Google Scholar]
- Winkel LP, Van den Hout JM, Kamphoven JH, Disseldorp JA, Remmerswaal M, Arts WF. Enzyme replacement therapy in late-onset Pompe's disease: a three-year follow-up. Ann Neurol 2004; 55:495-502. doi: 10.1002/ana.20019 [Crossref] [ Google Scholar]
- Mendelsohn NJ, Messinger YH, Rosenberg AS, Kishnani PS. Elimination of antibodies to recombinant enzyme in Pompe's disease. N Engl J Med 2009; 360:194-5. doi: 10.1056/NEJMc0806809 [Crossref] [ Google Scholar]
- Drost MR, Schaart G, van Dijk P, van Capelle CI, van der Vusse GJ, Delhaas T. Both type 1 and type 2a muscle fibers can respond to enzyme therapy in Pompe disease. Muscle Nerve 2008; 37:251-5. doi: 10.1002/mus.20896 [Crossref] [ Google Scholar]
- Fukuda T, Ewan L, Bauer M, Mattaliano RJ, Zaal K, Ralston E. Dysfunction of endocytic and autophagic pathways in a lysosomal storage disease. Ann Neurol 2006; 59:700-8. doi: 10.1002/ana.20807 [Crossref] [ Google Scholar]
- Raben N, Danon M, Gilbert AL, Dwivedi S, Collins B, Thurberg BL. Enzyme replacement therapy in the mouse model of Pompe disease. Mol Genet Metab 2003; 80:159-69. [ Google Scholar]
- Fukuda T, Roberts A, Ahearn M, Zaal K, Ralston E, Plotz PH. Autophagy and lysosomes in Pompe disease. Autophagy 2006; 2:318-20. doi: 10.4161/auto.2984 [Crossref] [ Google Scholar]
- Koeberl D, Luo X, Sun B, McVie-Wylie A, Dai J, Li S. Enhanced Efficacy of Enzyme Replacement Therapy in Pompe Disease Through Mannose-6-Phosphate Receptor Expression in Skeletal Muscle. Molecular Genetics and Metabolism 2011; 103:107-12. doi: 10.1016/j.ymgme.2011.02.006 [Crossref] [ Google Scholar]
- Reczek D, Schwake M, Schroder J, Hughes H, Blanz J, Jin X. LIMP-2 is a receptor for lysosomal mannose-6-phosphate-independent targeting of beta-glucocerebrosidase. Cell 2007; 131:770-83. doi: 10.1016/j.cell.2007.10.018 [Crossref] [ Google Scholar]
- Velayati A, DePaolo J, Gupta N, Choi JH, Moaven N, Westbroek W. A Mutation in SCARB2 is a Modifier in Gaucher Disease. Hum Mutat 2011; 32:1232-8. doi: 10.1002/humu.21566 [Crossref] [ Google Scholar]
- Hamdan MA, El-Zoabi BA, Begam MA, Mirghani HM, Almalik MH. Antenatal diagnosis of pompe disease by fetal echocardiography: impact on outcome after early initiation of enzyme replacement therapy. J Inherit Metab Dis 2010; 33:S333-S9. doi: 10.1007/s10545-010-9179-2 [Crossref] [ Google Scholar]
- Strothotte S, Strigl-Pill N, Grunert B, Kornblum C, Eger K, Wessig C. Enzyme replacement therapy with alglucosidase alfa in 44 patients with late-onset glycogen storage disease type 2: 12-month results of an observational clinical trial. J Neurol 2010; 257:91-7. doi: 10.1007/s00415-009-5275-3 [Crossref] [ Google Scholar]
- Schoser B, Hill V, Raben N. Therapeutic approaches in glycogen storage disease type II/Pompe Disease. Neurotherapeutics 2008; 5:569-78. doi: 10.1016/j.nurt.2008.08.009 [Crossref] [ Google Scholar]
- van der Ploeg AT, Kruijshaar ME, Toscano A, Laforet P, Angelini C, Lachmann RH. European consensus for starting and stopping enzyme replacement therapy in adult patients with Pompe disease: a 10-year experience. Eur J Neurol 2017; 24:768-e31. doi: 10.1111/ene.13285 [Crossref] [ Google Scholar]
- Prater SN, Patel TT, Buckley AF, Mandel H, Vlodavski E, Banugaria SG. Skeletal muscle pathology of infantile Pompe disease during long-term enzyme replacement therapy. Orphanet J Rare Dis 2013; 8:90. doi: 10.1186/1750-1172-8-90 [Crossref] [ Google Scholar]
- Parini R, De Lorenzo P, Dardis A, Burlina A, Cassio A, Cavarzere P. Long term clinical history of an Italian cohort of infantile onset Pompe disease treated with enzyme replacement therapy. Orphanet J Rare Dis 2018; 13:32. doi: 10.1186/s13023-018-0771-0 [Crossref] [ Google Scholar]
- Zemljic-Harpf A, Manso AM, Ross RS. Vinculin and talin: focus on the myocardium. J Investig Med 2009; 57:849-55. doi: 10.2310/JIM.0b013e3181c5e074 [Crossref] [ Google Scholar]
- Manso AM, Li R, Monkley SJ, Cruz NM, Ong S, Lao DH. Talin1 has unique expression versus talin 2 in the heart and modifies the hypertrophic response to pressure overload. J Biol Chem 2013; 288:4252-64. doi: 10.1074/jbc.M112.427484 [Crossref] [ Google Scholar]
- Vasile VC, Edwards WD, Ommen SR, Ackerman MJ. Obstructive hypertrophic cardiomyopathy is associated with reduced expression of vinculin in the intercalated disc. Biochem Biophys Res Commun 2006 20; 349(2):709-15. doi: 10.1016/j.bbrc.2006.08.106 [Crossref] [ Google Scholar]
- Yoshida T, Awaya T, Jonouchi T, Kimura R, Kimura S, Era T. A Skeletal Muscle Model of Infantile-onset Pompe Disease with Patient-specific iPS Cells. Sci Rep 2017; 7:13473. doi: 10.1038/s41598-017-14063-y [Crossref] [ Google Scholar]
- Bonaldo P, Sandri M. Cellular and molecular mechanisms of muscle atrophy. Dis Model Mech 2013; 6:25-39. doi: 10.1242/dmm.010389 [Crossref] [ Google Scholar]
- Glass DJ. Skeletal muscle hypertrophy and atrophy signaling pathways. Int J Biochem Cell Biol 2005; 37:1974-84. doi: 10.1016/j.biocel.2005.04.018 [Crossref] [ Google Scholar]
- Powers SK, Kavazis AN, DeRuisseau KC. Mechanisms of disuse muscle atrophy: role of oxidative stress. Am J Physiol Regul Integr Comp Physiol 2005; 288:R337-44. doi: 10.1152/ajpregu.00469.2004 [Crossref] [ Google Scholar]
- Tarallo A, Carissimo A, Gatto F, Nusco E, Toscano A, Musumeci O. microRNAs as biomarkers in Pompe disease. Genet Med 2019; 21:591-600. doi: 10.1038/s41436-018-0103-8 [Crossref] [ Google Scholar]
- Beck M. Treatment strategies for lysosomal storage disorders. Dev Med Child Neurol 2018; 60:13-8. doi: 10.1111/dmcn.13600 [Crossref] [ Google Scholar]
- Lloyd-Evans E, Haslett LJ. The lysosomal storage disease continuum with ageing-related neurodegenerative disease. Ageing Res Rev 2016; 32:104-21. doi: 10.1016/j.arr.2016.07.005 [Crossref] [ Google Scholar]
- Lobato JB, Hidalgo MJ, Jimenez LMJ. Biomarkers in Lysosomal Storage Diseases. Diseases 2016; 17:40. doi: 10.3390/diseases4040040 [Crossref] [ Google Scholar]
- Chiang SC, Hwu WL, Lee NC, Hsu LW, Chien YH. Algorithm for Pompe disease newborn screening: results from the Taiwan screening program. Mol Genet Metab 2012; 106:281-6. doi: 10.1016/j.ymgme.2012.04.013 [Crossref] [ Google Scholar]
- Chien YH, Lee NC, Thurberg BL, Chiang SC, Zhang XK, Keutzer J. Pompe disease in infants: improving the prognosis by newborn screening and early treatment. Pediatrics 2009; 124:e1116-25. doi: 10.1542/peds.2008-3667 [Crossref] [ Google Scholar]
- Nicolino M, Byrne B, Wraith JE, Leslie N, Mandel H, Freyer DR. Clinical outcomes after long-term treatment with alglucosidase alfa in infants and children with advanced Pompe disease. Genet Med 2009; 11:210-9. doi: 10.1097/GIM.0b013e31819d0996 [Crossref] [ Google Scholar]
- Manwaring V, Prunty H, Bainbridge K, Burke D, Finnegan N, Franses R. Urine analysis of glucose tetrasaccharide by HPLC; a useful marker for the investigation of patients with Pompe and other glycogen storage diseases. J Inherit Metab Dis 2012; 35:311-6. doi: 10.1007/s10545-011-9360-2 [Crossref] [ Google Scholar]
- Young SP, Zhang H, Corzo D, Thurberg BL, Bali D, Kishnani PS. Long-term monitoring of patients with infantile-onset Pompe disease on enzyme replacement therapy using a urinary glucose tetrasaccharide biomarker. Genet Med 2009; 11:536-41. doi: 10.1097/GIM.0b013e3181a87867 [Crossref] [ Google Scholar]