Bioimpacts. 12(4):337-347.
doi: 10.34172/bi.2021.23522
Original Research
CRISPRi-mediated knock-down of PRDM1/BLIMP1 programs central memory differentiation in ex vivo-expanded human T cells
Mohammad Azadbakht 1  , Ali Sayadmanesh 2, Naghme Nazer 3, Amirhossein Ahmadi 4, Sara Hemmati 2, 5, Hoda Mohammadzade 3, Marzieh Ebrahimi 2, Hossein Baharvand 2, 6, Babak Khalaj 3, Mahmoud Reza Aghamaali 1, * , Mohsen Basiri 2, *
Author information:
1Department of Biology, Faculty of Science, University of Guilan, Rasht, Iran
2Department of Stem Cell and Developmental Biology, Cell Science Research Center, Royan Institute for Stem Cell Biology and Technology, ACECR, Tehran, Iran
3Department of Electrical Engineering, Sharif University of Technology, Tehran, Iran
4Department of Biology, Faculty of Science, Persian Gulf University, Bushehr, Iran
5School of Medicine, Tehran University of Medical Sciences, Tehran, Iran
6Department of Developmental Biology, University of Science and Culture, Tehran, Iran
Abstract
Introduction:
B lymphocyte-induced maturation protein 1 (BLIMP1) encoded by the positive regulatory domain 1 gene (PRDM1), is a key regulator in T cell differentiation in mouse models. BLIMP1-deficiency results in a lower effector phenotype and a higher memory phenotype.
Methods:
In this study, we aimed to determine the role of transcription factor BLIMP1 in human T cell differentiation. Specifically, we investigated the role of BLIMP1 in memory differentiation and exhaustion of human T cells. We used CRISPR interference (CRISPRi) to knock-down BLIMP1 and investigated the differential expressions of T cell memory and exhaustion markers in BLIMP1-deficient T cells in comparison with BLIMP1-sufficient ex vivo expanded human T cells.
Results:
BLIMP1-deficiency caused an increase in central memory (CM) T cells and a decrease in effector memory (EM) T cells. There was a decrease in the amount of TIM3 exhaustion marker expression in BLIMP1-deficient T cells; however, there was an increase in PD1 exhaustion marker expression in BLIMP1-deficient T cells compared with BLIMP1-sufficient T cells.
Conclusion:
Our study provides the first functional evidence of the impact of BLIMP1 on the regulation of human T cell memory and exhaustion phenotype. These findings suggest that BLIMP1 may be a promising target to improve the immune response in adoptive T cell therapy settings.
Keywords: T cell, PRDM1, BLIMP1, CRISPR interference, Memory T cell
Copyright and License Information
© 2022 The Author(s).
This work is published by BioImpacts as an open access article distributed under the terms of the Creative Commons Attribution Non-Commercial License (
http://creativecommons.org/licenses/by-nc/4.0/). Non-commercial uses of the work are permitted, provided the original work is properly cited.
Introduction
The B lymphocyte-induced maturation protein 1 (BLIMP1) encoded by the positive regulatory domain 1 gene (PRDM1), is a critical regulator of plasma cell differentiation in B cells.
1
In order to have proper induction of effector functions in mouse T cells, BLIMP1 is essentially needed in CD4+ T lymphocytes
2-6
and in CD8+ T lymphocytes.
3,5,7-10
Mouse models that are deficient in BLIMP1 have reduced T lymphocyte cytotoxic activity,
3,11,12
increased memory phenotype population,
3,5,11
and enhanced survival of effector cells (persistence).
5
However, there is no direct experimental evidence for the role of BLIMP1 in regulating human T cell fate and function.
Elucidation of the regulatory functions of BLIMP1 in human T cells is not only important for understanding the mechanism of the cellular immune response against infections and cancer, but also may provide insights for improving T cell-based immunotherapies. Ex vivo expanded human T cells are particularly important in human cancer immunotherapy because of their ability to mediate cancer regression in patients.
13
The duration of T cell persistence after the adoptive transfer is correlated with clinical response, and this has led to strategies to enhance in vivo persistence. These strategies consist of extrinsic modification of the host environment, conditioning lymphodepletion, intrinsic manipulation of the T cell itself, cytokine modulation to enhance cellular replicative potential,
14
phenotype-based selection, and genetic engineering.
15
The importance of the differentiation state of the infused cells has been shown by studies in mouse models.
16,17
Antigen-independent persistence and self-renewal are considered to be specific memory T cell characteristics.
7
The effects of BLIMP1 knock-down on T cell differentiation have been extensively studied in mouse models.
1-12
To the best of our knowledge, this research has not been conducted on human T cells. Therefore, we intend to study the effects of BLIMP1 knock-down on human T cells. We focused on ex vivo expanded primary human T cells due to their application in human T cell therapies. We knocked down the PRDM1 gene in primary human T lymphocytes to determine the effects of BLIMP1 deficiency on T cell phenotype and T cell exhaustion.
Materials and Methods
Materials
Esp3I enzyme (#FD0454), TurboFect Transfection Reagent, and Dynabead Human T-Activator CD3/CD28 (#11131D) were purchased from Thermo Fisher Scientific. RPMI-1640 medium, fetal bovine serum, and L-glutamine were purchased from Sigma-Aldrich. Lymphodex (#002041500) was obtained from Inno-train, the RNeasy Micro Kit (#74004) from Qiagen, PrimeScript RT Reagent Kit from Takara, SYBR Green Master Mix (#4367659) from Applied Biosystems Life Technologies, Inc., True-NuclearTM Buffer Set from BioLegend, Rat IgG2a antibody from BD Biosciences, and human IL-2 from Royan Institute. The anti-CD3-FITC (clone HIT3a, #555339), anti-CD4-PerCP (clone SK3, #566316), anti-CD8-PE (clone HIT8a, #555635), anti-CD45RA-PE (clone 5H9, #556627), anti-CD45RA-APC (clone 5H9, #561210), and anti-BLIMP1-PE (clone 6D3, #564702) antibodies from BD Biosciences, the anti-CD8-Pacific Blue (clone SK1, #344718) and anti-CD62L-FITC (clone DREG-56, #304812) antibodies from BioLegend, the anti-CD3-APC-Alexa Flouor 750 (clone UCHT1, #A66329), anti-CD4-Krome Orange (clone 13B8.2, #A96417) antibodies from Beckman Coulter, and the anti-CD107a-PE (clone eBioH4A3, #12-1079-42) antibody from eBioscience were used for the flow cytometry experiments.
Microarray data collection and analysis
Two publicly available microarray gene expression datasets were obtained from the NCBI Gene Expression Omnibus. The CD4+ T cell
16
(accession GSE23321) and CD8+ T cell
18
(accession GSE61697) datasets were used for differential gene expression analysis. Both datasets contained the expression data of four human T cell phenotypes: naïve (N), stem cell memory (SCM), central memory (CM), and effector memory (EM). We used R statistical programming language and applied log2 transformation to raw expression levels, and the datasets were merged by similar gene symbols. Cleaning and normalization,
19
and adjustments for the batch effect amongst these two datasets were done using an empirical Bayesian method described by Johnsen et al,
20
which is implemented in the SVA package.
21
A pairwise comparison was performed between each two consecutive stages (i.e., N vs. SCM, SCM vs. CM, and CM vs. EM) by using linear models for microarray (LIMMA). Statistically significant differentially expressed genes (DEGs) were identified by applying a threshold of 0.05 to the adjusted P-value, which was based on the false discovery rate using the Benjamini-Hochberg procedure
22
and more than 1.5-fold change. Next, we computed the intersection of the DEG sets with the purpose of locating genes that upregulated during the course of differentiation from N T cells to EM T cells. In order to identify the regulators of EM T cell-upregulated genes, a list of 107 DEGs that had more than two-fold higher expressions in EM T cells compared with CM T cells were subjected to TF gene enrichment using Enrichr
23
and the ARCHS
4
TF Co-expression database.
24
Genetic vectors
The lentiviral CRISPR interference (CRISPRi) plasmid used in this study, pLV hU6-sgRNA hUbC-dCas9-KRAB-T2a-Puro, was a gift from Charles Gersbach (Addgene plasmid #71236; http://n2t.net/addgene: 71236; RRID: Addgene_71236).
25
pLV-hU6-sgPRDM1-5-hUbC-dCas9-KRAB-T2a-Puro (sgPRDM1-5), pLV-hU6-sgPRDM1+35-hUbC-dCas9-KRAB-T2a-Puro (sgPRDM1+35), and pLV-hU6-sgPRDM1+61-hUbC-dCas9-KRAB-T2a-Puro (sgPRDM1+61) were generated using Esp3I and T4 DNA ligase enzymes (Thermo Fisher Scientific, #FD0454, UK). Table 1 lists the sequences of these three sgRNAs. In order to ensure the specificity of the sgRNA sequences, we confirmed that there is no potential off-targets in the human genome with less than 3 mismatches using CRISPOR (http://crispor.tefor.net/) and CRISPR RGENE Tool (http://www.rgenome.net/cas-offinder/).
Table 1.
sgRNA oligonucleotides integrated into the CRISPR interference (CRISPRi) construct
|
sgRNA
|
Strand
|
Sequence
|
| sgPRDM1-5 |
Sense |
CACCGTGGCTAAGGAAATCTTAAGC |
| Antisense |
AAACGCTTAAGATTTCCTTAGCCAC |
| sgPRDM1+35 |
Sense |
CACCGCACTGGAGGGCCGAGTGTCA |
| Antisense |
AAACTGACACTCGGCCCTCCAGTGC |
| sgPRDM1+61 |
Sense |
CACCGCACTCGGCCCTCCAGTGTTG |
| Antisense |
AAACCAACACTGGAGGGCCGAGTGC |
In order to produce the lentiviral particles, the aforementioned pLV plasmids and packaging plasmids psPAX2 and pMD2.G were transfected into HEK293T cells using a TurboFect transfection reagent (Thermo Scientific). psPAX2 and pMD2.G were gifts from Didier Trono (Addgene plasmid #12259; http://n2t.net/addgene:12259; RRID: Addgene_12259 and Addgene plasmid #12260; http://n2t.net/addgene:12260; RRID: Addgene_12260). The Lentivirus-containing supernatants were collected at 48- and 72-hour post-transfection, filtered through a 0.45 µm filter, and concentrated by centrifugation at 20 000 g for 2 hours.
Primary T cell culture and transduction
Peripheral blood mononuclear cells (PBMCs) were obtained from 5 ml blood obtained from healthy blood donors. The donor signed a written informed consent to authorize use of their blood sample. The Institutional Review Board, Royan Institute (Tehran, Iran) approved this research study and study-related informed consent. PBMCs were isolated by Lymphodex (Inno-train, REF 002041500) by gradient centrifugation. The PBMCs were subsequently cultured with Dynabead Human T-Activator CD3/CD28 (ThermoFisher Scientific, REF 11131D) in RPMI-1640 medium supplemented with 10% heat-inactivated fetal bovine serum (Sigma-Aldrich) and 2 mM L-glutamine (Sigma-Aldrich). The culture was placed in a humidified incubator in 5% CO2 at 37°C. After 24 hours, the activated T cells were transduced with lentiviral supernatants in the presence of 100 U/ml of human IL-2 (Royan Institute, Iran), and maintained in the presence of 50 U/mL of human IL-2 for the rest of the culture period. In order to enrich the transduced T cells, puromycin (2.5 µg/mL) was added to the media at 48 hours post-transduction and continued for six days.
For the co-culture experiment, K562 cells engineered by a membrane-bound single-chain variable fragment (scFV) from an anti-CD3 antibody (K562-OKT3) were used as universal target cells. Transduced T cells were cultured in a 1:1 ratio with the K562-OKT3 cells in the absence of IL-2. The percentages of the CD3- target cells and CD3+ T cells, and the expression of CD107a were ascertained by flow cytometry analysis.
RNA isolation, cDNA synthesis, and RT-qPCR analysis.
Total RNA was isolated from the PBMCs by using an RNeasy Micro Kit (Qiagen, 74004) according to the manufacturer's instructions. First-strand cDNA was synthesized from 2 μg of total RNA by using a PrimeScript RT Reagent Kit (Takara, Japan). A total of 2 µL of diluted cDNA template (25 ng) was added per reaction to achieve a final volume of 20 μL of the reaction mixture.Duplicate RT-qPCR reactions were designed with SYBR Green Master Mix (Applied Biosystems Life Technologies, Inc.,REF 4367659). Gene expression analysis was assessed by RT-qPCR for the candidate genes with an ABI StepOnePlus (Applied Biosystems Life Technologies System) according to the following program: 95°C for 10 minutes, 40× (95°C for 15 seconds, 60°C for 1 minute), followed by melting curve acquisition at a ramp from 60°C to 95°C.
All of the target genes were normalized to GAPDH, an endogenous control, in order to analyze the gene expression results, which were finally calibrated against a control group. Relative gene expression levels were determined by the 2 -(ΔΔCT) method. Table 2 lists the primers used in the RT-qPCR analysis.
Table 2.
Primers used for RT-qPCR
|
Target gene/element
|
Forward primer
|
Reverse primer
|
|
PRDM1
|
ACGTGTGCCCTTTGGTATGT |
CTGGGATTCTGGTGCTGATG |
|
WPRE
|
CGTTGTCAGGCAACGTG |
CTGACAGGTGGTGGCAAT |
|
GAPDH
|
CTCATTTCCTGGTATGACAACGA |
CTTCCTCTTGTGCTCTTGCT |
PRDM1: Transcription factor PR/SET domain 1
Flow cytometry
Transduced T cells were used in this experiment. The T cells were washed with phosphate-buffered saline (PBS), centrifuged, and then blocked with BSA. The cells were subsequently washed with PBS. Primary antibodies were added to the test samples according to the manufacturer’s recommendations. The cells in both groups were rinsed with PBS. After surface staining and to perform intracellular staining of BLIMP1, initially the cells were fixed and permeabilized with a True-NuclearTM Buffer Set (BioLegend) according to the manufacturer’s instructions and then stained with rat anti-human BLIMP1 antibody or rat IgG2a antibody (BD Biosciences, San Jose, CA, USA). Finally, the cells were assessed by flow cytometry (BD FACSCalibur or BD FACSCanto, BD Biosciences) and analyzed with FlowJo v. 10 software.
Statistical analyses
All the experiments were carried out in triplicate. The data are expressed as mean ± SD. The independent student’s t test with either SPSS 24.0 (SPSS Inc., Chicago, IL, USA) or GraphPad Prism 8.0.2 (GraphPad Software, Inc., La Jolla, CA, USA) was applied to analyze group differences in the data. Significance was set at 5%. The statistics symbol for meaningful differences is an ‘*’ for the student’s t test.
Results
Gene expression analysis of human T cell memory subpopulations
First, we compared the transcriptomes of the N, SCM, CM, and EM subpopulations of the human T cells to identify potential regulators of memory T cell differentiation. We identified eight genes: CCL5, CST7, BHLHE14, PRDM1, MYO1F, ERN1, MAF, and CD58, which upregulated during the course of differentiation from the N to the EM T cell phenotypes (Fig. 1A). We also performed a transcription factor enrichment analysis on the genes that upregulated in the EM T cells compared to the CM T cells (Table S1, Supplementary file 1) to identify the transcription factors associated with differentiation of the memory T cell subpopulations (Figs. 1B and 2A). According to our observation, PRDM1 was associated with the highest number of EM T cell upregulated genes (19 genes), which included three transcription factors (FOSL2, PLEK, and ID2) and, in turn, link PRDM1 to more target genes in the built network (Fig. 2B). We then confirmed a graded increase in PRDM1/BLIMP1 expression during T cell differentiation from the N to EM T cells by measuring BLIMP1 protein expression in the different memory T cell subpopulations in unstimulated human PBMCs. The highest BLIMP1 median fluorescence intensity (MFI) was detected in the EM T cell and terminally effector (TE) subpopulations; the lowest MFI was observed in naïve like T cells (NL) that comprised the N T cell and SCM T cell populations (Fig. 1C, D). These results, along with the previous knowledge on the function of mouse BLIMP1 in T cell differentiation, prompted us to investigate the role of PRDM1/BLIMP1 in human memory T cell differentiation by using a loss-of-function approach.
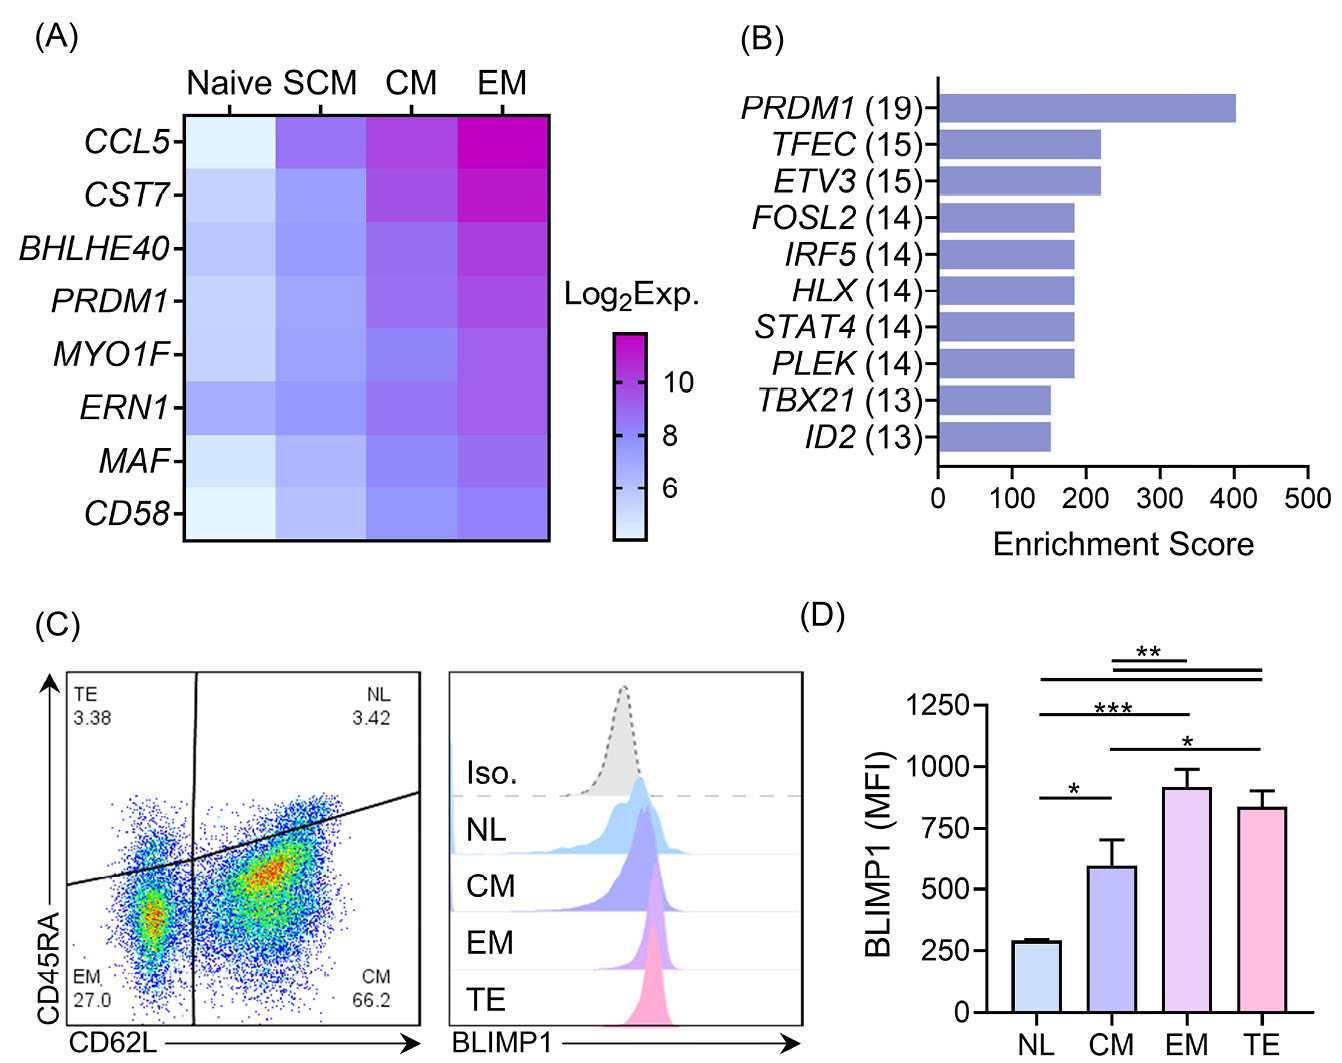
Fig. 1.
Global gene expression and BLIMP1 protein expression in different human T cell memory phenotypes. A) Gene expression of eight genes on a significantly meaningful (adj. P > 0.05) graded scale of increase were expressed in different phenotypes, from N to EM T cells. B) The top ten transcription factors with enriched targets among the EM T cell-upregulated genes, based on the ARCHS
4
TF co-expression database. The number of detected targets for each TF is shown in parentheses. C) The scatter plot (left) shows a representative data of memory phenotypes of CD3+ T cells in unstimulated human PBMCs detected based on CD62L and CD45RA expressions. Stacked histograms (right) show BLIMP1 MFI, which is gated on different memory phenotypes. D) The summary quantitative data of BLIMP1 MFI across different memory phenotypes of human T cells. The data are presented as mean ± SD, *P < 0.05, **P < 0.01, and ***P < 0.001, n = 9 in transcriptome data, n = 4 in BLIMP1 staining. BLIMP1: B lymphocyte-induced maturation protein 1; MFI: Median fluorescent intensity; N: Naïve; EM T cell: Effector memory T cell; PBMC: Peripheral blood mononuclear cells.
.
Global gene expression and BLIMP1 protein expression in different human T cell memory phenotypes. A) Gene expression of eight genes on a significantly meaningful (adj. P > 0.05) graded scale of increase were expressed in different phenotypes, from N to EM T cells. B) The top ten transcription factors with enriched targets among the EM T cell-upregulated genes, based on the ARCHS
4
TF co-expression database. The number of detected targets for each TF is shown in parentheses. C) The scatter plot (left) shows a representative data of memory phenotypes of CD3+ T cells in unstimulated human PBMCs detected based on CD62L and CD45RA expressions. Stacked histograms (right) show BLIMP1 MFI, which is gated on different memory phenotypes. D) The summary quantitative data of BLIMP1 MFI across different memory phenotypes of human T cells. The data are presented as mean ± SD, *P < 0.05, **P < 0.01, and ***P < 0.001, n = 9 in transcriptome data, n = 4 in BLIMP1 staining. BLIMP1: B lymphocyte-induced maturation protein 1; MFI: Median fluorescent intensity; N: Naïve; EM T cell: Effector memory T cell; PBMC: Peripheral blood mononuclear cells.
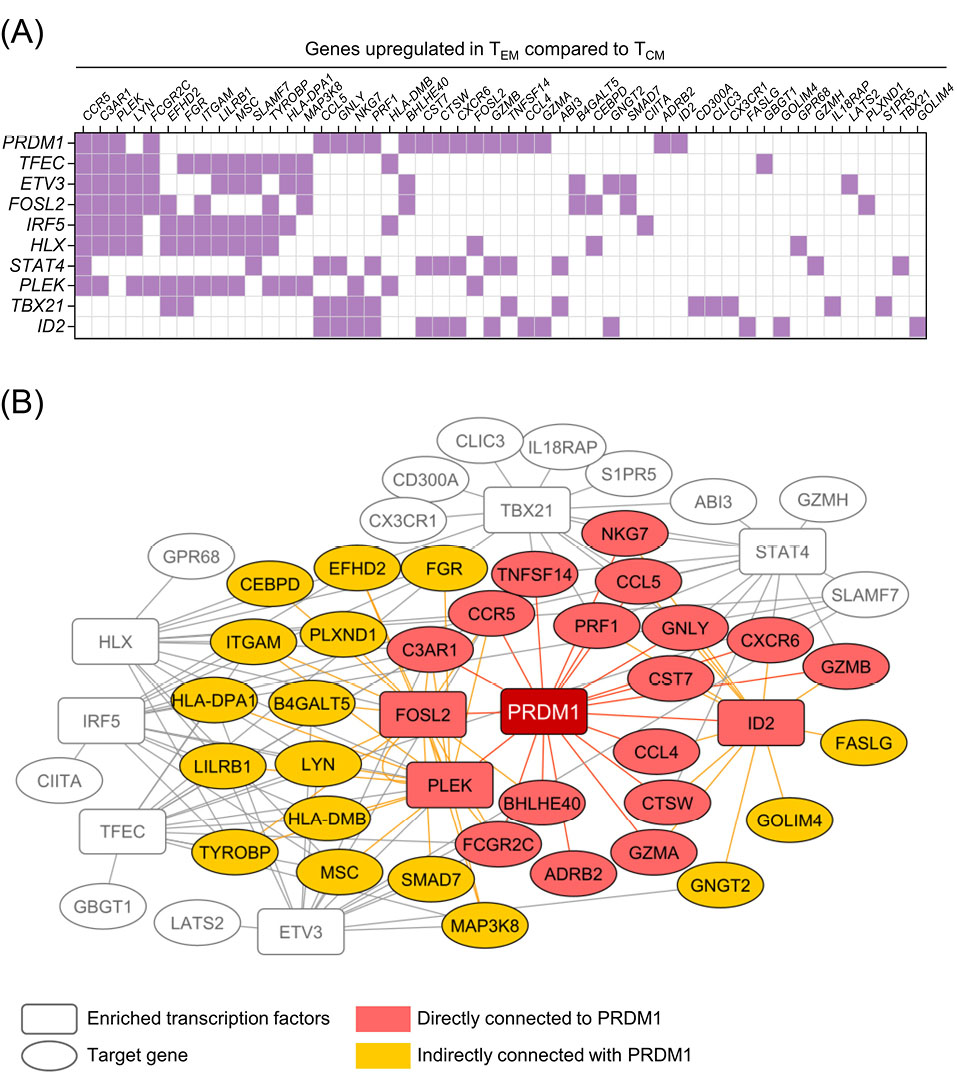
Fig. 2.
Transcription factor enrichment analysis on a list of genes upregulated in EM T cells compared to CM T cells. A) Heatmap representation of the overlap of the list of top ten enriched transcription factors (vertical axis) and corresponding EM T cell upregulated genes (horizontal axis). Some of the enriched transcription factors, FOSL2, PLEK and ID2, are also present in the EM T cell upregulated gene list. B) A network model built based on top ten enriched transcription factors illustrates the genes directly (red) and indirectly (orange) connected to PRDM1 through other enriched transcription factors. The network was visualized with Cytoscape software. EM T cell: Effector memory T cell; CM T cell: Central memory T cell; PRDM1: transcription factor PR/SET domain 1.
.
Transcription factor enrichment analysis on a list of genes upregulated in EM T cells compared to CM T cells. A) Heatmap representation of the overlap of the list of top ten enriched transcription factors (vertical axis) and corresponding EM T cell upregulated genes (horizontal axis). Some of the enriched transcription factors, FOSL2, PLEK and ID2, are also present in the EM T cell upregulated gene list. B) A network model built based on top ten enriched transcription factors illustrates the genes directly (red) and indirectly (orange) connected to PRDM1 through other enriched transcription factors. The network was visualized with Cytoscape software. EM T cell: Effector memory T cell; CM T cell: Central memory T cell; PRDM1: transcription factor PR/SET domain 1.
Efficient knock-down of the transcription factor PR/SET domain 1 (PRDM1) gene with sgPRDM1/Cas9-KRAB
In order to efficiently knock-down BLIMP1 expression using the CRISPRi method, we tested three different sgRNAs that targeted different positions, -5, +35 and +61, relative to the PRDM1 transcription start site (TSS) (Fig. 3A). The three designed sgRNAs were integrated into a lentiviral CRISPRi construct that expressed a Cas9-KRAB fusion protein along with a puromycin resistant gene (Fig. 3B). The three constructs performed differently in reducing PRDM1 mRNA expression. While sgPRDM1+61 and sgPRDM1-5 did not make a significant change in PRDM1 expression, sgPRDM1+35 dramatically decreased PRDM1 gene expression at the mRNA level (Fig. 3C). Thus, sgPRDM1+35 (subsequently denoted as sgPRDM1 in this paper) was selected for PRDM1 suppression for the following experiments.
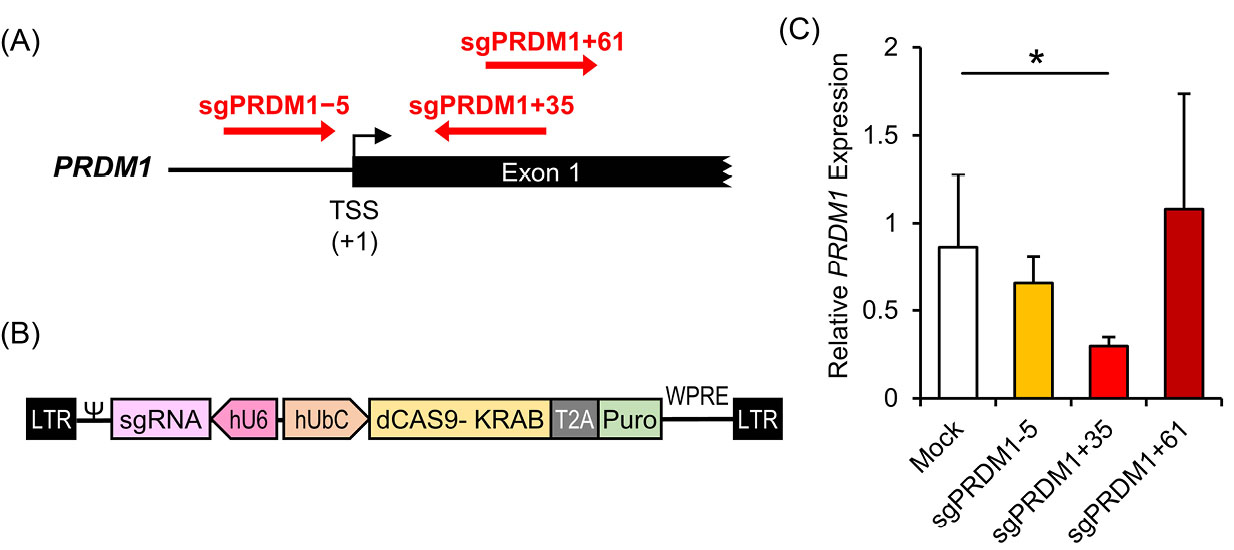
Fig. 3.
Knock-down of the transcription factor PR/SET domain 1 (PRDM1) gene by designed CRISPR interference (CRISPRi) constructs in human T cells. A) The sgRNA target sites near the PRDM1 transcription start site (TSS). The PRDM1 gene is located on chromosome 6. sgPRDM1-5 targets five nucleotides downstream of the TSS; sgPRDM1+35 targets 35 nucleotides upstream of the TSS; and sgPRDM1+61 targets 61 nucleotides upstream of the TSS. B) The CRISPRi construct to knock-down PRDM1. The vector is created to knock-down the PRDM1 gene by the designed sgRNA and the CAS9-KRAB enzyme. By pairing dCas9 with a sequence-specific sgRNA, the dCas9–sgRNA complex can interfere with transcription elongation by blocking RNA polymerase (Pol). It can also impede transcription initiation by disrupting transcription factor binding. In order to achieve enhanced repression, the Krüppel-associated box (KRAB) is fused to the carboxyl terminus of dCas9. Together with a target-specific sgRNA, the dCas9–KRAB fusion proteins can efficiently repress endogenous genes. The puromycin resistant gene expression product is segregated by T2A, a self-cleaving peptide, from the other products of the vector. C) RT-qPCR data depicts expression of the PRDM1 gene. The bar graph shows mRNA expression in different T cell groups transduced with CRISPRi constructs that comprise the designed sgRNAs. The three constructs perform differently in reducing the expression of PRDM1 mRNA. sgPRDM1+35 dramatically decreased PRDM1 gene expression at the mRNA level. The data are presented as mean ± SD, *P < 0.05, n = 3.
.
Knock-down of the transcription factor PR/SET domain 1 (PRDM1) gene by designed CRISPR interference (CRISPRi) constructs in human T cells. A) The sgRNA target sites near the PRDM1 transcription start site (TSS). The PRDM1 gene is located on chromosome 6. sgPRDM1-5 targets five nucleotides downstream of the TSS; sgPRDM1+35 targets 35 nucleotides upstream of the TSS; and sgPRDM1+61 targets 61 nucleotides upstream of the TSS. B) The CRISPRi construct to knock-down PRDM1. The vector is created to knock-down the PRDM1 gene by the designed sgRNA and the CAS9-KRAB enzyme. By pairing dCas9 with a sequence-specific sgRNA, the dCas9–sgRNA complex can interfere with transcription elongation by blocking RNA polymerase (Pol). It can also impede transcription initiation by disrupting transcription factor binding. In order to achieve enhanced repression, the Krüppel-associated box (KRAB) is fused to the carboxyl terminus of dCas9. Together with a target-specific sgRNA, the dCas9–KRAB fusion proteins can efficiently repress endogenous genes. The puromycin resistant gene expression product is segregated by T2A, a self-cleaving peptide, from the other products of the vector. C) RT-qPCR data depicts expression of the PRDM1 gene. The bar graph shows mRNA expression in different T cell groups transduced with CRISPRi constructs that comprise the designed sgRNAs. The three constructs perform differently in reducing the expression of PRDM1 mRNA. sgPRDM1+35 dramatically decreased PRDM1 gene expression at the mRNA level. The data are presented as mean ± SD, *P < 0.05, n = 3.
The role of B lymphocyte-induced maturation protein 1 (BLIMP1) in determining T cell memory phenotype
We sought to determine whether BLIMP1 deficiency impacted the T cell phenotypes. To this extent, we measured CD4, CD8, CD45RA, and CD62L cell surface markers by extracellular staining and flow cytometry analysis on day 18 and day 22 after T cell activation (Fig. 4A). We did not observe any association between PRDM1 knock-down and the CD4+/CD8+ ratio (Fig. 4B, C). No statistical changes were observed in the expressions of the CD45RA and CD62L cell surface markers in BLIMP1-sufficient and BLIMP1-deficient T cells at day 18 (Fig. 5). However, flow cytometry analysis of T cell memory phenotypes in the whole T cell population at day 22 revealed a meaningful increase in the BLIMP1-deficient CM T cells (P = 0.003) and a significant decrease in the EM T cell population (P=.019) in comparison with the BLIMP1-sufficient counterpart T cells (Fig. 4D, E). Phenotypic analysis of CD4+ T cells at day 22 revealed a significant increase (P = 0.010) in the CM T cell population (Fig. 4F), while a more significant increase was observed in CM (P = 0.002) versus a significant decrease in NL (P = 0.032), EM (P = 0.00027), and TE (P = 0.043) T cells in the CD8+ population at day 22 (Fig. 4G).
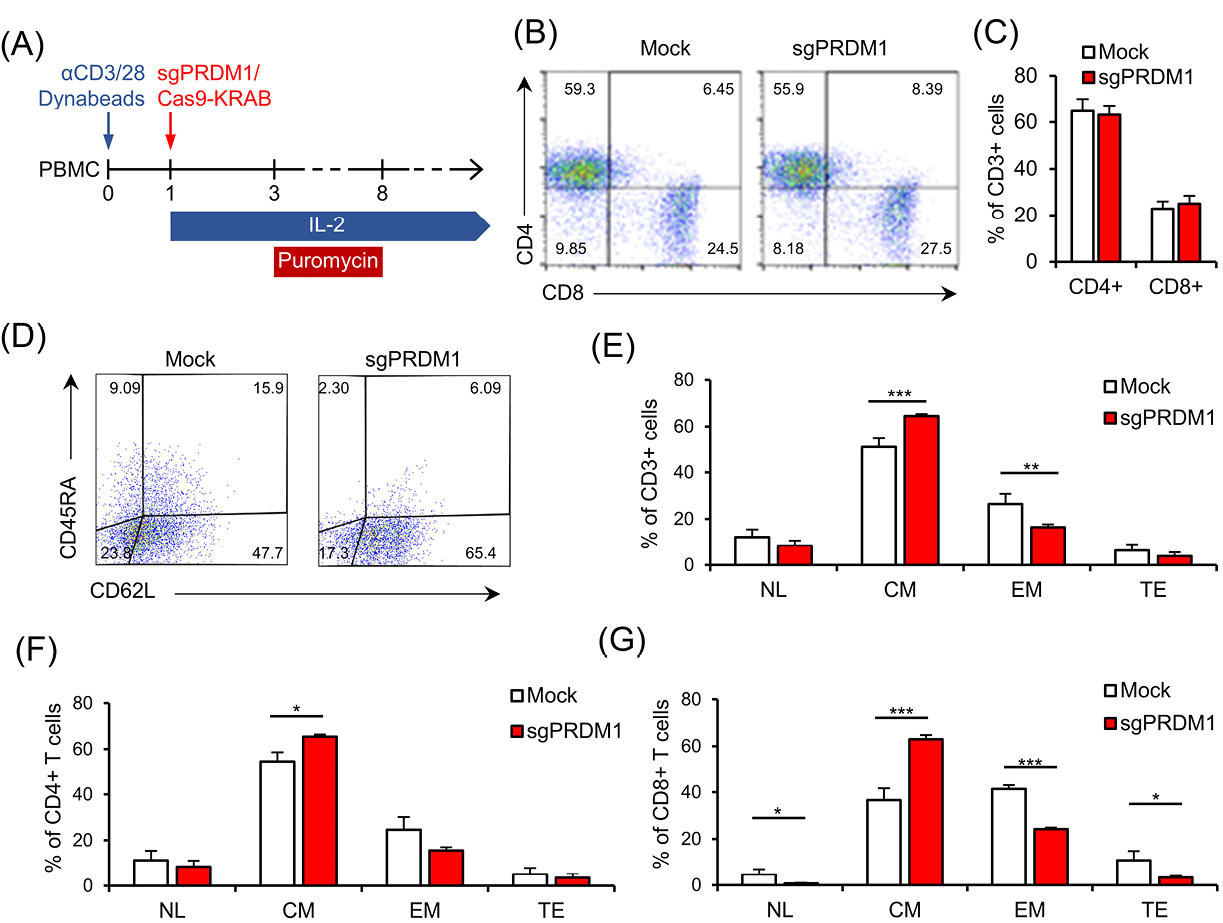
Fig. 4.
BLIMP1 knock-down prevents EM and TE T cell phenotypes and increases CM T cell differentiation. A) The schematic timeline of the experimental setting. PBMC was activated by anti-CD3/CD28 Dynabead on day zero. The sgPRDM1/Cas9-KRAB genetic constructs that contain the designed sgRNAs were transduced into T cells of different groups on the first day. T cells received IL-2 from the first day until the end of the experiment, while puromycin treatment was carried out for six days. Flow cytometry assessments were done at different days after the puromycin treatment. B) The scatter plot represents the percentages of the CD4+ and CD8+ T cell population on day 10 in a representative donor. This assessment was fulfilled after puromycin selection on the transduced groups. C) The bar graph represents the percentages of CD4+ and CD8+ T cell populations on day 10. There was no observed association between transcription factor PR/SET domain 1 (PRDM1) knock-down and the CD4+/CD8+ ratio. D) Scatter plot shows the percentages of CD62L and CD45RA expression in the whole T cell population on day 22 in the Mock group and in the whole T cell population on day 22 in the Mock and sgPRDM1 groups. A meaningful increase in BLIMP1-deficient CM T cells and a significant reduction in EM T cells is shown. F) Bar graph depicts the different T cell phenotypes in the CD4+ T cell population on day 22 in the Mock and sgPRDM1 groups. G) Bar graph depicts the different T cell phenotypes in the CD8+ T cell population on day 22 in the Mock and sgPRDM1 groups. The data are presented as mean ± SD, *P < 0.05, **P < 0.01 and ***P < 0.001, n = 3. EM T cell: Effector memory T cell; TE T cell: Terminally effector T cell; CM T cell: Central memory T cell; BLIMP1: B lymphocyte-induced maturation protein 1; PBMC: Peripheral blood mononuclear cells.
.
BLIMP1 knock-down prevents EM and TE T cell phenotypes and increases CM T cell differentiation. A) The schematic timeline of the experimental setting. PBMC was activated by anti-CD3/CD28 Dynabead on day zero. The sgPRDM1/Cas9-KRAB genetic constructs that contain the designed sgRNAs were transduced into T cells of different groups on the first day. T cells received IL-2 from the first day until the end of the experiment, while puromycin treatment was carried out for six days. Flow cytometry assessments were done at different days after the puromycin treatment. B) The scatter plot represents the percentages of the CD4+ and CD8+ T cell population on day 10 in a representative donor. This assessment was fulfilled after puromycin selection on the transduced groups. C) The bar graph represents the percentages of CD4+ and CD8+ T cell populations on day 10. There was no observed association between transcription factor PR/SET domain 1 (PRDM1) knock-down and the CD4+/CD8+ ratio. D) Scatter plot shows the percentages of CD62L and CD45RA expression in the whole T cell population on day 22 in the Mock group and in the whole T cell population on day 22 in the Mock and sgPRDM1 groups. A meaningful increase in BLIMP1-deficient CM T cells and a significant reduction in EM T cells is shown. F) Bar graph depicts the different T cell phenotypes in the CD4+ T cell population on day 22 in the Mock and sgPRDM1 groups. G) Bar graph depicts the different T cell phenotypes in the CD8+ T cell population on day 22 in the Mock and sgPRDM1 groups. The data are presented as mean ± SD, *P < 0.05, **P < 0.01 and ***P < 0.001, n = 3. EM T cell: Effector memory T cell; TE T cell: Terminally effector T cell; CM T cell: Central memory T cell; BLIMP1: B lymphocyte-induced maturation protein 1; PBMC: Peripheral blood mononuclear cells.
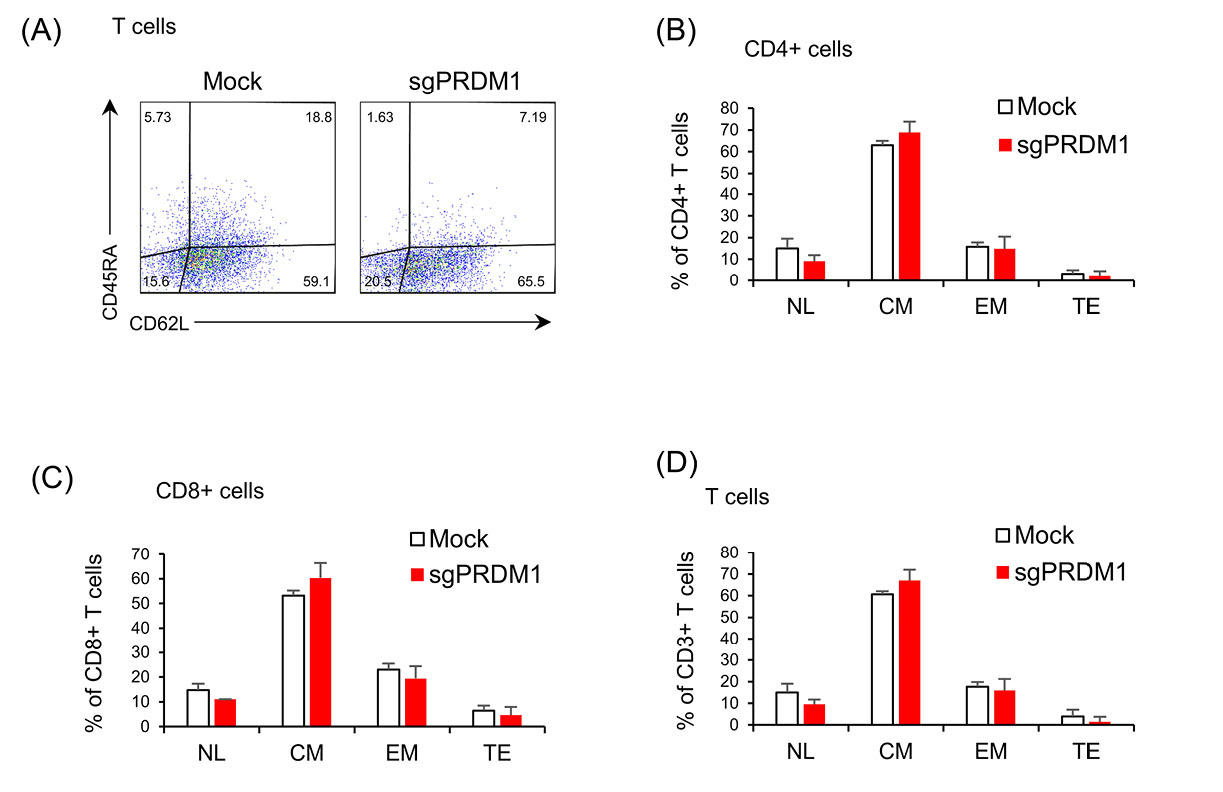
Fig. 5.
The early influence of BLIMP1 inhibition on T cell phenotype. No statistical changes were observed in the expressions of the CD45RA and CD62L cell surface markers in BLIMP1-sufficient and BLIMP1-deficient T cells. A) The scatter plots represent the percentages of CD62L and CD45RA expression in the whole T cell population in the Mock and sgPRDM1 groups on day 18. Bar graphs depict: B) different T cell phenotypes in the CD4+ T cell population in the Mock and sgPRDM1 groups on day 18; C) different T cell phenotypes in the CD8+ T cell population on day 18 in the Mock and sgPRDM1 groups; and D) different T cell phenotypes in the whole T cell population on day 18 in the Mock and sgPRDM1 groups. BLIMP1: B lymphocyte-induced maturation protein 1.
.
The early influence of BLIMP1 inhibition on T cell phenotype. No statistical changes were observed in the expressions of the CD45RA and CD62L cell surface markers in BLIMP1-sufficient and BLIMP1-deficient T cells. A) The scatter plots represent the percentages of CD62L and CD45RA expression in the whole T cell population in the Mock and sgPRDM1 groups on day 18. Bar graphs depict: B) different T cell phenotypes in the CD4+ T cell population in the Mock and sgPRDM1 groups on day 18; C) different T cell phenotypes in the CD8+ T cell population on day 18 in the Mock and sgPRDM1 groups; and D) different T cell phenotypes in the whole T cell population on day 18 in the Mock and sgPRDM1 groups. BLIMP1: B lymphocyte-induced maturation protein 1.
The effect of B lymphocyte-induced maturation protein 1 (BLIMP1) suppression on the exhaustion marker expressions
We next explored the expressions of exhaustion markers on sgPRDM1-transduced BLIMP1-deficient human T cells. We first assessed PD1 expression by flow cytometry on day 18 of culture. Although statistically not significant, there was an elevated proportion of PD1-expressing cells in the BLIMP1-sufficient T cells at this time point (Fig. 6 A-C). In order to further assess the influence of BLIMP1 on T cell exhaustion, PD1 and TIM3 exhaustion markers were measured by flow cytometry on day 25. In the whole T cell population on day 25, there was a statistically significant lower frequency of PD1−TIM3+ cells observed in the BLIMP1-deficient T cells, but no statistical difference was seen in the percentage of PD1+TIM3− and PD1+TIM3+ cells (Fig. 7A, B). No statistically significant difference was seen for PD1+TIM3− cells in the BLIMP1-deficient CD4+ T cell populations on day 25 (Fig. 7C); however, there were statistically fewer PD1+TIM3− cells in the BLIMP1-deficient CD8+ T cell populations on day 25 (Figs. 6D, E and 7D).
Next, we measured the MFI in the whole T cell population as well as the CD4+ and CD8+ subpopulations to determine if there were any additional differences between BLIMP1-sufficient and BLIMP1-deficient T cells for the expressions of PD1 and TIM3 on day 25. A decreased TIM3 MFI level was observed in BLIMP1-deficient T cells (Figs. 6F, G and 7E, F). On the other hand, PD1+ T cells showed higher PD1 MFI in the BLIMP1-deficient group (Figs. 6H, I and 7G, H,). Overall, this data suggests that BLIMP1 knock-down results in elevated PD1 and reduced TIM3 expressions in ex vivoexpanded human T cells.
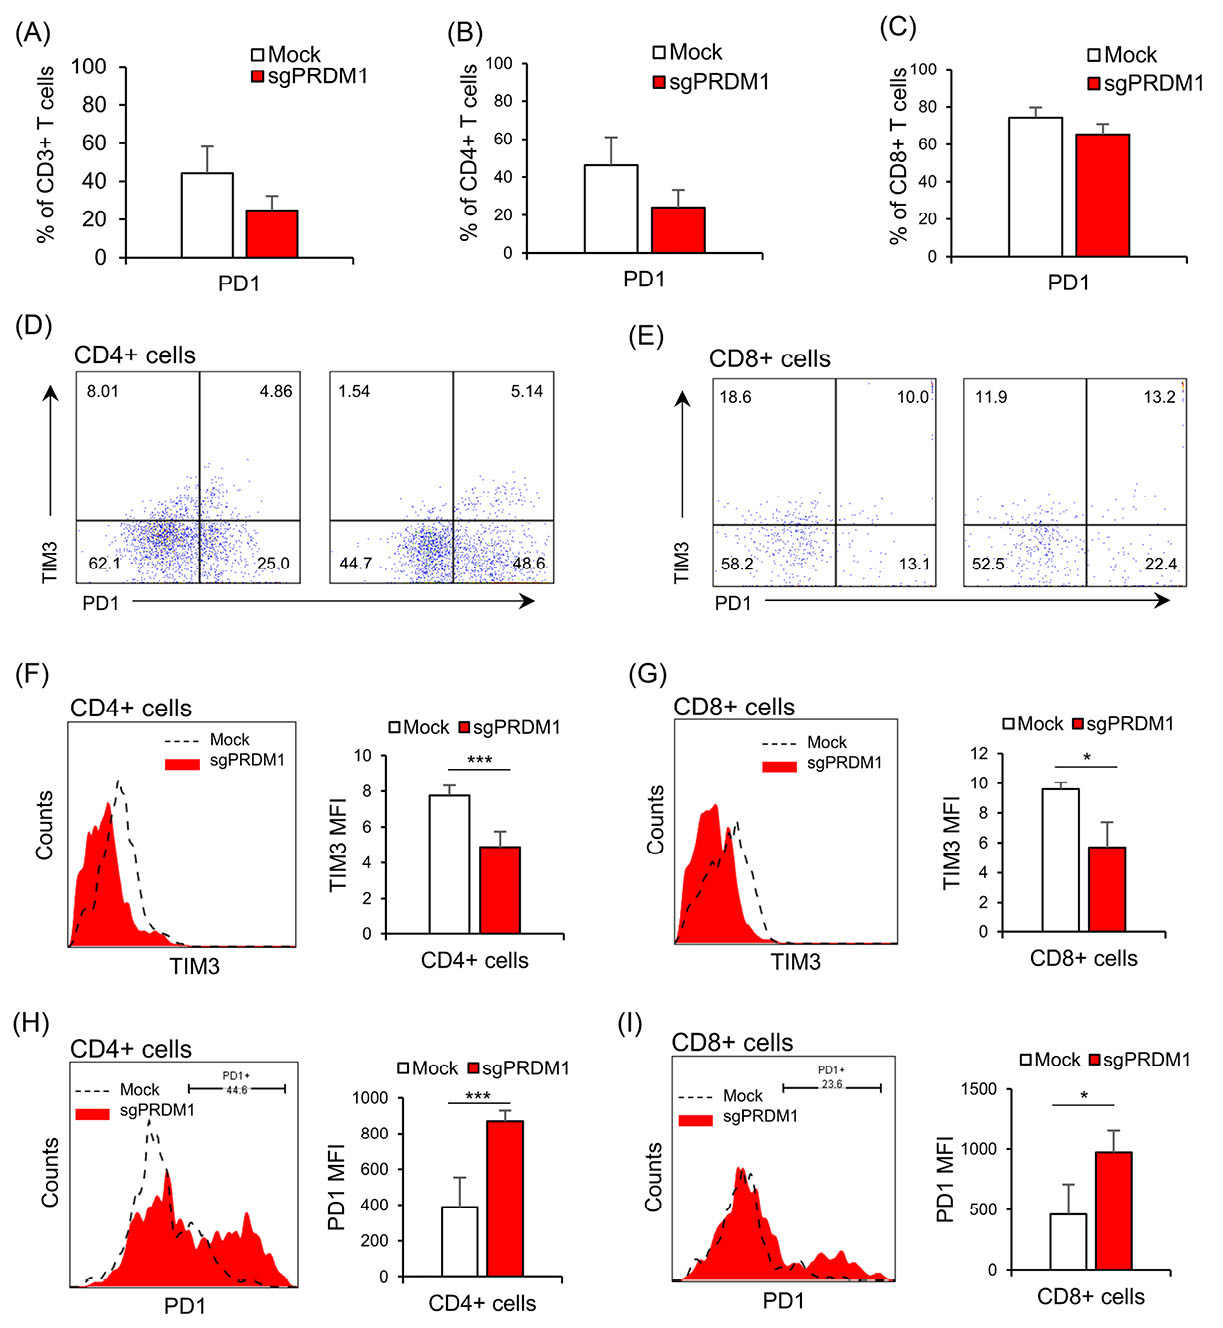
Fig. 6.
The impact of BLIMP1 knock-down on exhaustion markers PD1 and TIM3 in the Mock and sgPRDM1 groups in CD4+ and CD8+ T cells. On day 18, there were no statistically meaningful differences observed in the expression levels of PD1 and TIM3 between BLIMP1-sufficient and BLIMP1-deficient T cells. However, on day 25, there was a decline in TIM3 expression and an increase in PD1 expression in BLIMP1-deficient T cells rather than BLIMP1-sufficient T cells. Bar graphs show: A) expression of the exhaustion marker PD1 in the whole T cell population for the Mock and sgPRDM1 groups on day 18 and B, C) expression of the exhaustion marker PD1 in the CD4+ and CD8+ T cell populations, respectively, for the Mock and sgPRDM1 groups on day 18. D, E) Scatter plots depict the expression of the exhaustion markers PD1 and TIM3 in the CD4+ and CD8+ T cell populations, respectively, for the Mock and sgPRDM1 groups on day 25. F, G) The representative histogram and bar graph delineate TIM3 expression in the CD4+ and CD8+ T cell populations, respectively, on day 25. H, I) The representative histogram plot and bar graph show PD1 expression in the CD4+ and CD8+ T cell populations, respectively, on day 25. BLIMP1: B lymphocyte-induced maturation protein 1.
.
The impact of BLIMP1 knock-down on exhaustion markers PD1 and TIM3 in the Mock and sgPRDM1 groups in CD4+ and CD8+ T cells. On day 18, there were no statistically meaningful differences observed in the expression levels of PD1 and TIM3 between BLIMP1-sufficient and BLIMP1-deficient T cells. However, on day 25, there was a decline in TIM3 expression and an increase in PD1 expression in BLIMP1-deficient T cells rather than BLIMP1-sufficient T cells. Bar graphs show: A) expression of the exhaustion marker PD1 in the whole T cell population for the Mock and sgPRDM1 groups on day 18 and B, C) expression of the exhaustion marker PD1 in the CD4+ and CD8+ T cell populations, respectively, for the Mock and sgPRDM1 groups on day 18. D, E) Scatter plots depict the expression of the exhaustion markers PD1 and TIM3 in the CD4+ and CD8+ T cell populations, respectively, for the Mock and sgPRDM1 groups on day 25. F, G) The representative histogram and bar graph delineate TIM3 expression in the CD4+ and CD8+ T cell populations, respectively, on day 25. H, I) The representative histogram plot and bar graph show PD1 expression in the CD4+ and CD8+ T cell populations, respectively, on day 25. BLIMP1: B lymphocyte-induced maturation protein 1.
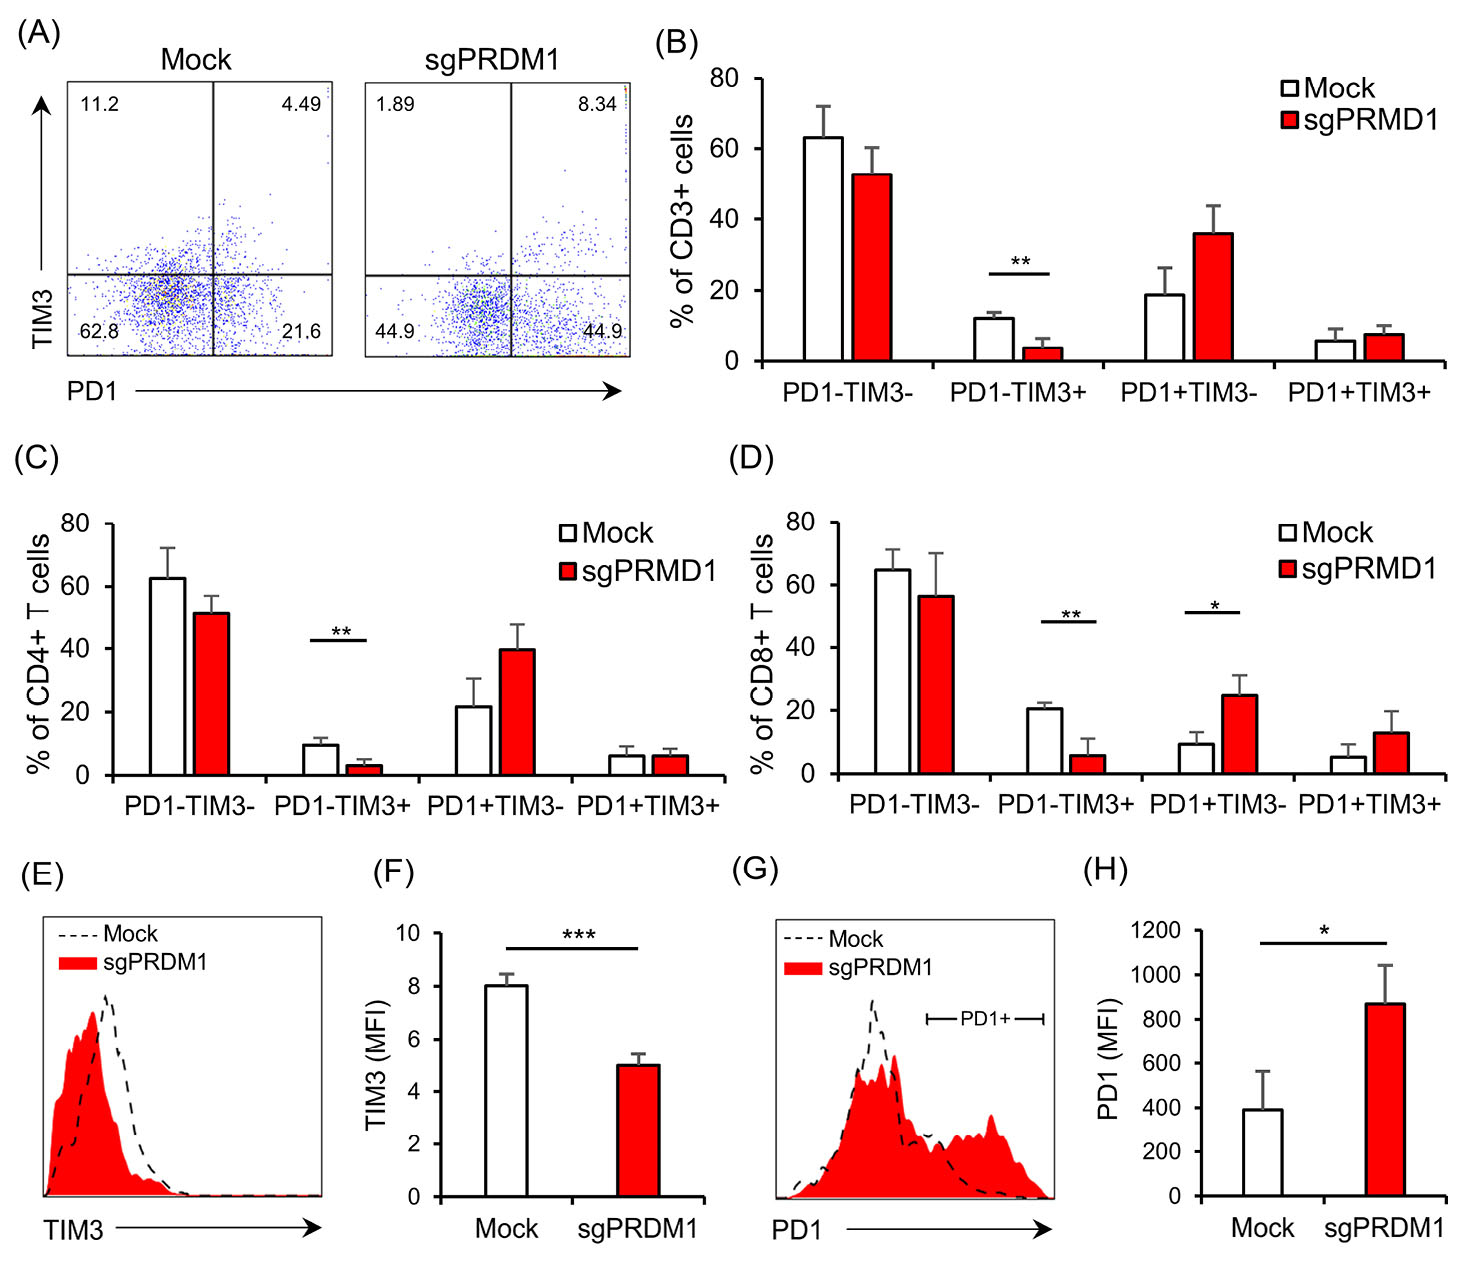
Fig. 7.
BLIMP1 knock-down affects the expression of the exhaustion markers PD1 and TIM3 in human T cells. A) The representative scatter plot illustrates PD1 and TIM3 expression for the whole T cell population on day 25. B) The bar graph depicts the percentage of the T cell subpopulations based on the expression of the exhaustion markers PD1 and TIM3 in the whole T cell population for the Mock and sgPRDM1 groups on day 25. C) Percentages of PD1 and/or TIM3 expressing cells in the CD4+ T cell population on day 25. D) Percentages of PD1 and/or TIM3 expressing cells among the CD8+ T cells on day 25. E) The representative histograms compare TIM3 expression between the Mock and sgPRDM1 groups for the whole T cell population on day 25. F) The bar graph represents the MFI for the expression of the exhaustion marker TIM3 in the whole T cell population for the Mock and sgPRDM1 groups on day 25. G) The representative histograms of PD1 expression in the Mock and sgPRDM1 groups for the whole T cell population on day 25. H) The bar graph represents the MFI for the expression of PD1 in PD1+ cells for the Mock and sgPRDM1 groups on day 25. The data are presented as mean ± SD, *P < 0.05, **P < 0.01 and ***P < 0.001, n = 3. BLIMP1: B lymphocyte-induced maturation protein 1; MFI: Median fluorescent intensity.
.
BLIMP1 knock-down affects the expression of the exhaustion markers PD1 and TIM3 in human T cells. A) The representative scatter plot illustrates PD1 and TIM3 expression for the whole T cell population on day 25. B) The bar graph depicts the percentage of the T cell subpopulations based on the expression of the exhaustion markers PD1 and TIM3 in the whole T cell population for the Mock and sgPRDM1 groups on day 25. C) Percentages of PD1 and/or TIM3 expressing cells in the CD4+ T cell population on day 25. D) Percentages of PD1 and/or TIM3 expressing cells among the CD8+ T cells on day 25. E) The representative histograms compare TIM3 expression between the Mock and sgPRDM1 groups for the whole T cell population on day 25. F) The bar graph represents the MFI for the expression of the exhaustion marker TIM3 in the whole T cell population for the Mock and sgPRDM1 groups on day 25. G) The representative histograms of PD1 expression in the Mock and sgPRDM1 groups for the whole T cell population on day 25. H) The bar graph represents the MFI for the expression of PD1 in PD1+ cells for the Mock and sgPRDM1 groups on day 25. The data are presented as mean ± SD, *P < 0.05, **P < 0.01 and ***P < 0.001, n = 3. BLIMP1: B lymphocyte-induced maturation protein 1; MFI: Median fluorescent intensity.
The effect of B lymphocyte-induced maturation protein 1 (BLIMP1) knock-down on functional characteristics of human T cells
The preferential differentiation of BLIMP1-deficient T cells into cells with a CM phenotype suggested that these cells would have lower proliferation and death rate. Examination of T cell proliferation and death, with an adjusted number of 1×10⁵ cells for each group after Puromycin selection (10 days after PBMC isolation), showed that the proliferation rate for BLIMP1-deficient T cells was half and these cells had longer longevity compared to BLIMP1-sufficient T cells (Fig. 8A, B).

Fig. 8.
The effect of BLIMP1 knock-down on the functional characteristics of T cells. A) The line graph represents fold change expansion in the Mock and sgPRDM1 groups during a 10 day-expansion period. B) The line graph shows the trend for T cell death in the Mock and sgPRDM1 groups during a 30 day-expansion period after a re-stimulation on day 3. C) Representative flow cytometry data of a co-culture of T cells with target cells (K562-OKT3) analyzed after three days. T cells were distinguished from target cells based on CD3 expression. D) A summary of data observed from the co-culture experiment (n = 3) shows significantly fewer target cells in the BLIMP1-deficient T cell group (sgPRDM1) compared to untransduced T cells (Ctrl). E) Representative data for the expression of a degranulation marker, CD107a, on T cells in the co-culture experiment. F) CD107a median fluorescent intensity (MFI) measured in the co-culture experiment (n = 3). The data are presented as mean ± SD, *P < 0.05. BLIMP1: B lymphocyte-induced maturation protein 1.
.
The effect of BLIMP1 knock-down on the functional characteristics of T cells. A) The line graph represents fold change expansion in the Mock and sgPRDM1 groups during a 10 day-expansion period. B) The line graph shows the trend for T cell death in the Mock and sgPRDM1 groups during a 30 day-expansion period after a re-stimulation on day 3. C) Representative flow cytometry data of a co-culture of T cells with target cells (K562-OKT3) analyzed after three days. T cells were distinguished from target cells based on CD3 expression. D) A summary of data observed from the co-culture experiment (n = 3) shows significantly fewer target cells in the BLIMP1-deficient T cell group (sgPRDM1) compared to untransduced T cells (Ctrl). E) Representative data for the expression of a degranulation marker, CD107a, on T cells in the co-culture experiment. F) CD107a median fluorescent intensity (MFI) measured in the co-culture experiment (n = 3). The data are presented as mean ± SD, *P < 0.05. BLIMP1: B lymphocyte-induced maturation protein 1.
We sought to investigate the effect of BLIMP1 knock-down on T cell activation and cytotoxicity by co-culturing the transduced T cells with an engineered K562 cell line that expresses a membrane-bound anti-CD3 protein (K562-OKT3), and serves as a universal target cell for T cells. Next, we examined the activation marker and changes in T cell-target cell ratio. As shown in Fig. 8C, D, the percentage of target cells was lower in the control group compared to the BLIMP1-deficient group. On the other hand, the MFI of CD107a, a degranulation marker, showed no significant diference btween the groups (Fig. 8E, F). Collectively, these results suggest that downregulation of BLIMP1 is associated with increased overall killing by T cells that might result from their improved persistance instead of increasaed cytotoxic activity.
Discussion
In this study, we used the CRISPRi genome editing tool. It is noteworthy to mention the merits of CRISPRi over siRNA and CRISPR/Cas9. The main advantage of CRISPRi over CRISPR/Cas9 is its transient knock-down effects compared to the full knock-out effects of CRISPR/Cas9.
26
Gene knock-down via CRISPRi is not dependant on ploidy or frame shift mutations, which is a major benefit.
27
CRISPRi appears to produce a more consistent and robust knock-down given the same number of effector RNAs rather than RNAi. For instance, six out of eight sgRNAs were found to repress GFP levels by at least 75%
28
and CRISPRi shows significantly stronger loss-of-function phenotypes for gene inhibition compared with RNAi.
29
In addition, reversible PRDM1 knock-down, which is possible by inducible CRISPRi through the Tet on/off system rather than RNAi, was used in this study because the BLIMP1 protein is necessary for the proper function of effector T cells and for the recall response of memory T cells.
30
Therefore, we considered CRISPRi to be the best genome editing tool for this study.
We observed that PRDM1 knock-down enhanced CM T cell (P = 0.003) and decreased EM T cell (P = 0.019) phenotypes in human T cells. Less of the TIM3 exhaustion marker was observed in BLIMP1-deficient CD8+ T cells; however, there was higher, but not statistically meaningful, PD1 expression in the BLIMP1-deficient T cell population.
To the best of our knowledge, previous studies on the impacts of BLIMP1-deficiency were mostly conducted on mouse T cells. It has been reported that BLIMP1 influences effector versus memory subsets of CD4+ T cells in mouse models,
3,5,31
which we confirmed by our findings in the human CD4+ T cell population. Our data showed that BLIMP1-deficiency caused a meaningful increase in the CM T cell phenotype (P = 0.010) in CD4+ human T cells. In terms of CD8+ T cells, previous studies on mouse T cells depicted a critical regulatory role for BLIMP1 in driving the terminal differentiation of effector T cells,
3,5,9,10
which was completely compatible with our results on human CD8+ T cells. The current study results had enough compelling data for BLIMP1-deficient CD8+ T cells to have a higher CM T cell phenotype (P = 0.002) versus lower EM (P = 0.00027), TE (P = 0.043), and NL (P = 0.032) T cell phenotypes. Overall, for the whole T cell population in human T cells, we showed that a BLIMP1 deficiency increased the CM T cell phenotype and lowered the EM T cell phenotype, which confirmed results of previous studies on mouse models.
3,5
We observed that BLIMP1-deficiency in human T cells resulted in a non-meaningful PD1 increase despite a meaningful TIM3 decrease in the whole T cell population. In line with our findings, BLIMP1 expression has previously been reported to repress PD1, such that there is an increase in PD1 expression in BLIMP1–deficient CD8+ T cells in mouse models.
32
Our findings that PD1 increased this level in human T cells supported the results of those studies. It has previously been reported that exhausted T cells have higher expression of BLIMP1 and, in contrast, BLIMP1-deficient CD8+ T cells resist exhaustion and exhibit improved cell numbers.
6
There is higher PD1 expression in BLIMP1 deficient CD8+ T cells.
12
BLIMP1 deficiency has been shown to lead to higher/increased levels of PD1 expression during T follicular helper (Tfh) and regulatory T (Treg) cell differentiation.
20,33
A compensatory effect between a number of checkpoint inhibitors including PD-1, LAG-3, and CTLA-4 has been proposed.
34
However, there is no data on such compensatory effect between TIM3 and any of the known BLIMP1 targets. On the other hand, there are several reports about upregulation of PD1 and TIM3 in exhausted T cells,
31,35-41
which is indirectly in line with our findings on TIM3 downregulation in BLIMP1 deficient human T cells because BLIMP1 is a key up-regulator of exhaustion markers.
42
Of note, BLIMP1 knock-down reduces T cell proliferation. Our results showed a three-fold expansion for BLIMP1 knock-down T cell groups and a six-fold expansion for BLIMP1 sufficient T cells. However, BLIMP1 knock-down improved T cell persistence and cytotoxicity. Since our knock-down system only partially deplete BLIMP1, our cytotoxicity result is in line with previous data showing that a genetic mice model with haploinsufficiency of BLIMP1 in CD8+ T cells (conditional heterozygous) controls infection more rapidly than wild-type or BLIMP1-null mice.
6
It can be inferred from the results of our study and previous studies on knocking down Prdm1 in mouse models that BLIMP1 is a master inducer of effector phenotype in human T cell differentiation. A BLIMP1 deficiency leads to a reduction in effector phenotype through an increase in memory phenotype, a reduction in TIM3, but an increase in PD1 markers. Although we provided the first functional evidence on the significant role of BLIMP1 in human T cell differentiation, additional research should be conducted to determine the impact of BLIMP1 function on memory T cell recall response in human T cells in addition to a thorough investigation of this effect in subsequent in vivo experiments. Our findings can also be assessed in an adoptive immunotherapy model, most importantly the CAR T cell models.
In conclusion, the results of this study showed the specific impacts of BLIMP1 deficiency on the human T cell phenotype and exhaustion. We uncovered the critical role of BLIMP1 in the human T cell fate; therefore, it can be determined how BLIMP1 could be a potential key factor in regulating T cell persistence in human immunotherapies.
We suggest that further studies be conducted to ascertain the mechanism of action for BLIMP1. Whether BLIMP1 increases CD62L+ memory T cells through an outgrowth in their population or through its direct impact on increasing the expression level of CD62L remains to be determined. The result of our study proved the effects of BLIMP1 knock-down on human T cell phenotypes and showed that BLIMP1 knock-down changed the cell surface markers. Further molecular research on BLIMP1 targets that change their expression levels due to BLIMP1 knock-down could be conducted to determine the effects of BLIMP1 on the functional properties of T cells at the molecular level.
Research Highlights
What is the current knowledge?
√ CBLIMP1 is a T cell differentiation regulator in mice.
√ Activated human T cells express PRDM1/BLIMP1 at different levels.
What is new here?
√ Knock-down of PRDM1/BLIMP1 increases the central memory (CM) phenotype in ex vivo expanded human T cells.
√ PRDM1/BLIMP1-deficient human T cells express higher levels of PD1 and lower levels of TIM3.
Acknowledgement
The authors are grateful to the staff at Royan Institute who assisted with conducting this study. This study was supported by a grant from Royan Institute, Tehran, Iran.
Funding sources
Funding for the present work was provided by grants from Royan Institute to MB and the University of Guilan to MRA.
Ethical statement
This study was approved by the Research Ethics Committee at Royan Institute (ref. no. IR.ACECR.ROYAN.REC.1379.112).
Competing interests
The authors declare that they have no competing interests.
Authors’ contribution
MA, MB and AA contributed to the study design. MA, AS and MB performed the experiments and data analysis. NN, SH, HM and BK performed the in silico analyses. MA drafted the manuscript. All authors contributed to data interpretation, discussed the results, and revised the manuscript.
Supplementary Materials
Supplementary file 1 contains Table S1.
(pdf)
References
- Turner CA, Jr Jr, Mack DH, Davis MM. Blimp-1, a novel zinc finger-containing protein that can drive the maturation of B lymphocytes into immunoglobulin-secreting cells. Cell 1994; 77:297-306. doi: 10.1016/0092-8674(94)90321-2 [Crossref] [ Google Scholar]
- Choi YS, Kageyama R, Eto D, Escobar TC, Johnston RJ, Monticelli L. ICOS receptor instructs T follicular helper cell versus effector cell differentiation via induction of the transcriptional repressor Bcl6. Immunity 2011; 34:932-46. doi: 10.1016/j.immuni.2011.03.023 [Crossref] [ Google Scholar]
- Kallies A, Xin A, Belz GT, Nutt SL. Blimp-1 transcription factor is required for the differentiation of effector CD8(+) T cells and memory responses. Immunity 2009; 31:283-95. doi: 10.1016/j.immuni.2009.06.021 [Crossref] [ Google Scholar]
- Pepper M, Pagán AJ, Igyártó BZ, Taylor JJ, Jenkins MK. Opposing signals from the Bcl6 transcription factor and the interleukin-2 receptor generate T helper 1 central and effector memory cells. Immunity 2011; 35:583-95. doi: 10.1016/j.immuni.2011.09.009 [Crossref] [ Google Scholar]
- Rutishauser RL, Martins GA, Kalachikov S, Chandele A, Parish IA, Meffre E. Transcriptional repressor Blimp-1 promotes CD8(+) T cell terminal differentiation and represses the acquisition of central memory T cell properties. Immunity 2009; 31:296-308. doi: 10.1016/j.immuni.2009.05.014 [Crossref] [ Google Scholar]
- Shin H, Blackburn SD, Intlekofer AM, Kao C, Angelosanto JM, Reiner SL. A role for the transcriptional repressor Blimp-1 in CD8(+) T cell exhaustion during chronic viral infection. Immunity 2009; 31:309-20. doi: 10.1016/j.immuni.2009.06.019 [Crossref] [ Google Scholar]
- Arsenio J, Kakaradov B, Metz PJ, Kim SH, Yeo GW, Chang JT. Early specification of CD8+ T lymphocyte fates during adaptive immunity revealed by single-cell gene-expression analyses. Nat Immunol 2014; 15:365-72. doi: 10.1038/ni.2842 [Crossref] [ Google Scholar]
- Kalia V, Sarkar S, Subramaniam S, Haining WN, Smith KA, Ahmed R. Prolonged interleukin-2Ralpha expression on virus-specific CD8+ T cells favors terminal-effector differentiation in vivo. Immunity 2010; 32:91-103. doi: 10.1016/j.immuni.2009.11.010 [Crossref] [ Google Scholar]
- Kallies A, Hawkins ED, Belz GT, Metcalf D, Hommel M, Corcoran LM. Transcriptional repressor Blimp-1 is essential for T cell homeostasis and self-tolerance. Nat Immunol 2006; 7:466-74. doi: 10.1038/ni1321 [Crossref] [ Google Scholar]
- Kallies A, Nutt SL. Terminal differentiation of lymphocytes depends on Blimp-1. CurrOpin Immunol 2007; 19:156-62. doi: 10.1016/j.coi.2007.01.003 [Crossref] [ Google Scholar]
- Crotty S, Johnston RJ, Schoenberger SP. Effectors and memories: Bcl-6 and Blimp-1 in T and B lymphocyte differentiation. Nat Immunol 2010; 11:114-20. doi: 10.1038/ni.1837 [Crossref] [ Google Scholar]
- Xin A, Masson F, Liao Y, Preston S, Guan T, Gloury R. A molecular threshold for effector CD8(+) T cell differentiation controlled by transcription factors Blimp-1 and T-bet. Nat Immunol 2016; 17:422-32. doi: 10.1038/ni.3410 [Crossref] [ Google Scholar]
- Rosenberg SA, Restifo NP. Adoptive cell transfer as personalized immunotherapy for human cancer. Science 2015; 348:62-8. doi: 10.1126/science.aaa4967 [Crossref] [ Google Scholar]
- Li Y, Bleakley M, Yee C. IL-21 influences the frequency, phenotype, and affinity of the antigen-specific CD8 T cell response. J Immunol 2005; 175:2261-9. doi: 10.4049/jimmunol.175.4.2261 [Crossref] [ Google Scholar]
- Grupp SA, Kalos M, Barrett D, Aplenc R, Porter DL, Rheingold SR. Chimeric antigen receptor-modified T cells for acute lymphoid leukemia. N Engl J Med 2013; 368:1509-18. doi: 10.1056/NEJMoa1215134 [Crossref] [ Google Scholar]
- Gattinoni L, Lugli E, Ji Y, Pos Z, Paulos CM, Quigley MF. A human memory T cell subset with stem cell-like properties. Nat Med 2011; 17:1290-7. doi: 10.1038/nm.2446 [Crossref] [ Google Scholar]
- Restifo NP, Dudley ME, Rosenberg SA. Adoptive immunotherapy for cancer: harnessing the T cell response. Nat Rev Immunol 2012; 12:269-81. doi: 10.1038/nri3191 [Crossref] [ Google Scholar]
- Takeshita M, Suzuki K, Kassai Y, Takiguchi M, Nakayama Y, Otomo Y. Polarization diversity of human CD4+ stem cell memory T cells. Clin Immunol 2015; 159:107-17. doi: 10.1016/j.clim.2015.04.010 [Crossref] [ Google Scholar]
- Bolstad BM, Irizarry RA, Astrand M, Speed TP. A comparison of normalization methods for high density oligonucleotide array data based on variance and bias. Bioinformatics 2003; 19:185-93. doi: 10.1093/bioinformatics/19.2.185 [Crossref] [ Google Scholar]
- Johnson WE, Li C, Rabinovic A. Adjusting batch effects in microarray expression data using empirical Bayes methods. Biostatistics 2007; 8:118-27. doi: 10.1093/biostatistics/kxj037 [Crossref] [ Google Scholar]
- Leek JT, Johnson WE, Parker HS, Jaffe AE, Storey JD. The sva package for removing batch effects and other unwanted variation in high-throughput experiments. Bioinformatics 2012; 28:882-3. doi: 10.1093/bioinformatics/bts034 [Crossref] [ Google Scholar]
- Benjamini Y, Hochberg Y. Controlling the false discovery rate: a practical and powerful approach to multiple testing. Journal of the Royal Statistical Society: Series B (Methodological) 1995; 57: 289-300.
- Kuleshov MV, Jones MR, Rouillard AD, Fernandez NF, Duan Q, Wang Z. Enrichr: a comprehensive gene set enrichment analysis web server 2016 update. Nucleic Acids Res 2016; 44:W90-7. doi: 10.1093/nar/gkw377 [Crossref] [ Google Scholar]
- Lachmann A, Torre D, Keenan AB, Jagodnik KM, Lee HJ, Wang L. Massive mining of publicly available RNA-seq data from human and mouse. Nat Commun 2018; 9:1366. doi: 10.1038/s41467-018-03751-6 [Crossref] [ Google Scholar]
- Thakore PI, D'Ippolito AM, Song L, Safi A, Shivakumar NK, Kabadi AM. Highly specific epigenome editing by CRISPR-Cas9 repressors for silencing of distal regulatory elements. Nat Methods 2015; 12:1143-9. doi: 10.1038/nmeth.3630 [Crossref] [ Google Scholar]
- Boettcher M, McManus MT. Choosing the right tool for the job: RNAi, TALEN, or CRISPR. Molecular cell 2015; 58:575-85. [ Google Scholar]
- Xue W, Zender L, Miething C, Dickins RA, Hernando E, Krizhanovsky V. Senescence and tumour clearance is triggered by p53 restoration in murine liver carcinomas. Nature 2007; 445:656-60. [ Google Scholar]
- Gilbert LA, Larson MH, Morsut L, Liu Z, Brar GA, Torres SE. CRISPR-mediated modular RNA-guided regulation of transcription in eukaryotes. Cell 2013; 154:442-51. doi: 10.1016/j.cell.2013.06.044 [Crossref] [ Google Scholar]
- Gilbert LA, Horlbeck MA, Adamson B, Villalta JE, Chen Y, Whitehead EH. Genome-scale CRISPR-mediated control of gene repression and activation. Cell 2014; 159:647-61. doi: 10.1016/j.cell.2014.09.029 [Crossref] [ Google Scholar]
- Kallies A, Xin A, Belz GT, Nutt SL. Blimp-1 transcription factor is required for the differentiation of effector CD8+ T cells and memory responses. Immunity 2009; 31:283-95. doi: 10.1016/j.immuni.2009.06.021 [Crossref] [ Google Scholar]
- Blackburn SD, Shin H, Haining WN, Zou T, Workman CJ, Polley A. Coregulation of CD8+ T cell exhaustion by multiple inhibitory receptors during chronic viral infection. Nat Immunol 2009; 10:29-37. doi: 10.1038/ni.1679 [Crossref] [ Google Scholar]
- Lu P, Youngblood BA, Austin JW, Rasheed Mohammed AU, Butler R, Ahmed R. Blimp-1 represses CD8 T cell expression of PD-1 using a feed-forward transcriptional circuit during acute viral infection. J Exp Med 2014; 211:515-27. doi: 10.1084/jem.20130208 [Crossref] [ Google Scholar]
- Cretney E, Xin A, Shi W, Minnich M, Masson F, Miasari M. The transcription factors Blimp-1 and IRF4 jointly control the differentiation and function of effector regulatory T cells. Nat Immunol 2011; 12:304-11. doi: 10.1038/ni.2006 [Crossref] [ Google Scholar]
- Huang RY, Francois A, McGray AR, Miliotto A, Odunsi K. Compensatory upregulation of PD-1, LAG-3, and CTLA-4 limits the efficacy of single-agent checkpoint blockade in metastatic ovarian cancer. Oncoimmunology 2017; 6:e1249561. doi: 10.1080/2162402X.2016.1249561 [Crossref] [ Google Scholar]
- Barber DL, Wherry EJ, Masopust D, Zhu B, Allison JP, Sharpe AH. Restoring function in exhausted CD8 T cells during chronic viral infection. Nature 2006; 439:682-7. doi: 10.1038/nature04444 [Crossref] [ Google Scholar]
- Chauvin JM, Pagliano O, Fourcade J, Sun Z, Wang H, Sander C. TIGIT and PD-1 impair tumor antigen-specific CD8⁺ T cells in melanoma patients. J Clin Invest 2015; 125:2046-58. doi: 10.1172/jci80445 [Crossref] [ Google Scholar]
- Diggs LP, Hsueh EC. Utility of PD-L1 immunohistochemistry assays for predicting PD-1/PD-L1 inhibitor response. Biomark Res 2017; 5:12. doi: 10.1186/s40364-017-0093-8 [Crossref] [ Google Scholar]
- Jin HT, Anderson AC, Tan WG, West EE, Ha SJ, Araki K. Cooperation of Tim-3 and PD-1 in CD8 T-cell exhaustion during chronic viral infection. Proc Natl Acad Sci U S A 2010; 107:14733-8. doi: 10.1073/pnas.1009731107 [Crossref] [ Google Scholar]
- Ma W, Gilligan BM, Yuan J, Li T. Current status and perspectives in translational biomarker research for PD-1/PD-L1 immune checkpoint blockade therapy. J Hematol Oncol 2016; 9:47. doi: 10.1186/s13045-016-0277-y [Crossref] [ Google Scholar]
- Sakuishi K, Apetoh L, Sullivan JM, Blazar BR, Kuchroo VK, Anderson AC. Targeting Tim-3 and PD-1 pathways to reverse T cell exhaustion and restore anti-tumor immunity. J Exp Med 2010; 207:2187-94. doi: 10.1084/jem.20100643 [Crossref] [ Google Scholar]
- Zarour HM. Reversing T-cell Dysfunction and Exhaustion in Cancer. Clin Cancer Res 2016; 22:1856-64. doi: 10.1158/1078-0432.Ccr-15-1849 [Crossref] [ Google Scholar]
- Zhu L, Kong Y, Zhang J, Claxton DF, Ehmann WC, Rybka WB. Blimp-1 impairs T cell function via upregulation of TIGIT and PD-1 in patients with acute myeloid leukemia. J Hematol Oncol 2017; 10:124. doi: 10.1186/s13045-017-0486-z [Crossref] [ Google Scholar]