Bioimpacts. 13(1):5-16.
doi: 10.34172/bi.2022.23592
Original Article
Multi spectroscopic and molecular simulation studies of propyl acridone binding to calf thymus DNA in the presence of electromagnetic force
Atena Sharifi-Rad 1  , Zeinab Amiri-Tehranizadeh 2, Atiye Talebi 1, Niknaz Nosrati 1, Morvarid Medalian 1, Mahtab Pejhan 1, Nazanin Hamzkanloo 1, Mohammad Reza Saberi 2, Parisa Mokaberi 1, Jamshidkhan Chamani 1, *
Author information:
1Department of Biology, Faculty of Sciences, Mashhad Branch, Islamic Azad University, Mashhad, Iran
2Department of Medicinal Chemistry, School of Pharmacy, Mashhad University of Medical Sciences, Mashhad, Iran
Abstract
Introduction:
Here, the interaction behavior between propyl acridones (PA) and calf thymus DNA (ct-DNA) has been investigated to attain the features of the binding behavior of PA with ct-DNA, which includes specific binding sites, modes, and constants. Furthermore, the effects of PA on the conformation of ct-DNA seem to be quite significant for comprehending the medicine’s mechanism of action and pharmacokinetics.
Methods: The project was accomplished through means of absorbance studies, fluorescence spectroscopy, circular dichroism, viscosity measurement, thermal melting, and molecular modeling techniques.
Results: The intercalation of PA has been suggested by fluorescence quenching and viscosity measurements results while the thermal melting and circular dichroism studies have confirmed the thermal stabilization and conformational changes that seem to be associated with the binding. The binding constants of ct-DNA-PA complex, in the absence and presence of EMF, have been evaluated to be 6.19 × 10⁴ M-1 and 2.95 × 10⁴ M-1 at 298 K, respectively. In the absence of EMF, the ∆H0 and ∆S0 values that occur in the interaction process of PA with ct-DNA have been measured to be -11.81 kJ.mol-1 and 51.01 J.mol-1K-1, while in the presence of EMF they were observed to be -23.34 kJ.mol-1 and 7.49 J.mol-1K-1, respectively. These numbers indicate the involvement of multiple non-covalent interactions in the binding procedure. In a parallel study, DNA-PA interactions have been monitored by molecular dynamics simulations; their results have demonstrated DNA stability with increasing concentrations of PA, as well as calculated bindings of theoretical ΔG0.
Conclusion: The complex formation between PA and ct-DNA has been investigated in the presence and absence of EMF through the multi spectroscopic techniques and MD simulation. These findings have been observed to be parallel to the results of KI and NaCl quenching studies, as well as the competitive displacement with EB and AO. According to thermodynamic parameters, electrostatic interactions stand as the main energy that binds PA to ct-DNA. Regarding the cases that involve the Tm of ct-DNA, EMF has proved to increase the stability of binding between PA and ct-DNA.
Keywords: ct-DNA, Propyl acridon, Spectroscopy, Intercalator, Molecular dynamics, Anti-cancer drug
Copyright and License Information
© 2023 The Author(s).
This work is published by BioImpacts as an open access article distributed under the terms of the Creative Commons Attribution Non-Commercial License (
http://creativecommons.org/licenses/by-nc/4.0/). Non-commercial uses of the work are permitted, provided the original work is properly cited.
Introduction
The progress in cancer drugs has been observed to be quite slow and high-priced. Repositioning drugs that have been approved for other anticancer agents can speed up the availability of new drugs. Propyl acridones are known as biotic active molecules, obtained from organic sources, which are regarded as essential components for health maintenance due to their wide therapeutic value. Propyl acridones are well known to contain anti-cancerous, anti-bacterial, and antihypertensive qualities, as well as several other biological activities.1 In the field of medicinal chemistry, organic materials attract much attention due to their molecular and unique spectral properties.1 Current literature has revealed that the organic architecture is capable of displaying a versatile utility, caused by the synthetic scaffolds, regarding the construction of molecular therapeutics2 to gene delivery vectors in the field of molecular biotechnology.3 Targeting DNA at the molecular level with specificity will not only resolve the assessments for new curative but also advance the development of highly sensitive diagnostic agents.3
DNA is a significant drug target, particularly in cancer treatment, since many compounds that damage or bind covalently and/or non-covalently to DNA are employed. Regarding anticancer therapy, the specific interactions of the molecule with the genomic DNA may be useful for preventing further data retrieval from DNA and thus, causing the arrest of cell division. DNA stands as the intracellular target for most anticancer, antibiotic, and antiviral drugs. Therefore, investigating the binding mechanisms of ligands and DNA take part in a vital role in comprehending the other clinical activities and rational designs of the new, DNA-aimed drugs.3,4
Multi-drug resistance (MDR) is known as an obstacle in cancer treatment. The attempt to search for new compounds in order to surpass this problem has ended up with discovering a class of natural alkaloids, which are acknowledged as acridones. Synthetic Alkyl acridones, such as propyl acridone, are modulators of P-glycoproteins (P-Gy) while containing an anticancer activity with satisfying cytotoxic performance against various cancerous cells. The MDR modulation of acridones occurs in interaction with P-Gy transporter receptors, while the anticancer activities are observed after a destructive interaction with host DNA.4
In this paper, the binding interaction between PA (its chemical structure is in the inset of Scheme 1) and ct-DNA has been studied by the means of UV-visible absorption, fluorescence, circular dichroism (CD), viscosity measurement, and molecular dynamics simulations to acquire the detailed information about the binding behavior of PA with ct-DNA, which includes specific binding site, modes, and constant. Furthermore, the effects of PA on the conformational state of ct-DNA with PA molecule seem to be quite significant to clarify the mechanisms of action and pharmacokinetics.
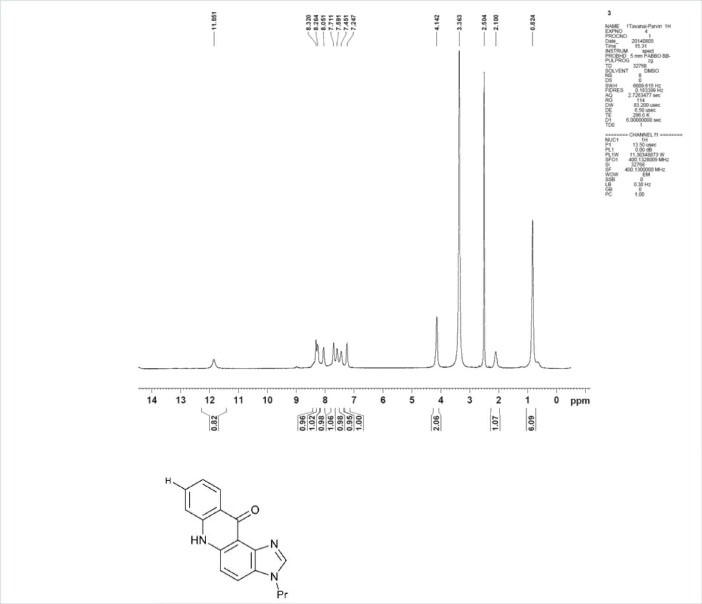
Scheme 1.
1H-NMR spectra of PA, inset; chemical structure of PA.
.
1H-NMR spectra of PA, inset; chemical structure of PA.
Materials and Methods
Apparatus
UV-Visible absorption spectra have been measured through a Jasco V-630 (Japan) spectrophotometer, which utilized a 1.0 cm quartz cell. Fluorescence measurements have been performed with a 150-W xenon lamp and a thermostatic bath, employing a 1.0 mm path length quartz cuvette, while the viscosity experiments have been obtained through the usage of an Ubbelohde viscometer (Shanghai, China). An electronic thermostatic water bath has been utilized to control the temperature. Unless otherwise specified, the entire experiment shave been performed at room temperature. The propyl acridone was synthesized in accordance with the Tanasescu reaction method and their chemical structures were determined by analyzing the spectra provided by 1H-NMR spectroscopy. A Varian NMR spectrometer (300 MHz) was applied in order to collect the NMR spectra.5
Type I ct- DNA (sodium content 6%) has been obtained from Sigma-Aldrich chemicals (USA). The purity of DNA has been acquired by calculating the ratio of ultra-violet absorbance, A260/A280. The ratio was observed to be 1.82, which indicates that the purity of DNA has been achieved.6 In order to prepare the desired aqueous solutions; deionized water (resistance 18.2Ω) from the Millipore water purification system has been applied. Other chemicals and reagents that have been utilized in this research were of analytical grade and utilized as they were provided.
Solutions
ct- DNA (1% w/v) was made ready in 10 mM Tris-HCl buffer (pH = 7.4) and retained at 8 C for the duration of 24 hours. To ensure the state of homogeneity in the ct-DNA solution, the solution was stirred frequently. The final concentration of the ct-DNA stock solution was measured spectrometrically by utilizing the ε = 6600 cm-1M-1, 7 which was observed to be 10 mM. The PA-ct-DNA complex solutions were performed at various concentrations of PA with a continual concentration of ct-DNA.
The UV-Visible studies were carried out through the usage of PA concentrations that ranged from 0 mM to 0.02 mM, along with 2.5 mM of ct-DNA concentration. ct-DNA solution (2.5 mM) was enhanced to a 1.0 cm quartz cuvette while being titrated through the consecutive addition of PA to obtain the final concentration of 5 × 10⁻³ mM. After leaving the solution aside for 5 min in order to equilibrate, the fluorescence spectra were put down at three different temperatures; 208 K, 303 K, and 308 K, while in the range of 410-510 nm, λex = 400 nm was observed. Both the excitation and emission slit widths were set at 5.0 nm. The appropriate blanks that corresponded to the Tris-HCl buffer solution were deduced to perform an acceptable condition for the fluorescence background.
All of the fluorescence intensities were corrected to absorb the exciting light and re-absorb the emitted light. The following equation has been utilized to correct the inner-filter effect8:
Where Fc and Fm were the corrected and observed fluorescence, respectively, while A1 and A2 were the reported absorbances of ct-DNA at λex and λem respectively.
Ligand and receptor optimization and docking
The structure of 8-chloro-3-propyl-3H-imidazo [4,5-a]acridin-11(6H)-one, which is acknowledged as propyl acridone (PA), has been built by ChemOffice, and energy minimized through semi-empirical methods by HyperChem software. The final structure was converted into mol format. Gasteiger charges were added through the utilization of Auto Dock Tools 59 and the final Auto Dock ligand format (pdbqt) was prepared.
The B-DNA receptor structure has been procured from Protein Data Bank (PDB ID = 1BNA). The receptor Gasteiger charges have been also calculated and the final rigid along with flexible receptor formats (pdbqt) have been prepared by AutoDock tools.
All of the docking procedures have been performed on the Windows platform by using Auto Dock 4 within the Auto Dock Tools. The search algorithm has been chosen to be Lamarckian GA2 and the number of genetic algorithm runs (GA runs) has been set directly in the file of each docking parameter. The grid box resolution has been set to 0.375 Å and the remaining parameters have been arranged on defaults.
The first docking was carried out when the grid box was set to be wrapped around the whole structure of the receptor (35 × 40 × 65) to confirm the propensity of the ligand binding sites. In this particular case, “the number of GA runs” was decided to be a hundred. For the second and optimized docking, the grid box was limited to the intercalated site that seemed to be the most probable for the binding procedure of the ligand.
To select the best-docked conformation for further molecular dynamics simulations, the binding energy, inhibitory constants, and intermolecular energies of the docking results have been considered and enquired into; then, the most suitable conformation with the minimum energy has been introduced and labeled for the mentioned purpose.
Molecular dynamics simulations
Molecular dynamics simulation has been carried out through the means of GROMACS-5.0 package10 and AmberSB11 Force field. The parameters of ligand have been taken from Generalized Amber Force-Field (GAFF) that was included in the Antechamber package on the ACPYPE web server.12 The server was capable of preparing ligand topology with AM1-BCC partial charges. The molecules were centered in a cubic box that contained explicit water (TIP3P water model) with a 1 nm distance from the edges of neighbor boxes. 22 Sodium molecules were replaced with water molecules to neutralize the system. The steepest descent minimization algorithm was used to relax the system and also remove any unwanted van der Waals that could overlap or bond deformations. As the next step, the system was equilibrated in 100 ps NVT and NPT simulations. To finish the process, the system was equilibrated in a 30 ns MD simulation.
Free binding energy (ΔG) was obtained by the usage of g_mmpbsa, which is known as a tool for implementing Molecular mechanics Poisson-Boltzmann surface area (MM-PBSA) and calculating the binding energies out of Gromacs trajectories.13 Graphics has been analyzed through the utilization of VMD molecular graphics.14
To perform a quantitative calculation for DNA stability, the RMSDs of the DNA and DNA-ligand complex simulations have been plotted. RMSD stands as the first criterion after MD simulation for estimating the conformational stability of the DNA during the whole simulation process. This factor indicates the averaged atomic distances of the molecules to the referenced structures.
In equation 2, M is the number of equivalent atoms and δi or would be the existing distance between atom i and reference structure after the fitting.15
Van der Waals interactions have been calculated by utilizing the g_energy standard tool of the GROMACS software. LJ potentials between DNA and PA have been achieved from equation 3,16 in which ԑ stands for the strength of the interaction, δ would be a length scale, and r defines the distance.
(3)
At the very least, ΔGbinding of PA and DNA was calculated through the equation 4-6.13 In theory, the binding Gibbs free energy of a DNA double-strand with a ligand in a solvent can be calculated by means of equation 4.
(4)
In this equation, the term (GDNA/PA) denotes the free energy of the DNA/PA complex, and the values for (GDNA) and (GPA) represent the free energy of DNA and PA alone in the solvent. The GDNA/PA or DNA or PA in the solvent can be estimated by the use of equation number 5.
(5)
In this equation, (EMM) is the molecular mechanics' potential energy, T and S indicate the temperature and entropy, respectively and TS demonstrates the role of entropy in the free energy in vacuum. The term ⟨Gsolvation⟩ is the free energy of solvation. The value for (EMM) can be assessed by equation number 6.
(6)
Where molecular mechanics potential energy (EMM) is the summation of Ebonded and Enonbonded. Non-bonded energies can be calculated from van der Waals (Evdw) and electrostatic energies (Eelec).
In this study, three scenarios for the assessment of the PA-ct DNA interaction were designed. In the first and second scenarios, the groove binding and intercalation sites were selected as the active sites and the interaction studies were evaluated by docking studies. The best-docked structures were introduced to the MD simulations to assess the stability of the interactions. In the third scenario, twenty PAs were positioned randomly around one template DNA in a box of water and ions and the random interaction studies were evaluated by MD simulation.
Results
Conformational changes of ct-DNA by propyl acridone (PA)
In the absence of ct-DNA, PA was observed to release a weak luminescence in Tris-HCl (pH = 7.4) buffer at 25°C, with a maximum emission at 426 nm, when it was excited at 400 nm. As the effect of ct-DNA on the fluorescence of PA is demonstrated in Fig. 1A, one can notice that the fluorescence emission bound of PA can be quenched if the concentration of ct-DNA is increased (over a range of 0-5 × 10⁻³ mM) and the PA is fixed with a concentration of 0.5 mM. The occurrence of changes in the emission intensity is major caused by the PA since it penetrates a hydrophobic environment inside the DNA. It can be deduced that the interaction between the ct-DNA and PA has occurred. Therefore, fluorescence quenching may be dynamic, like the result of a scattering collision between the ligand and the fluorophore over the lifetime of the excited state or arising from the formation of a non-fluorescent (fluorophore-quencher) base state complex.17 Dynamic and static quenching can be determined by their various dependency on temperature and the lifetime of the excited state. Being restricted by the spectrofluorometer, we failed to measure the lifetime of the excited state. The following simple method has been employed to find out the quenching type. In general, the dynamic quenching of emission has been analyzed in accordance with the Stern-Volmer equation18:
Where F0 and F stand for the fluorescence intensities of PA in the absence and presence of ct-DNA, Ksv is the Stern-Volmer constant, and [Q] would be the concentration of the quencher. The linear Stern-Volmer plots have been represented at three different temperatures (Fig. 1B.), while in the case of PA and ct-DNA, it has been indicated that the nature of the quenching would be either of its pure dynamic or static mode.18 The values of Ksv at three various temperatures have been recorded in Table 1. It has been discovered that the Ksv values can be reduced as the temperatures are enhanced, which signifies that the quenching was not following the dynamic type. Additionally, the order of magnitude regarding the kq at different temperatures have been computed to be 1012 Lmol-1s-1, which is supposedly more than the maximum diffusion collision quenching rate constant of biomolecules, 2.0 × 10¹⁰ Lmol-1s-1.19 These outcomes have verified that the type of quenching was static rather than being a dynamic quenching.
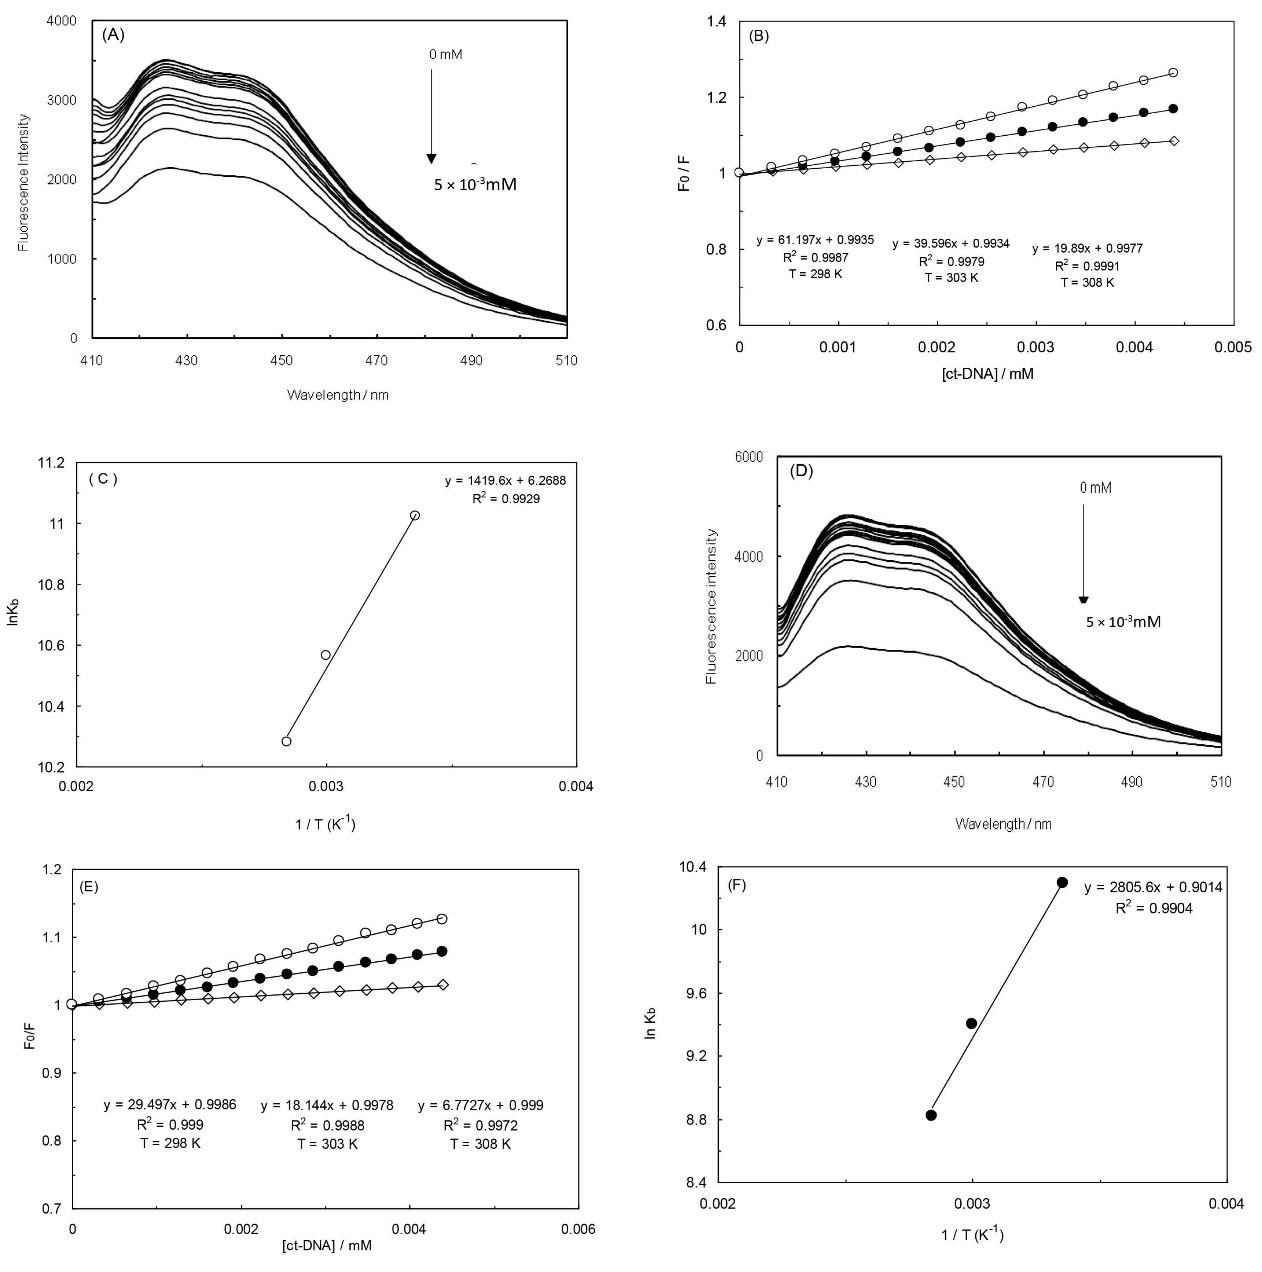
Fig. 1.
(A) Fluorescence emission of PA with increasing concentration of ct-DNA (0.5 × 10⁻³ mM). PA concentration is fixed (0.5 mM). The excitation wavelength is 400 nm in the absence of EMF (A), and the presence of EMF (D). The Stern-Volmer plots of PA quenching the fluorescence of ct-DNA in three temperatures: 298 K open circles; 303 K closed circles; and 308 K open diamonds, in the absence of EMF (B); and in the presence of EMF (E). Van’t Hoff plot for the interaction of ct-DNA with PA in the absence of EMF (C); and in the presence of EMF (F).
.
(A) Fluorescence emission of PA with increasing concentration of ct-DNA (0.5 × 10⁻³ mM). PA concentration is fixed (0.5 mM). The excitation wavelength is 400 nm in the absence of EMF (A), and the presence of EMF (D). The Stern-Volmer plots of PA quenching the fluorescence of ct-DNA in three temperatures: 298 K open circles; 303 K closed circles; and 308 K open diamonds, in the absence of EMF (B); and in the presence of EMF (E). Van’t Hoff plot for the interaction of ct-DNA with PA in the absence of EMF (C); and in the presence of EMF (F).
Table 1.
The values of Ksv observed in three different temperatures in the absence of EMF
|
T (K)
|
Ksv (M-1) |
| 298 |
(6.12 ± 0.04) × 104 |
| 303 |
(3.96 ± 0.04) × 104 |
| 308 |
(1.99 ± 0.04) × 104 |
When molecules are independently attached to the asset of identical sites which exist on a bio-macromolecule, the binding constant (Kb) and number of binding sites (n) can be represented through the following equation20:
(8)
Hence, Eq. 8 has been used to determine the Kb and n by employing a plot of log [(F0 – F) / F] versus log [D].
As a powerful and insightful approach, parsing the free energy into component terms can result in a detailed view of the interaction. The ∆H0, G0, and ∆S0 of the PA binding to ct-DNA can be obtained from the equation as below21:
Where Kb is the binding constant, T stands for the absolute temperature, and R would be the gas constant; in addition, the ∆H0, ∆G0, and ∆S0 values have been recorded in Table 2. The thermodynamic parameters values regarding the ct-DNA-PA complex formation have been achieved from the linear relationship between lnKb and the reciprocal absolute temperature, as it is displayed in Fig. 1C. The negative sign for ∆G0 indicates that the binding behavior had been spontaneous.
Table 2.
The values of ∆H0, ∆G0 and ∆S0 obtained in different temperatures in the absence of EMF
|
T (K)
|
∆G/kJ. mol-1 |
∆H/kJ. mol-1 |
∆S/J.mol-1K-1 |
| 298 |
-27.01 |
|
|
| 303 |
-27.27 |
-11.81 |
51.01 |
| 308 |
-27.52 |
|
|
The interaction of PA with ct-DNA in EMF (100 kHz) has been also examined through the usage of fluorescence titrations. Fig. 1D illustrates the fluorescence emission spectra of PA along with the effects of ct-DNA concentrations on the fluorescence emission spectra of PA at 100 kHz. The fluorescence emission was observed to gradually decreases the amount of ct-DNA increased, suggesting that the PA fluorescence has been efficiently quenched throughout the binding process to ct-DNA. Fig. 1E demonstrates the Stern-Volmer equation of ct-DNA-PA complex at 298 K, 303 K and 308 K at 100 kHz. Thermodynamic parameters have been obtained from Fig. 1F and also reported in Table 3.22
Table 3.
The values of ∆H0, ∆G0 and ∆S0 obtained in different temperatures in the presence of EMF
|
T (K)
|
∆G/kJ. mol-1 |
∆H/kJ. mol-1 |
∆S/J.mol-1K-1 |
| 298 |
-25.67 |
|
|
| 303 |
-25.61 |
-23.34 |
7.49 |
| 308 |
-25.65 |
|
|
Competitive binding of PA with ethidium bromide and acridine orange
In order to verify the binding way of PA on ct-DNA, a profitable binding experiment has been performed through the application of ethidium bromide (EB) and acridine orange (AO), which are capable of strongly binding to ct-DNA via an intercalator that is known as a classical fluorescent probe.23 By gradually adding the amount of PA, the fluorescence emission spectra of the fixed amount of ct-DNA and EB along with the AO in Tris-HCl buffer solution (pH = 7.4) have been detected. As the results of this experiment are illustrated in Figs. 2(A and B), it can be indicated that the fluorescence intensities of ct-DNA-EB and ct-DNA-AO solutions have decreased as the concentrations of PA have gradually increased. Meanwhile, there has not been any sign of a reaction from PA towards EB and AO that could have caused an alteration in their fluorescence intensity.
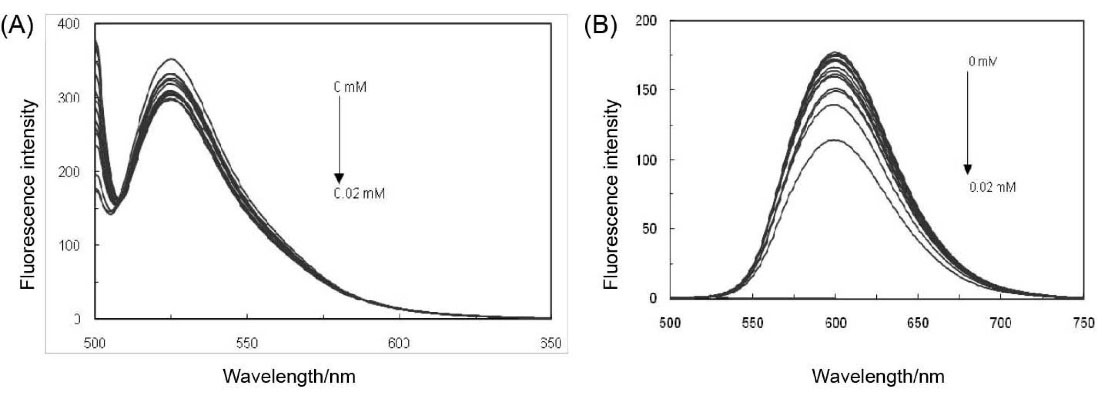
Fig. 2.
(A) Effect of PA in competition with AO at an excitation wavelength of 490 nm over ct-DNA. (B) Effect of PA in competition with EB at an excitation wavelength of 440 nm over ct-DNA.
.
(A) Effect of PA in competition with AO at an excitation wavelength of 490 nm over ct-DNA. (B) Effect of PA in competition with EB at an excitation wavelength of 440 nm over ct-DNA.
ct-DNA transition studies
The double-stranded DNA can be unfolded into a single strand through the heated transition point (Tm). The intercalation of small molecules into the double-stranded DNA is known as the cause of base stacking stabilization and the increase in the helix transition point.24 In the double-helical form, the DNA bases absorbance is set at 260 nm which seems to be much less than in the single-stranded form; hence, melting the helix can lead to hyperchromic effects in the absorption process. The DNA melting curves in the absence and presence of PA are shown in Fig. 3A. Although the Tm of ct-DNA was observed to be 57.7°C under the experimental conditions, it faced an increase to 60°C in the presence of PA. After a constant amount of PA was added to the ct-DNA solution, the Tm of the complex was evidently raised. Therefore, the mentioned results have obviously supported the intercalation of PA into the double-helical DNA.
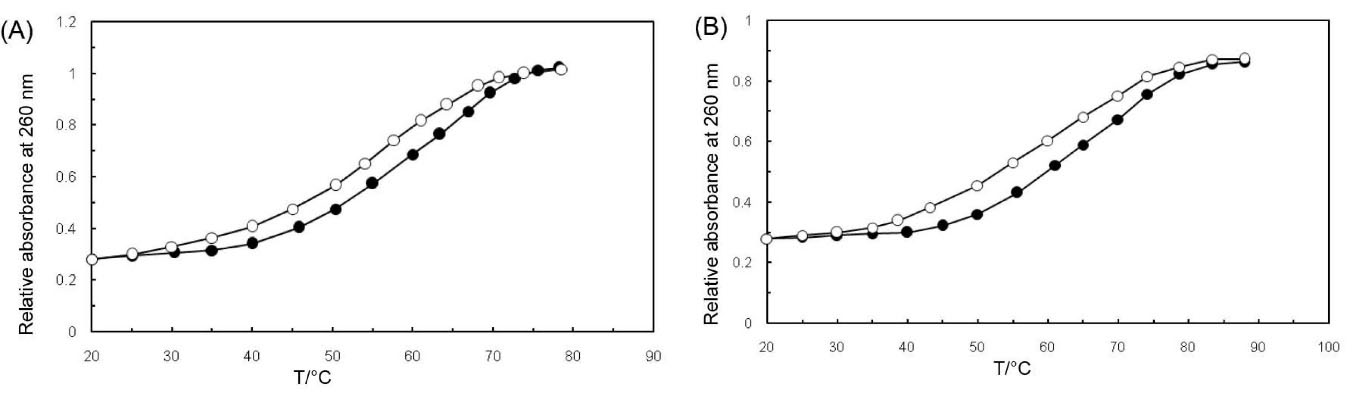
Fig. 3.
(A) Melting point of pure ct-DNA (open circle) and ct-DNA conjugate (closed circle). The Tm of ct-DNA was 57.7°C and it was increased to 60 °C in the presence of PA. (B) The melting point of pure ct-DNA (open circle) and ct-DNA conjugate (closed circle) in the presence of 100 kHz. The Tm of ct-DNA was 60 °C and it was increased to 65°C in the presence of PA.
.
(A) Melting point of pure ct-DNA (open circle) and ct-DNA conjugate (closed circle). The Tm of ct-DNA was 57.7°C and it was increased to 60 °C in the presence of PA. (B) The melting point of pure ct-DNA (open circle) and ct-DNA conjugate (closed circle) in the presence of 100 kHz. The Tm of ct-DNA was 60 °C and it was increased to 65°C in the presence of PA.
Fig. 3B demonstrates the pure ct-DNA and ct-DNA conjugate under the electromagnetic force of 100 kHz. As one can perceive, the value of Tm for ct-DNA in the absence of PA is 60°C, while the melting temperature of ct-DNA in the presence of PA is observed at about 65°C. In accordance with the outcomes, the binding mode of ct-DNA with PA and in the presence of 100 kHz has been intercalative, which seemed to be presumably an intercalator binding mode. When the existing Tm in Fig. 3A and Fig. 3B are compared, it can be indicated that the ct-DNA-PA complex formation is by far more stable in the presence of 100 kHz.
Viscosity evaluations
The viscosity of ct-DNA can be influenced by the induced alterations in its length. A classical intercalation binding can cause an increase in the DNA viscosity, since lengthening its helix can widen the space of the adjacent base pair to accommodate the binding ligands.25 In the cases of electrostatic or groove binding occurrences through the binding process, one can notice few changes in the viscosity of DNA.25 In the present study, the relative viscosities (η/η0)1/3 of ct-DNA have been plotted versus the binding ratio r (r = [PA] / [ct-DNA]). As it is illustrated in Fig. 4, the achieved outcomes have suggested that there are obvious changes in the relative viscosity of ct-DNA-PA, in the presence and absence of 100 kHz. In this case, the relative specific viscosity of ct-DNA-PA has increased in the absence and presence of 100 kHz which is comparable to the classical intercalator.26

Fig. 4.
The relative viscosities (η/0)1/3 of ct-DNA were plotted versus binding ratio r (r = [PA] / [ct-DNA]) in the absence of EMF (Õ) and in the presence of EMF (—). The viscosity of ct-DNA solution increased after the addition of PA in the presence and absence of 100 kHz.
.
The relative viscosities (η/0)1/3 of ct-DNA were plotted versus binding ratio r (r = [PA] / [ct-DNA]) in the absence of EMF (Õ) and in the presence of EMF (—). The viscosity of ct-DNA solution increased after the addition of PA in the presence and absence of 100 kHz.
The ionic strength affect the absorbance values
In the present work, to control the ionic strength of the solutions, NaCl and KI have been applied. In general, when a molecule is intercalated into the adjacent base pairs of ct-DNA, the absorbance does not appear to be sensitive to the circumambient change27 for electrostatic binding mode and thus, Na+ and K+ ions incline to bind with the phosphate groups of ct-DNA, which results in weakening the binding process of a small molecule with ct-DNA. Accordingly, regarding the groove binding mode, when the enhancement of NaCl and KI concentrations are impended, the minor groove of DNA becomes narrower and deeper, while the double-stranded DNA converges continuing; this effect has proved to be useful for the interaction between the small molecule and DNA and as an outcome, the absorbance would be increased.28 As it is taken from Fig. 5(A, B) the absorbance of ct-DNA has changed while the absorbance of ct-DNA-PA has faced an increase when the concentrations of NaCl and KI ranged from 0 to 0.4 mol.L-1 and 4 × 10³ mol.L-1, respectively. It can be suggested that the ionic strength is quite irrelevant to ct-DNA and the change in absorbance of ct-DNA-PA, which is induced by the enhancement of ionic strength, has been definitely associated with PA. The achieved results have proved that PA has bounded to ct-DNA in an intercalated binding mode.
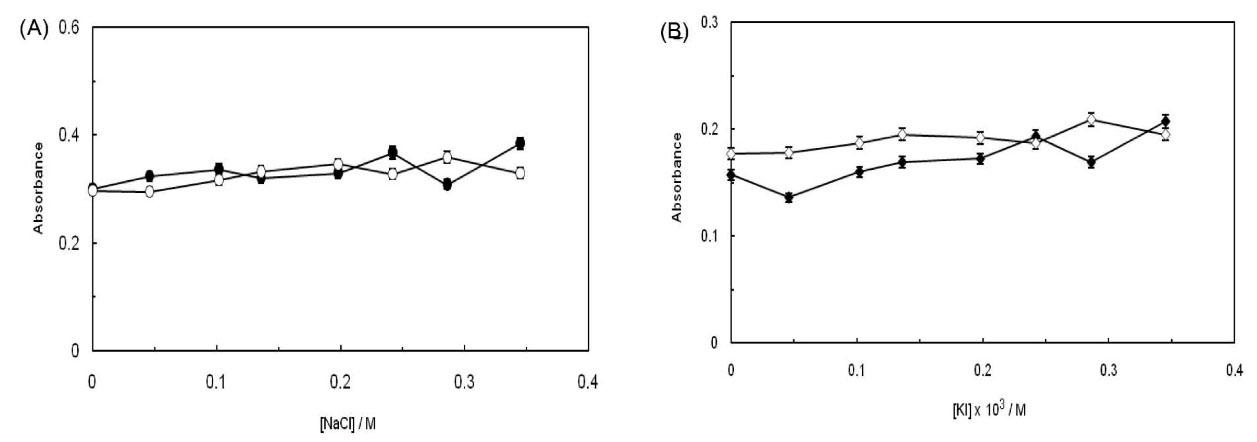
Fig. 5.
(A) Effect of NaCl ionic strength on ct-DNA absorbance in the absence (open circle) and presence (closed circle) of EMF. (B) Effect of KI ionic strength on ct-DNA absorbance in the absence (open diamond) and presence (closed diamond) of EMF.
.
(A) Effect of NaCl ionic strength on ct-DNA absorbance in the absence (open circle) and presence (closed circle) of EMF. (B) Effect of KI ionic strength on ct-DNA absorbance in the absence (open diamond) and presence (closed diamond) of EMF.
Circular dichroism spectral studies
Circular dichroism (CD) spectra are accurately sensitive to the way of DNA interacts with small molecules.29 In the absence and presence of PA, Fig. 6A demonstrates the CD spectra of ct-DNA in Tris-HCl buffer solution. It can be shown that there are two major characteristic peaks in the range of 200 to 350 nm regarding the free ct-DNA solution, which includes one negative peak at 244 nm and one positive peak at 275 nm, respectively. These particular bands are compatible with the CD spectrum of double-stranded helix DNA that belongs to the B conformation.30 While, the negative peak at 244 nm is related to the helical geometry of B-DNA, the positive peak at 275 nm is allocated to the stacking forces of DNA bases. The negative band at 244 nm is decreased to zero level in intensity, whereas in the case of the positive band at 275 nm, it has faced an increase. Decreasing the positive DNA dichroic peak is probably due to a transition from the extended nucleic acid double-stranded helix regard to a more denatured state.31 These changes are associated with the helix unwinding31 and can be connected to the interactive actions of the PA. This spectrum absorption has resulted from π-π* transitions, which can be quite sensitive to the increased positive base pair of DNA. In addition, the increased intensity of the band at 275 nm has recommended that changes in orientation of ct-DNA base pairs have taken placed.32 According to Fig. 6B, the CD spectra of ct-DNA in the EMF and at 100 kHz along with a separate change in the spectral band, which seem to be associated with the B-DNA conformation. It should be also noted in regards to the negative band, that the remarkable reductions in molar ellipticity are related to destabilization and helix unwinding.33
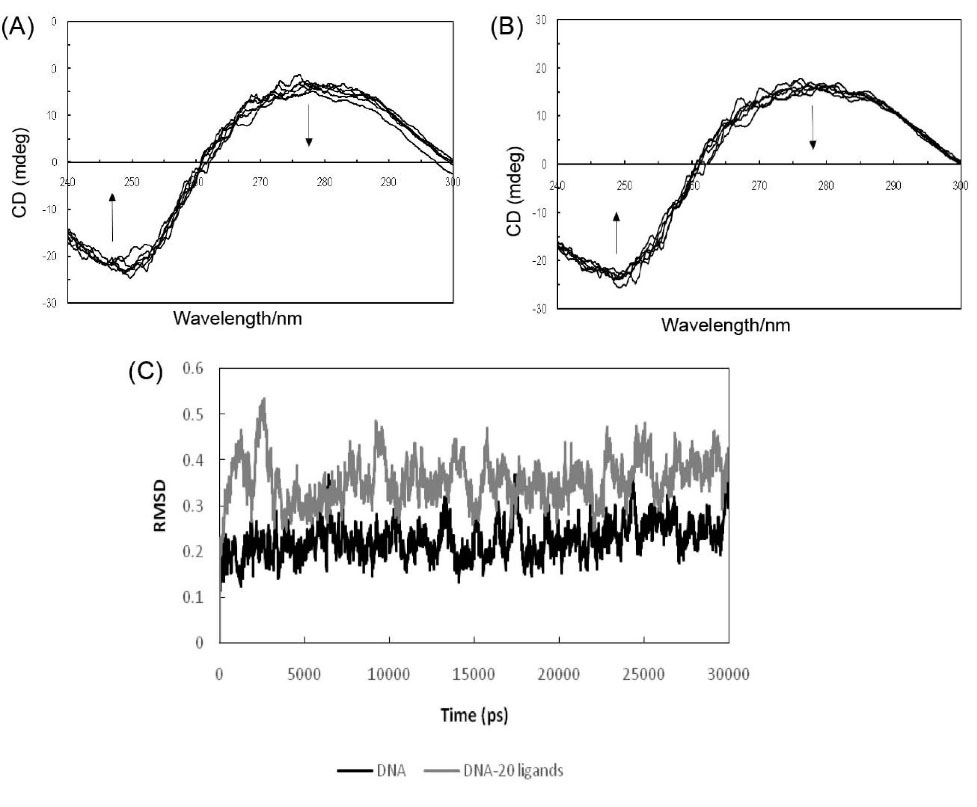
Fig. 6.
(A) CD spectra of ct-DNA in Tris-HCl buffer solution with an increasing concentration of PA in the absence of EMF and (B) in the presence of EMF.(C) RMSD of DNA alone (black line) and DNA-ligand complex (grey line) from referenced structures in 30 ns simulation.
.
(A) CD spectra of ct-DNA in Tris-HCl buffer solution with an increasing concentration of PA in the absence of EMF and (B) in the presence of EMF.(C) RMSD of DNA alone (black line) and DNA-ligand complex (grey line) from referenced structures in 30 ns simulation.
Fig. 6C shows the elevating RMSD of DNA, which is the outcome of the increasing concentrations of ligand. The averaged RMSD has taken an increase of around 0.2 points in the presence of 20 ligands, indicating that PA can cause a distortion in the B-form structure of DNA. When intercalating agents enter the intercalation site, helical unwinding or denaturation occurs; this fact can be clearly perceived in the RMSD plot.
Resonance light scattering (RLS) technique
RLS is known as a method of measuring the formation of complex and providing valuable information about this topic. The RLS spectra of ct-DNA in complex, with increasing concentrations of PA in the presence and absence of EMF, have been plotted in Fig. 7. As the molecular numbers of small molecules were supplemented, the scattering seemed to be altered and the intensity of RLS elevated, which signifies the interaction of PA with ct-DNA. It is also concluded that the interaction between ct-DNA and PA has occurred. As it can be observed, the RLS values differed in the presence and absence of EMF, intimating that the structural changes of the binding modes had been affected.
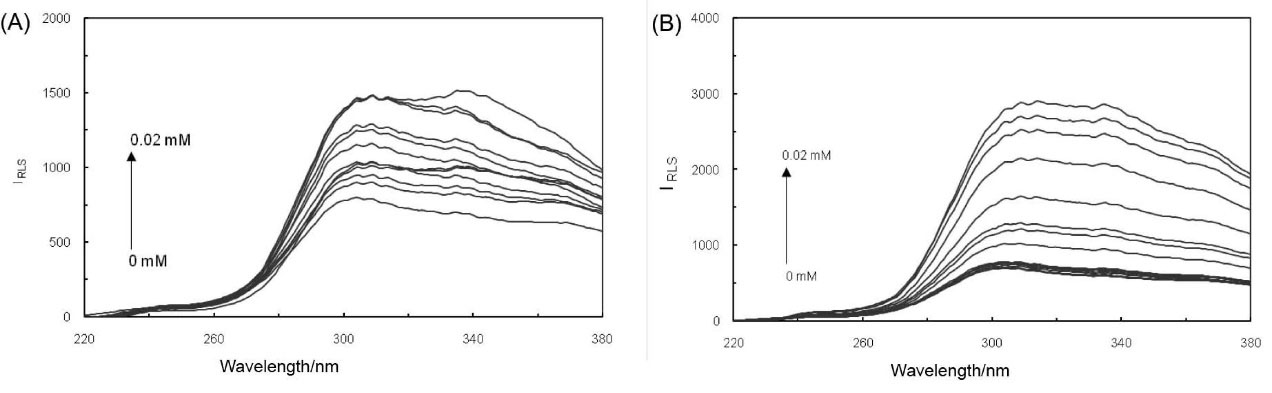
Fig. 7.
(A) RLS spectra of ct-DNA and PA complex in the absence of EMF and (B) in the presence of EMF.
.
(A) RLS spectra of ct-DNA and PA complex in the absence of EMF and (B) in the presence of EMF.
Comparison of the native and denatured ct-DNA upon interaction with PA in the absence and presence of EMF
The behavior binding of native (ds, ct-DNA) and denatured (ss, ct-DNA) ct-DNA with PA has been plotted in Fig. 8. In accordance with the performed assessments, the fluorescent quenching of ss, ct-DNA seemed to be less than ds, ct-DNA. This discovery has suggested an intercalation mechanism for the binding behavior of PA to ct-DNA. In the absence of EMF, Ksv has been evaluated to be 2.65 × 10³ M-1 and 2.28 × 10³ M-1 for ds, ct-DNA, and ss, ct-DNA, while in the presence of 100 kHz EMF, Ksv has been measured to be 3.05 × 10³ M-1 and 2.29 × 10³ M-1 regarding ds, ct-DNA, and ss, ct-DNA respectively; these obtained numbers indicate a higher binding affinity in the presence of EMF. Accordingly, we have concluded a different behavior in the formation of a complex in the presence of EMF.
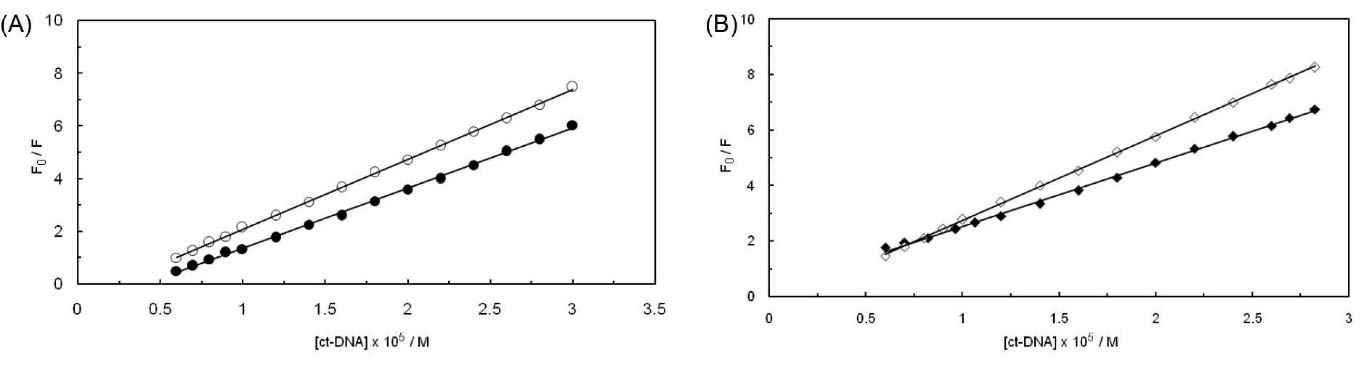
Fig. 8.
(A) Stern-Volmer plots of PA by ss,ct-DNA (closed circle)and ds,ct-DNA (open circle)in the absence of 100 kHz EMF.(B) Stern-Volmer plots of PA by ss,ct-DNA (closed diamond) and ds,ct-DNA (open diamond) in the presence of 100 kHz EMF.
.
(A) Stern-Volmer plots of PA by ss,ct-DNA (closed circle)and ds,ct-DNA (open circle)in the absence of 100 kHz EMF.(B) Stern-Volmer plots of PA by ss,ct-DNA (closed diamond) and ds,ct-DNA (open diamond) in the presence of 100 kHz EMF.
Docking and molecular simulations
We carried out the docking procedure for the case of PA with a wide grid box that had been set to be wrapped around the whole DNA macromolecule for the purpose of discovering the best active site. Most of the ligand conformations have been noticed around the intercalating sites and a few results have displayed the minor groove as an active site. After detecting the most probable binding site, the grid box was limited to the intercalation site of the DNA while docking energies were being calculated. The docking results have been summarized and illustrated in Table 4.
Table 4.
Energies calculated out of the docking results of PA in the active site
|
PA molecule
|
Inhibitory constant
|
Binding energy
|
Intermol energy
|
Electrostatic energy
|
Total energy
|
| Intercalation site |
2.89 µM |
-7.56 kcal mol-1 |
-8.3 kcal mol-1 |
-0.27 kcal mol-1 |
-0.17 kcal mol-1 |
The outcomes of the dockings in both active sites (intercalation and groove binding) were introduced to the molecular dynamics simulations to determine the stability of PA in each of the active sites. Fig. 9 demonstrates the snapshots of DNA-PA complex during the simulations. A looser interaction was perceived when the PA was arranged in the groove binding site. As a circumstance, PA gradually dissociated from the groove binding site and moved towards the surrounding area. Although throughout the rest of the simulation, PA was positioned at the end of the DNA double-strand molecule and interacted with the terminal nucleotides, yet when the ligand was docked to the intercalation site, it remained in the same spot throughout the whole duration of the process. As it can be perceived from the 2D view of the ligand in the ctDNA intercalation site, four arene-arene interactions and one hydrogen-arene interaction strengthened the interactions. Thus, because of the potent π-π interactions, the ligand remained constant in the intercalation site during the whole time of the simulation.
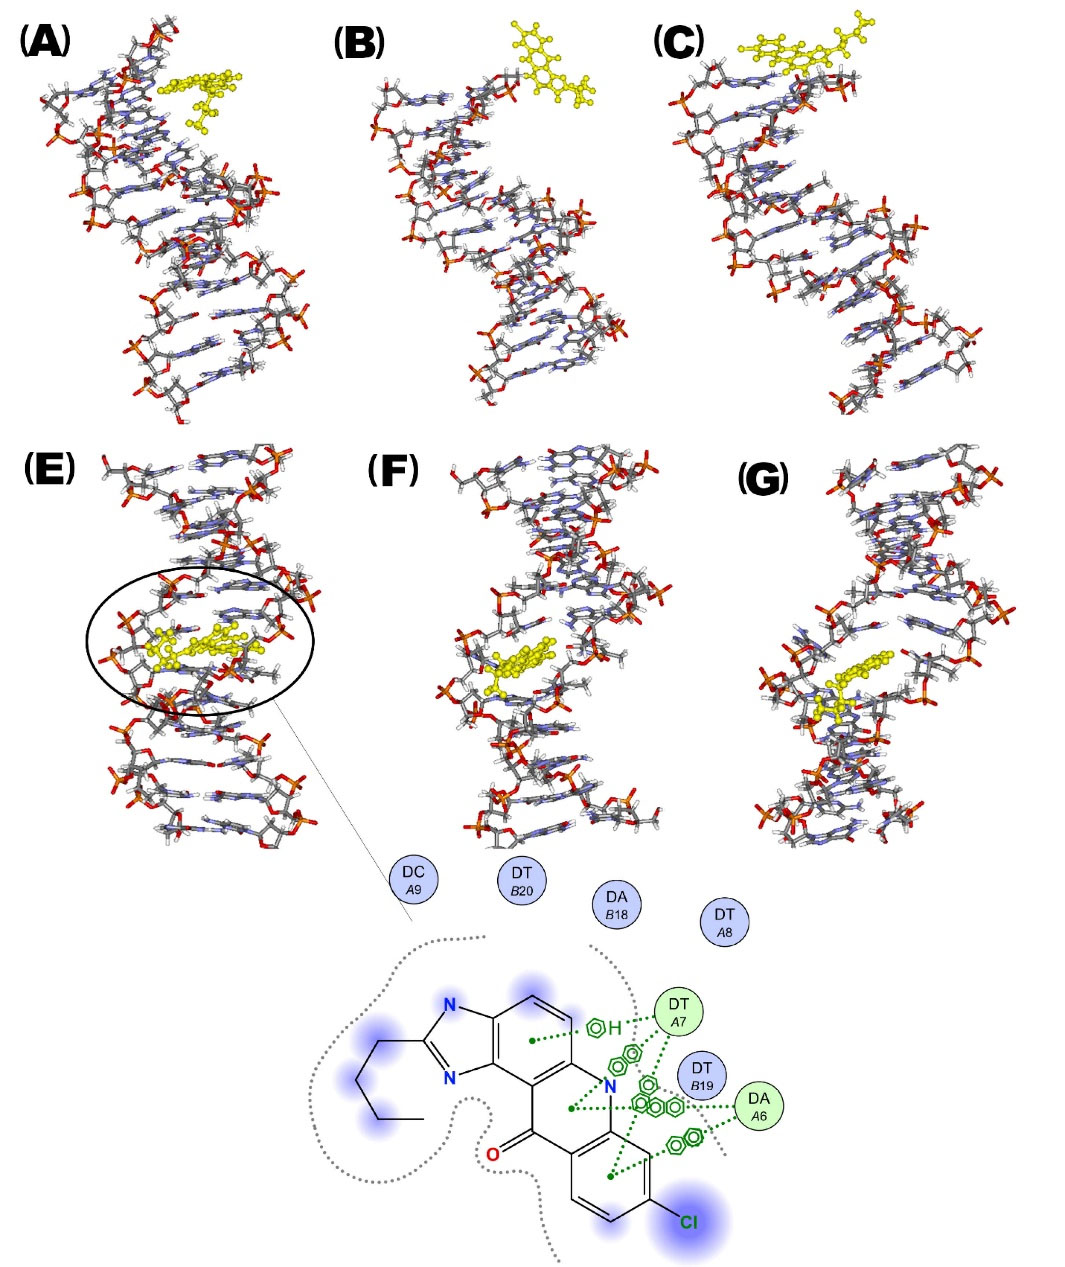
Fig. 9.
(A) Snapshots of simulations of DNA-PA interaction when PA positioned in the groove binding site at the beginning of simulation, (B) after 5 ns simulation, (C) in the final nanosecond of simulation.(E) Snapshots of simulations of DNA-PA interaction when PA positioned in the intercalation site at the beginning of simulation with a 2D view of the interaction between ligand and intercalation site nucleotides (nucleotides are shown as circles, bonds are shown in dashed green lines and exposed atoms were highlighted in blue), (F) after 5 ns simulation, (G) in the final second of simulation.
.
(A) Snapshots of simulations of DNA-PA interaction when PA positioned in the groove binding site at the beginning of simulation, (B) after 5 ns simulation, (C) in the final nanosecond of simulation.(E) Snapshots of simulations of DNA-PA interaction when PA positioned in the intercalation site at the beginning of simulation with a 2D view of the interaction between ligand and intercalation site nucleotides (nucleotides are shown as circles, bonds are shown in dashed green lines and exposed atoms were highlighted in blue), (F) after 5 ns simulation, (G) in the final second of simulation.
In Fig. 10, the values of LJ potentials of the DNA-PA interactions have been plotted in the last five seconds of the simulation. When PA was positioned in the intercalation site, a consistent LJ value of potentials was clearly noticed (average of -173.26 kJ/mol), signifying that PA had a stable interaction and a minimum distance with the DNA nucleotides. However, next to observing no consistent interaction, even in some periods the LJ potentials seemed to be around zero (ԑ =rij) when PA was located in the groove binding site; this fact indicates that no potent interaction between DNA and PA had existed. All of the available information proves the existence of an intercalator mechanism for the interaction between PA and DNA.
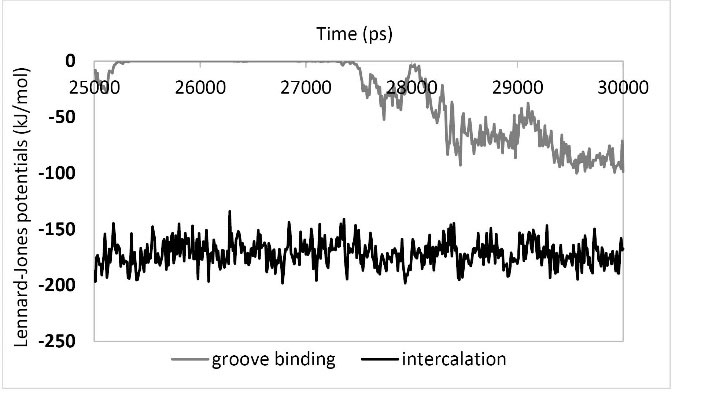
Fig. 10.
LJ potential between DNA and ligand in the last 5 ns of simulations. LJ potential between DNA ligand when the ligand located in the intercalation site (black line) and the ligand located in the groove binding site (grey line).
.
LJ potential between DNA and ligand in the last 5 ns of simulations. LJ potential between DNA ligand when the ligand located in the intercalation site (black line) and the ligand located in the groove binding site (grey line).
Theoretical ΔGbinding regarding the PA-DNA interaction in water solution has been calculated to be -115.3 kJ/mol, where Evdw and Eelec have been measured to be -173.26 kJ/mol and -18.4 kJ/mol, respectively.
Discussion
Our results in fluorescence quenching data determined that the interaction between ct-DNA and PA has occurred. Besides, the curves have been linear which demonstrates that a unique type of quenching, either static or dynamic, has happened. According to the Ksv values which have decreased as the temperatures are increased; it is suggested that the quenching was following the static type. The data given by thermodynamic parameters from Table 2 represents that ∆H0< 0 and ∆S0> 0, which signifies that the electrostatic force plays the role of the vital interaction force in the binding procedure of PA and DNA in the absence of EMF. The values of ∆G0< 0 reveal that the interaction process has been spontaneous. The values of ∆H0 and ∆S0 at 100 kHz were perceived to be -23.34 kJ.mol-1 and 7.49 J.mol-1.K-1 respectively, which suggest that electrostatic interactions contain a vital functionality in the binding procedure of PA to ct-DNA and also contribute to the stability of the complex. Based on the competitive experimental results, it is deduced that there exists a competitive binding between EB and AO and PA to ct-DNA; hence, it can be stated that PA binds to ct-DNA as an intercalator. Thermal denaturation of ct-DNA and ct-DNA-PA complex in the absence and presence of EMF determined the stability of the ct-DNA-PA complex was more than standalone ct-DNA which showed PA had an intercalator role upon interaction with ct-DNA in the absence and presence of EMF. The relative viscosity measurements revealed the enhancement of the relative viscosity of ct-DNA upon interaction with PA in the absence and presence of 100 kHz electromagnetic force and PA played an intercalator role in complex formation with ct-DNA as well. The effect of ionic force on the ct-DNA-PA complex also showed an increase in adsorption, which confirms the intercalation of PA in the formation of the ct-DNA-PA complex. Furthermore, the circular dichroism results of the binding between ct-DNA and PA in the absence and presence of EMF revealed the enhancement of ct-DNA ellipticity with increasing PA concentration. Also, the increasing of ct-DNA ellipticity values upon interaction with PA showed a decrease in the ct-DNA helix and confirmed the intercalator role of PA in ct-DNA-PA complex formation in the absence and presence of EMF. The RLS results from ct-DNA-PA complex formation showed an increase in RLS intensity of ct-DNA upon interaction with PA which confirmed the complex formation and interaction conduct between ct-DNA and PA in the absence and presence of EMF. According to the acquired data, RLS intensity values for the ct-DNA-PA complex in the presence of EMF were more than those obtained in the absence of EMF which showed the more binding affinity of PA to ct-DNA in the presence of EMF. The obtained results from the interaction between PA with double-strand ct-DNA and single-strand ct-DNA determined that the binding affinity of PA to double-strand ct-DNA was more than its affinity to single-strand ct-DNA. The Ksv values of the interaction between PA with two forms of ct-DNA determined that PA interacted with ct-DNA as an intercalator. Additionally, the molecular modeling validated the experimental data.
Conclusion
In this context, the interaction behavior between PA and ct-DNA has been investigated in the presence and absence of EMF through the employment of RLS, fluorescence spectroscopy, CD spectroscopy, and viscometry. Molecular docking and molecular dynamics simulations have facilitated a detailed structural mechanism for the purpose of binding. These findings have been observed to be parallel to the results of KI and NaCl quenching studies, as well as the competitive displacement with EB and AO. Thermodynamic parameters, such as ΔG0 and ΔS0, have suggested that electrostatic interactions stand as the main energy contributors of PA to the ct-DNA binding. Regarding the cases that involve the Tm of ct-DNA, EMF has proved to cause a more stable binding between PA and ct-DNA.
Research Highlights
What is the current knowledge?
√ Propyl acridones (PA) are recognized as anti-cancerous, antimicrobial, and antihypertensive quality as well as biological activities.
What is new here?
√ The effects of (PA) on ct-DNA conformation seem to be considered in helping to elucidate the mechanisms of action and pharmacokinetics.
Acknowledgments
The authors would like to thank the Mashhad Branch, Islamic Azad University, and Mashhad University of Medical Sciences for the facilities and financial support. The authors thank Dr. Ljungburg for the English editing.
Funding sources
The financial support of the Research Council of the Mashhad Branch, Islamic Azad University, and Mashhad University of Medical Sciences is gratefully acknowledged.
Ethical statement
There is none to be disclosed.
Competing interests
The authors declare that there is no conflict of interest.
Authors’ contributions
ASR, MRS, and JC designed the research study. ASR, NN, AT, MM, NH, PM and ZAT performed the research and collected the data. MP and JC analyzed the data. ASR, PM and ZAT wrote the initial draft of the manuscript. MRS and JC revised the manuscript. All authors discussed the results and contributed to the final manuscript.
References
- Lehmann WJ. Lehmann WJApplications of spectroscopy to organic chemistry (Brand, J.C.D.; Eglinton, G.). J Chem Educ 1967; 44:A552. doi: 10.1021/ed044pA552.2 [Crossref] [ Google Scholar]
- Alwan WS, Mahajan AA, Rane RA, Amritkar AA, Naphade SS, Yerigiri MC. Acridone-based antitumor agents: a mini-review. Anticancer Agents Med Chem 2015; 15:1012-25. [ Google Scholar]
- Reiche MA, Warner DF, Mizrahi V. Targeting DNA Replication and Repair for the Development of Novel Therapeutics against Tuberculosis. Front Mol Biosci 2017. 4: 75. 10.3389/fmolb.2017.00075.
- Krishnegowda G, Thimmaiah P, Hegde R, Dass C, Houghton PJ, Thimmaiah KN. Synthesis and chemical characterization of 2-methoxy-N(10)-substituted acridones needed to reverse vinblastine resistance in multidrug resistant (MDR) cancer cells. Bioorg Med Chem 2002; 10:2367-80. [ Google Scholar]
- Askari A, Entezari AA, Pordel M, Beigoli S, Yazdi ZN, Moghaddam AJ, Chamani J. Design, synthesis and investigation of the interaction behavior between two acridone derivatives, 8-chloro acridone and nitrile cyanide acridone with calf thymus DNA, by different spectroscopic techniques. J Iran Chem Soc 2020; 17:135-49. doi: 10.1007/s13738-019-01757-5 [Crossref] [ Google Scholar]
- Deng M, Jiang C, Jia L. N-methylimidazolium modified magnetic particles as adsorbents for solid phase extraction of genomic deoxyribonucleic acid from genetically modified soybeans. Anal Chim Acta 2013; 771:31-6. doi: 10.1016/j.aca.2013.02.005 [Crossref] [ Google Scholar]
- Zhang G, Fu P, Wang L, Hu M. Molecular Spectroscopic Studies of Farrerol Interaction with Calf Thymus DNA. J Agric Food Chem 2011; 59:8944-52. doi: 10.1021/jf2019006 [Crossref] [ Google Scholar]
- Fonin AV, Sulatskaya AI, Kuznetsova IM, Turoverov KK. Fluorescence of Dyes in Solutions with High Absorbance. Inner Filter Effect Correction. PLoS One 2014; 9:e103878. doi: 10.1371/journal.pone.0103878 [Crossref] [ Google Scholar]
- Morris GM, Huey R, Lindstrom W, Sanner MF, Belew RK, Goodsell DS. AutoDock4 and AutoDockTools4: Automated docking with selective receptor flexibility. J Comput Chem 2009; 30:2785-91. doi: 10.1002/jcc.21256 [Crossref] [ Google Scholar]
- Berendsen HJC, van der Spoel D, van Drunen R. GROMACS: A message-passing parallel molecular dynamics implementation. Comput Phys Commun 1995; 91:43-56. doi: 10.1016/0010-4655(95)00042-E [Crossref] [ Google Scholar]
- Cornell WD, Cieplak P, Bayly CI, Gould IR, Merz KM, Ferguson DM. A Second Generation Force Field for the Simulation of Proteins, Nucleic Acids, and Organic Molecules. J Am Chem Soc 1995; 117:5179-97. doi: 10.1021/ja00124a002 [Crossref] [ Google Scholar]
- Sousa da Silva AW, Vranken WF. ACPYPE - AnteChamber PYthon Parser interfacE. BMC Res Notes 2012; 5:367. doi: 10.1186/1756-0500-5-367 [Crossref] [ Google Scholar]
- Kumari R, Kumar R, Open Source Drug Discovery C, Lynn A. g_mmpbsa--a GROMACS tool for high-throughput MM-PBSA calculations. J Chem Inf Model 2014; 54:1951-62. doi: 10.1021/ci500020m [Crossref] [ Google Scholar]
- Humphrey W, Dalke A, Schulten K. VMD: visual molecular dynamics. J Mol Graph 1996; 14:33-8. doi: 10.1016/0263-7855(96)00018-5 [Crossref] [ Google Scholar]
- Coutsias EA, Seok C, Dill KA. Using quaternions to calculate RMSD. J Comput Chem 2004; 25:1849-57. doi: 10.1002/jcc.20110 [Crossref] [ Google Scholar]
- J. E. Jones DS. On the determination of molecular fields. —II. From the equation of state of a gas. Proc R Soc Lond A Math Phys Sci 1924; 106: 463. 10.1098/rspa.1924.0082.
- Perez-Gonzalez C, Lafontaine DA, Penedo JC. Fluorescence-based strategies to investigate the structure and dynamics of aptamer-ligand complexes. Front Chem 2016; 4:33. doi: 10.3389/fchem.2016.00033 [Crossref] [ Google Scholar]
- Wahba MEK, El-Enany N, Belal F. Application of the Stern-Volmer equation for studying the spectrofluorimetric quenching reaction of eosin with clindamycin hydrochloride in its pure form and pharmaceutical preparations. Anal Methods 2015; 7:10445-51. doi: 10.1039/C3AY42093K [Crossref] [ Google Scholar]
- Doppagne B, Neuman T, Soria-Martinez R, Parra Lopez L, Bulou H, Romeo M, et al. Single-molecule tautomerization tracking through space- and time-resolved fluorescence spectroscopy. Nat Nanotechnol 2020; 15; 207–211. 10.1038/s41565-019-0620-x.
- Lissi E, Calderón C, Campos A. Evaluation of the Number of Binding Sites in Proteins from their Intrinsic Fluorescence: Limitations and Pitfalls. Photochem Photobiol 2013; 89:1413-6. doi: 10.1111/php.12112 [Crossref] [ Google Scholar]
- V. Anbazhagan, R. Renganathan,Anbazhagan V, Renganathan R. Study on the binding of 2, 3-diazabicyclo [2.2. 2] oct-2-ene with bovine serum albumin by fluorescence spectroscopy. J Lumin 2008; 128: 1454-8. 10.1016/j.jlumin.2008.02.004.
- Chu W-T, Clarke J, Shammas SL, Wang J. Role of non-native electrostatic interactions in the coupled folding and binding of PUMA with Mcl-1. PLoS Comput Biol 2017; 13:e1005468. doi: 10.1371/journal.pcbi.1005468 [Crossref] [ Google Scholar]
- Persil O, Hud NV. Harnessing DNA intercalation. Trends Biotechnol 2007; 25:433-6. doi: 10.1016/j.tibtech.2007.08.003 [Crossref] [ Google Scholar]
- Biswas S, Samui S, Chakraborty A, Biswas S, De D, Ghosh U. Insight into the binding of a non-toxic, self-assembling aromatic tripeptide with ct-DNA: Spectroscopic and viscositic studies. Biochem Biophys Rep 2017; 11:112-8. doi: 10.1016/j.bbrep.2017.07.001 [Crossref] [ Google Scholar]
- Ma L, Wang J, Zhang Y. Probing the Characterization of the Interaction of Aflatoxins B1 and G1 with Calf Thymus DNA In Vitro. Toxins (Basel) 2017; 9:209. doi: 10.3390/toxins9070209 [Crossref] [ Google Scholar]
- Li Y, Yang Z, Zhou M, Li Y, He J, Wang X. Ni(ii) and Co(ii) complexes of an asymmetrical aroylhydrazone: synthesis, molecular structures, DNA binding, protein interaction, radical scavenging and cytotoxic activity. RSC Adv 2017; 7:41527-39. doi: 10.1039/C7RA05504H [Crossref] [ Google Scholar]
- Biver T, De Biasi A, Secco F, Venturini M, Yarmoluk S. Cyanine dyes as intercalating agents: kinetic and thermodynamic studies on the DNA/Cyan40 and DNA/CCyan2 systems. Biophys J 2005; 89:374-83. doi: 10.1529/biophysj.105.059790 [Crossref] [ Google Scholar]
- Jalali F, Dorraji PS. Interaction of anthelmintic drug (thiabendazole) with DNA: Spectroscopic and molecular modeling studies. Arabian Journal of Chemistry 2017; 10:S3947-S54. doi: 10.1016/j.arabjc.2014.06.001 [Crossref] [ Google Scholar]
- Deng L, Wang H, Dapper CH, Newton WE, Shilov S, Wang S. Assignment of protonated R-homocitrate in extracted FeMo-cofactor of nitrogenase via vibrational circular dichroism spectroscopy. Commun Chem 2020; 3:145. doi: 10.1038/s42004-020-00392-z [Crossref] [ Google Scholar]
- Kypr J, Kejnovska I, Bednářová K, Vorlickova M. Circular Dichroism Spectroscopy of Nucleic Acids. In: Berova N, Polavarapu LP, Nakanishi K, Woody RW. Comprehensive Chiroptical Spectroscopy: Applications in Stereochemical Analysis of Synthetic Compounds, Natural Products, and Biomolecules. Hoboken (NJ, USA): John Wiley & Sons; 2012. p. 575-586. 10.1002/9781118120392.ch17.
- Kneer M, Roller M, Lucas V, Schreiber R, Govorov A, Liedl T. Circular Dichroism of Chiral Molecules in DNA-Assembled Plasmonic Hotspots. ACS Nano 2018; 12:9: 9110-9115. 10.1021/acsnano.8b03146.
- Chang YM, Chen CK, Hou MH. Conformational changes in DNA upon ligand binding monitored by circular dichroism. Int J Mol Sci 2012; 13:3394-413. doi: 10.3390/ijms13033394 [Crossref] [ Google Scholar]
- Lafayette E, Vitalino de Almeida S, da Rocha Pitta M, Carneiro Beltrão E, Gonçalves da Silva T, Olímpio de Moura R. Synthesis, DNA Binding and Topoisomerase I Inhibition Activity of Thiazacridine and Imidazacridine Derivatives. Molecules 2013; 18:15035. [ Google Scholar]