Bioimpacts. 12(2):147-154.
doi: 10.34172/bi.2021.23634
Original Research
Effect of α-pinene and thymoquinone on the differentiation of bone marrow mesenchymal stem cells into neuroprogenitor cells
Aisha Ishaque 1  , Irfan Khan 1, Asmat Salim 1, * , Rida-e-Maria Qazi 1, Tuba Shakil Malick 1, Durriyyah Sharifah Hasan Adli 2
Author information:
1Dr. Panjwani Center for Molecular Medicine and Drug Research, International Center for Chemical and Biological Sciences, University of Karachi, Karachi-75270, Pakistan
2University of Malaya, 50603 Kuala Lumpur, Malaysia
Abstract
Introduction:
Neurodegenerative diseases are accompanied by loss of neuronal function and integrity. Stem cell therapy is utilized to regenerate neurons to repair the damaged area. Regeneration potential of stem cells can be enhanced by using chemicals with known bioactive properties. In the current study, two bioactive compounds, α-pinene (AP) and thymoquinone (TQ) were explored for their neuronal differentiation potential of rat bone marrow mesenchymal stem cells (MSCs).
Methods:
MSCs were isolated, cultured and characterized immunocytochemically for the presence of specific surface markers. Optimized concentrations of both compounds (20 µM AP and 12 µM TQ) as determined by MTT assay, were used to treat MSCs in separate and combined groups. All groups were assessed for the presence of neuronal, astroglial, and germ layer markers through qPCR. Neuronal and glial protein expression were analyzed by immunocytochemistry.
Results:
Both compounds alone and in combination induced differentiation in MSCs with significant gene expression of neuronal markers i.e. neuron specific enolase (NSE), nestin, microtubule-associated protein 2 (MAP2), neurofilament light chain (Nefl) and Tau, and astroglial marker i.e. glial fibrillary acidic protein (GFAP). AP treated group also showed significant upregulation of endodermal and mesodermal markers indicating transition of ectoderm towards the other two germ layers.
Conclusion:
This study concludes that AP and TQ potentially differentiate MSCs into neuronal and astroglial lineages. However, AP treated group followed germ layer transition. Expression of neuronal as well as glial markers indicate that the differentiated neurons are at the neuroprogenitor stage and can be potential candidates for cellular therapeutics against neurodegenerative disorders.
Keywords: Neurodegeneration, Neuronal differentiation, Neuroprogenitor, GFAP, Germ layers
Copyright and License Information
© 2022 The Author(s)
This work is published by BioImpacts as an open access article distributed under the terms of the Creative Commons Attribution License (
http://creativecommons.org/licenses/by-nc/4.0/). Non-commercial uses of the work are permitted, provided the original work is properly cited.
Introduction
Neurodegenerative ailments are associated with deterioration of neuronal function and damage to the structural integrity, thus leading to neuronal degeneration and abnormalities of the central nervous system. Although not completely understood, neuronal degeneration is affected by various factors including aging.
1
Microglial activity and initiation of inflammatory cascades are the key processes that initiate neurodegenerative pathologies like Alzheimer’s disease, Parkinson’s disease, Huntington’s disease, Multiple sclerosis, Amyotrophic lateral sclerosis etc.
2
Neurodegeneration can be acute or chronic, therefore it can lead to localized and/or generalized neuronal death. Acute neurodegeneration due to stroke, trauma etc., leads to the localized cellular damage of the injured area, while chronicity in neurodegeneration may result in the damage to specific subtype of neurons and leads to generalized loss of a particular neuronal population.
3
Regenerating neurons by exploiting stem cells seems to be a useful approach as these cells can differentiate into multiple lineages. The potential of stem cell differentiation towards neuronal lineage can be enhanced by the use of chemical compounds. Alpha-pinene (AP) and thymoquinone (TQ) are the two bioactive compounds that possess neuroprotective properties.
AP exhibits hypoglycemic, anti-inflammatory, anti-oxidant, broncho-dilatory, as well as broad spectrum antibiotic-like properties.
4-6
It belongs to the bicyclic class of monoterpenes.
7
It suppresses inflammation and catabolism by modulating inflammatory reactions and by reforming the extracellular matrix in human chondrocytes.
8
It has been reported to considerably reduce heart rate and artery-generated blood pressure in rats and this effect is triggered in the vasomotor center of the medullary region of brain and nucleus tractus solitarius.
9
It also inhibits cellular proliferation and blood vessel formation.
10
In yeast cells and mitochondria, AP and β-pinene disrupt cell membrane integrity, suppress respiration and ion transportation, alleviate membrane permeability
11
and regulate various cellular functions, i.e. energy maintenance and other membrane-coupled energy transduction processes, solute transportation, and regulation of metabolic processes.
12
AP significantly inhibits acetylcholine esterase, thus useful in treating cognition disorders.
13
TQ is the major active component of Nigella sativa, present in its volatile and fixed oil.
14
It possesses anti-oxidant, anti-inflammatory and other bioactive properties.
15
It scavenges reactive oxygen species and neutralizes them, thus reducing their detrimental effects.
16,17
TQ increases the expression level and action potential of glutathione S-transferase, glutathione peroxidase, superoxide dismutase and glutathione reductase.
15,16,18-20
It also significantly reduces prostaglandin E2 levels in the rat microglial cells after their exposure to lipopolysaccharides. TQ has also been shown to reduce neuronal inflammation induced in response to NF-κB in BV-2 microglial cells.
21
Given the remarkable biological properties of these two compounds, this study was designed to investigate the potential effect of AP and TQ and their combination on the differentiation of rat bone marrow derived mesenchymal stem cells (MSCs) into neuronal lineage at both gene and protein levels.
Material and Methods
Materials
The reagents/materials used in the study are as follows: Bright green 2x qPCR Master Mix (Applied Biological Materials Inc., Canada), CD44 and CD45 antibodies (BD Biosciences, USA), NeuN antibody (Biolegend, USA), CD90 antibody (Cedarlane Cellutions Biosystems, Canada), glial fibrillary acidic protein(GFAP)antibody (Cloud Clone, USA), bovine serum albumin, DAPI, Tween-20 (MP Biomedicals, USA), β-III tubulin antibody (R&D Systems, USA), Alexa fluor 546 rat anti-rabbit secondary antibody (Santa Cruz Biotechnology Inc., USA), AP, MTT, TQ, Triton X-100, Vimentin antibody (Sigma Aldrich, USA), c-kit (CD117) antibody, DMEM, L-glutamine, penicillin-streptomycin, RevertAid First Strand cDNA synthesis kit, Sodium pyruvate, Trypsin EDTA (Thermo Fisher Scientific, USA),
Experimental animals
Male adult Wistar rats, weighing 170-200 g, were used to isolate bone marrow MSCs. These animals were provided by the in-house facility of the institute. They were kept at a temperature of 24 ± 1ºC at relative humidity of 55 ± 5%, with 12/12 hours light /dark cycle. Sawdust was used as bedding and animals were given access to water and food during the entire study period.
Culture of bone marrow MSCs
Animals were sacrificed. Tibia and femur were dissected and muscles were removed. All the cell culture work was performed in a sterile biosafety cabinet (ESCO, USA). Bone ends were removed and marrow was flushed through bone cavities by means of a 26-gauge needle filled with complete medium (DMEM supplemented with 10% FBS, 100 units/mL penicillin, 100 µg/mL streptomycin and 1 mM sodium pyruvate). After thorough and gentle mixing, marrow cells were transferred to T-75cm
2
flasks and incubated at 37°C in humidified CO2 incubator. Medium was changed after every 3 to 4 days. Once cells attained about 80% confluence, they were sub-cultured using 1X trypsin. Passage 1 and 2 (P1 and P2) cells were used for all experiments.
Characterization of MSCs by immunocytochemistry
MSCs were cultured in 24-well plate and incubated at 37°C for 24 hours. The next day, medium was removed from wells and cells were washed with PBS twice. Paraformaldehyde (4%) with a volume of 200 µL was added to each well for 10 minutes followed by washing with PBS. Triton X-100 (0.1%) was added and plates were incubated at room temperature for 10 minutes followed by washing with PBS. Blocking solution (2% BSA, 0.1% tween 20 in PBS) was then added and the plate was proceeded for incubation at room temperature for 30 minutes. Primary antibodies i.e. CD44, CD90, CD117, CD45 and vimentin were added to their respective wells, followed by overnight incubation at 4°C. Primary antibody solutions were then removed and wells were washed with PBS. Alexa flour 546 goat anti-rat secondary antibody was added to each well and incubated for 2 hours at 37°C. Following washing with PBS, DAPI (0.5 µg/mL) was added for 15 minutes at room temperature. Wells were washed again and cells were analyzed under fluorescence microscope (Nikon, Japan).
Cytotoxicity analysis
Cytotoxicity analysis of AP and TQ was performed by MTT assay to find out the optimum and safe concentration for further experiments. MSCs were seeded in 96-well plate and incubated at 37°C in humidified 5% CO2 incubator for 24 hours. Confluent MSCs in each well were treated with different concentrations of both compounds separately (AP 5-60 µM: TQ 3-18 µM) and incubated further for 24 hours. The medium was removed from the wells and MTT dye was added followed by incubation under standard culture conditions for 4 hours. Dye was removed, DMSO was added and the plate was read at 570 nm using spectrophotometer (Multiskan Go, Thermo Scientific, USA). Optimized concentrations of each compound were further analyzed in combination for cytotoxicity analysis using similar experimental setup.
Experimental groups
MSCs were categorized into four groups; control (MSCs without treatment), MSCs treated with 20 µM AP and 12 µM TQ separately, and in combination for the analysis of the synergistic effect.
Treatment of MSCs
Working solutions of 20 µM AP and 12 µM TQ were prepared using their corresponding stocks in serum-free DMEM. MSCs were treated with the compounds separately and in combination. The control group was not given any treatment. After treatment, MSCs corresponding to all groups were incubated at 37°C in the humidified 5% CO2 incubator for 3 hours.
Analysis of gene expression by qPCR
RNA was isolated from each group by TRIzol method according to the manufacturer’s instructions. The yield was measured using NanoDrop UV-Vis spectrophotometer (Thermo Scientific, USA). cDNA synthesis was performed using RevertAid kit according to manufacturer’s protocol. Gene expression levels of neuronal, glial, and germ layer markers were analyzed in each group by qPCR (Mastercycler, ep realplex, Eppendorf, Germany) using qPCR Master Mix. Primer sequences corresponding to these genes are presented in Table 1. Reaction was performed with initial denaturation at 95°C for 10 minutes followed by 40 cycles (denaturation at 95°C for 15 seconds and annealing at 58°C for 1 minute). The Ct values obtained after completing the whole reaction were used to calculate the fold change.
Table 1.
Neuronal, glial and germ layer transition genes
|
Neuron Specific Genes
|
|
|
Genes
|
Sequence
|
| Nestin |
Forward: AACCACAGGAGTGGGAACTG
Reverse: TCTGGCATTGACTGAGCAAC
|
| Nefl |
Forward: GCCGAAGAGTGGTTCAAGAG
Reverse: TGTCTGCATTCTGCTTGTCC
|
| NSE |
Forward: GTGGACCACATCAACAGCAC
Reverse: TGAGCAATGTGGCGATAGAG
|
| MAP2 |
Forward: TGTTGCTGCCAAGAAAGATG
Reverse: ACGTGGCTGGACTCAATACC
|
| Tau protein |
Forward: CACTGCCGTCCATACATCAC
Reverse: ATGGAGCAAACCAAACAAGG
|
|
Glial Specific Gene
|
|
| GFAP |
Forward: AGAAAACCGCATCACCATTC
Reverse: GCACACCTCACATCACATCC
|
|
Germ Layer Transition Genes
|
|
|
Ectodermal Markers
|
|
| NCAM |
Forward: GAGGAACGGACTCCAAACCAT
Reverse: ATTGGGGACCGTCTTGACTTC
|
| Nestin |
Forward: AACCACAGGAGTGGGAACTG
Reverse: TCTGGCATTGACTGAGCAAC
|
| Pax6 |
Forward: CGGGAACCACTTCAACAGGA
Reverse: TGCCTTCTGTACGCAAAGGT
|
|
Endodermal Markers
|
|
| AFP |
Forward: GCCTGAAATGACAGAGGAGCA
Reverse: CCACATGGAAGTCTCCACCAG
|
| SOX17 |
Forward: CCACCATCACTGTCCAGTTT
Reverse: CATCTGAACACCCCACTGTT
|
| MixL1 |
Forward: GGCCTGTCAACTTTACACTCCAT
Reverse: GTGCTTGACAGGGTCTTATGGTT
|
|
Mesodermal Markers
|
|
| Mesp1 |
Forward: GGACCCATCATTCCTGTACACC
Reverse: CTTCCAGGAAATACCCCCTTCG
|
| T Brachyury |
Forward: GCTGTTGGGTAGGGAGTCAAG
Reverse: GAACATCCTCCTGCCGTTCTT
|
| Tbx20 |
Forward: ACTGACATCGAGAGGGAATGAG
Reverse: CTGTCAGAGAGAGCCTAATGC
|
Analysis of neuronal and glial protein expression
Immunocytochemical analysis of treated cells was performed to determine the expression level of GFAP, NeuN, and β III tubulin proteins using fluorescence microscope. The intensity of immunocytochemically analyzed images was calculated via ImageJ software.
Statistical analysis
Data of each experiment was analyzed statistically by IBM-SPSS Statistics software (v22.x86-EQUiNOX). Independent samples t test or one-way ANOVA was used for analysis. All values were represented as mean ± SEM with number of observations (n) = 3 and level of significance = P < 0.05.
Results
MSCs culture and characterization
Bone marrow culture comprised of heterogeneous population of cells. MSCs showed adherence to the flask surface unlike the floating hematopoietic stem cells which were removed. After about 2 weeks, MSCs proliferated and formed a monolayer, presenting fibroblast-like morphology. Confluent MSCs were sub-cultured to passage 1 and 2 (Fig. 1A).MSCs were characterized by immunocytochemistry based on the presence of cell surface markers. Cells showed positive expression of CD44, CD90, CD117, and vimentin proteins (Fig. 1E-H) comparing to the control (Fig. 1D), while CD45, a hematopoietic marker, was not expressed in these cells (Fig. 1I).
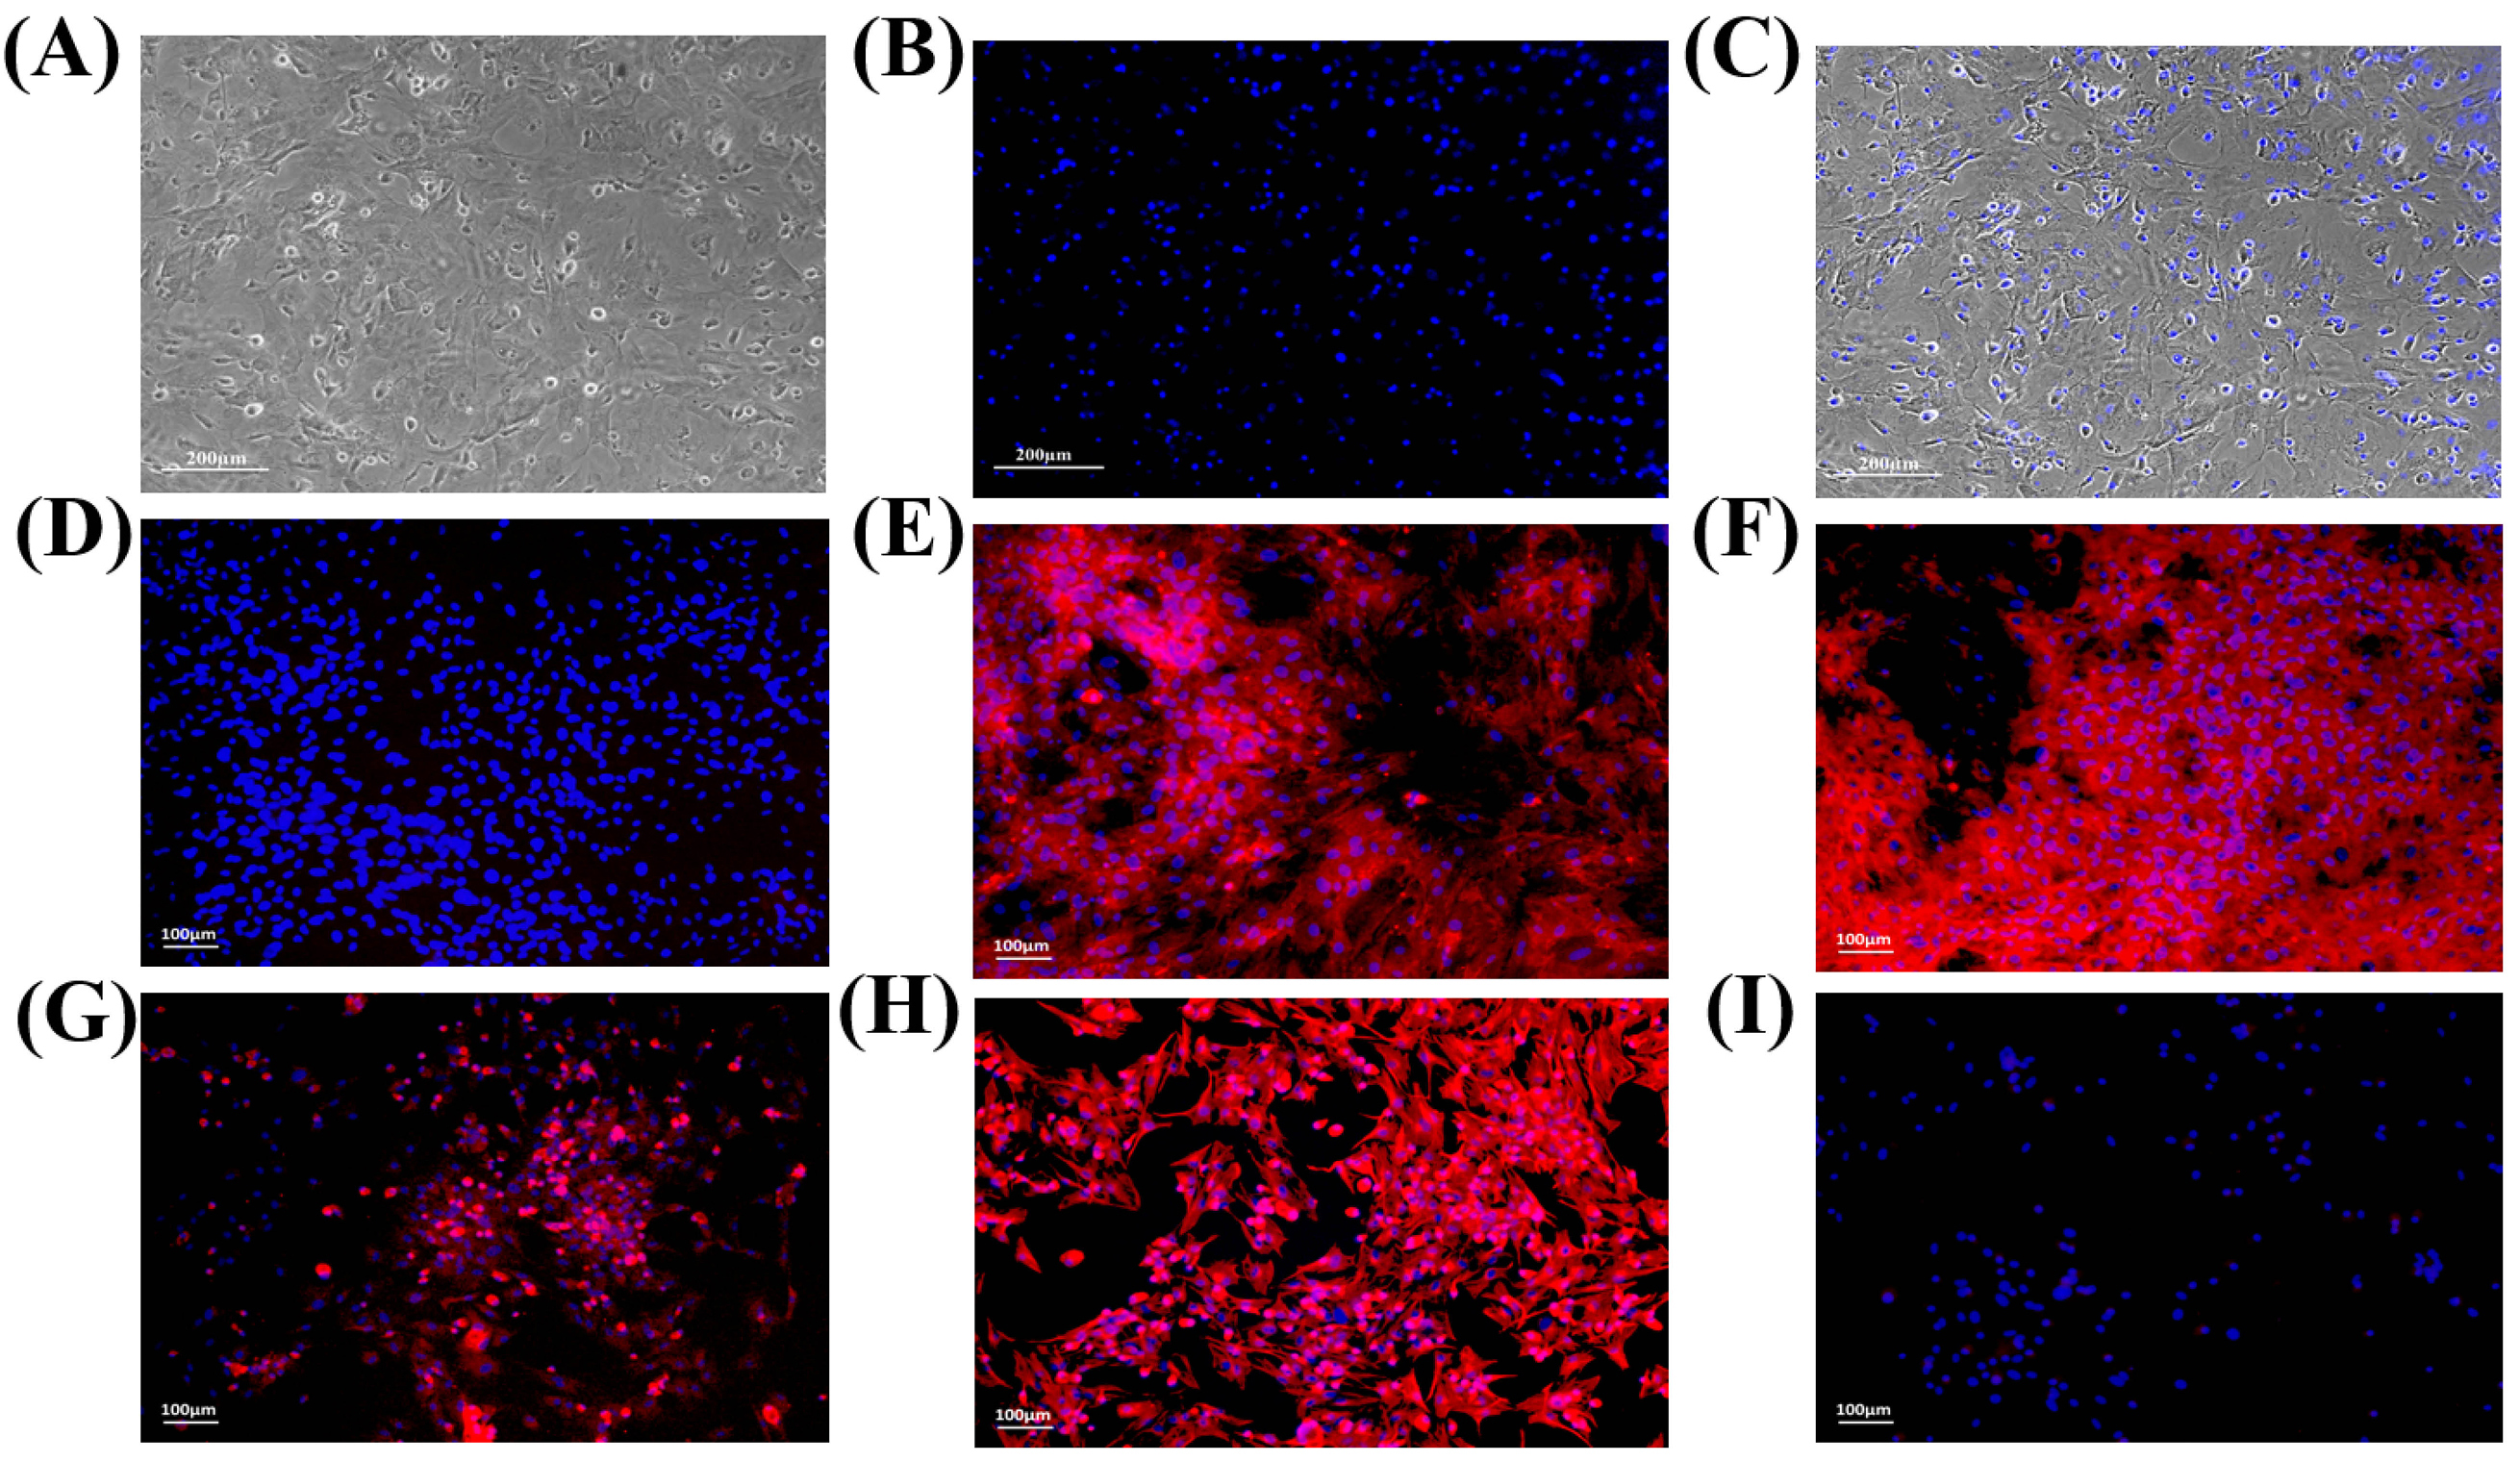
Figure 1.
Morphology and characterization of rat bone marrow derived MSCs: Passage 1 MSCs showing (A) fibroblast-like morphology and (B) DAPI stained nuclei. (C) Also shown is the superimposed image of A and B. Characterization of MSCs by immunocytochemistry showing (D) unlabeled control, (E-H) positive expression of CD44, CD90, CD117 and vimentin, respectively, and (I) negative expression of CD45, a hematopoietic marker.
.
Morphology and characterization of rat bone marrow derived MSCs: Passage 1 MSCs showing (A) fibroblast-like morphology and (B) DAPI stained nuclei. (C) Also shown is the superimposed image of A and B. Characterization of MSCs by immunocytochemistry showing (D) unlabeled control, (E-H) positive expression of CD44, CD90, CD117 and vimentin, respectively, and (I) negative expression of CD45, a hematopoietic marker.
Cytotoxicity analysis
Cytotoxicity of AP and TQ was evaluated by MTT assay. There was a concentration dependent increase in the number of metabolically inactive cells. AP and TQ showed statistically significant toxic effect on MSCs on concentrations above 40 µM and 12 µM, respectively (Fig. 2A-B). Based on these results, AP and TQ at concentrations of 20 µM and 12 µM, respectively were used for further experiments. When both compounds were used in combination and their combined effect was analyzed, it also appeared to be non-toxic to the MSCs (Fig. 2C).
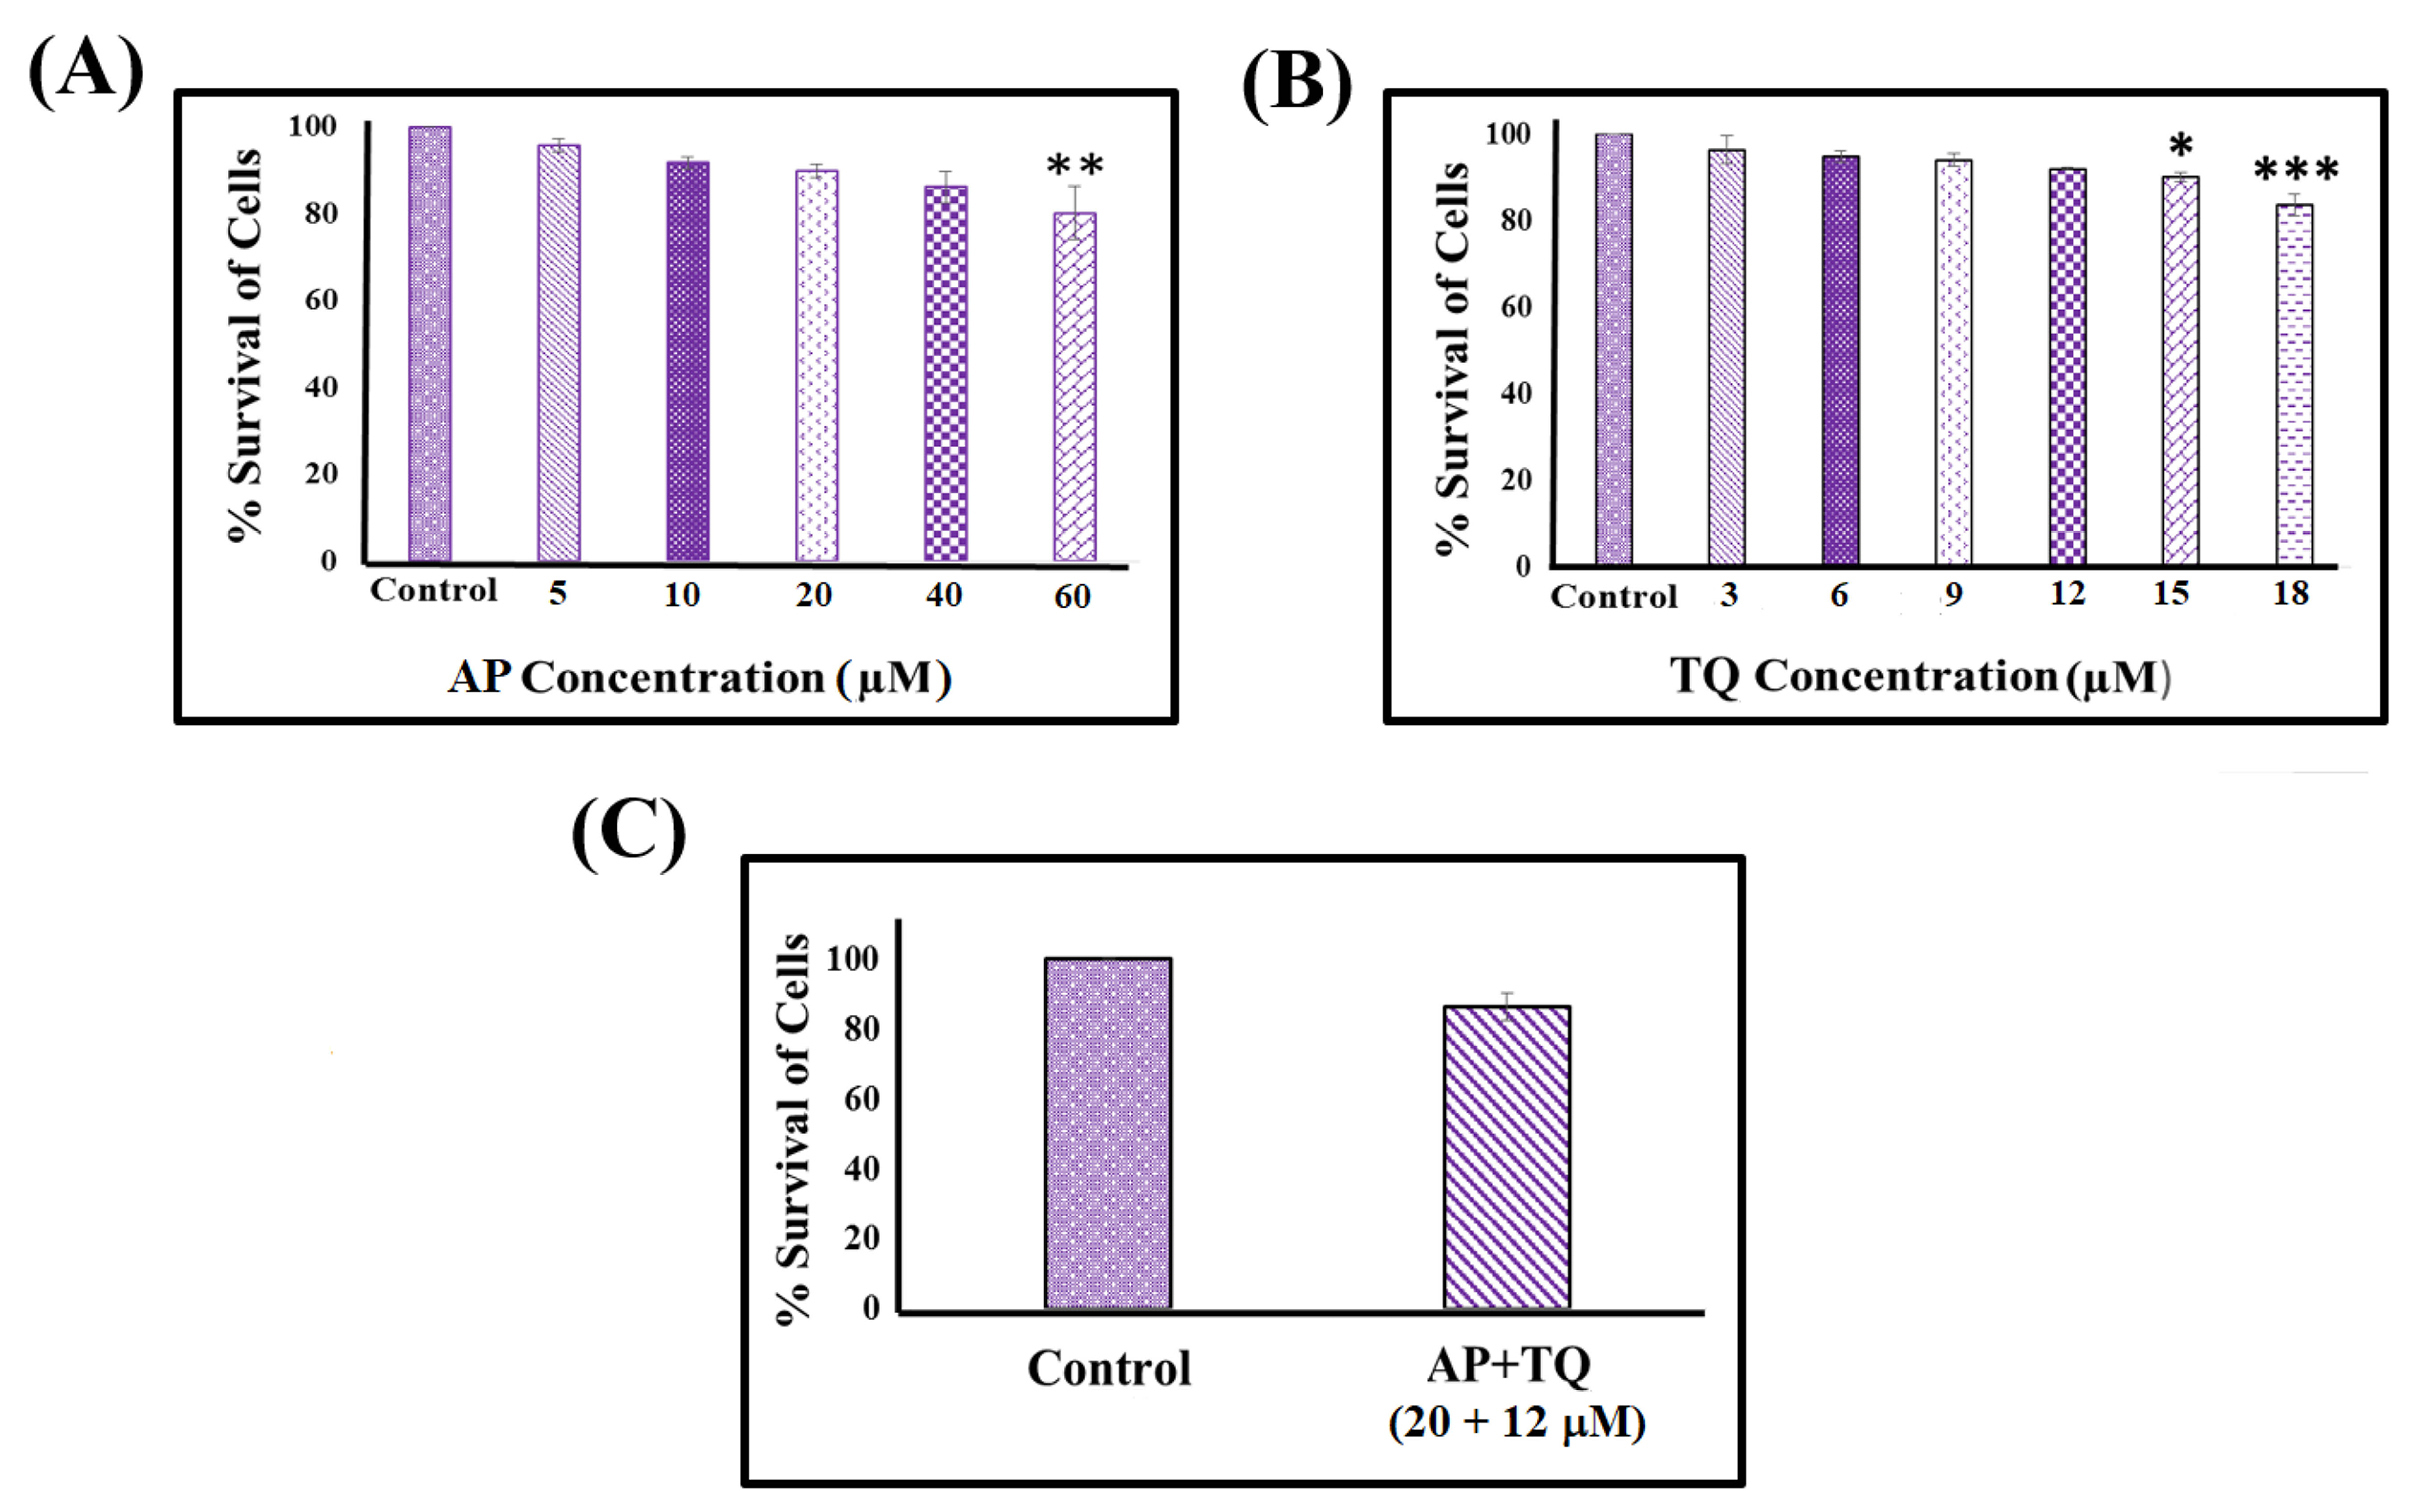
Figure 2.
Cytotoxicity analysis of α-pinene (AP), thymoquinone (TQ), and the combination (AP + TQ) group by MTT assay: (A) AP above 40 µM and (B) TQ above 12 µM concentrations showed statistically significant reduction in cell survival. (C) Combined treatment of AP and TQ (20 and 12 µM, respectively) did not show significant cytotoxic effect on MSCs. Data is presented as mean ± standard error with n = 3 and significance level P < 0.05 (*P < 0.05, **P < 0.01 and ***P < 0.001).
.
Cytotoxicity analysis of α-pinene (AP), thymoquinone (TQ), and the combination (AP + TQ) group by MTT assay: (A) AP above 40 µM and (B) TQ above 12 µM concentrations showed statistically significant reduction in cell survival. (C) Combined treatment of AP and TQ (20 and 12 µM, respectively) did not show significant cytotoxic effect on MSCs. Data is presented as mean ± standard error with n = 3 and significance level P < 0.05 (*P < 0.05, **P < 0.01 and ***P < 0.001).
Morphological changes in treated MSCs
Treated MSCs were monitored periodically to observe changes in their morphology. Distinguished features of neuronal cells started to appear within 1 hour after the treatment in each group. Prominent neuronal morphology was observed with formation of distinctive cell body and dendrites (Fig. 3A).
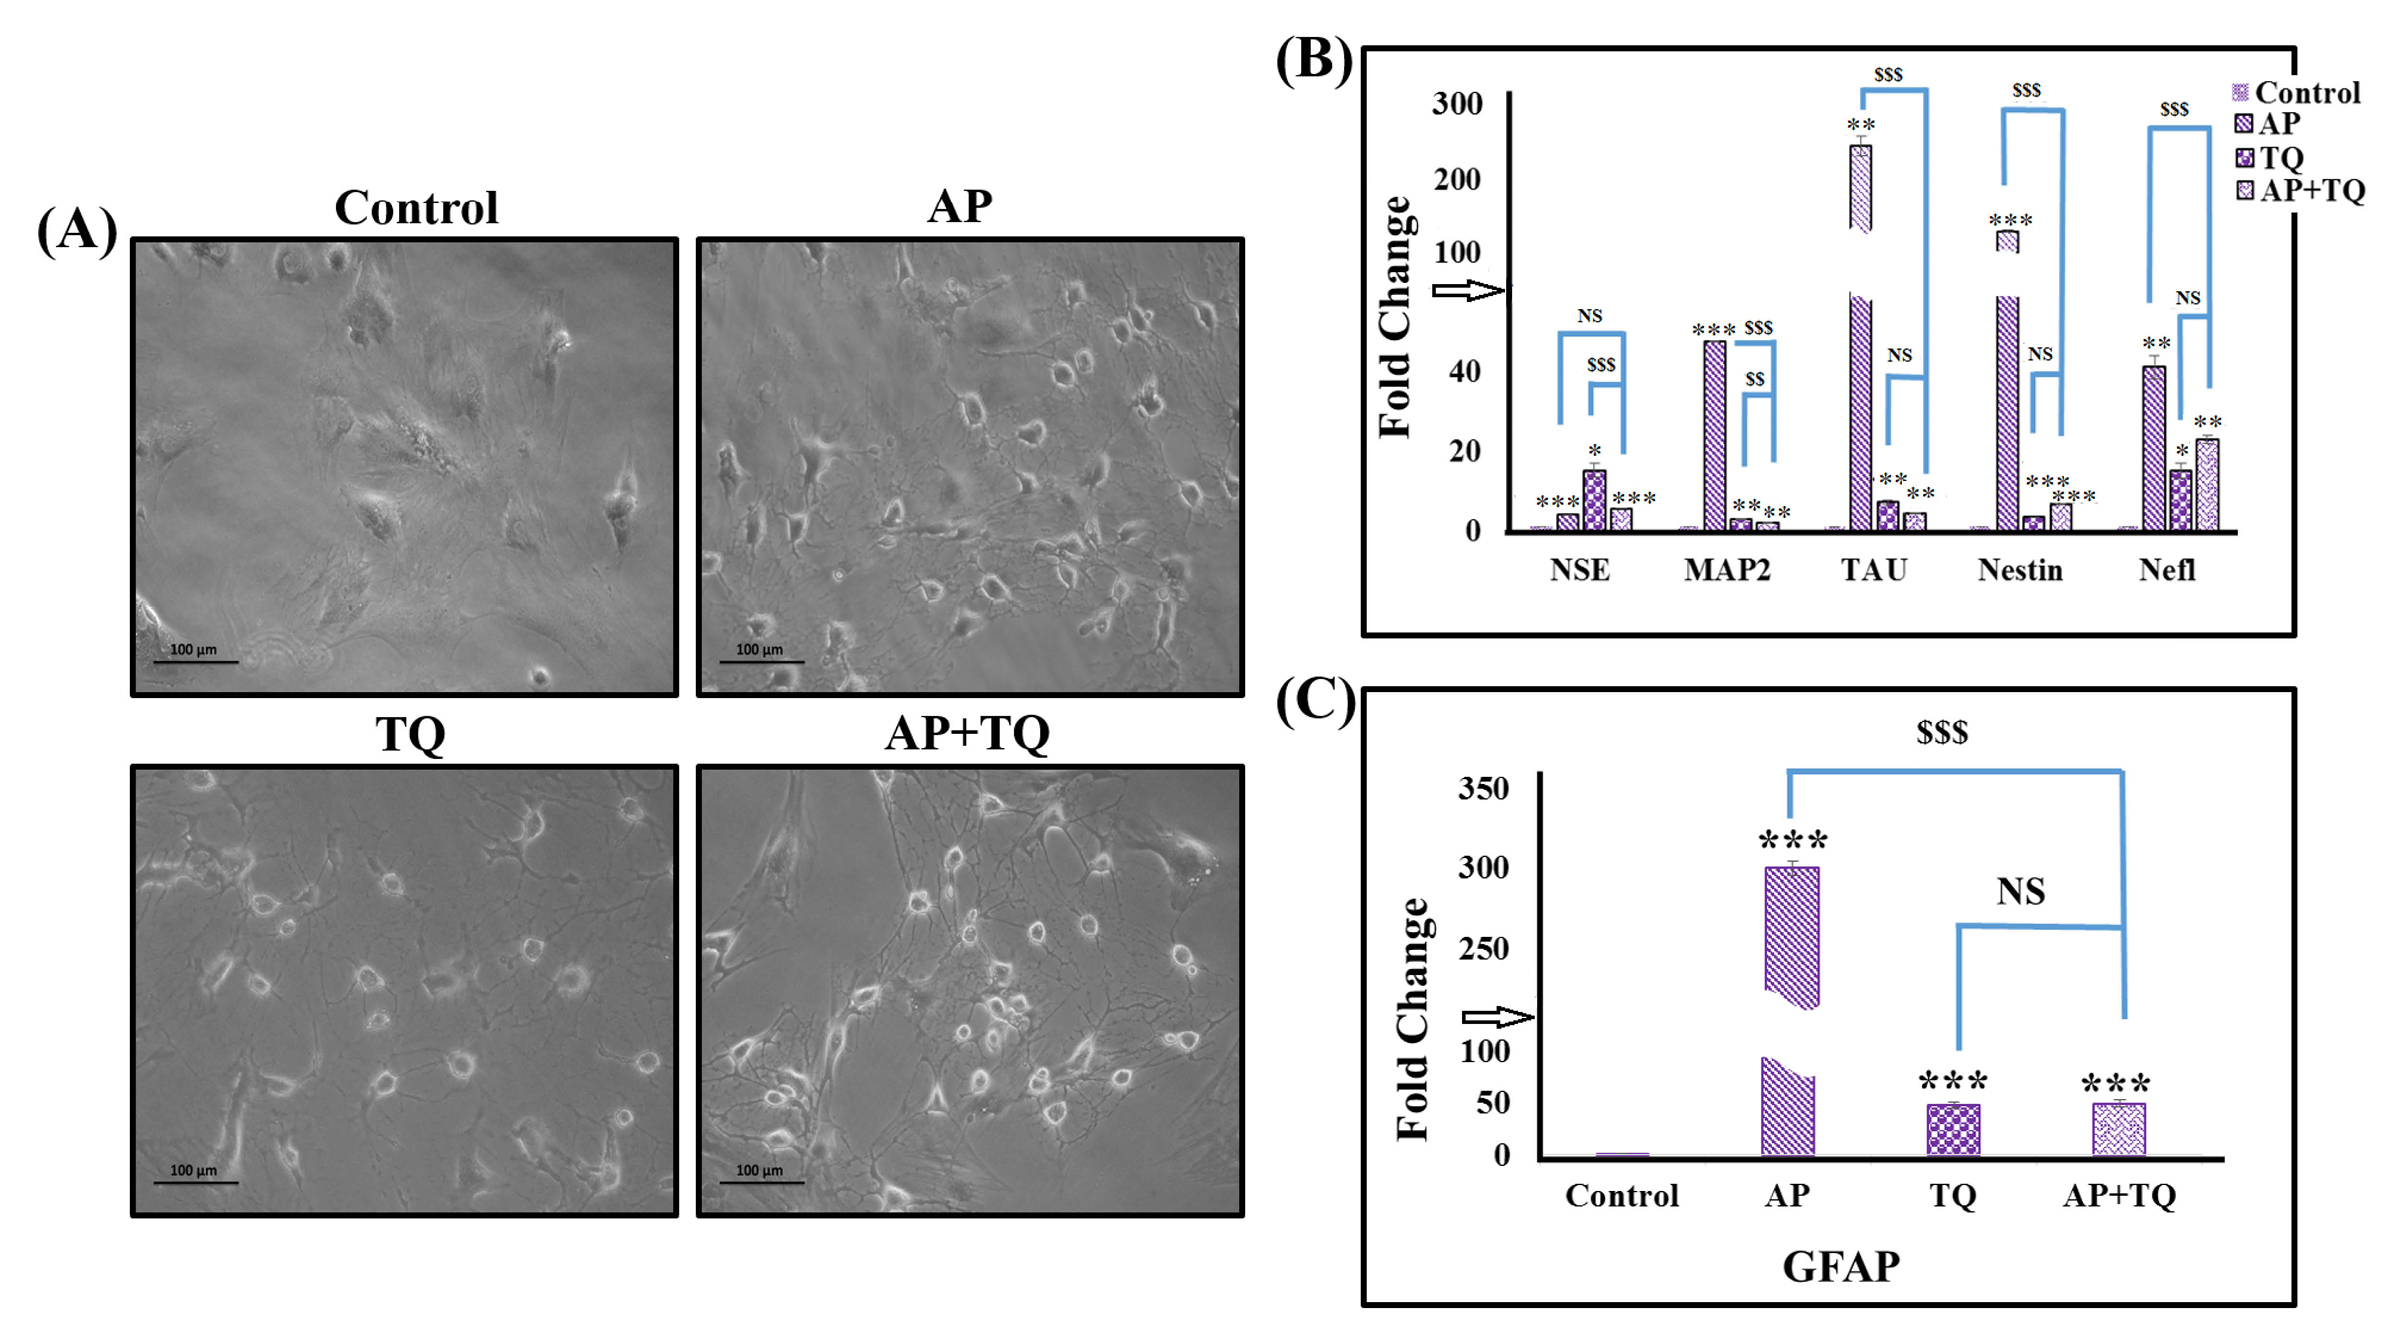
Figure 3.
Effect of α-pinene (AP), thymoquinone (TQ), and the combination (AP + TQ) treatment on MSCs; Morphology and gene expression: (A) Phase contrast images of untreated MSCs (control) and MSCs treated with 20 µM AP and 12 µM TQ for 3 hours, separately and in combination (AP + TQ). All the treated groups revealed prominent and well defined morphological features of neuronal cells compared to untreated MSCs. (B-C) Bar diagrams corresponding to fold change by qPCR showing AP, TQ and their combined treatment having significant upregulation of neuron specific genes (NSE, MAP2, Tau, Nestin and Nefl) and glial gene (GFAP) as compared to the control. Also shown is the comparison between the individual and combination groups. Data is presented as mean ± standard error with n = 3 and significance level P < 0.05 (P < 0.05, P < 0.01 and P < 0.001; comparison of all groups with the untreated control is represented as *, while the comparison between the individual and combination groups is represented as $).
.
Effect of α-pinene (AP), thymoquinone (TQ), and the combination (AP + TQ) treatment on MSCs; Morphology and gene expression: (A) Phase contrast images of untreated MSCs (control) and MSCs treated with 20 µM AP and 12 µM TQ for 3 hours, separately and in combination (AP + TQ). All the treated groups revealed prominent and well defined morphological features of neuronal cells compared to untreated MSCs. (B-C) Bar diagrams corresponding to fold change by qPCR showing AP, TQ and their combined treatment having significant upregulation of neuron specific genes (NSE, MAP2, Tau, Nestin and Nefl) and glial gene (GFAP) as compared to the control. Also shown is the comparison between the individual and combination groups. Data is presented as mean ± standard error with n = 3 and significance level P < 0.05 (P < 0.05, P < 0.01 and P < 0.001; comparison of all groups with the untreated control is represented as *, while the comparison between the individual and combination groups is represented as $).
Neuronal and glial gene expression analysis in treated MSCs
MSCs after 3 hours of treatment were evaluated for the expression of neuronal genes by qPCR. Each group showed significant upregulation in the expression of neuron specific genes, neuron specific enolase (NSE), MAP2, Tau, Nestin and neurofilament light chain (Nefl) as compared to the control (Fig. 3B). Treated MSCs were further analyzed for the expression of the astroglial specific marker, GFAP which also showed significant over expression in all the treatment groups (Fig. 3C).
Neuronal and glial protein expression analysis in treated MSCs
Treated MSCs were analyzed by immunocytochemistry for the expression of neuronal and glial proteins. Expression levels of GFAP, NeuN and β-III tubulin were found to be significantly increased in all treatment groups as compared to the control (Fig. 4).
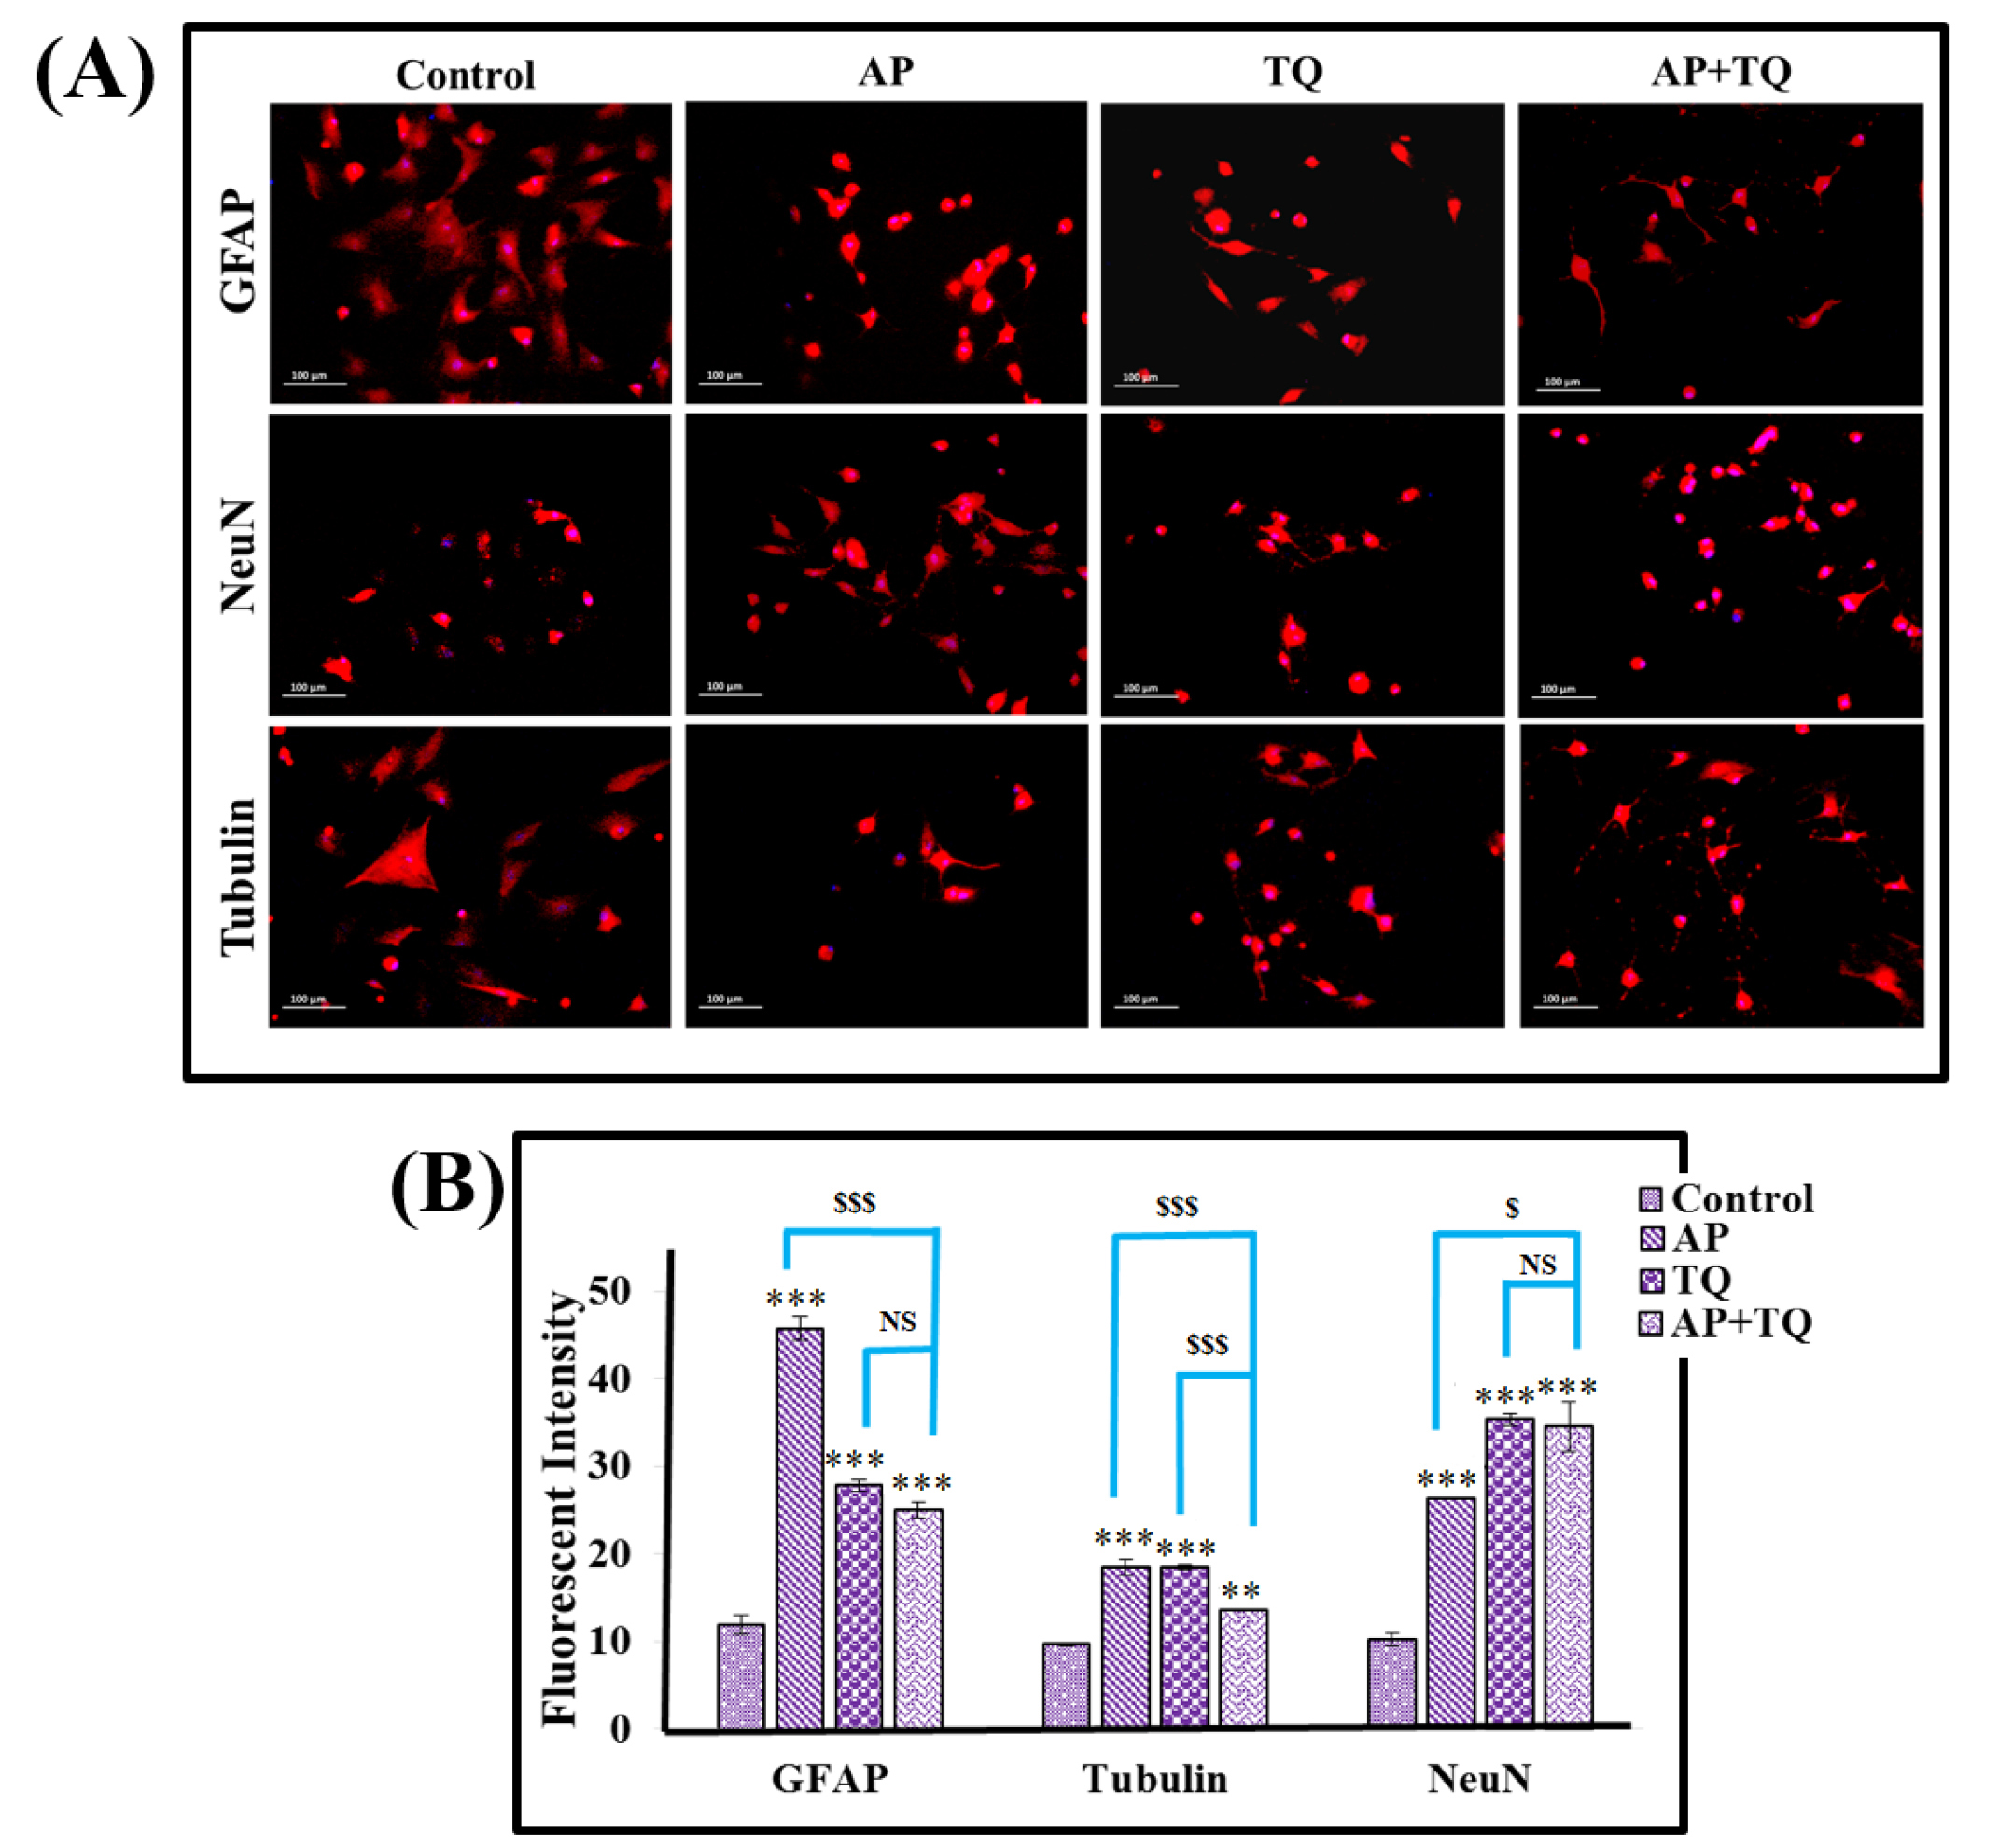
Figure 4.
Effect of α-pinene (AP), thymoquinone (TQ), and the combination (AP + TQ) treatment on MSCs; Protein expression: (A) Fluorescent images showing immunocytochemical analysis of MSCs; MSCs treated with 20 µM AP, 12 µM TQ separately, and in combination (AP + TQ) for 3 hours showing positive expression of GFAP, NeuN and β III tubulin in comparison to the control MSCs. (B) Bar diagrams showing respective protein intensities calculated from their corresponding images. Also shown is the comparison between the individual and combination groups. Data is presented as mean ± standard error with n = 3 and significance level P < 0.05 (P < 0.05, P < 0.01 and P < 0.001; comparison of all groups with the untreated control is represented as *, while the comparison between the individual and combination groups is represented as $).
.
Effect of α-pinene (AP), thymoquinone (TQ), and the combination (AP + TQ) treatment on MSCs; Protein expression: (A) Fluorescent images showing immunocytochemical analysis of MSCs; MSCs treated with 20 µM AP, 12 µM TQ separately, and in combination (AP + TQ) for 3 hours showing positive expression of GFAP, NeuN and β III tubulin in comparison to the control MSCs. (B) Bar diagrams showing respective protein intensities calculated from their corresponding images. Also shown is the comparison between the individual and combination groups. Data is presented as mean ± standard error with n = 3 and significance level P < 0.05 (P < 0.05, P < 0.01 and P < 0.001; comparison of all groups with the untreated control is represented as *, while the comparison between the individual and combination groups is represented as $).
Analysis of germ layer markers
To check whether AP and TQ treatment also affect meso- and endodermal lineage commitment, genes specific to endodermal (AFP, Sox17 and MixL1) and mesodermal markers (Mesp1, Tbx20 and T Brachyury) were analyzed along with the ectodermal markers (Nestin, Pax6 and NCAM). As expected, all treatment groups showed increase in the expression of ectodermal markers. For the other two germ layer markers, AP treatment showed significant increase in all endodermal and mesodermal markers, while TQ and the combined treatments showed significant upregulation of Tbx20 gene only as compared to the control (Fig. 5).
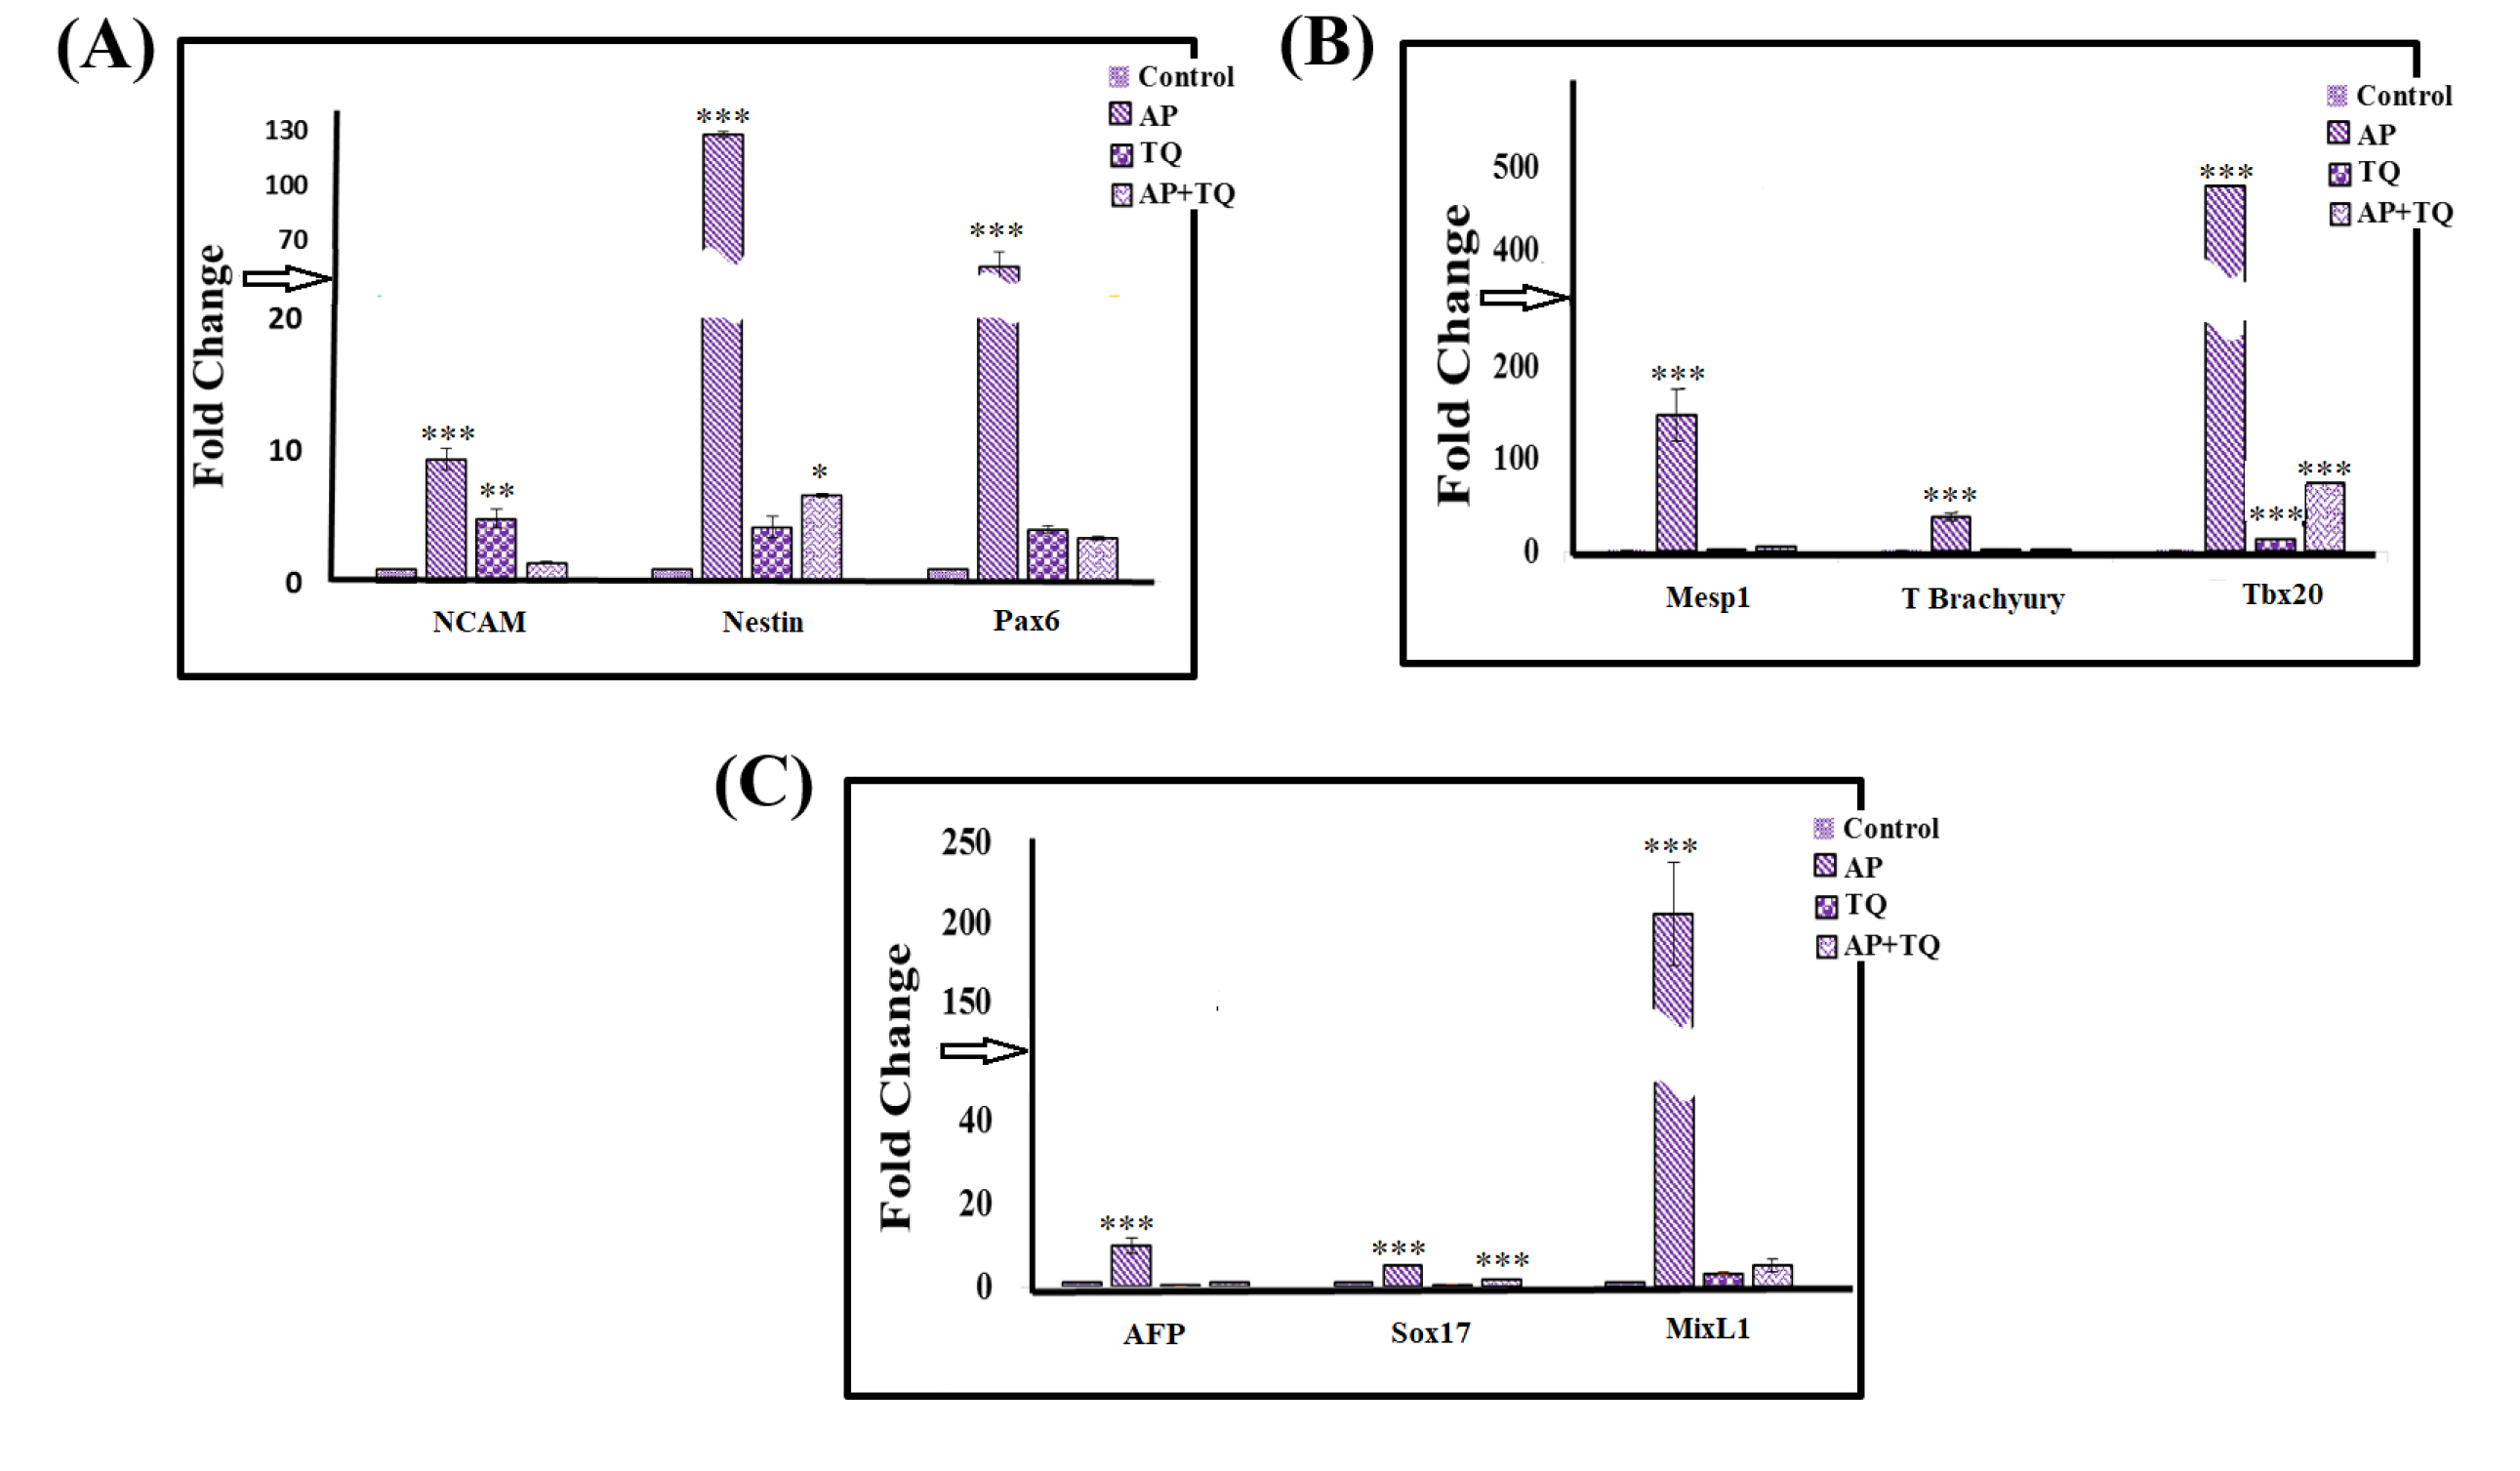
Figure 5.
Effect of α-pinene (AP), thymoquinone (TQ), and the combination (AP + TQ) on ectodermal, endodermal and mesodermal markers on treated MSCs by qPCR: Bar diagrams presenting fold change in the gene expression of (A) ectodermal markers; AP group showed significant upregulation of NCAM, Nestin and Pax6, while TQ and AP + TQ groups showed significant upregulation of NCAM and Nestin, respectively as compared to the untreated MSCs, (B) mesodermal markers; AP group showed significant upregulation of Mesp1, T Brachyury, and Tbx20, while TQ and AP + TQ groups showed no significant change as compared to the untreated MSCs except in case of Tbx20 which showed significant over-expression. (C) endodermal markers; AP group showed significant upregulation of AFP, Sox17, and MixL1, while TQ and AP + TQ groups showed no significant change in any of these genes except Sox17 in AP + TQ groups as compared to the untreated MSCs. Data is presented as mean ± standard error with n = 3 and significance level P < 0.05 (*P < 0.05, **P < 0.01 and ***P < 0.001).
.
Effect of α-pinene (AP), thymoquinone (TQ), and the combination (AP + TQ) on ectodermal, endodermal and mesodermal markers on treated MSCs by qPCR: Bar diagrams presenting fold change in the gene expression of (A) ectodermal markers; AP group showed significant upregulation of NCAM, Nestin and Pax6, while TQ and AP + TQ groups showed significant upregulation of NCAM and Nestin, respectively as compared to the untreated MSCs, (B) mesodermal markers; AP group showed significant upregulation of Mesp1, T Brachyury, and Tbx20, while TQ and AP + TQ groups showed no significant change as compared to the untreated MSCs except in case of Tbx20 which showed significant over-expression. (C) endodermal markers; AP group showed significant upregulation of AFP, Sox17, and MixL1, while TQ and AP + TQ groups showed no significant change in any of these genes except Sox17 in AP + TQ groups as compared to the untreated MSCs. Data is presented as mean ± standard error with n = 3 and significance level P < 0.05 (*P < 0.05, **P < 0.01 and ***P < 0.001).
Discussion
Stem cell differentiation into various lineages can be triggered in response to various inducing agents i.e. growth factors, cytokines, peptides, small molecules etc. These inducers particularly target a pathway, directing stem cells towards a certain lineage or cell type. Current study is performed to explore the potential role of small molecules i.e. AP and TQ in the differentiation of bone marrow derived MSCs towards neuronal lineage. These molecules possess a variety of pharmacological and biological properties and are known to have many beneficial effects. We used rat bone marrow MSCs and treated them with these compounds in order to differentiate these cells into neuronal lineage. Prior to the treatment, optimized concentration of these compounds was selected based on the cytotoxicity analysis. AP at 20 µM and TQ at 12 µM concentrations were found to be non-toxic to MSCs and therefore utilized for all subsequent experiments. MSCs were divided into four experimental groups i.e. untreated MSCs (control) (1), MSCs treated with 20 µM AP (2) and 12 µM TQ (3) separately, and in combination (4). All the groups showed differentiation of MSCs towards neuronal lineage within 1 hour of treatment showing apparent neuronal morphology with very prominent cell body and dendrite formation. After 3 hours of treatment, analysis of neuronal gene expression in differentiated MSCs showed that there was significant upregulation in the expression of neuron specific markers i.e. NSE, Tau, nestin, Nefl, and microtubule-associated protein 2 (MAP2) in all the treated groups compared to the untreated control, showing neuronal differentiation at the gene level.
We also analyzed astroglial specific gene i.e. GFAP which also revealed significant upregulation in all the treated groups. Co-expression of glial marker along with the neuronal markers have also been demonstrated in other studies.
22,23
Differentiation was also verified at protein level using immunocytochemistry. All the treated groups showed intense expression of GFAP, β-III tubulin and NeuN proteins, confirming the neuronal and glial differentiation at the protein level as well.
The morphological features of neurons observed in the treated groups retained for about 4-5 hours, after which the differentiated MSCs reverted to their fibroblast like morphology especially in case of AP. This implies that neural differentiation is maintained for an initial time period, and later the cells either de-differentiated or underwent lineage transition from ectodermal to mesodermal or endodermal germ layer. To confirm this, we selected specific genes corresponding to each germ layer and analyzed their expression through qPCR. mRNA analysis revealed the upregulation of ectodermal markers (Nestin, Pax6 and NCAM), which is expected as the neuronal cells are derivatives of ectodermal germ layer. However, we also observed significant upregulation of endodermal (AFP, Sox17 and MixL1) and mesodermal (Mesp1, T Brachyury and Tbx20) markers in AP treated group. The upregulation of T Brachyury and MixL1 genes represent the reversal of differentiated neurons towards fibroblast-like cells as the overexpression of these genes have been reported in the development of endodermal and mesodermal layers. These outcomes are supported by other studies that validate the upregulation of MixL1 gene on primitive streak during embryonic development, which is responsible for the formation of mesodermal and endodermal germ layer.
24
This gene governs the development of germ layers and behaves as a crucial regulatory molecule.
25
The process of development of all three germ layers (gastrulation) is considered as the most prominent gestational phase. Gastrulation is followed by the formation of primitive streak on the epiblast region. The cells of the epiblast migrate towards the primitive streak and adopt flask shaped appearance. The cells become detached from the epiblast and invaginate. Some of these cells replace the hypoblast and form the endoderm while others move between the newly formed endoderm and epiblast, resulting in the formation of mesoderm. During this phenomenon, T Brachyury gene is expressed in the node, precursor cells of notochord that aids the cells to migrate through primitive streak and causes the formation of mesodermal layer.
26
Presence of all the three germ layer markers have been documented in previous studies on MSCs in their uncommitted state,
27
so it is possible that these MSCs differentiate into any lineage depending upon the characteristic of the inducer. It is also possible that the inducer is not specific towards a particular lineage and therefore MSCs follow the normal transition in the development of germ layers, finally resulting in the formation of cells of various lineages. With these findings, it is the most likely explanation in case of AP, while in case of TQ and the combination group, cells were likely to differentiate into both neuronal and glial lineages implying that the differentiation is towards the neuroprogenitor stage.
Conclusion
The findings of the current study demonstrate that AP and TQ efficiently induced differentiation of rat bone marrow derived MSCs towards neuronal lineage. These neuronal cells expressed astroglial marker, which either indicates that both compounds possess differentiation potential towards both lineages or implies that the differentiation is at the neuroprogenitor stage. Furthermore, AP treatment results in the transition of germ layer from ectoderm to the endoderm and mesoderm, as specific markers were found to be overexpressed. Further studies are needed to explore the potential of these compounds so that the differentiated neuroprogenitors can be used for the management of neurodegenerative ailments.
Funding sources
This study is supported by the institutional funding and in collaboration with the Fundamental Research Grant Scheme (FRGS), Ministry of Higher Education, Malaysia (FP120-2020).
Ethical statement
All experiments were performed as per the institutional policy in accordance with the NIH guidelines and approved by the Institutional Animal Care and Use Committee (IACUC). Protocol no. 2018-0014 was assigned to the study.
Competing interests
The authors declare no conflict of interest.
Authors’ contribution
AS and DSHA conceived the idea and reviewed the manuscript; IK and AS designed the experiments; AI, RQ and TSM performed experiments. AI wrote the first draft of the manuscript and analyzed the data. IK and AS analyzed and interpreted the data; AS edited and finalized the manuscript.
Research Highlights
What is the current knowledge?
√ AP and TQ possess remarkable biological properties of medicinal importance.
√ AP and TQ also serve as neuroprotective agents
What is new here?
√ AP and TQ induced neuronal differentiation with marked expression of astroglial specific gene, GFAP in rat bone marrow MSCs.
√ Induction by these compounds can be considered at the neuroprogenitor level.
√ AP treated MSCs followed germ layer transition (from ectoderm to endoderm and mesoderm) as the MixL1 and T Brachyury genes are markedly overexpressed.
References
- Chen WW, Zhang XIA, Huang WJ. Role of neuroinflammation in neurodegenerative diseases. Mol Med Rep 2016; 13:3391-6. doi: 10.3892/mmr.2016.4948 [Crossref] [ Google Scholar]
- Qin L, Wu X, Block ML, Liu Y, Breese GR, Hong JS. Systemic LPS causes chronic neuroinflammation and progressive neurodegeneration. Glia 2007; 55:453-62. doi: 10.1002/glia.20467 [Crossref] [ Google Scholar]
- Lunn JS, Sakowski SA, Hur J, Feldman EL. Stem cell technology for neurodegenerative diseases. Ann Neurol 2011; 70:353-361. doi: 10.1002/ana.22487 [Crossref] [ Google Scholar]
- Mercier B, Prost J, Prost M. The essential oil of turpentine and its major volatile fraction (α-and β-pinenes): a review. Int J Occup Med Environ Health 2009; 22:331-42. doi: 10.2478/v10001-009-0032-5 [Crossref] [ Google Scholar]
- Violante IM, Garcez WS, Barbosa SC, Garcez FR. Chemical composition and biological activities of essential oil from Hyptis crenata growing in the Brazilian Cerrado. Nat Prod Commun 2012; 7:1387-9. doi: 10.1177/2F1934578X1200701037 [Crossref] [ Google Scholar]
- Rivas da Silva AC, Lopes PM, Barros de Azevedo MM, Costa DC, Alviano CS, Alviano DS. Biological activities of α-pinene and β-pinene enantiomers. Molecules 2012; 17:6305-6316. doi: 10.3390/molecules17066305 [Crossref] [ Google Scholar]
- Huang X, Xiao Y, Köllner TG, Zhang W, Wu J, Wu J. Identification and characterization of (E)-β-caryophyllene synthase and α/β-pinene synthase potentially involved in constitutive and herbivore-induced terpene formation in cotton. Plant Physiol Biochem 2013; 73:302-308. doi: 10.1016/j.plaphy.2013.10.017 [Crossref] [ Google Scholar]
- Rufino AT, Ribeiro M, Judas F, Salgueiro L, Lopes MC, Cavaleiro C, at al. Anti-inflammatory and chondroprotective activity of (+)-α-pinene: structural and enantiomeric selectivity. J Nat Prod 2014; 77:264-269. doi: 10.1021/np400828x [Crossref] [ Google Scholar]
- El-Taher KEH, Al-Ajmi MF, Al-Bekairi AM. Some cardiovascular effects of the dethymoquinonated Nigella sativa volatile oil and its major components alpha-pinene and p-cymene in rats. Saudi Pharmaceut J 2003; 11:104-110. [ Google Scholar]
- Dorow P, Weiss T, Felix R, Schmutzler H. Effect of a secretolytic and a combination of pinene, limonene and cineole on mucociliary clearance in patients with chronic obstructive pulmonary disease. Arzneimittel-Forschung 1987; 37:1378-81. [ Google Scholar]
- Andrews RE, Parks LW, Spence KD. Some effects of Douglas fir terpenes on certain microorganisms. Appl Environ Microbiol 1980; 40:301-304. [ Google Scholar]
- Trumpower BL, Gennis RB. Energy transduction by cytochrome complexes in mitochondrial and bacterial respiration: the enzymology of coupling electron transfer reactions to transmembrane proton translocation. Ann Rev Biochem 1994; 63:675-716. doi: 10.1146/annurev.bi.63.070194.003331 [Crossref] [ Google Scholar]
- Russo EB, Taming THC. potential cannabis synergy and phytocannabinoid‐terpenoid entourage effects. Br J Pharmacol 2011; 163:1344-64. doi: 10.1111/j.1476-5381.2011.01238.x [Crossref] [ Google Scholar]
- Ali BH, Blunden G. Pharmacological and toxicological properties of Nigella sativa. Phytother Res 2003; 17:299-305. doi: 10.1016/j.fct.2009.04.023 [Crossref] [ Google Scholar]
- Darakhshan S, Bidmeshki Pour A, Hosseinzadeh Colagar A, Sisakhtnezhad S. Thymoquinone and its therapeutic potentials. Pharmacol Res 2015; 95l:138-158. doi: 10.1016/j.phrs.2015.03.011 [Crossref] [ Google Scholar]
- Mansour MA, Nagi MN, El-Khatib AS, Al-Bekairi AM. Effects of thymoquinone on antioxidant enzyme activities, lipid peroxidation and DT‐diaphorase in different tissues of mice: a possible mechanism of action. Cell Biochem Funct 2002; 20:143-151. doi: 10.1002/cbf.968 [Crossref] [ Google Scholar]
- Nagi MN, Mansour MA. Protective effect of thymoquinone against doxorubicin–induced cardiotoxicity in rats: a possible mechanism of protection. Pharmacol Res 2000; 41:283-289. doi: 10.1006/phrs.1999.0585 [Crossref] [ Google Scholar]
- Badary OA, Gamal AED. Inhibitory effects of thymoquinone against 20-methyl cholanthrene-induced fibrosarcoma tumorigenesis. Cancer Detect Prev 2001; 25:362-368. [ Google Scholar]
- Badary OA, Taha RA, Gamal el-Din AM, Abdel-Wahab MH. Thymoquinone is a potent superoxide anion scavenger. Drug Chem Toxicol 2003; 26:87-98. doi: 10.1081/DCT-120020404 [Crossref] [ Google Scholar]
- Kanter M, Demir H, Karakaya C, Ozbek H. Gastroprotective activity of Nigella sativa L oil and its constituent, thymoquinone against acute alcohol-induced gastric mucosal injury in rats. World J Gastroenterol 2005; 11:6662-6. doi: 10.3748/2Fwjg.v11.i42.6662 [Crossref] [ Google Scholar]
- Velagapudi R, Kumar A, Bhatia HS, El-Bakoush A, Lepiarz I, Fiebich BL. Inhibition of neuroinflammation by thymoquinone requires activation of Nrf2/ARE signalling. Int Immunopharmacol 2017; 48:17-29. doi: 10.1016/j.intimp.2017.04.018 [Crossref] [ Google Scholar]
- Tondreau T, Lagneaux L, Dejeneffe M, Massy M, Mortier C, Delforge A. Bone marrow–derived mesenchymal stem cells already express specific neural proteins before any differentiation. Differentiation 2004; 72:319-326. doi: 10.1111/j.1432-0436.2004.07207003.x [Crossref] [ Google Scholar]
- Havránek T, Lešťanová Z, Mravec B, Štrbák V, Bakoš J, Bačová Z. Oxytocin modulates expression of neuron and glial markers in the rat hippocampus. Folia Biol 2017; 63:91-97. [ Google Scholar]
- Ng ES, Azzola L, Sourris K, Robb L, Stanley EG, Elefanty AG. The primitive streak gene MixL1 is required for efficient haematopoiesis and BMP4-induced ventral mesoderm patterning in differentiating ES cells. Development 2005; 132:873-884. doi: 10.1242/dev.01657 [Crossref] [ Google Scholar]
- Pereira LA, Wong MS, Mei Lim S, Stanley EG, Elefanty AG. The Mix family of homeobox genes - Key regulators of mesendoderm formation during vertebrate development. Dev Biol 2012; 367:163-177. doi: 10.1016/j.ydbio.2012.04.033 [Crossref] [ Google Scholar]
- Sadler T, Leland J, Sadler-Redmond S, Tosney K, Chescheir N, Imseis H, et al. Langman's Medical Embryology. Philadelphia: Wolters Kluwer; 2012.
- Woodbury D, Reynolds K, Black IB. Adult bone marrow stromal stem cells express germline, ectodermal, endodermal, and mesodermal genes prior to neurogenesis. J Neurosci Res 2002; 69:908-917. doi: 10.1002/jnr.10365 [Crossref] [ Google Scholar]