Bioimpacts. 13(4):323-332.
doi: 10.34172/bi.2023.24097
Original Article
Comparative modeling of the mitral valve in normal and prolapse conditions
Seyed Esmail Razavi  , Amin Talebi , *
Author information:
Faculty of Mechanical Engineering, University of Tabriz, Tabriz, Iran
Abstract
Introduction:
Computational modeling is one of the best non-invasive approaches to predicting the functional behavior of the mitral valve (MV) in health and disease. Mitral valve prolapse (MVP) due to partial or complete chordae tendineae rapture is the most common valvular disease and results in mitral regurgitation (MR).
Methods:
In this study, Image-based fluid-structure interaction (FSI) models of the human MV are developed in the normal physiological and posterior leaflet prolapse conditions. Detailed geometry of the healthy human MV is derived from Computed Tomography imaging data. To provide prolapse condition, some chords attached to the posterior leaflet are removed from the healthy valve. Both normal and prolapsed valves are embedded separately in a straight tubular blood volume and simulated under physiological systolic pressure loads. The Arbitrary Lagrangian-Eulerian finite element method is used to accommodate the deforming intersection boundaries of the blood and MV.
Results:
The stress values in the mitral components, and also flow patterns including the regurgitant flow rates are obtained and compared in both conditions through the simulation. These simulations have the potential to improve the treatment of patients with MVP, and also help surgeons to have more realistic insight into the dynamics of the MV in health and prolapse.
Conclusion:
In the prolapse model, computational results show incomplete leaflet coaptation, higher MR severity, and also a significant increment of posterior leaflet stress compared to the normal valve. Moreover, it is found more deviation of the regurgitant jet towards the left atrium wall due to the posterior leaflet prolapse.
Keywords: Fluid-structure interaction, Human mitral valve, Mitral valve prolapse, Computed tomography imaging, Hemodynamics, Chordae tendineae rupture
Copyright and License Information
© 2023 The Author(s).
This work is published by BioImpacts as an open access article distributed under the terms of the Creative Commons Attribution Non-Commercial License (
http://creativecommons.org/licenses/by-nc/4.0/). Non-commercial uses of the work are permitted, provided the original work is properly cited.
Introduction
Mitral valve prolapse (MVP) due to the chordae tendineae rupture is a significant cause of primary mitral regurgitation (MR). In many instances, MVP will not impact health, but when MR is severe, it can lead to serious complications, including stroke, atrial fibrillation, and heart failure.1 Imaging techniques can visualize heart valves but do not provide valuable information about the causes of valve failure, structural dynamics, and hemodynamic parameters.2,3 Computational analysis is an example of a method that can be used to investigate the individual role of each component in the valve function, evaluate surgical repair, and also to improve the design of mechanical valves. Any destructive and pathological condition like MVP that alters the stress patterns inside the valve components could affect the progression of valve disease.4 However, the assessment of stress within the MV apparatus is very challenging. Computational simulations also can fill this gap for researchers and surgeons by yielding accurate information about the deformation and stress patterns.5,6
Simulation of the MV is a challenging biomechanical problem due to its highly complex structure and coupled interaction with the blood flow and pulsatile hemodynamic loads.3,7 However, recently due to advances in cardiac imaging and computational technology and the endeavors of many research groups, various computational simulations starting from simple 2D approximation to comprehensive 3D models have been developed.7 Finite Element (FE) analysis of the MV was first initiated by Kunzelman et al8 to examine leaflet deformations and stress patterns in the MV. That was the first 3D-FE model of the MV, including all essential anatomic components and regional tissue thickness. In a series of studies, Rim et al9-11 developed a novel computational evaluation protocol to perform and compare two different virtual MV repair techniques in a patient with posterior mitral leaflet prolapse. Abedini and Johari Moghadam used Mooney-Rivlin hyperelastic model as material properties of leaflets’ tissue for the first time among all models.12 FE methods are suitable for the simulation of quasi-static events such as opened or closed valves. However, to accurately simulate transient dynamics and evaluate hemodynamics parameters, FSI models are required.3 Lau et al3 compared the effects of tubular and ventricular fluid domain geometries on the MV dynamic. It was shown that the predicted stresses were similar in both conditions, but the stresses and flow velocities values and also the valve closing configuration were slightly different. Later, Dahl et al13 developed an FSI algorithm for the simulation of the MV dynamics by rendering 2D asymmetric leaflets during left ventricular filling. Results indicated that important features of the flow field may not be predicted by the assumption of the symmetric model. Recently, Khodaei et al14 simulated the FSI model of MVP by considering the direct effect of left ventricular motion, and to take into account the prolapse effect as a result of chordal rupture, some chordae tendineae were removed from the model.
Computational results depend highly on the accuracy of valve geometry, material properties, and the transvalvular pressure load.6 In all the aforementioned studies, due to the complex structure of human MV components, the valve geometry usually was simulated with simplification assumptions. In the present study, the image-based and comprehensive geometry of the human MV with the realistic structure of chordae tendineae is derived from imaging data. Two normal and prolapsed valves are mounted in a rigid tube, and physiological systolic pressure is imposed at the inlet and outlet of this tube as boundary conditions. An FSI modeling approach based on ALE formulation is used in this study to allow for displacements of the boundaries due to the large deformation of the MV components. Important MV dynamic and hemodynamic parameters such as stress values in the leaflets and chords, velocity magnitudes and flow patterns in the fluid domain, and also backward flow rates into the left atrium are determined and compared in the normal and the prolapse conditions.
Materials and Methods
Geometry reconstruction from computed tomography (CT) images
It is a challenging problem to image and reconstructs high-quality geometry of the sub-valvular apparatus either with echocardiography or cardiac magnetic resonance imaging. CT imaging can advance the level of anatomical detail of sub-valvular structures, especially the chordae tendineae.7 In this study, the geometries of models are based on CT image data of an adult male (67 years old) without any known history of the MV disease. A total of 337 axial, coronal, and sagittal image slices in the mid-diastolic phase are collected to reconstruct opened MV (Fig. 1). MIMICS commercial software is used for the segmentation and generation of the 3D MV model. This image-based model involves both leaflets, all recognizable chordae tendineae, and the upper parts of papillary muscles.
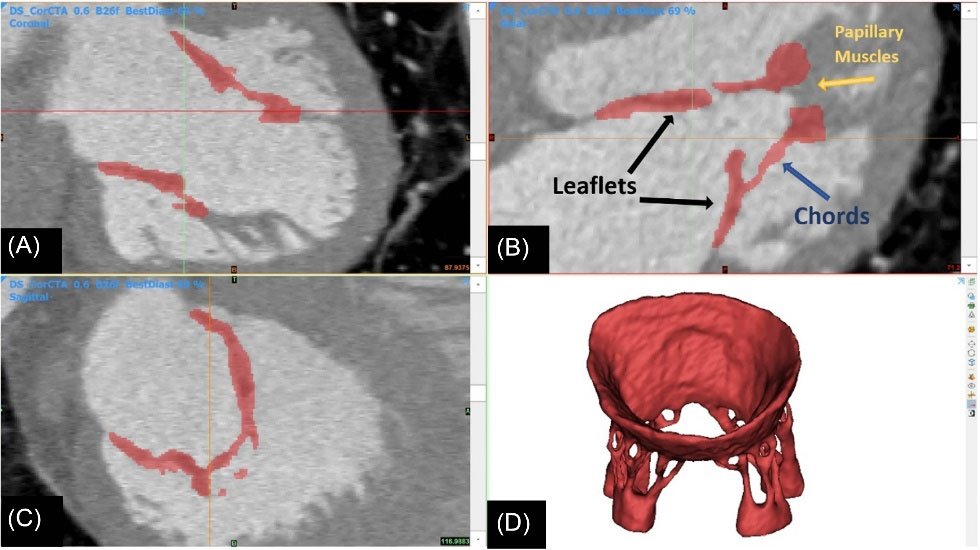
Fig. 1.
Image-based construction of mitral valve geometrical model from (A) coronal, (B) axial, and (C) sagittal image slices. (D) generated 3D MV model in the mid-diastolic phase based on CT images.
.
Image-based construction of mitral valve geometrical model from (A) coronal, (B) axial, and (C) sagittal image slices. (D) generated 3D MV model in the mid-diastolic phase based on CT images.
By convention, both the anterior (A) and the posterior (P) leaflets are divided into three individual segments: the anterior (A1 and P1), middle (A2 and P2), and posterior (A3 and P3) scallops.15 From the midline of the leaflets towards the commissure, the following chordae branches are inserted on each side of the leaflets: paramedical, main, commissural, and paracommissural chordae (only inserted on P1).15 Therefore, the reconstructed MV has thirteen chordae tendineae branches.
Prolapse in the posterior leaflet is more common than the anterior leaflet, mainly due to ruptured chordae in the central scallop (P2).16 Therefore, to consider the prolapse effect, the paramedial chords attached to this region are removed from the healthy model. Then, both normal and prolapse models are mounted separately in a straight tubular fluid volume so that their ventricular and atrial sections are chosen respectively intermediate volumes of 85 cm3 and 35 cm3. 3
Material and governing equations
Fluid domain
Transmitral blood flow is modeled as a Newtonian viscous fluid. The continuity and momentum equations of incompressible, laminar fluid flow in ALE description are given as:
(Eq. 2)
Where ρf is the fluid density, uf = [u v w]T is the velocity vector, t is the time, τ is the total stress tensor and um is the velocity vector of the deforming mesh which is used in ALE formulation. The total stress tensor τ for a generalized Newtonian fluid is defined by:
Where p is the pressure, I is the identity tensor, μ is the viscosity, and [ ]T shows the transpose of a matrix. The blood density and viscosity are assumed respectively
and μ = 0.004 [Pa.s].14
Solid domain
The equilibrium equations for solid mechanics are given by Newton’s second law. Using the more common second Piola-Kirchhoff stress tensor, S, it is written as:
where ρs is solid density, ds is the vector of structural displacements, ∇X is the gradient operator with respect to the material coordinates, and F is the deformation gradient tensor. The MV leaflets are assumed to be non-linear material due to their soft tissue reinforced by collagen fibers. A nearly incompressible isotropic Mooney-Rivlin hyperelastic material model is adopted.14 In this model, the strain energy density function (W) is a linear combination of the first I1 and the second I2 principal invariants of the right Cauchy–Green deformation tensor (∁). Nine parameter Mooney-Rivlin material model defined as17:
(Eq. 5)
(Eq. 7)
(Eq. 8)
where Cij, (i + j ≤3) shows empirically determined material constants,
shows a slightly different set of invariants, k is the bulk modulus, det( ) is the determinant operator, tr( ) is the trace operator, and J is the determinant of the deformation gradient tensor and it shows also the ratio of the deformed elastic volume over the reference volume of materials. The strain energy density function is related to the second Piola-Kirchhoff stress tensor as:
Empirical Material constants are obtained from mechanical test data reported by May-Newman and Yin.18 These constants and bulk modulus are determined in Table 1.
Table 1.
Mooney-Rivlin material coefficients for MV leaflets
|
Coefficient
|
Value (Pa)
|
| C10 |
25517.173 |
| C01 |
19445.891 |
| C20 |
13126.167 |
| C02 |
8157.79 |
| C11 |
10352.309 |
| C30 |
5488.58 |
| C03 |
2776.66 |
| C21 |
4376.38 |
| C12 |
3487.189 |
| κ |
44963064.684 |
All the chordae tendineae are considered linear elastic material. By obtaining valid reference data, Young's modulus and Poisson's ratio of chordae tendineae are assumed respectively E = 30 MPa, v = 0.45.3,19 The density of the leaflets, as well as the density of chordae tendineae, are assumed to be
.
Boundary conditions
This study focuses on MVP, in which only the MV closure stage is considered. A transmitral systolic pressure load based on clinical data is imposed at the inlet of the straight tubular fluid volume (Fig. 2).20 Systolic pressure at the outlet of the tube is negligible and
is considered. In the solid domain, the mitral annulus upper surface and also papillary muscle volumes are considered to be fixed in the passage and do not participate in FSI.
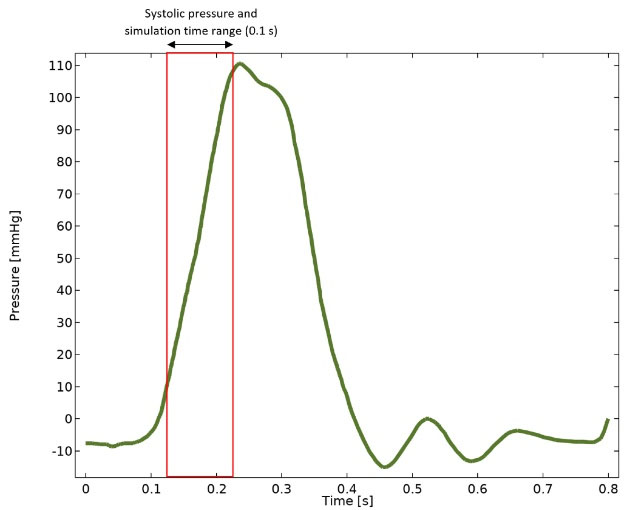
Fig. 2.
Transmitral blood pressure load and imposed systolic pressure (0.12 to 0.22 seconds) at the inlet of the straight tubular fluid volume.20
.
Transmitral blood pressure load and imposed systolic pressure (0.12 to 0.22 seconds) at the inlet of the straight tubular fluid volume.20
FSI coupling conditions include kinematic and dynamic constraints and have to be met at the interface boundary. The kinematic constraint (Eq. 10 and Eq. 11) fulfills the equality of displacement and velocity values in both domains at the interface. Whereas the dynamic constraint (Eq. 12) states that normal forces between the fluid and the solid at the interface boundary have to be equal. These constraints can be written as:
(Eq. 10)
(Eq. 11)
where df, ds are respectively the vector of fluid and structural displacements, Ωfs shows fluid-structure interface boundary, and
is the unit vector normal to the interface of the fluid and solid boundary.
Numerical method
The solution of the incompressible Navier–Stokes equation in the flow solver is developed based on the ALE-FE formulation due to the large deformation of the mitral leaflets. In the ALE method, the fluid mesh deforms following the structural movement to avoid element distortion. The governing equations are discretized on unstructured triangular meshes and solved using COMSOL Multiphysics® version 5.4 commercial finite element package (Fig. 3). Due to restrictions in solving time and computer memory, the segregated solver approach is selected automatically by this software to solve involving equations.

Fig. 3.
Computational mesh discretization configuration.
.
Computational mesh discretization configuration.
The segregated solver approach subdivides the problem into two or more substeps so that each step represents a single physics and uses a damped version of Newton’s method as the convergence criteria. In the fluid-structure interface, information for the solution is shared between the fluid solver and structure solver, and in this approach, the calculated forces acting on the structure are transferred to the structure side. Regardless of the approach to solving nonlinear problems, the solution is approached by iteration. That is, the used approach is called repeatedly, and gradually converges to the solution. With optimized iterative methods selected in COMSOL software, the error estimate in the solution was decreased with the number of iterations and, this convergence was quite monotonic.
Moreover, to control the numerical instabilities, Streamline-Upwind Petrov-Galerkin (SUPG) stabilization is used in the momentum equation. Time steps must be small enough for large deformations of the leaflets, so the optimal time step equal to 0.0002 (s) is chosen for the transient solution by applying the variable-order backward differentiation formula method with a maximum order of two. The grid independence study of the results has been carried out separately for both fluid and solid domains by several various mesh sizes. As a result, the fluid and solid domains are discretized respectively into 381914 and 101 694 elements (a total of 483 608) to accomplish the present study.
Results
Validation of the geometry accuracy
The reconstructed MV dimensions are compared with anatomical data in the literature to validate the model's accuracy (Fig. 4).21-23 As Table 2 shows, there is a good agreement between these data, so the accuracy of the extracted geometry is very reliable.
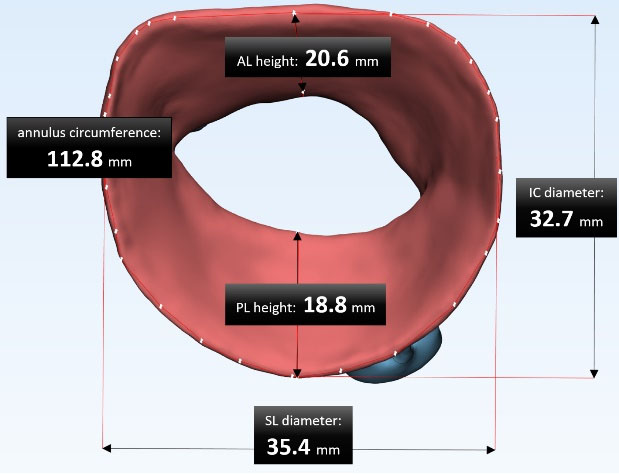
Fig. 4.
The reconstructed MV dimensions; the measurements of intercommissural (IC) diameter, septo-lateral (SL) diameter, annulus circumference, anterior leaflet (AL), and posterior leaflet (PL) height.
.
The reconstructed MV dimensions; the measurements of intercommissural (IC) diameter, septo-lateral (SL) diameter, annulus circumference, anterior leaflet (AL), and posterior leaflet (PL) height.
Table 2.
Main dimensions of image-based geometry compared with data in the literature
|
Main parameters of mitral geometry
|
Data in the literature (mm)21-23
|
Image-based MV dimensions (mm)
|
|
Range
|
Mean ± SD
|
| Intercommissural (IC) diameter |
27-51 |
39.3 ± 4.6 |
35.4 |
| Septo-lateral (SL) diameter |
19.5-42.5 |
31.4 ± 4.5 |
32.7 |
| Anterior leaflet (AL) height |
11.1-37.4 |
25 ± 7 |
20.6 |
| Posterior leaflet (PL) height |
10.8-34 |
22 ± 6.6 |
18.8 |
| Mitral annulus circumference |
85-148 |
119.8 ± 12.6 |
112.8 |
| Anterior chordae tendineae height |
9.5-23.5 |
14.5 |
14.7 |
| Posterior chordae tendineae height |
8-19 |
13 |
14.2 |
Stress values
The qualitative stress distributions across the atrial surfaces of leaflets with the configuration of MV closure in both normal physiological and prolapse conditions were shown in Fig. 5 at three representative times during the systolic phase. For better comparison, ventricular and three-dimensional views of stress distribution in the MV components were also demonstrated at peak systole (t = 0.22 s) in Fig. 6. The threshold of stress value (250 kPa) was applied to the simulation data to manifest alterations of stress concentration accurately. Therefore, the stress values higher than this threshold were displayed in red.
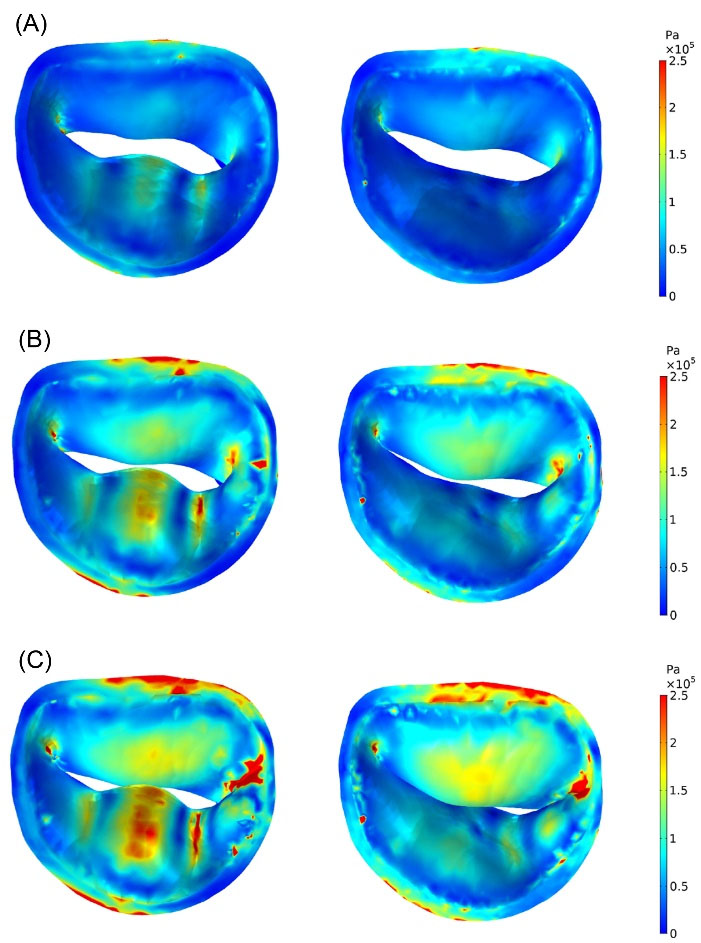
Fig. 5.
Stress distributions (von Mises stress) across atrial surfaces of normal (right) and prolapsed (left) MV leaflets at: (A) t = 0.1556 s (start of the valve closure), (B) t = 0.1994 s, (C) t = 0.22 s (peak systole).
.
Stress distributions (von Mises stress) across atrial surfaces of normal (right) and prolapsed (left) MV leaflets at: (A) t = 0.1556 s (start of the valve closure), (B) t = 0.1994 s, (C) t = 0.22 s (peak systole).
As shown in Fig. 5 and Fig. 6, asymmetrical stress distribution patterns of the normal and the prolapsed MV were similar in the anterior leaflet but different in the posterior leaflet. A significant increase in regional stress following chordal rupture was found in the posterior leaflet. The high-stress concentration areas in the normal MV were found near the mitral annulus and the commissures. However, in the prolapse condition, the maximum stress concentrations occurred not only in the mentioned regions but also in the P2 and the P3 scallops. In both conditions, the posterior commissure underwent higher stress than the anterior commissure, and also the atrial surface of leaflets had a noticeable increase in stress compared to their ventricular surface at peak systole due to leaflets bending toward the left atrium (Fig. 6). Moreover, Fig. 5C and Fig. 6B (enclosed by the black circle) indicate incomplete leaflets coaptation and large deformation of posterior leaflet belly in prolapsed MV as a result of the chordal rupture.
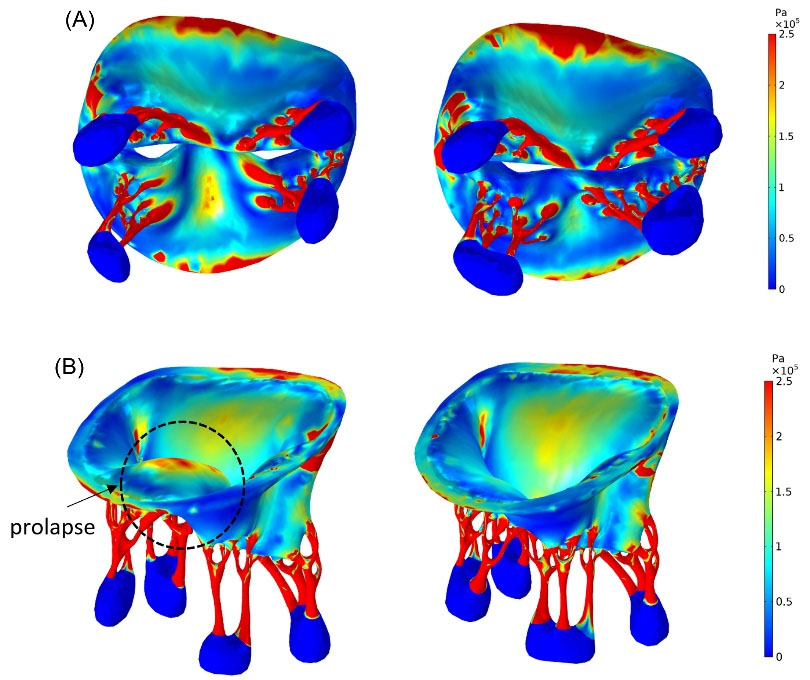
Fig. 6.
Stress distributions (von Mises stress) in the normal (right) and prolapsed (left) MV at peak systole; (A) ventricular view (B) three- dimensional view. The prolapse of the posterior leaflet is obvious in (B).
.
Stress distributions (von Mises stress) in the normal (right) and prolapsed (left) MV at peak systole; (A) ventricular view (B) three- dimensional view. The prolapse of the posterior leaflet is obvious in (B).
In terms of stress values, there were high-stress concentrations (between 0.5 MPa and 2.5 MPa) close to the chordal insertion regions (Fig. 6A). However, across a large part of the leaflet surface, the range of stress values in prolapsed MV (0–535 kPa) was higher than normal MV (0–180 kPa). The maximum stress value of the anterior and the posterior leaflet occurred respectively in A2 and P3 scallops. The average stress values during systole in the MV scallops were demonstrated in Fig. 7. It was shown in Fig. 7 that the average stress value in each anterior scallop of normal MV did not change significantly compared to the prolapse condition, and the most change was related to the A1 zone, in which it was decreased by 6.74%. However, mean stress variations were most apparent in the posterior leaflet, and it increased sharply by 81% in the P3 scallop (See Table 3).
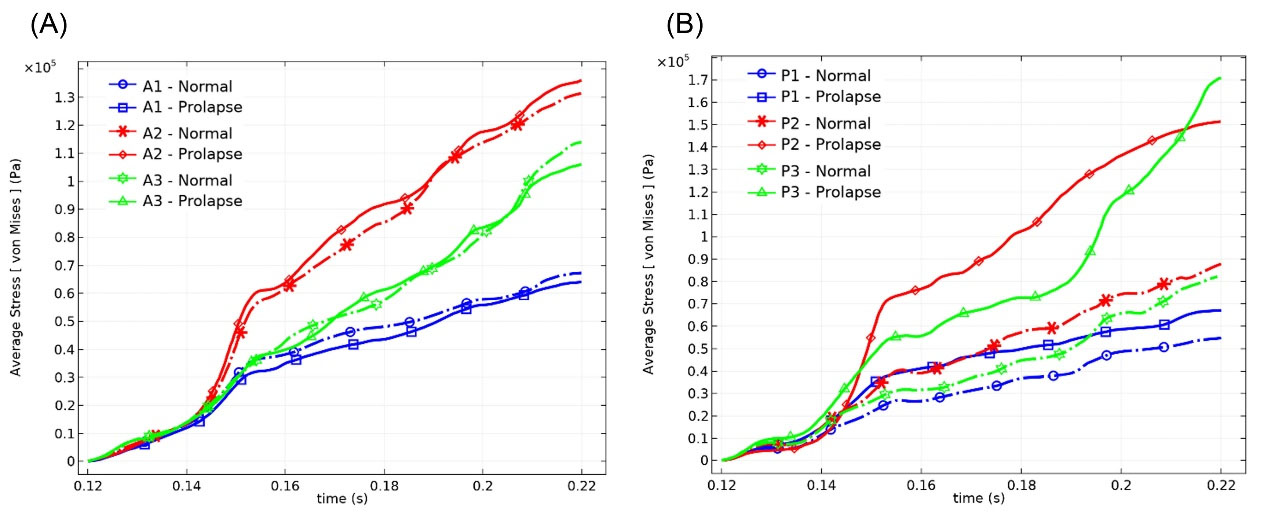
Fig. 7.
Average stress values in the (A) anterior scallops, and (B) posterior scallops during systole.
.
Average stress values in the (A) anterior scallops, and (B) posterior scallops during systole.
Table 3.
mean and maximum stress values in the MV components and differences rate caused by chordal rupture
|
Region
|
Mean stressa (kPa)
|
Differenceb(%)
|
Maximum stress (kPa)
|
Difference (%) |
|
Normal
|
Prolapse
|
Normal
|
Prolapse
|
| Anterior leaflet scallops |
A1 |
38.60 |
36.00 |
- 6.74 |
122.00 |
125.30 |
+ 2.70 |
| A2 |
68.60 |
71.70 |
+ 4.51 |
180.00 |
200.00 |
+ 11.11 |
| A3 |
51.00 |
50.60 |
- 0.78 |
172.20 |
146.00 |
- 15.21 |
| Posterior leaflet scallops |
P1 |
30.00 |
40.00 |
+ 33.33 |
91.20 |
169.60 |
+ 85.96 |
| P2 |
45.60 |
81.50 |
+ 78.72 |
127.60 |
248.70 |
+ 94.90 |
| P3 |
38.40 |
69.50 |
+ 80.99 |
145.20 |
534.50 |
+ 268.11 |
| The chordae tendineae attached to A1 |
Paramedial |
815 |
836 |
+ 2.57 |
7578 |
7211 |
- 4.084 |
| Main |
1065 |
1100 |
+ 3.29 |
19205 |
18700 |
- 2.63 |
| Commissural |
247 |
273 |
+ 10.52 |
1538 |
1346 |
- 12.48 |
| The chordae tendineae attached to A3 |
Paramedial |
885 |
937 |
+ 5.86 |
12950 |
8043 |
- 37.89 |
| Main |
568 |
649 |
+ 14.26 |
6079 |
4887 |
- 19.60 |
| Commissural |
324 |
368 |
+ 13.58 |
3369 |
3603 |
+ 6.95 |
| The chordae tendineae attached to P1 |
Paramedial |
501 |
Ruptured |
- |
7784 |
Ruptured |
- |
| Main |
458 |
900 |
+ 96.5 |
4754 |
15787 |
+ 232.70 |
| Paracommissural |
313 |
368 |
+ 17.57 |
2566 |
2041 |
- 20.46 |
| Commissural |
443 |
571 |
+ 28.89 |
3408 |
3983 |
+ 16.87 |
| The chordae tendineae attached to P3 |
Paramedial |
550 |
Ruptured |
- |
14610 |
Ruptured |
- |
| Main |
256 |
836 |
+ 226.56 |
2458 |
18953 |
+ 671.07 |
| Commissural |
263 |
581 |
+ 120.91 |
4624 |
12341 |
+ 166.89 |
a von Mises stresses.
b Compared to normal physiological condition; + increase, - decrease.
Computational results showed higher stress magnitudes (0–19 MPa) in the chordae tendineae with respect to the leaflets. The mean stress values during systole in all chordae tendineae branches also were illustrated in Fig. 8. It can be seen from Fig. 8 that the mean stress in the chords attached to the anterior leaflet was higher than posterior chords in the case of the normal valve. The stress values in chordae tendineae decreased by moving away from the midline of the leaflets towards the commissures.
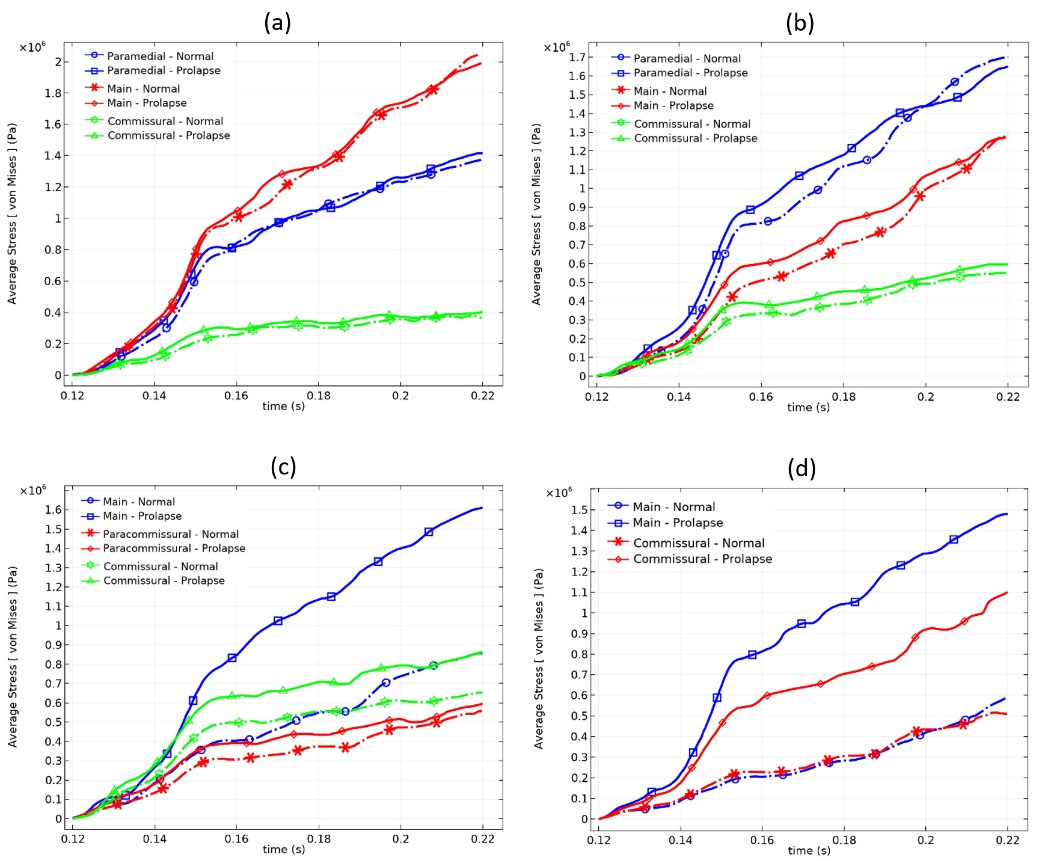
Fig. 8.
Average stress values in the chordae tendineae attached to (A) A1, (B) A3, (C) P1, and (D) P3 scallops during systole.
.
Average stress values in the chordae tendineae attached to (A) A1, (B) A3, (C) P1, and (D) P3 scallops during systole.
Posterior leaflet Prolapse did not have much effect on the mean stress of the anterior chords, and most changes were seen at the commissural chords of the anterior leaflet due to the connection of these chords to both leaflets. As expected, in the absence of the posterior paramedial chords, the adjacent main chords are forced to withstand a lot of tension. Therefore, most of the changes in the mean and maximum stress occur in these chords. More detailed information about stress values of the MV components and their differences rate caused by chordal rupture are reported in Table 3.
Transmitral flow field and mitral regurgitation
The streamlines of transmitral blood flow, as well as the blood velocity magnitudes, are presented in Fig. 9 at peak systole to compare the flow field between the normal and the prolapsed models. From Fig. 9 it is evident that the maximum velocity occurred in the leaflets in the adjacency of the coaptation region. In the prolapse condition, it can be seen more deviation of the regurgitant jet toward the left atrium wall due to the posterior leaflet bulging. Moreover, the cross-sectional area of the regurgitant jet is significantly larger in the prolapsed MV.
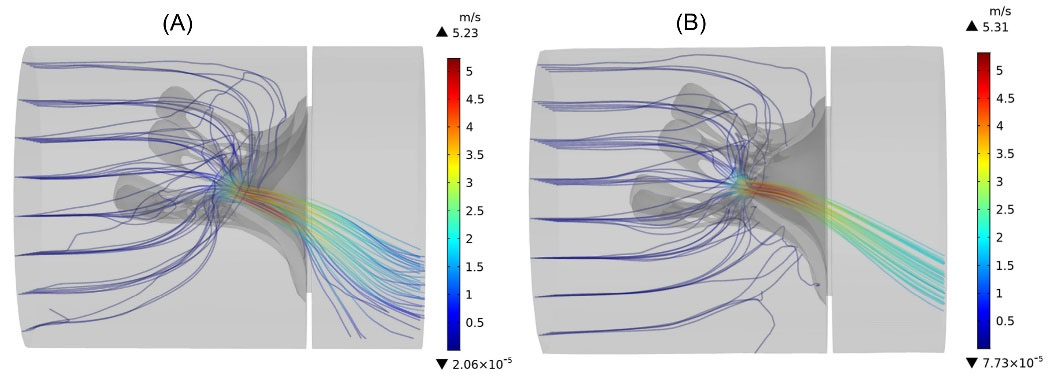
Fig. 9.
The instantaneous streamlines of transmitral flow, colored by the velocity magnitude at peak systole. (A) prolapsed MV (B) normal MV.
.
The instantaneous streamlines of transmitral flow, colored by the velocity magnitude at peak systole. (A) prolapsed MV (B) normal MV.
In terms of blood velocity magnitudes, the maximum speed value in the prolapse condition (5.23
) does not change much compared to the normal MV (5.31
) and is decreased very slightly (by 2%). Numerical results show that the average blood velocity magnitude in the coaptation region of prolapsed valve (2.76
is also approximately 6% less than the normal MV (2.94
).
Fig. 10 indicates the instantaneous regurgitant volume during the whole systole for both conditions. The highest blood volume passing through the normal and prolapsed MV occurred respectively at t = 0.147 s and t = 0.156 s. After this time, the transmitral flow rate started declining slightly in the prolapse case, whereas it took place on a steeper slope in the normal valve. The total regurgitant volume in the normal valve is calculated 21.03 mL, and by a 63% increase, it is 34.22 mL in the prolapsed valve.
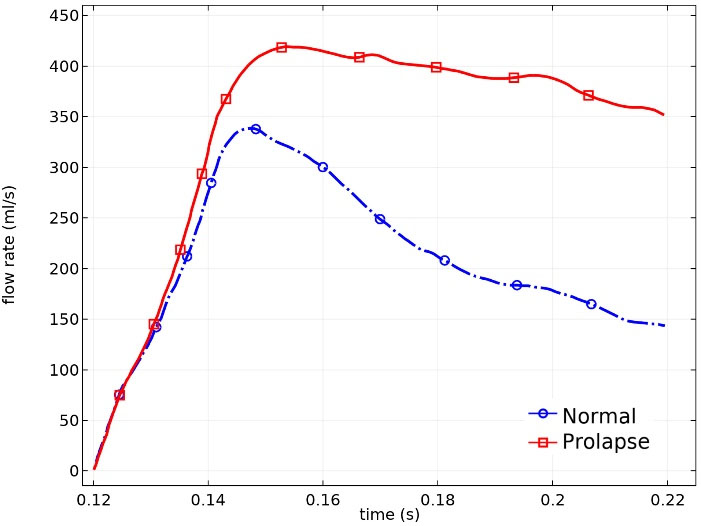
Fig. 10.
Flow rate across the MV during the whole systole.
.
Flow rate across the MV during the whole systole.
Discussion
The posterior leaflet dysfunction due to its acute chord rupture is a common MV disease, and clinical techniques cannot yield any valuable information about pathological MV dynamics. Therefore, this paper presents two computational FSI models of the realistic human MV within the ALE framework to find out the effects of the posterior chordal rupture in the MV function. An accurate and reliable MV geometry reconstruction is the principal step in the MV simulations.7 The previous studies usually modeled the MV under geometrical simplification. For example, as the earliest studies, Kunzelman et al24 and Lau et al3 simulated MV dynamics with symmetric and uniform-thickness geometries. More recently, Khodaei et al14 and Caballero et al25 also investigated the impact of chordae rupture on the left heart dynamics with cable-like structures of chordae tendineae. Although these studies have significantly improved cardiac simulations, sometimes simplifying the simulation geometry can misrepresent the results in pathological states. To the best of the authors' knowledge, this is the first time that an individualized and comprehensive MV geometry is derived from CT imaging data by considering all details of the geometry, especially the intricate and non-uniform structures of the chordae tendineae, and then it is got involved in the computational FSI simulation.
In the present study, the maximum and average amount of stress exerted on the leaflets and chordae tissues is determined during the systolic phase. In the normal physiological condition, it is shown that the average stress value across the anterior leaflet is greater than the posterior leaflet, and the maximum stress value is located on the anterior leaflet belly. These features were observed in almost all the previous studies.7 The mitral leaflets' stress values reported by earlier computational studies seem higher than our predictions.26-29 The main discrepancy between the stress values in this paper and the other computational studies could arise from the individualized features of the current simulation geometry, such as the difference in the non-uniform thickness of the leaflets, and the presence of the complex and realistic structures of the chordae tendineae. From Fig. 7A, Fig. 8A, and Fig. 8B, it is clear that stress increment in the MV components is with a steep slope before the start of valve closure (t ≅ 0.15 s), and after that, it increases with a gentle slope. It is worth noting that this issue occurs in the prolapse condition as well. Similar to Caballero et al25 investigations, the numerical results of the healthy valve also show that the chordae tendineae branches attached to the central region (P2 and A2) of the leaflets are recognized as the load-bearing chords, and carry the majority of the systolic load exerted on the MV apparatus.
The comparison of numerical results shows that the pathological state of chordal rupture severely affected the MV function. The chordae tendineae rupture leads to a significant change in the configuration of MV closure and the development of a large bulging area in the middle scallop of the posterior leaflet known as the prolapse. Similar to the previous findings,24,25 the chordal rupture causes the stress increment in MV components, notably in the P2 and P3 scallops and the adjacent remaining main chordae as reported in Table 3. It is noteworthy that the posterior leaflet prolapse also alters the stress distribution in the anterior leaflet. However, it does not involve any considerable changes in the stress levels of this leaflet.
In terms of transmitral flow, the determined velocity magnitudes demonstrate a reasonable agreement with the previous computational and echocardiography velocity measurement studies.25,30-32 Ascan be seen in Fig. 9B, the posterior leaflet prolapse forces the regurgitant jet to deviate towards the atrium wall. The numerical results also show that incomplete leaflets coaptation and consequently a larger closure orifice in prolapsed MV leads to the decrement of the average velocity in the vicinity of the coaptation region. Furthermore, according to the calculated total regurgitant volume during the systole and the classification of Lancellotti et al,33 the severity of MR in the normal and prolapse models are placed respectively in ‘mild’ and ‘moderate’ ranges.
This study presented the qualitative and quantitative description of the mitral valve behavior simultaneously in the normal physiological and prolapse conditions to distinguish better the differences between both states. Despite some simulation simplifications, computational results showed a reasonable agreement with the data available in the valid references. Simulations of a mitral valve coupled with the detailed and image-based left ventricle and aortic valve geometries under realistic boundary conditions, such as movements of the left ventricle and papillary muscles could be the next advancement in this field. These simulations also highlight the importance of computational modeling in yielding reliable information data that are not obtainable by clinical measurements.
Conclusion
In this study, a detailed MV geometry was derived from CT images with acceptable accuracy for the first time and then it was embedded in the computational FSI simulations. It was found that the manipulated Galerkin finite element method coupled with realistic material properties and boundary conditions could predict the MV behavior robustly. This model also had a significant improvement compared to the previous studies because it provides the mitral valve functional parameters in the form of quantitative and comparative data simultaneously in both normal and pathological conditions. In the normal physiological condition, it was shown that the middle scallops of the leaflets and their related chords carry the majority of the systolic load, and these regions are disposed to rupture. The posterior leaflet prolapse due to chordal rupture led to significant stress changes in the MV components, greater regurgitant flow rate, and also more deviation of the regurgitant jet to the atrium wall. These abnormalities may reduce the MV life and lead to chronic diseases in the future. Therefore, detailed information released in this study offers comprehensive insight to the surgeons for improving the surgical outcome and the procedures of the MV repair in the posterior leaflet prolapse condition.
Research Highlights
What is the current knowledge?
√ Mitral valve simulation with simplifications of geometry such as symmetric leaflets with a uniform thickness or manual designing, etc.
What is new here?
√ An individualized and comprehensive mitral valve geometry is derived from Computed Tomography imaging data.
√ Considering key elements of the geometry, especially the intricate and non-uniform structures of the chordae tendineae.
√ Analysis of the mitral valve mechanical behaviors simultaneously in healthy and prolapse conditions
Acknowledgments
The authors are grateful to Valiasr hospital imaging center, Tabriz, Iran, for their partial support of this project.
Competing Interests
The authors declare no competing interests.
Ethical Statement
There is none to be declared.
References
- Freed LA, Levy D, Levine RA, Larson MG, Evans JC, Fuller DL. Prevalence and Clinical Outcome of Mitral-Valve Prolapse. N Engl J Med 1999; 341:1-7. doi: 10.1056/NEJM199907013410101 [Crossref] [ Google Scholar]
- Gabriel V, Kamp O, Visser CA. Three-dimensional echocardiography in mitral valve disease. Eur J Echocardiogr 2005; 6:443-454. doi: 10.1016/j.euje.2005.02.007 [Crossref] [ Google Scholar]
- Lau KD, Diaz V, Scambler P, Burriesci G. Mitral valve dynamics in structural and fluid–structure interaction models. Med Eng Phys 2010; 32:1057-1064. doi: 10.1016/j.medengphy.2010.07.008 [Crossref] [ Google Scholar]
- Bothe W, Kvitting JPE, Swanson JC, Hartnett S, Ingels NB, Miller DC. Effects of different annuloplasty rings on anterior mitral leaflet dimensions. J Thorac Cardiovasc Surg 2010; 139:1114-1122. doi: 10.1016/j.jtcvs.2009.12.014 [Crossref] [ Google Scholar]
- Sacks MS, Merryman WD, Schmidt DE. On the biomechanics of heart valve function. J Biomech 2009; 42:1804-1824. doi: 10.1016/j.jbiomech.2009.05.015 [Crossref] [ Google Scholar]
- Sun W, Martin C, Pham T. Computational Modeling of Cardiac Valve Function and Intervention. Annu Rev Biomed Eng 2014; 16:53-76. doi: 10.1146/annurev-bioeng-071813-104517 [Crossref] [ Google Scholar]
- Gao H, Qi N, Feng L, Ma X, Danton M, Berry C. Modelling mitral valvular dynamics–current trend and future directions. Int J Numer Method Biomed Eng 2017; 33:e2858. doi: 10.1002/cnm.2858 [Crossref] [ Google Scholar]
- Kunzelman KS, Cochran RP, Chuong C, Ring WS, Verrier ED, Eberhart RC. Finite element analysis of the mitral valve. Eur J Heart Fail 1993; 2:326-340. [ Google Scholar]
- Rim Y, Laing ST, McPherson DD, Kim H. Mitral Valve Repair Using ePTFE Sutures for Ruptured Mitral Chordae Tendineae: A Computational Simulation Study. Ann Biomed Eng 2014; 42:139-148. doi: 10.1007/s10439-013-0908-1 [Crossref] [ Google Scholar]
- Rim Y, Choi A, McPherson DD, Kim H. Personalized Computational Modeling of Mitral Valve Prolapse: Virtual Leaflet Resection. PLOS ONE 2015; 10:e0130906. doi: 10.1371/journal.pone.0130906 [Crossref] [ Google Scholar]
- Choi A, McPherson DD, Kim H. Neochordoplasty versus leaflet resection for ruptured mitral chordae treatment: Virtual mitral valve repair. Comput Biol Med 2017; 90:50-58. doi: 10.1016/j.compbiomed.2017.09.006 [Crossref] [ Google Scholar]
- Abedini H, Moghadam AJ. Numerical Simulation of The Impact of Chorda Tendinea Rapture on The Mitral Valve Leaflets Stress By Finite Element Method. Biomedical and Pharmacology Journal 2016; 9:229-238. doi: 10.13005/BPJ/930 [Crossref] [ Google Scholar]
-
Dahl SK, Vierendeels J, Degroote J, Annerel S, Hellevik LR, Skallerud B. FSI simulation of asymmetric mitral valve dynamics during diastolic filling. Comput Methods Biomech Biomed Engin 2012. 15: 121-130. 10.1080/10255842.2010.517200.
- Khodaei S, Fatouraee N, Nabaei M. Numerical simulation of mitral valve prolapse considering the effect of left ventricle. Math Biosci 2017; 285:75-80. doi: 10.1016/j.mbs.2016.12.008 [Crossref] [ Google Scholar]
- Carpentier A, Adams DH, Filsoufi F. Carpentier's reconstructive valve surgery: from valve analysis to valve reconstruction. Elsevier Health Sciences 2011.
- Castillo JG, Anyanwu AC, El-Eshmawi A, Adams DH. All anterior and bileaflet mitral valve prolapses are repairable in the modern era of reconstructive surgery. Eur J Cardiothorac Surg 2013; 45:139-145. doi: 10.1093/ejcts/ezt196 [Crossref] [ Google Scholar]
- Kumar N, Rao VV. Hyperelastic Mooney-Rivlin model: determination and physical interpretation of material constants. Parameters 2016; 2:01. [ Google Scholar]
- May-Newman K, Yin FC. Biaxial mechanical behavior of excised porcine mitral valve leaflets. Am J Physiol 1995; 269:H1319-27. doi: 10.1152/ajpheart.1995.269.4.H1319 [Crossref] [ Google Scholar]
- Ma X, Gao H, Griffith BE, Berry C, Luo X. Image-based fluid–structure interaction model of the human mitral valve. Computers & Fluids 2013; 71:417-425. doi: 10.1016/J.COMPFLUID.2012.10.025 [Crossref] [ Google Scholar]
- Jensen MØ, Fontaine AA, Yoganathan AP. Improved In Vitro Quantification of the Force Exerted by the Papillary Muscle on the Left Ventricular Wall: Three-Dimensional Force Vector Measurement System. Ann Biomed Eng 2001; 29:406-413. doi: 10.1114/1.1366672 [Crossref] [ Google Scholar]
- Mishra PP, Rao MP, Paranjape V, Kulkarni JP. Morphometry of mitral valveMedical Journal of Dr.D.Y. Patil University 2014; 5:625-630. doi: 10.4103/0975-2870.140453 [Crossref] [ Google Scholar]
- Lobo FL, Takeda FR, Brandão CM, Braile DM, Jatene FB, Pomerantzeff PM. Study of the traction resistance of mitral valve chordae tendineae. Clinics (São Paulo, Brazil) 2006; 61:395-400. doi: 10.1590/s1807-59322006000500005 [Crossref] [ Google Scholar]
- Abdelghani M, Spitzer E, Soliman OI, Beitzke D, Laggner R, Cavalcante R. A simplified and reproducible Method to Size the Mitral Annulus: Implications for Transcatheter Mitral Valve Replacement. Eur Heart J Cardiovasc Imaging 2017; 18:697-706. doi: 10.1093/ehjci/jew132 [Crossref] [ Google Scholar]
- Kunzelman KS, Einstein DR, Cochran RP. Fluid-structure interaction models of the mitral valve: Function in normal and pathological states. Philos Trans R Soc Lond B Biol Sci 2007; 362:1393-406. doi: 10.1098/rstb.2007.2123 [Crossref] [ Google Scholar]
- Caballero A, Mao W, McKay R, Primiano CH, Hashim S, Sun W. New insights into mitral heart valve prolapse after chordae rupture through fluid–structure interaction computational modeling. Sci Rep 2018; 8:17306. doi: 10.1038/s41598-018-35555-5 [Crossref] [ Google Scholar]
- Wenk JF, Zhang Z, Cheng G, Malhotra D, Acevedo-Bolton G, Burger M. First finite element model of the left ventricle with mitral valve: insights into ischemic mitral regurgitation. Ann Thorac Surg 2010; 89:1546-1553. doi: 10.1016/j.athoracsur.2010.02.036 [Crossref] [ Google Scholar]
- Stevanella M, Krishnamurthy G, Votta E, Swanson JC, Redaelli A, Ingels NB. Mitral leaflet modeling: Importance of in vivo shape and material properties. J Biomech 2011; 44:2229-2235. doi: 10.1016/j.jbiomech.2011.06.005 [Crossref] [ Google Scholar]
- Wang Q, Sun W. Finite element modeling of mitral valve dynamic deformation using patient-specific multi-slices computed tomography scans. Ann Biomed Eng 2013; 41:142-153. doi: 10.1007/s10439-012-0620-6 [Crossref] [ Google Scholar]
- Toma M, Jensen MØ, Einstein DR, Yoganathan AP, Cochran RP, Kunzelman KS. Fluid–structure interaction analysis of papillary muscle forces using a comprehensive mitral valve model with 3D chordal structure. Ann Biomed Eng 2016; 44:942-953. doi: 10.1007/s10439-015-1385-5 [Crossref] [ Google Scholar]
- Jobic Y, Slama M, Tribouilloy C, Wah LC, Choquet D, Boschat J. Doppler echocardiographic evaluation of valve regurgitation in healthy volunteers. Br Heart J 1993; 69:109-113. doi: 10.1136/hrt.69.2.109 [Crossref] [ Google Scholar]
- Grayburn PA, Weissman NJ, Zamorano JL. Quantitation of Mitral Regurgitation. Circulation 2012; 126:2005-2017. doi: 10.1161/CIRCULATIONAHA.112.121590 [Crossref] [ Google Scholar]
- Salustri A, Almaghrabi A. Mitral valve disease correlation between the most important echocardiographic parameters and haemodynamics. E-Journal Cardiol Pract 2018; 16:24-26. [ Google Scholar]
- Lancellotti P, Moura L, Pierard LA, Agricola E, Popescu BA, Tribouilloy CH. European Association of Echocardiography recommendations for the assessment of valvular regurgitationPart 2: mitral and tricuspid regurgitation (native valve disease). Eur J Echocardiogr 2010; 11:307-332. doi: 10.1093/ejechocard/jeq031 [Crossref] [ Google Scholar]