Bioimpacts. 13(4):289-300.
doi: 10.34172/bi.2022.24132
Original Research
Differentiation and molecular characterization of endothelial progenitor and vascular smooth muscle cells from induced pluripotent stem cells
Mohammadreza Dastouri 1, *  , Hilal Ozdag 1 , Ahmet Ruchan Akar 2 , Alp Can 3
Author information:
1Ankara University Biotechnology Institute and SISBIYOTEK Advanced Research Unit, Gumusdere Yerleskesi, Kecioren Ankara, 06135, Turkey
2Ankara University School of Medicine, Department of Cardiovascular Surgery, Heart Center Dikimevi, Ankara, 06340, Turkey
3Ankara University School of Medicine, Department of Histology and Embryology, Laboratories for Stem Cells and Reproductive Medicine, Sihhiye, Ankara, 06410, Turkey
Abstract
Introduction:
Pluripotent stem cells have been used by various researchers to differentiate and characterize endothelial cells (ECs) and vascular smooth muscle cells (VSMCs) for the clinical treatment of vascular injuries. Studies continue to differentiate and characterize the cells with higher vascularization potential and low risk of malignant transformation to the recipient. Unlike previous studies, this research aimed to differentiate induced pluripotent stem (iPS) cells into endothelial progenitor cells (EPCs) and VSMCs using a step-wise technique. This was achieved by elucidating the spatio-temporal expressions of the stage-specific genes and proteins during the differentiation process. The presence of highly expressed oncogenes in iPS cells was also investigated during the differentiation period.
Methods:
Induced PS cells were differentiated into lateral mesoderm cells (Flk1+). The Flk1+ populations were isolated on day 5.5 of the mesodermal differentiation period. Flk1+ cells were further differentiated into EPCs and VSMCs using VEGF165 and platelet-derived growth factor-BB (PDGF-BB), respectively, and then characterized using gene expression levels, immunocytochemistry (ICC), and western blot (WB) methods. During the differentiation steps, the expression levels of the marker genes and proto-oncogenic Myc and Klf4 genes were simultaneously studied.
Results:
The optimal time for the isolation of Flk1+ cells was on day 5.5. EPCs and VSMCs were differentiated from Flk1+ cells and characterized with EPC-specific markers, including Kdr, Pecam1, CD133, Cdh5, Efnb2, Vcam1; and VSMC-specific markers, including Acta2, Cnn1, Des, and Myh11. Differentiated cells were validated based on their temporal gene expressions, protein synthesis, and localization at certain time points. Significant decreases in Myc and Klf4 gene expression levels were observed during the EPCs and VSMC differentiation period.
Conclusion:
EPCs and VSMCs were successfully differentiated from iPS cells and characterized by gene expression levels, ICC, and WB. We observed significant decreases in oncogene expression levels in the differentiated EPCs and VSMCs. In terms of safety, the described methodology provided a better safety margin. EPCs and VSMC obtained using this method may be good candidates for transplantation and vascular regeneration.
Keywords: Induced pluripotent stem cells, Endothelial progenitor cells, Vascular smooth muscle cells, Lateral mesoderm cell, In vitro differentiation
Copyright and License Information
© 2023 The Author(s).
This work is published by BioImpacts as an open access article distributed under the terms of the Creative Commons Attribution Non-Commercial License (
http://creativecommons.org/licenses/by-nc/4.0/). Non-commercial uses of the work are permitted, provided the original work is properly cited.
Introduction
Angiogenesis allows the physiological needs of an organism to be met in postnatal life and helps to provide oxygen to ischemic tissues or tumors; whereas vasculogenesis, provides new vessel formation solely during the embryonic stage. Nevertheless, Asahara et al and Shi et al demonstrated that bone marrow-derived hematopoietic progenitor cells could be differentiated into endothelial cells (ECs) following the embryonic period.1,2 The differentiated ECs were shown to be involved in the re-establishment of endothelial integrity and formation of new capillaries after ischemia. Thus, neo-endothelization and neo-vascularization events have been shown to occur in adult organisms, postnatally.1,2 Circulating endothelial progenitor cells (EPCs), first isolated in 1997 by Asahara et al,1 are known to transform into mature ECs to form a new vessel without any previously organized vascular structure. However, the number of EPCs is low in the vascular system of a healthy adult.3 In normal conditions, EPCs constitute ~0.01% of all blood cells in circulation,4 being stored in the bone marrow and passing into the bloodstream at a constant rate. Many physiological and pathological events have been identified that affect the migration of these cells into the bloodstream.5 The most important factor stimulating EPC translocation into the blood circulation is tissue ischemia and damage.6 Studies in mice suggest that EPCs may also be involved in vessel formation around tumors, in wound healing, hind limb ischemia, and myocardial infarction.7-9
Several research groups have attempted to obtain ECs from a variety of sources, including the blood circulation10-15 and embryonic stem cells,16 with the aim of using them in regenerative medicine. The introduction of induced pluripotent stem (iPS) cells opened up new perspectives for regenerative medicine and stem cell biology. Several laboratories have focused on the in vitro differentiation of ECs from iPS cells; Narazaki et al differentiated ECs from iPS cells in 2008, Suzuki et al in 2010, and Uosaki et al in 2011.17-19 Kdr (Flk1 or VEGFR-2) was considered the master gene in the differentiation of iPS cells into mesodermal cells. It was shown that the level of Flk1protein synthesis peaked on day 4.5 or 5 of mesodermal differentiation. Therefore, it was suggested that days 4.5–5 of differentiation were optimum for bringing cells to a mesodermal state; however, the precise day is still unclear. Moreover, the genes associated with ECs during the differentiation process and the spatial and temporal changes in Flk1 protein synthesis required to gain function are essential elements that remain to be investigated. In addition to the expression of the Kdr gene, different research groups have investigated Flk1protein quantity during differentiation. However, after synthesis, Flk1should be localized in the cell membrane to perform its function.
During the mesodermal differentiation process, we analyzed Kdr gene expression in parallel with the translated protein level and surveyed the expression levels of a series of EPC-specific genes, based on previously published data. Unlike previous studies, this research aimed to differentiate EPCs from iPS cells instead of ECs, in a step-wise manner. We also attempted to differentiate iPS cells to vascular smooth muscle cells (VSMCs), which are involved in vascularization, similar to EPCs. In addition, we evaluated the expression levels of Myc (myelocytomatosis oncogene)and Klf4 (Kruppel-like factor 4) genes, which are more highly expressed in iPS cells during the differentiation of EPCs and VSMCs. To accomplish these aims, differentiation of iPS into lateral mesoderm cells was induced using specific culture conditions. Subsequently, mesodermal cells were isolated and further differentiated into EPCs and VSMCs. Target cells were characterized by validating temporal gene expression, protein synthesis, and performing localization assays at specific time points during the in vitro differentiation procedure. Expression levels of marker genes and proto-oncogenic Mycand Klf4 genes were evaluated simultaneously during mesodermal differentiation.
Expressions of Mycand Klf4, both of which were used as pluripotency reprogramming factors to generate iPS cells, were analyzed to show how they might carry a potential risk after their transplantation.
Materials and Methods
Materials
The mouse iPS cell line iPS-MEF-Ng-20D-17 was purchased from RIKEN Cell Bank in 2010 (http://metadb.riken.jp/metadb/db/rikenbrc_cell/http://metadb.riken.jp/db/rikenbrc_cell/cell_APS0001?viewtype=card, Japan). Many chemicals and reagents were purchased from Thermo Fisher Scientific, USA, unless otherwise stated.
Induced pluripotent stem cell culture and characterization of pluripotency
iPS cells were originally derived from mouse embryonic fibroblasts (MEFs) by transferring four reprogramming factors, Pou5f1 (Oct-3/4), Sox2 [SRY (sex determining region Y)-box 2], Klf4, and Mycusing retroviral vectors. Additionally, they carry a Nanog promoter-driven GFP/IRES/puromycin-resistant gene. For the maintenance of pluripotency during expansion, knockout DMEM (high glucose, without sodium pyruvate) was used as a culture medium, supplemented with 15% fetal bovine serum (FBS), 0.1 mM non-essential amino acids, 0.1 mM 2-mercaptoethanol, 1000 U/mL mouse LIF, and 50 μg/mL penicillin/streptomycin. MEFs treated with mitomycin-C (Sigma-Aldrich, M4287, USA) were used as a feeder layer.
First, we characterized the state of the iPS cells pluripotency using morphological and immunostaining assays. We evaluated the formation and fine structure of the colonies by inverted (Olympus IX71, Japan), confocal (Zeiss LSM 510 Meta, Germany), and scanning electron (Leo 438VP, UK) microscopy. The general structure of the colonies was evaluated by F-actin filament (Atto phalloidin 488; Sigma-Aldrich 49409, USA) and DNA staining (7-aminoactinomycin D, Sigma-Aldrich A9400, USA). Nanog promoter-driven GFP/IRES/puromycin-resistant gene expression was also validated by inverted fluorescent microscopy. To confirm the pluripotency of the iPS cells, we used polyclonal anti–Oct-4 rabbit IgG (Abcam, ab137427, UK), polyclonal anti–Sox2 rabbit IgG (Abcam, ab97959, UK), and anti-SSEA1 as the primary antibodies and goat anti-rabbit FITC (Abcam, ab6717, UK) as the secondary antibody.
Isolation of induced pluripotent stem cells and differentiation to lateral mesodermal lineage
Following expansion of the iPS cells, culture medium containing puromycin was used to isolate transfected cells expressing the puromycin-resistance gene from other MEFs. Before the onset of the in vitro differentiation procedure, as described below, puromycin-resistant cells were further purified using the Pluripotent Stem Cell Isolation Kit (130-095-267 Miltenyi Biotec, Germany) on the magnetic-activated cell sorting (MACS) cell separation system (Miltenyi Biotech, Germany).
To induce the iPS cells to Flk1+ lateral mesodermal cells, we cultured the cells in type IV collagen-coated T25 or T75 polystyrene culture flasks (BD, 354523, USA) using a differentiation medium consisting of α-minimum essential medium (α-MEM), 10% fetal calf serum (FCS), 5×10⁻⁵ mol/L 2-mercaptoethanol, and 50 μg/mL penicillin-streptomycin(Lonza, 17-602E, Switzerland), in the absence of feeder cells (Fig. 1).17 Under these conditions, the differentiation continued for up to 7.5 days.17 Between days 2.5–7.5, parallel samples were analyzed via immunocytochemistry (ICC), flow cytometry (FC), qRT-PCR, and western blot (WB) each day.
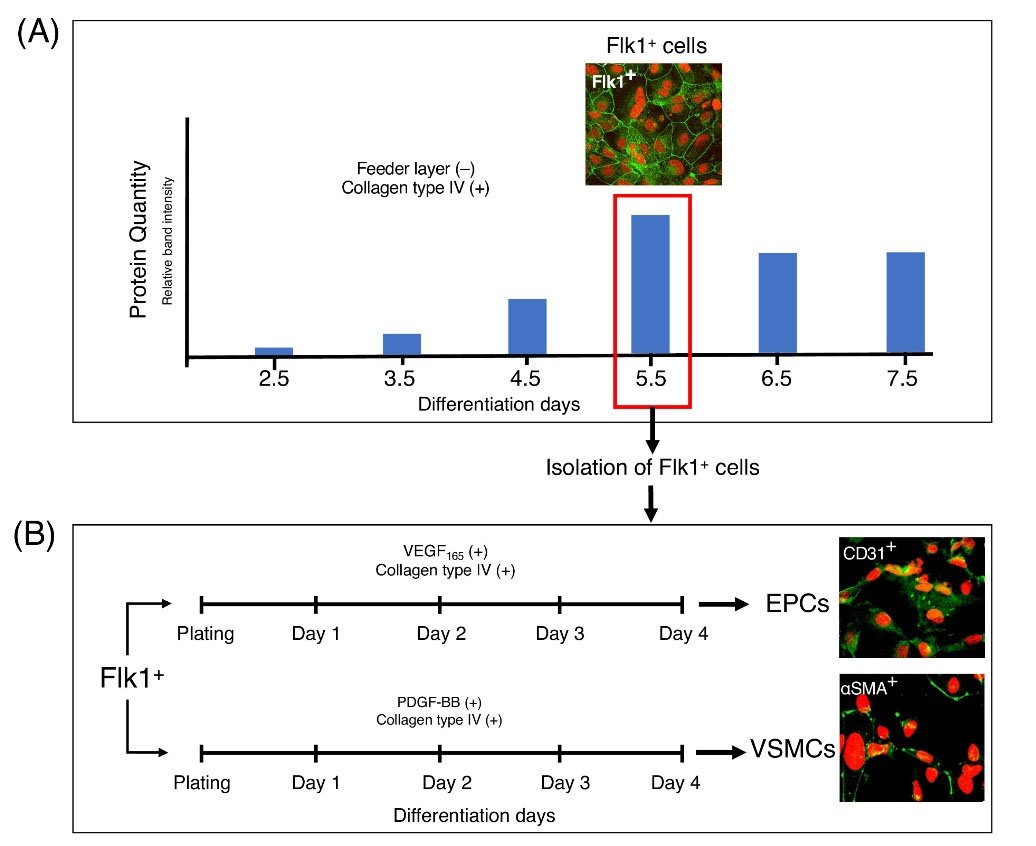
Fig. 1.
Two-step differentiation of mouse embryonic fibroblast-derived iPS cells into mesodermal cells and then EPCs and VSMCs. (A) During the first differentiation period, Day 5.5 Flk1+ cells were chosen for the second step based on protein quantity, gene expression (mRNA levels), Flk1 immunopositivity, and FC results. Day 5.5 Flk1+ cells were isolated using Flk1 - specific microbeads and MACS cell separation. (B) During the second differentiation period, (four days), Flk1+ cells were further induced to obtain EPC and VSMC lineages, using media containing human VGEF165 and PDGF-BB (100 ng/mL each), respectively.
.
Two-step differentiation of mouse embryonic fibroblast-derived iPS cells into mesodermal cells and then EPCs and VSMCs. (A) During the first differentiation period, Day 5.5 Flk1+ cells were chosen for the second step based on protein quantity, gene expression (mRNA levels), Flk1 immunopositivity, and FC results. Day 5.5 Flk1+ cells were isolated using Flk1 - specific microbeads and MACS cell separation. (B) During the second differentiation period, (four days), Flk1+ cells were further induced to obtain EPC and VSMC lineages, using media containing human VGEF165 and PDGF-BB (100 ng/mL each), respectively.
Flk1+ cell isolation
Flk1+ populations were harvested and isolated on day 5.5 of mesodermal differentiation (Fig. 1). Flk1+ and Flk1 - cells were separated using the MACS CD309 (Flk-1) microbead kit (Miltenyi Biotec, 130-097-346, Germany) according to the manufacturer's instructions.
Differentiation of mesodermal cells to endothelial progenitor cells and vascular smooth muscle cells
Based on the experiments described above and previously published methods,17 Flk1+ cells at 5.5 days of differentiation were further differentiated to CD31+ EPCs. After MACS isolation, purified Flk1+ cells were incubated for 4 days in type IV collagen-coated flasks (BD, 354523, USA) using an α-MEM-based differentiation medium containing 10% FCS, 50 μg/mL penicillin-streptomycin (Lonza, 17-602E, Switzerland), 5×10⁻⁵ mol/L 2-mercaptoethanol, and 100 ng/mL human vascular endothelial growth factor-165 (VEGF165). Flk1+ cells were also used to induce VSMC differentiation (Fig. 1); Flk1+ cells were incubated in type IV collagen-coated flasks (BD, 354523, USA) for 4 days in α-MEM-based differentiation medium supplemented with 100 ng/mL human platelet-derived growth factor-BB (PDGF-BB) (Sigma-Aldrich, SRP6296, USA).
Molecular characterization of differentiated cells in each stage
Flow cytometric (FC) analysis
FC analysis was performed to determine the percentage of differentiated Flk1+ cells on each day of the differentiation period (2.5 to 7.5). Differentiated cells were harvested and gently dissociated with enzyme-free, PBS-based, cell dissociation buffer. Dissociated cells were stained with anti-CD309 (Flk1) mouse monoclonal antibody (Clone no: Avas12a1), conjugated with APC, in the dark for 30 min. After washing cells twice, they were analyzed on a flow cytometer (BD, Accuri C6, USA). Based on the ICC data, we repeated this process on days 3.5, 4.5, and 5.5 of the differentiation period.
qRT-PCR analysis
Total RNA was isolated from samples taken at each stage of differentiation, using TRIzol. A total of 500 µg RNA which was isolated, was used for cDNA synthesis with the Transcriptor First Strand cDNA Synthesis Kit (Roche, 04896866001, Switzerland). After designing the primers for qRT-PCR analysis, annealing temperatures were optimized (Table 1). Changes in gene expression levels during differentiation were analyzed using a Roche LightCycler 480 real-time polymerase chain reaction (PCR) system. H2afz (H2A histone family, member Z) and Hprt (Hypoxanthine guanine phosphoribosyl transferase) were used as internal standards for measuring RNA levels,20 as these genes are stably expressed during development and cell culture. The expression levels of genes associated with mesodermal, endothelial, and smooth muscle cell differentiation were assessed each day. Gene expression levels on day 5.5 of the first differentiation stage were used as controls for the second stage in the qRT-PCR analysis.
Table 1.
List of primers used for qRT-PCR analysis
|
Gene Official Symbol
|
Annealing Temp (°C)
|
Cycles
|
Primer Sequences
|
Product Length
|
Reference Sequence
|
|
CD133
|
60 |
40 |
F:ACAAATGCGGCGGAGAGATGC
R:CCGAGTCCTGGTCTGCTGGTA |
149 |
>NM_001163582.1 |
|
Myc |
60 |
40 |
F: CCCATTACAAAGCCGCCGACTC
R: ACTGGTGGGCTTCTCTGGTTCT |
125 |
NM_019660.3 |
|
Cnn1
|
60 |
40 |
F:CACAAGTTCAGTCCACTCTCCT
R:CCAATGATGTTCCTGCCTTCTC |
142 |
>NM_009922.4 |
|
Pecam1
|
60 |
40 |
F:AGCAAGAAGCAGGAAGGACAGT
R:CCAATGACAACCACCGCAATGA |
143 |
>NM_001032378.2 |
|
Des
|
60 |
40 |
F:ACCTTCTCTGCTCTCAACTTCC
R:CTCGCTGACAACCTCTCCATC |
120 |
>NM_010043.2 |
|
Efnb2
|
60 |
40 |
F:CTCAACTGTGCCAGACCAGAC
R:TATCCAGGCCCTCCAAAGACC |
145 |
>NM_010111.5 |
|
Kdr |
60 |
40 |
F:CGCTGTGAACGCTTGCCTTATG
R:GCTCGCTGTGTGTTGCTCCTT |
190 |
>NM_010612.2 |
|
H2az1
|
60 |
40 |
F:CTCGTCTCTTCCTCGCTCGT
R:CCGTGGCTGGTTGTCCTAGAT |
176 |
>NM_001316995.1 |
|
Hprt
|
60 |
40 |
F: GTTGGGCTTACCTCACTGCT
R: TAATCACGACGCTGGGACC |
125 |
>NM_013556.2 |
|
Klf4
|
60 |
40 |
F: TGCCAGAGGAGCCCAAGCCAAA
R: ATTTCCACCCACAGCCGTCCCA |
186 |
>NM_010637.3 |
|
Myh11 |
60 |
40 |
F:CCATTGCCGACACAGCCTACAG
R:AGGATGCCACCACAGCCAAGTA |
135 |
>NM_001161775.1 |
|
Vcam1
|
62 |
40 |
F:ACACTCAAAGAAAGGGAGACTG
R:ACTTCATTATCTAACTTCCTGCCC |
179 |
>NM_011693.3 |
|
Cdh5
|
60 |
40 |
F:CCAGCGACACTTCTACCACTTC
R:CTGTCACTGGTCTTGCGGATG |
129 |
>NM_009868.4 |
|
Acta2
|
60 |
40 |
F:TGTGCTGGACTCTGGAGATGGT
R:ATCTCACGCTCGGCAGTAGTCA |
171 |
>NM_007392.3 |
Immunocytochemistry (ICC)
Cells were cultured on gelatin or collagen type IV-coated glass coverslips in 24-well plates during the differentiation periods. Cells were fixed with 4% paraformaldehyde for 20 minutes at room temperature. Following fixation, the coverslips were rinsed with PBS and incubated with the following primary antibodies overnight at 4°C: anti-VEGFR2 (1:50 dilution; Abcam, ab45010, UK), anti-Oct-4 (1:100 dilution; Abcam, ab137427, UK), anti-CD31 (1:100 dilution; Abcam, ab28364, UK), anti-CD133 (1:200 dilution; Abcam, ab19898, UK), anti-αSMA (1:200 dilution; Abcam, ab5694, UK); and anti-SSEA1 antibody (1:100 dilution; Invitrogen, 41-1200). After washing twice with PBS, the cells were incubated with the following secondary antibodies for 90 min at 37°C: Alexa Fluor-488 goat anti-rabbit, 1:500 dilution; Alexa Fluor-594 goat anti-mouse, 1:500 dilution; FITC-goat anti-rabbit, 1:500 dilution (Sigma-Aldrich, F6005, USA). Atto Phalloidin 647N (Sigma-Aldrich, 65906, USA) in pure methanol (1:10) was used for F-actin staining and 7-aminoactinomycin D (10 µM) (Sigma-Aldrich, A9400, USA) was used for DNA labeling. A laser scanning confocal microscope (Zeiss LSM 510 Meta, Germany) was used to scope and obtain serial optical sections.
Western blotting
Whole-cell aggregates at various stages of differentiation were lysed in RIPA buffer supplemented with protease inhibitor cocktail (Abcam, ab65621, UK). The protein content of each sample was measured using the BCA Protein Assay kit. Lysates were separated by SDS-polyacrylamide gel electrophoresis and transferred to nitrocellulose membrane using the iBlot system (Life Technologies, USA). Membranes were blocked with 5% bovine serum albumin in Tris-buffered saline with Tween 20 (TBST), washed thoroughly, and incubated overnight at 4°C with the primary antibodies. Anti-VEGFR2 (1:500 dilution; Abcam, ab45010, UK) was used to validate the Flk1 protein as a mesodermal cell marker; anti-CD31 (PECAM-1) (1:500 dilution; Abcam, ab28364, UK) was used to validate it as an endothelial transformation; and anti-β actin (1:500 dilution; Abcam, ab8226, UK) validated it as an internal standard. Membranes were washed with TBST and incubated for 1 hour at room temperature with peroxidase-conjugated goat anti-rabbit IgG (1:2000 dilution; Abcam, ab6721, UK). For signal detection, we used enhanced chemiluminescence (LumiGLO® Reagent and Peroxide 20X, Cell Signaling, 7003, UK) and the LI-COR Odyssey Fc Imaging System (USA).
Statistical analysis
Gene expression profiles (ΔΔCT), obtained via qRT-PCR, for each differentiation day were assessed by one-way analysis of variance (ANOVA). The Shapiro-Wilk and Kolmogorov-Smirnov tests were used to test the normal distribution of the data. Box-Cox transformation was applied when data did not fulfill the normal distribution condition. The DUNCAN significance test (P < 0.05) was used for multiple comparison tests.
Results
Characterization of the iPS cells
Embryonic mouse fibroblast-derived iPS cell colonies, with or without a feeder layer (puromycin-resistant), were initially characterized morphologically and representative images are provided in Fig S1A and B (see Supplementary file 1). Nanog-GFP signal was used as a marker of pluripotency and was detected in homogeneously-labeled living iPS cell colonies (Fig. S1C). Further characterization of cells within the colonies was done using scanning electron microscopy (Fig. S1D). F-actin decorations, detected by confocal 3-D image stacks, demonstrated cell borders (subplasmalemmal staining) and F-actin aggregates in cell protrusions (Fig S1E and S1F). Before the differentiation steps, the pluripotency of the iPS cells was further evaluated after the colonies were fixed and stained with antibodies against Oct-4 and SSEA1 proteins (Fig. S2). Oct-4 and Nanog (intrinsically expressed with GFP) were confined to cell nuclei, whereas SSEA1 staining was restricted to cell membranes.
Differentiation of iPS cells to Flk1+ cells
Purified populations of feeder-free pluripotent iPS cells were induced to Flk1+ cells (lateral mesodermal lineage) for 2.5 to 7.5 days in the induction medium. Cell morphology was monitored by inverted, confocal, and electron microscopy during the in vitro differentiation from iPS cells to mesodermal cells. Plated iPS cell colonies began to disintegrate on day 3 as the cells separated from each other and extended lamellipodia and several microspike-like protrusions (Fig. 2A-D). The iPS cells tightly adhered to the collagen type IV-coated flask surface and started to differentiate. Electron microscopic images revealed that the Flk1+ cells displayed flat morphology with intercellular protrusions and microprotrusions firmly attached to the collagen type IV-coated surface. In addition, EPC-specific gene expression (Pecam1 [CD31], CD133 [prominin 1], and Cdh5 [cadherin 5]) levels were evaluated, and Expression levels of all detected genes were found to gradually increase, along with Kdr (Fig. 2E-I). Additionally, the Kdr gene-coding protein was measured throughout the differentiation days, during which its quantity was found to significantly increase between days 5–7 (Fig. 2F).
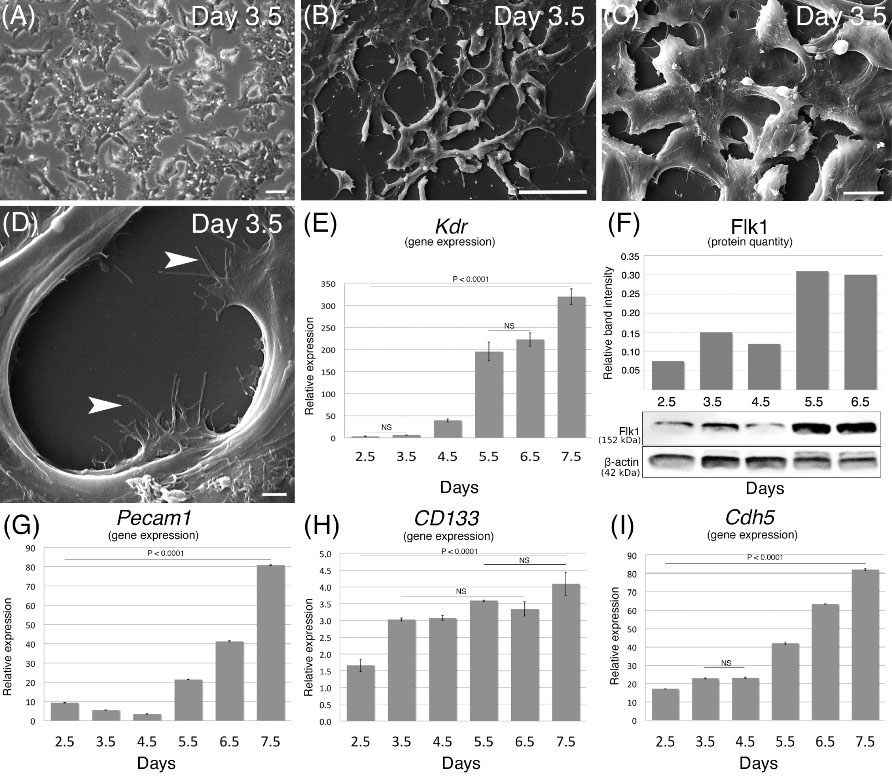
Fig. 2.
Cell morphology, Kdr gene expression, and protein levels during the in vitro differentiation period (2.5 to 7.5 days) of iPS state to mesodermal stage. (A) Feeder layer-free iPS cell colonies at 3.5 day in differentiation medium. (B, C, and D) Low to high power magnifications of scanning electron microscopic images revealing flat Flk1+ cells that firmly attached to the collagen type IV-coated flask surface (arrowheads). (E) The expression level of the Kdr gene compared to undifferentiated iPS cells during 2.5–7.5 days of induction. (F) Synthesized Flk1 protein quantified by western blotting. Relative gene expression levels of (G) Pecam1, (H) CD133, and (I) Cdh5. Scale bars: 50 µm in A, 50 µm in B, 10 µm in C, 2 µm in D.
.
Cell morphology, Kdr gene expression, and protein levels during the in vitro differentiation period (2.5 to 7.5 days) of iPS state to mesodermal stage. (A) Feeder layer-free iPS cell colonies at 3.5 day in differentiation medium. (B, C, and D) Low to high power magnifications of scanning electron microscopic images revealing flat Flk1+ cells that firmly attached to the collagen type IV-coated flask surface (arrowheads). (E) The expression level of the Kdr gene compared to undifferentiated iPS cells during 2.5–7.5 days of induction. (F) Synthesized Flk1 protein quantified by western blotting. Relative gene expression levels of (G) Pecam1, (H) CD133, and (I) Cdh5. Scale bars: 50 µm in A, 50 µm in B, 10 µm in C, 2 µm in D.
To address the Flk1 protein localization and quantify the differentiated cells, we used ICC, FC, and WB assays. ICC analysis of differentiated cells showed that the Flk1 protein began to increase from day 2.5 of differentiation, gradually increased in later days, localized to cell membranes on day 5.5, and then gradually degraded over the following days (Fig. 3). Flow cytometry assays revealed that the percentage of Flk1+ cells among all cells cultured increased during the differentiation period. The percentage of Flk1+ cells was 2.8% on day 3.5 of differentiation, reaching 7.2% and 24.4% on days 4.5 and 5.5, respectively. In addition, the Flk1+ cell purity was 88.8% after MACS isolation (Fig. 3). WB analysis showed that the protein level during the differentiation period started to increase on day 3.5, reached a peak on day 6.5, and then gradually degraded over the following days (Fig. 2F).
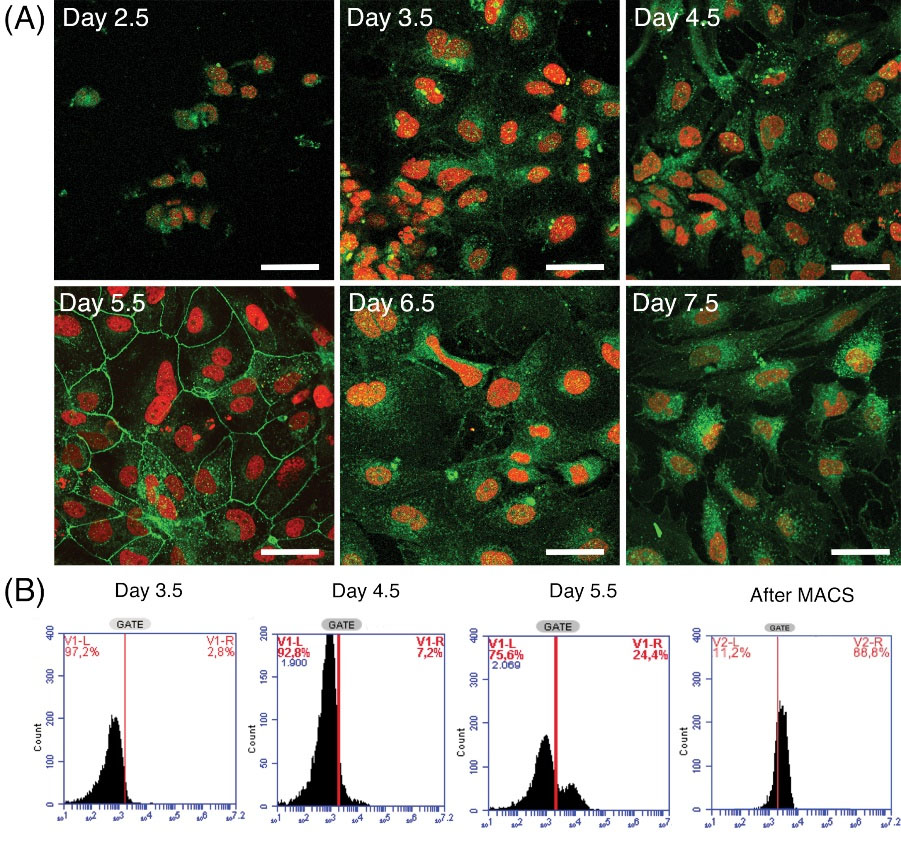
Fig. 3.
Flk1 protein localization and quantification of the differentiating cells as shown by ICC and FC assays. (A) Cellular localization of Flk1 protein (green signal) on successive days of differentiation. (Scale bars; 50 µm). (B) Flow cytometry assays are shown as the percentage of Flk1+ cells among all differentiated cells. Flk1+ cells purity was also measured after MACS cell separation method.
.
Flk1 protein localization and quantification of the differentiating cells as shown by ICC and FC assays. (A) Cellular localization of Flk1 protein (green signal) on successive days of differentiation. (Scale bars; 50 µm). (B) Flow cytometry assays are shown as the percentage of Flk1+ cells among all differentiated cells. Flk1+ cells purity was also measured after MACS cell separation method.
The expression levels of Myc (Myc2) and Klf4, two oncogenes that are among the essential regulators in cell pluripotency, may be an important risk factor upon transplantation of these cells into humans or animals. Here, we evaluated the expression of Myc and Klf4 during the differentiation process. Klf4 expression gradually increased (Fig. 4), whereas Myc did not show any significant difference in expression during the differentiation period (Fig. 4). Hierarchical cluster analysis and a heat map demonstrated that a dramatic onset in gene expression was seen on day 5.5 (Fig. 4), particularly in Kdr, Cdh5, and Pecam1. A less dramatic increase was noted in the Klf4, Myc, and CD133 genes.
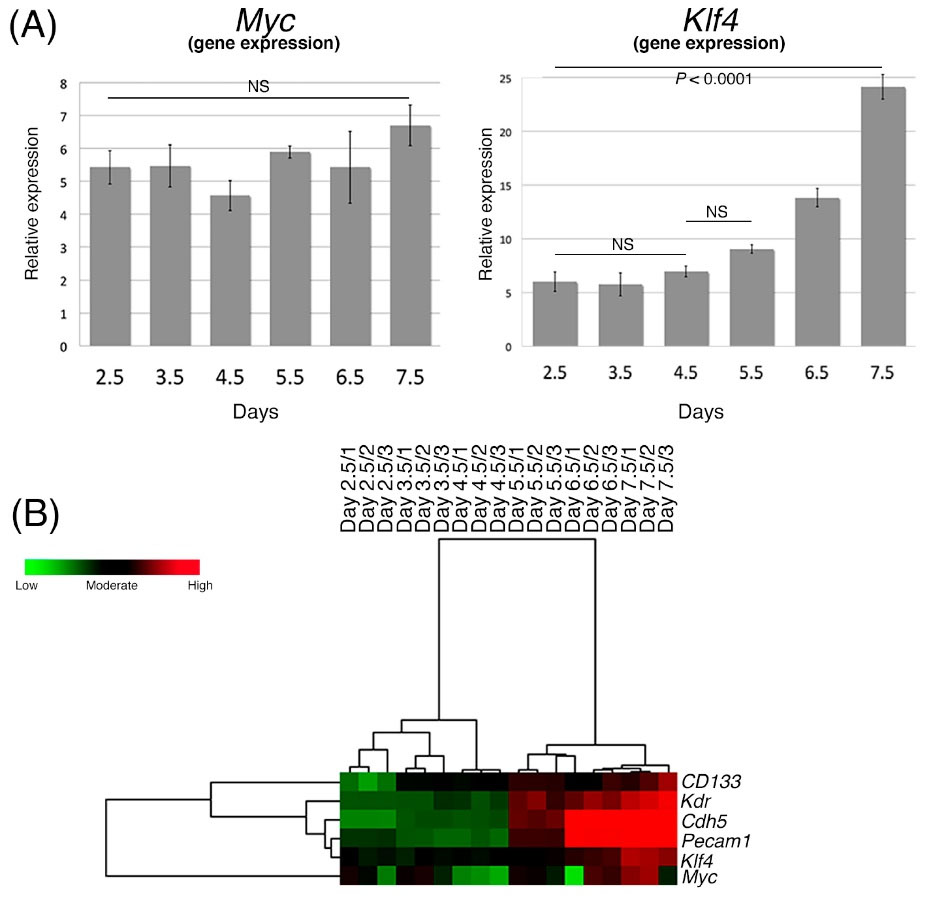
Fig. 4.
Expressions of Myc and Klf4 during the differentiation to lateral mesodermal cells compared with the undifferentiated iPS cells. (A) Gene expression levels of Myc and Klf4 during second differentiation. (B) Hierarchical clustering calculations in a heat map dendrogram showing the distance and similarity between the evaluated genes in a three-color scale, where green shows the lowest expression, black is moderate, and red is the highest. Data are shown in triplicate for each differentiation day from 2.5 to 7.5.
.
Expressions of Myc and Klf4 during the differentiation to lateral mesodermal cells compared with the undifferentiated iPS cells. (A) Gene expression levels of Myc and Klf4 during second differentiation. (B) Hierarchical clustering calculations in a heat map dendrogram showing the distance and similarity between the evaluated genes in a three-color scale, where green shows the lowest expression, black is moderate, and red is the highest. Data are shown in triplicate for each differentiation day from 2.5 to 7.5.
Additionally, the expression levels of a number of smooth muscle cell-specific genes (Acta2 [αSMA], Cnn1 [calponin1], Myh11 [smMHC], Des [desmin]) and arterial (Vcam1, [Vcam-1]) or venous (Efnb2 [EphrinB2]) EC-specific genes were evaluated between days 4.5 and 7.5 of mesodermal differentiation, for comparison with undifferentiated iPS cells. Expression of Vcam1, Efnb2, Acta2, and Des gradually increased between days 4.5 and 7.5 (Fig. 5). Cnn1 expression increased between days 4.5 and 5.5 and then decreased over the following days. Similarly, Myh11 gene expression increased between days 4.5 and 6.5 and then decreased over the following days (Fig. 5). Heat map analysis showed similarities for the six tested genes, with the highest expression levels in the Efnb2/Des set.
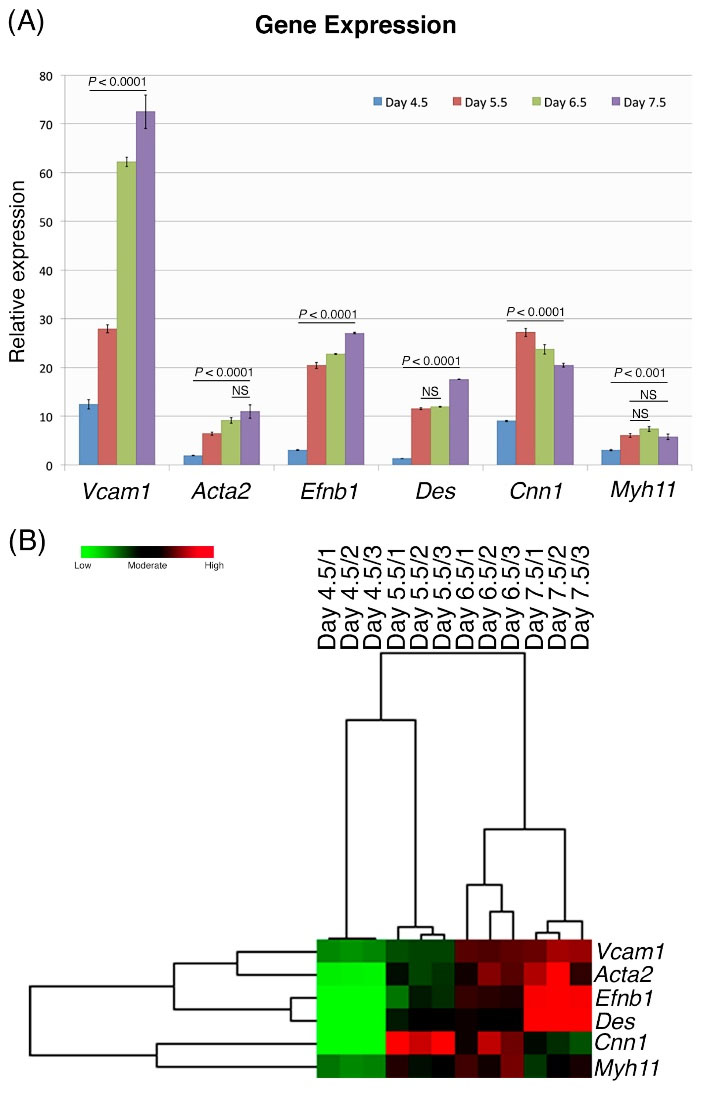
Fig. 5.
Expressions of smooth muscle cell-specific; and arterial (Vcam1) or venous (Efnb2) endothelial cell-specific genes, relative to the same genes in undifferentiated iPS cells during differentiation days 4.5–7.5. (A) Expression levels of all genes on day 4.5 and until day 7.5. (B) Heat map is shown here in triplicate for each differentiation day 4.5–7.5. Based upon their gene expression similarities, the cluster analysis showed that Vcam1/ Acta2, Efnb2 / Des, and Cnn1/ Myh11 were grouped as dual sets.
.
Expressions of smooth muscle cell-specific; and arterial (Vcam1) or venous (Efnb2) endothelial cell-specific genes, relative to the same genes in undifferentiated iPS cells during differentiation days 4.5–7.5. (A) Expression levels of all genes on day 4.5 and until day 7.5. (B) Heat map is shown here in triplicate for each differentiation day 4.5–7.5. Based upon their gene expression similarities, the cluster analysis showed that Vcam1/ Acta2, Efnb2 / Des, and Cnn1/ Myh11 were grouped as dual sets.
Differentiation of Flk1+ cells to vascular endothelial and smooth muscle cells
MACS-isolated Flk1+ cells were induced to differentiate into EPCs and VSMCs using VEGF165– or PDGF-BB–containing media, respectively, in type IV collagen-coated flasks for an additional 4 days. Expression of all EPC-specific genes tested (Kdr, Pecam1, CD133, Cdh5, Efnb2, and Vcam1) showed an increase in VEGF165–treated groups relative to the levels of genes in the control group (day 5.5 of the first differentiation stage) (Fig. 6A). Interestingly, except for Cdh5, we observed that all EPC-specific gene expression levels, particularly Pecam1 expression (46-fold increase), were found to be strikingly higher in VEGF165-treated Flk1+ cells compared to the control group (Fig. 6A). Gene expression levels in arterial endothelial– and venous endothelial-specific genes (Vcam1 and Efnb2) also increased substantially in both the VGEF165–containing groups (Fig. 6A).
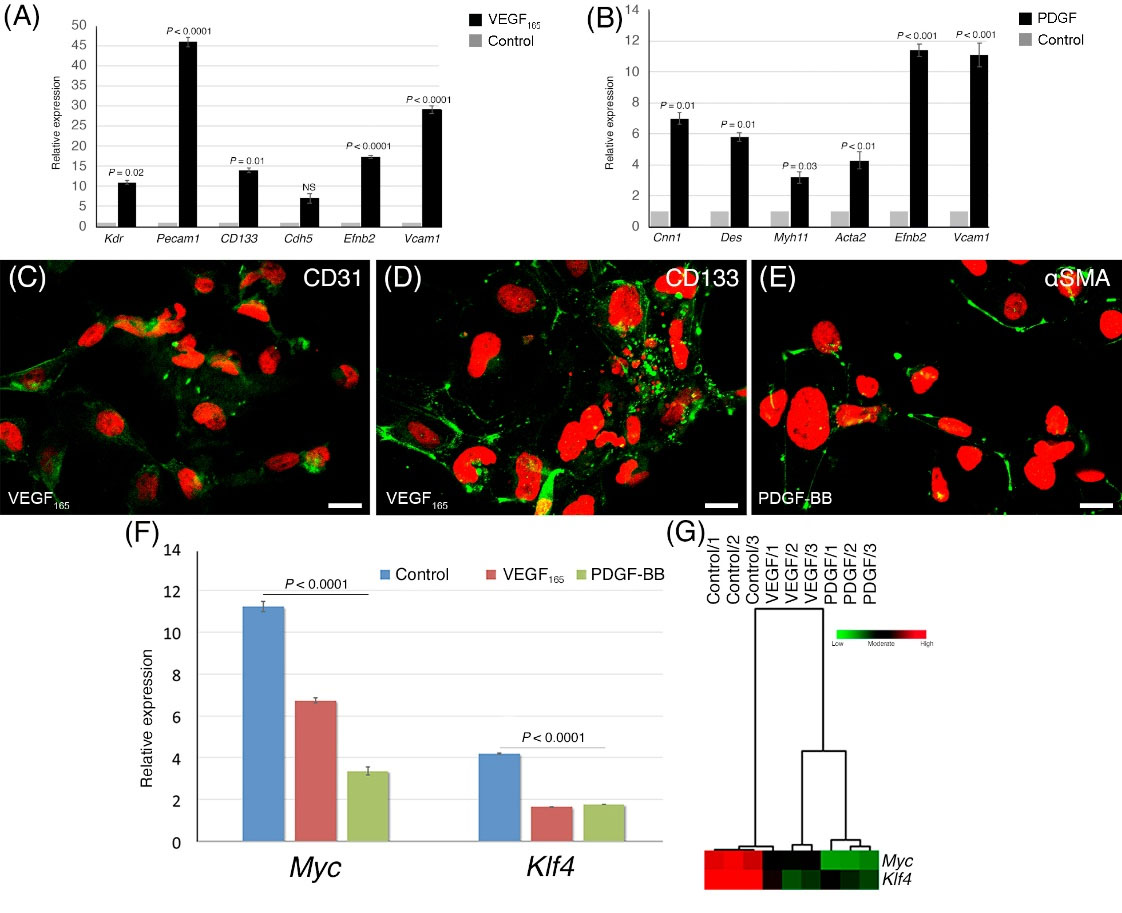
Fig. 6.
Differentiation of Flk1+ cells to vascular endothelial and smooth muscle cells. (A) EPC-specific gene expressions (Kdr, Pecam1, CD133, Cdh5, Efnb2, and Vcam1) following EPC differentiation from Flk1+ cells using VEGF165. (B) Analysis of smooth muscle cell-specific (Cnn1, Des, Myh11, Acta2, Efnb2, Vcam1) gene expression in the PDGF-BB-treated group. Representative images of CD31, AC113 immunopositivity from VEGF165-treated (C and D), and αSMA from PDGF-BB-treated (E) cells after 4 days of induction from Flk1+ cells. (F) Expressions of two oncogenes (Myc and Klf4) during differentiation to EPC and VSMC lineages with the supplementation of VGEF165 or PDGF-BB, compared to the control group. (G) Hierarchical cluster analysis and heat map, after induced by VGEF165 (EPC differentiation) or PDGF-BB (VSMCs differentiation).
.
Differentiation of Flk1+ cells to vascular endothelial and smooth muscle cells. (A) EPC-specific gene expressions (Kdr, Pecam1, CD133, Cdh5, Efnb2, and Vcam1) following EPC differentiation from Flk1+ cells using VEGF165. (B) Analysis of smooth muscle cell-specific (Cnn1, Des, Myh11, Acta2, Efnb2, Vcam1) gene expression in the PDGF-BB-treated group. Representative images of CD31, AC113 immunopositivity from VEGF165-treated (C and D), and αSMA from PDGF-BB-treated (E) cells after 4 days of induction from Flk1+ cells. (F) Expressions of two oncogenes (Myc and Klf4) during differentiation to EPC and VSMC lineages with the supplementation of VGEF165 or PDGF-BB, compared to the control group. (G) Hierarchical cluster analysis and heat map, after induced by VGEF165 (EPC differentiation) or PDGF-BB (VSMCs differentiation).
Smooth muscle cell-specific (Cnn1, Des, Myh11, Acta2, Efnb2, and Vcam1) gene expression assays showed an increase in PDGF-BB-treated Flk1+ cells compared to the levels in the control group (Fig. 6B).
ICC detection of CD31, CD133, and αSMA proteins was used to verify successful differentiation. As summarized in Fig. 6C, D, and E, all three proteins were detected exclusively in differentiated cells: EPC-induced cells (VEGF165) showed strong cell surface staining with CD31 and CD133 antibodies, while striking expression of cytoplasmic αSMA was observed in smooth muscle-induced cells (PDGF-BB).
Expression of Myc and Klf4 was evaluated during differentiation of Flk1+ cells into EPCs and VSMCs. As the EPCs obtained from this study are potential candidates for transplantation, high levels of expression of these genes would be a significant risk factor. Expression of both genes decreased significantly in the VEGF- and PDGF-treated groups, compared with the control group, with a dramatic decline noted in the VEGF165 group and a further decline in the PDGF group (Fig. 6F and G).
Discussion
In this study, EPCs and VSMCs were successfully differentiated in a step-wise manner from iPS cells in vitro. First, iPS cells were differentiated into Flk1+ cells, representing the cells of the lateral mesoderm.Kdr is considered a master gene and, thus, the gold standard for representing lateral mesoderm cells. Kdr is translated into membrane-associated protein during mesodermal cell differentiation.17 Second, the Flk1+ cells were further differentiated into EPCs and VSMCs using lineage-specific growth factors. Characterization of the transformed cells was performed via ICC, based on the localization and distribution of stage-specific proteins. The expressions of specific genes and the quantities of the coded proteins at specified time points were validated by quantitative assays, such as qRT-PCR and WB. However, in vivo functional characterization of the differentiated cells is lacking and requires further research.
In previous studies, expression of Kdr was evaluated as the sole determinant of the duration and success of differentiation into lateral mesoderm.18 In the present work, in addition to expression analysis of 10 genes, we applied ICC, WB, and FC techniques to validate target cell stage and function. Marker gene expression was assessed in order to determine the outcome of the differentiation process and delineate the optimum day of cell isolation for the next step.
First, we verified the expression of the Kdr gene using a protein detection assay during the lateral mesodermal differentiation. According to our WB assays, which were similar to those obtained by ICC, the relative quantities of Flk1 protein from day 2.5 to day 6.5 were 0.1, 0.02, 0.11, 0.26, and 0.16, respectively. Although qRT-PCR showed that peak gene expression occurred on day 7.5, protein assays demonstrated the highest protein levels to be on day 5.5. This discordance may be due to post-transcriptional mechanisms. In a pioneering study by Suzuki et al, the expression of the Kdr gene during the in vitro differentiation of iPS cells was demonstrated throughout a 5-day differentiation period, with simultaneous qRT-PCR analysis; the expression of Kdr steadily increased up to day 5 and decreased thereafter.18 Kohler et al reported a dramatic increase when they compared the expression levels of Kdr, Pecam1, and Cdh5 on days 0 and 521; our results were found to be consistent with this published data. However, we found an increase in the expression of Kdr, Pecam1, and Cdh5, in addition to CD133, for up to 7 days. In 2008, Narazaki et al showed the gradual increase of Kdr that started on day 0 and peaked on day 4.17 Taken together, the difference between our results and theirs may be because of the age of the iPS cells (the passage number) and/or variations in the reagents used.
In addition to the use of gene expression assays, differentiation of iPS cells into Flk1+ cells was analyzed daily between days 2.5 and 7.5 using flow cytometry and ICC techniques, based on the distribution of de novo synthesized stage-specific proteins. Previous studies have demonstrated Flk1 positivity around days 4.5 and 5.17,18,22,23 In our study, Flk1 protein peaked on day 6.5, as shown in Figs. 4 and 5. However, as illustrated by the ICC assays, cell membrane localization was optimal on day 5.5, while on day 6.5, the protein was gradually translocated to the cytoplasm; it is possible that protein degradation via the proteolytic pathway then occurred. Our FC analysis confirmed the ICC results: proportions of Flk1+ cells were 1.3% on day 2.5, 2.8% on day 3.5, 7.2% on day 4.5, and 24.4% on day 5.5. Other studies have shown that Kdr expression peaks at different times; for example, the highest ratio of Flk1+ cells was identified by Suzuki et al on day 4.5 (27%), Nazaraki et al on day 5.5 (16.2%), and Niwa et al on day 5 (ratio not given). As these results seem to correspond with our own,17,23,24 we conclude that the most appropriate time point for isolating functional Flk1+ cells is between days 5 and 5.5, rather than later time points.
Flk1 is primarily localized in the cell membrane of differentiating mesodermal cells as the VEGFR2 receptor.25 The addition of VEGF165 into the differentiation medium, induced the VEGFR2 receptors, resulting in differentiation of these mesodermal cells into EPC cells. Following differentiation, VEGFR2 is gradually transferred into the cytoplasm and degraded. In parallel with these steps, EPC markers such as Pecam1, Cdh5, and CD133 genes are stimulated, expressed, and translated into cell membrane-associated protein molecules. Therefore, in addition to Flk1positivity, we determined the expressions of other aforementioned genes to trace and validate our differentiation protocol towards the target cell types (i.e., EPCs and VSMCs). There are only a few published studies in the literature that investigate the temporal expression of these master genes (up to three genes) throughout the differentiation of iPS cells to Flk1+ cells.17,21 In our study, the expression of six EPC- and four smooth muscle cell-related genes were analyzed on successive differentiation days. The expression of Pecam1 and Cdh5 genes were found to be similar to the results of others.17,21-23 However, we also performed CD133 gene expression and protein localization assays. As a result, the targeted EPCs were successfully obtained from MEF-derived iPS cells in two consecutive stages over 11 days of differentiation.
During the 7.5 days of differentiation, we detected a significant and gradual increase in the expression levels of venous EC marker genes (Efnb2, Vcam1), starting from day 4.5. In a 2006 study, Lanner et al observed that during the differentiation of embryonic stem cells to EPCs, Efnb2 gene expression increased gradually and peaked on day 8 in an 8-day differentiation protocol.24 In 2011, Uosaki et al showed the differentiation of iPS cells into Vcam-1+ cells and observed that gene expression started to increase from day 5 onwards, peaking on days 9 to 11.19 In addition to the above genes, it was previously shown that the expression levels of a series of VSMCs marker genes (Acta2, Cnn1, Des,and Myh11) peak between days 6–9. In 2009, Xie et al obtained smMHC+ cells from iPS cells; during which expression of the Myh11gene increased and reached a plateau between 4-9 days.26 On the contrary, our findings showed that Myh11 expression peaked on day 6.5 and then started to decline on day 7.5. Stefanska et al reported that Acta2 expression started on day 4 and peaked on day 7.27 Besides addressing the above-mentioned genes, we addressed the expression of the Des and Cnn1 genes, both of which encode proteins abundant in VSMCs. It was noteworthy to observe that muscle cell proteins increased and then decreased in parallel to the venous/arterial endothelial-specific molecules. Our results confirmed that our differentiation protocol, which enabled us to complement partly published previous results, provided successful differentiation as proven by previously published data.
We found increased expression of the Pecam1 gene in the Flk1+ group relative to levels of the control group. In addition, the expressions of Efnb2 and Vcam1, relating to the arterial and venous EC lineages, respectively, in the VEGF165 group were higher than in the PDGF-BB group. These results correspond with the results of Lanner et al.24 The results obtained for Cnn1 gene expression were in agreement with the results of Narazaki et al.17 However, to our knowledge, there is no published study that compares the analysis of Des and Myh11 gene expressions. According to the data obtained by the ICC assays, the smooth muscle cells obtained at this stage displayed αSMA positivity, which was similar to the cells reported by Stefanska et al.27
The intrinsically high Myc and Klf4 gene expression levels in the initial stages of differentiation, which are considered "risk factors", may cause serious health problems with regard to cell transplantation. However, our results revealed that as the cells differentiated towards EPC and VSMC lineages, their Klf4 and Myc expressions dramatically reduced to a level where cells have the potential to be used in cardiovascular diseases. Nevertheless, specific loci such as SNV or CNV should be strictly analyzed by comparing genetic abnormalities before and after differentiation. Thus, these loci will be used as targets for the future identification of potential genetic aberrations using quantification based on qRT-PCR assays.
Conclusion
The differentiation of iPS cells to lateral mesodermal cells and their characterization have been studied by several research groups, using a limited number of specific genes and proteins. Our study is distinct from the previous studies because it uses different characterization and validation methods, such as ICC, WB, and FC to analyze the expression levels of 10 specific genes.
In this study, EPCs were successfully differentiated from lateral mesodermal cells instead of ECs because EPCs are thought to have a higher potential for revascularization than ECs. EPCs are also considered more adaptable to the tissue when used in clinical transplantation because the final differentiation of these cells occurs in the transplanted tissue, allowing them to adapt to the local cells.
In addition, VSMCs, which are similar to EPCs and play a pivotal role in vascularization, were differentiated from lateral mesodermal cells, in parallel with EPC differentiation. The use of multiple markers for characterization of these cells adds value to this study. Additionally, we successfully addressed the differentiation potential of the obtained EPCs as arterial and venous ECs and validated differentiation by analyzing Efnb2 and Vcam1 gene expression levels. From a translational perspective, EPCs and VSMCs obtained from iPS cells, as final products, have the potential to be used therapeutically in cardiovascular disorders. However, a similar approach should be used to test the differentiation capacity of further iPS cell lines in the future, before the adoption of such cells into translational clinical trials.
A viral-based reprogramming approach was implemented in this study. We aimed to use the iPS cell-derived EPCs and VSMCs in the future for in vivo animal models (i.e., mouse) to observe their therapeutic effects. Upon obtaining consistent and successful results, non-integrating, virus-free, and patient-specific iPS cells could be used in human translational studies in the future.
However, for clinical use, the risk of malignant transformation should be minimized or eliminated. The oncogenes Myc and Klf4 have roles in cell proliferation and are also active and highly expressed in pluripotent stem cells, especially iPS cells. Following cell transplantation, high expression levels of these oncogenes may pose a risk to the recipient. Therefore, before transplantation of the cells, which may be designated “the end product”, it is imperative to determine the expression levels of Mycand Klf4 and evaluate any risk potentials associated with these genes. Over the course of both differentiation stages, we observed significant decreases in the expression of the two oncogenes in differentiated EPCs and VSMCs. In terms of potential clinical risk, our results confirmed a “safe state” by applying the described methodology. However, the decrease in Myc and Klf4 gene expression levels alone does not guarantee that these cells would not cause any oncogenic transformation; therefore, the presence of additional genomic abnormalities before and after iPS cell differentiation should be further investigated.
Research Highlights
What is the current knowledge?
√ Various protocols have been proposed for the isolation of Flk1+ cells during in vitro differentiation of mesodermal cells from iPS cells.
√ In most studies, only Kdr gene expression has been used to characterize lateral mesoderm cells during differentiation.
√ ECs and SMCs from mesodermal cells are characterized by a few specific markers.
What is new here?
√ The optimal day for isolation of mesodermal cells was precisely determined by 10 different gene expression and protein assays.
√ EPCs and VSMCs cells were successfully differentiated from mesodermal cells and characterized by six specific markers.
√ A significant decline was noted in oncogene expression in differentiated EPCs and VSMCs compared to iPS cells.
√ End-term differentiated EPCs and VSMCs might be considered as candidates for transplantation and vascular regeneration.
Acknowledgments
We thank the Scientific Research Projects (BAP) section of Ankara University for their support (Research Grant: BAP-10B0216001). We also thank the Biotechnology Institute of Ankara University for their assistance with cell cultures and experiments. Our appreciation is extended to Prof. Dinender Singla and Prof. S. Yamanaka for providing the iPS cells from their labs and their technical guidance during the experiments.
Funding sources
This study was supported by the Scientific Research Projects (BAP) of Ankara University (Research Grant: BAP-10B0216001).
Ethical statement
There is none to be clarified.
Competing interests
The authors declare no conflicts of interest.
Supplementary Materials
Supplementary file 1 contains Figs. S1-S2.
(pdf)
References
- Asahara T, Murohara T, Sullivan A, Silver M, van der Zee R, Li T. Isolation of putative progenitor endothelial cells for angiogenesis. Science 1997; 275:964-7. doi: 10.1126/science.275.5302.964 [Crossref] [ Google Scholar]
- Shi Q, Rafii S, Wu MH, Wijelath ES, Yu C, Ishida A. Evidence for circulating bone marrow-derived endothelial cells. Blood 1998; 92:362-7. [ Google Scholar]
- Can A, Dastouri MR. Endothelial Progenitor Cells (EPCs) and Their Function in Physiological States, in Endothelium Molecular Aspects of Metabolic Disorders.In:AB Engin AB, Engin A, eds. Endothelium.Boca Raton: CRC Press: 2013. p. 136-150.
- Zhang H, Vakil V, Braunstein M, Smith ELP, Maroney J, Chen L. Circulating endothelial progenitor cells in multiple myeloma: implications and significance. Blood 2005; 105:3286-94. doi: 10.1182/blood-2004-06-2101 [Crossref] [ Google Scholar]
- Asahara T, Masuda H, Takahashi T, Kalka C, Pastore C, Silver M. Bone marrow origin of endothelial progenitor cells responsible for postnatal vasculogenesis in physiological and pathological neovascularization. Circ Res 1999; 85:221-8. doi: 10.1161/01.res.85.3.221 [Crossref] [ Google Scholar]
- Peichev M, Naiyer AJ, Pereira D, Zhu Z, Lane WJ, Williams M. Expression of VEGFR-2 and AC133 by circulating human CD34(+) cells identifies a population of functional endothelial precursors. Blood 2000; 95:952-8. [ Google Scholar]
- Lyden D, Hattori K, Dias S, Costa C, Blaikie P, Butros L. Impaired recruitment of bone-marrow-derived endothelial and hematopoietic precursor cells blocks tumor angiogenesis and growth. Nature Med 2001; 7:1194-201. doi: 10.1038/nm1101-1194 [Crossref] [ Google Scholar]
- Takahashi T, Kalka C, Masuda H, Chen D, Silver M, Kearney M. Ischemia- and cytokine-induced mobilization of bone marrow-derived endothelial progenitor cells for neovascularization. Nature Med 1999; 5:434-8. doi: 10.1038/7434 [Crossref] [ Google Scholar]
- Tepper OM, Capla JM, Galiano RD, Ceradini DJ, Callaghan MJ, Kleinman ME. Adult vasculogenesis occurs through in situ recruitment, proliferation, and tubulization of circulating bone marrow-derived cells. Blood 2005; 105:1068-77. doi: 10.1182/blood-2004-03-1051 [Crossref] [ Google Scholar]
- Elkhodiry MA, Boulanger MD, Bashth O, Tanguay JF, Laroche G, Hoesli CA. Isolating and expanding endothelial progenitor cells from peripheral blood on peptide-functionalized polystyrene surfaces. BiotechnolBioeng 2019; 116:2598-609. doi: 10.1002/bit.27107 [Crossref] [ Google Scholar]
- Pham PV, Vu NB, Nguyen HT, Phan NK. Isolation of endothelial progenitor cells from human adipose tissue. Biomedical Research and Therapy 2016; 3:645-52. doi: 10.7603/s40730-016-0024-6 [Crossref] [ Google Scholar]
- Zheng WH, Wan YF, Ma XP, Li XR, Yang ZF, Yin Q. Isolation of cultured endothelial progenitor cells in vitro from PBMCs and CD133(+) enriched cells. Journal of Huazhong University of Science and Technology-Medical Sciences 2010; 30:18-24. doi: 10.1007/s11596-010-0104-6 [Crossref] [ Google Scholar]
- Huizer K, Mustafa DAM, Spelt JC, Kros JM, Sacchetti A. Improving the characterization of endothelial progenitor cell subsets by an optimized FACS protocol. PloS One 2017; 12:e0184895. doi: 10.1371/journal.pone.0184895 [Crossref] [ Google Scholar]
- Emontzpohl C, Simons D, Kraemer S, Goetzenich A, Marx G, Bernhagen J. Isolation of Endothelial Progenitor Cells from Healthy Volunteers and Their Migratory Potential Influenced by Serum Samples After Cardiac Surgery. J Vis Exp 2017(120):55192. doi: 10.3791/55192 [Crossref]
- Mead LE, Prater D, Yoder MC, Ingram DA. Isolation and characterization of endothelial progenitor cells from human blood. CurrProtoc Stem Cell Biol 2008; 6(1): 2C.1.1-2C.1.27. 10.1002/9780470151808.sc02c01s6.
- Nguyen MTX, Okina E, Chai X, Tan KH, Hovatta O, Ghosh S. Differentiation of Human Embryonic Stem Cells to Endothelial Progenitor Cells on Laminins in Defined and Xeno-free Systems. Stem Cell Rep 2016; 7:802-16. doi: 10.1016/j.stemcr.2016.08.017 [Crossref] [ Google Scholar]
- Narazaki G, Uosaki H, Teranishi M, Okita K, Kim B, Matsuoka S. Directed and systematic differentiation of cardiovascular cells from mouse induced pluripotent stem cells. Circulation 2008; 118:498-506. doi: 10.1161/Circulationaha.108.769562 [Crossref] [ Google Scholar]
- Suzuki H, Shibata R, Kito T, Ishii M, Li P, Yoshikai T. Therapeutic angiogenesis by transplantation of induced pluripotent stem cell-derived Flk-1 positive cells. BMC Cell Biol 2010; 11:72. doi: 10.1186/1471-2121-11-72 [Crossref] [ Google Scholar]
- Uosaki H, Fukushima H, Takeuchi A, Matsuoka S, Nakatsuji N, Yamanaka S, et al. Efficient and Scalable Purification of Cardiomyocytes from Human Embryonic and Induced Pluripotent Stem Cells by VCAM1 Surface Expression. PloS One 2011; 6; e23657. 10.1371/journal.pone.0023657.
- Mamo S, Gal AB, Bodo S, Dinnyes A. Quantitative evaluation and selection of reference genes in mouse oocytes and embryos cultured in vivo and in vitro. BMC Dev Biol 2007; 7:14. doi: 10.1186/1471-213X-7-14 [Crossref] [ Google Scholar]
- Kohler EE, Wary KK, Li F, Chatterjee I, Urao N, Toth PT. Flk1+and VE-Cadherin plus Endothelial Cells Derived from iPSCs Recapitulates Vascular Development during Differentiation and Display Similar Angiogenic Potential as ESC-Derived Cells. PloS One 2013; 8:e85549. doi: 10.1371/journal.pone.0085549 [Crossref] [ Google Scholar]
- Yamamizu K, Kawasaki K, Katayama S, Watabe T, Yamashita JK. Enhancement of vascular progenitor potential by protein kinase A through dual induction of Flk-1 and Neuropilin-1. Blood 2009; 114:3707-16. doi: 10.1182/blood-2008-12-195750 [Crossref] [ Google Scholar]
- Niwa A, Umeda K, Chang H, Saito M, Okita K, Takahashi K. Orderly Hematopoietic Development of Induced Pluripotent Stem Cells via FIk-1(+) Hemoangiogenic Progenitors. J Cell Physiol 2009; 221:367-77. doi: 10.1002/jcp.21864 [Crossref] [ Google Scholar]
- Lanner F, Sohl M, Farnebo F. Functional arterial and venous fate is determined by graded VEGF signaling and notch status during embryonic stem cell differentiation. Arteriosclerosis Thrombosis and Vascular Biology 2007; 27:487-93. doi: 10.1161/01.ATV.0000255990.91805.6d [Crossref] [ Google Scholar]
- Cebe-Suarez S, Zehnder-Fjallman A, Ballmer-Hofer K. The role of VEGF receptors in angiogenesis; complex partnerships. Cell Mol Life Sci 2006; 63:601-15. doi: 10.1007/s00018-005-5426-3 [Crossref] [ Google Scholar]
- Xie CQ, Huang HR, Wei S, Song LS, Zhang JF, Ritchie RP. A Comparison of Murine Smooth Muscle Cells Generated from Embryonic versus Induced Pluripotent Stem Cells. Stem Cells Dev 2009; 18:741-8. doi: 10.1089/scd.2008.0179 [Crossref] [ Google Scholar]
- Stefanska M, Costa G, Lie-a-Ling M, Kouskoff V, Lacaud G. Smooth muscle cells largely develop independently of functional hemogenic endothelium. Stem Cell Res 2014; 12:222-32. doi: 10.1016/j.scr.2013.10.009 [Crossref] [ Google Scholar]