Bioimpacts. 13(5):359-372.
doi: 10.34172/bi.2022.24256
Original Article
Autophagy-induced mesenchymal stem cell-derived extracellular vesicles ameliorated renal fibrosis in an in vitro model
Behnaz Ahrabi Data curation, Formal analysis, Investigation, Methodology, Writing – original draft, Writing – review & editing, 1, 2 
Hojjat Allah Abbaszadeh Formal analysis, Methodology, Project administration, Supervision, Writing – original draft, Writing – review & editing, 3, 2, 1, *
Abbas Piryaei Data curation, Formal analysis, Methodology, Writing – original draft, 4, 1
Faezeh Shekari Methodology, 5, 6
Navid Ahmady Roozbahany Writing – review & editing, 7
Mahya Rouhollahi Investigation, 5
Forough Azam Sayahpour Investigation, 5
Mahnaz Ahrabi Investigation, 8
Hadi Azimi Writing – review & editing, 9
Reza Moghadasali Data curation, Methodology, Project administration, Supervision, 5, *
Author information:
1Department of Biology and Anatomical Sciences, school of medicine, Shahid Beheshti University of Medical Sciences, Tehran, Iran
2Laser Applications in Medical Sciences Research Center, Shahid Beheshti University of Medical Sciences, Tehran, Iran
3Hearing Disorders Research Center, Loghman Hakim Hospital, Shahid Beheshti University of Medical Sciences, Tehran, Iran
4Urogenital Stem Cell Research Center, Shahid Beheshti University of Medical Sciences, Tehran, Iran
5Department of Stem Cells and Developmental Biology, Cell Science Research Center, Royan Institute for Stem Cell Biology and Technology, ACECR, Tehran, Iran
6Advanced Therapy Medicinal Product Technology Development Center, Royan Institute for Stem Cell Biology and Technology, Academic Center for Education, Culture and Research, Tehran, Iran
7Private Practice, Bradford, ON, Canada
8Department of Endodontics, Dental Faculty, Tabriz University of Medical Sciences, Tabriz, Iran
9Department of English Language Teaching, School of Medicine, Shahid Beheshti University of Medical Sciences, Tehran, Iran
Abstract
Introduction:
Chronic and progressive damage to the kidney by inflammatory processes, may lead to an increase in the extracellular matrix production, a condition known as renal fibrosis. The current study aims to evaluate if the extracellular vesicles (EVs) derived from autophagic adipose-derived mesenchymal stem cells (ADMSCs) can reduce the inflammation and extracellular matrix accumulation in damaged kidney tissue.
Methods:
Autophagy was induced in ADMSCs using 2µM concentration curcumin and was confirmed by evaluating LC3B, ATG7, and Beclin1 using real-time polymerase chain reaction (PCR) and Western blot. An in vitro renal fibrotic model was established in HEK-293 cells exposed to H2O2 (0.8mM) for 24 and 72 hours. The fibrotic model was confirmed through evaluation of collagen I, transforming growth factor-beta 1 (TGF-β1), E-cadherin, and vimentin genes expression using real-time PCR, collagen I protein by ELISA. After induction of fibrosis for 24 and 72 hours, the HEK cells were treated with NEVs (non-autophagy EVs) (50µM) or AEVs (autophagy EVs) (50µM) at 48, 96, and 124 hours, and then the samples were collected at 72 and 148 hours. Expression of collagen I, TGF-β1, E-cadherin, and vimentin Genes was evaluated via RT-PCR, and protein levels of IL1, TNF-α, IL4, IL10 using ELISA.
Results:
Induction of autophagy using curcumin (2µM) for 24 hours significantly increased LC3B, Beclin1, and ATG7 in the ADMSCs. Upregulation in anti-fibrotic (E-cadherin) and anti-inflammatory (IL4, IL10) gene expression was significantly different in the fibrotic model treated by AEVs compared to NEVs. Also, the downregulation of fibrotic (TGF-β1, vimentin, collagen I) and pro-inflammatory (IL1, TNFα) gene expression was significantly different in AEVs compared with those treated by NEVs.
Conclusion:
Our findings suggest that AEVs can be considered as a therapeutic modality for renal fibrosis in the future.
Keywords: Adipose-derived mesenchymal stem cells, Autophagy, Fibrosis, Extracellular vesicle
Copyright and License Information
© 2023 The Author(s).
This work is published by BioImpacts as an open access article distributed under the terms of the Creative Commons Attribution Non-Commercial License (
http://creativecommons.org/licenses/by-nc/4.0/). Non-commercial uses of the work are permitted, provided the original work is properly cited.
Introduction
Chronic kidney disease (CKD) has a prevalence of up to 10% worldwide and usually is secondary to diseases such as diabetes, glomerulonephritis, interstitial renal disease, and high blood pressure. As a result of decreased renal function, uremic toxins accumulate in the blood. It also leads to high blood pressure, acidosis, and hyperkalemia, hypocalcaemia and much more.1 Also, the progression of CKD can lead to interstitial and glomerular fibrosis.2
Previous studies have referred to four main processes involved in the formation of renal fibrosis. Damage to kidney tissue due to diseases such as glomerulonephritis and other inflammatory diseases, and more importantly diabetes and blood pressure, activates inflammatory cells and results in secretion of inflammatory mediators (IL6, IL1, and TNF-α).3,4 Activation of main factors and signaling mediators involved in renal pathology, such as connective tissue growth factor, nuclear factor-kappa B, transforming growth factor-beta 1 (TGF-β1), plasminogen activator inhibitor-1, and TGF-β1, plays an important role in fibrosis.5 Due to the epithelial to mesenchymal transition and (EMT)/endothelial-mesenchymal transition process, epithelial and endothelial cells change into mesenchymal cells and myofibroblasts.6 These myofibroblasts, as primary collagen-producing cells, produce scar tissues by expressing the Snail gene, as a result of an imbalance in the synthesis and degradation of extracellular matrix elements.6,7 One of the factors that can lead to fibrosis is hydrogen peroxide (H2O2). By producing oxidative stress, H2O2 can increase neutrophil permeability, inflammatory mediators, cell stimulation, lipid peroxidation, cell death, intracellular calcium deposition, and eventually acute kidney damage, and CKD.8-11 An increase in the intracellular calcium leads to increased expression of apoptotic genes and decreased expression of anti-apoptotic genes.10 Activation of various factors and signals due to oxidative stress can lead to EMT and fibrosis in the kidney.
Currently, the available treatments for patients with renal fibrosis are kidney transplantation, dialysis, and conservative treatment using medications that deal with the complications of renal failure.12-14 These approaches have high costs, side effects, and problems of transplant rejection in kidney transplant patients. Considering the previous studies, it can be noted that methods such as cell therapy, especially using mesenchymal stem cells (MSCs), have fewer side effects compared with those associated with medications. One of the characteristics of MSCs is their immunomodulatory nature, which is used for reducing damage to kidney tissue, both in vitro and in vivo. For example, MSCs reduce EMT and pro-inflammatory factors, such as IL6, and TNF-α can decrease fibrosis.15,16
In addition to the various cytokines and growth factors secreted by MSCs, extracellular vehicles (EVs) are also abundant in the supernatant. EVs, including exosome, microvesicle, and apoptotic bodies, differ in size and manufacturing mechanism.17,18 EVs are released from the cell under physiologic and pathophysiologic conditions and play a key role in intercellular communication and processes, such as coagulation, thrombosis, angiogenesis, immune modulation, and inflammation. They act as carriers for the transporting cytokines, chemokine, growth factors, proteins, lipids, and various types of RNA molecules.18 EVs facilitate the repair of damaged kidney tissue by communicating with other kidney cells.5,19 The results of some previous studies have shown that the use of MSC-EV in CKD and renal fibrosis reduced the expression of collagen IVa1, metalloproteinase,9 TGF-β1, smooth muscle alpha-actin (α-SMA), Serum creatinine, BUN, urine albumin-creatinine ratio, and inflammation of the kidneys.20,21 EV increased the expression of E-cadherin, and renal function,18 It have shown to be able to inhibit EMT and to decrease the production of extracellular matrix and fibrosis.20,21
Another potential treatment for kidney disease is the induction of autophagy in MSCs. As a biological process, autophagy can break the old cells down, decrease the accumulated intracellular collagen fibers, and degrade excess TGF-β1 inside the cell, which leads to reduced inflammation responses and fibrosis.7,22 Degrading TGF-β1, prevents its effect on the EMT process and the production of excess collagen outside of the cell.23,24 Through the TGF-β1 signaling pathway and by inhibiting the mammalian target of rapamycin (mTOR) complex, autophagy can bring about the expression of genes related to the autophagy process, such as Beclin 1, and Microtubule-associated protein 1A/1B-light chain 3 (LC3A, and LC3B).25 Curcumin, as an autophagy-inducing drug, has anti-oxidant and anti-inflammatory characteristics, that can inhibit the process of fibrosis in the kidney.26,27
In this study, by using curcumin, autophagy was induced in adipose-derived mesenchymal stem cells (ADMSCs) and extracellular vesicles were isolated. A model of renal fibrosis was developed in vitro using H2O2 in HEK cells and the fibrosis was treated with ADMSCs-autophagy EVs.
Materials and Methods
Material
Human Embryonic Kidney 293 cell line (HEK- 293) was purchased from the cell bank of Royan Institute for Stem Cell Biology and Technology (RI-SCBT). We used fetal bovine serum (FBS), penicillin and streptomycin and osteogenic differentiation medium Gibco (Gibco Life Technologies, Germany). Anti-LC3B, anti-Beclin 1, Anti-CD63, Anti- CD9, anti-CD81 antibodies, Anti- Calnexin antibodies, anti-beta actin-loading control antibodies, goat anti-rabbit IgG H&L (HRP) and anti-beta actin-loading control antibodies were purchased from Abcam, USA.
In addition, we used BCA Protein Quantification kit (Novagen, Iran), Calcein-AM (Bio legend, USA), and MTT solution (Life Technologies, England), difluoride (PVDF) membrane (Bio-Rad Laboratories, CA, USA) PBS Tween (Thermo Fisher Scientific, Massachusetts, USA), Minimum Essential Medium (MEM, Thermo Fisher Scientific, Massachusetts, USA) and Anti- Atg7 (cell signal, USA). We purchased Human IL-1β, collagen I, Human IL-4, Human IL10, TNF-α, TRI Reagent alkaline phosphatase, alizarin red dye, oil red dye, Curcumin, H2O2, BSA, PBS, glutaraldehyde, and 5% BSA from Sigma (Sigma Aldrich, USA).
Isolation and characterization of ADMSCs
The ADMSCs were cultured in MEM containing 10% FBS and 1% penicillin and streptomycin at 37°C with 5% CO2. Specific markers of MSCs, including CD34-, CD45-, CD90 +, CD105 +, and CD73 +, were identified using flow cytometry. To confirm the mesenchymal origin, some cells were moved to osteogenic or adipogenic medium for 14 and 21 days respectively. Differentiated cells were stained for alkaline phosphatase (ALP) using alizarin red dye for osteogenic differentiation and oil red dye for Adipogenic differentiation.28
Induction of Autophagy in ADMSCs
Curcumin was used as an inducer of autophagy. To determine the optimal dose, the ADMSCs were treated with different concentrations of curcumin (1, 2, 5, 10, 15, 17, 20, 25, 30 µM) for 24 hours in a proper culture media.27 The percentage of the surviving cells was evaluated using MTT assay after 24, 48, and 72 hours. We evaluated the markers related to autophagy (LC3II, Beclin1, and ATG7) using real-time polymerase chain reaction (PCR). We also measured the expression level of specific proteins such as LC3II, Beclin 1, and ATG7 using Western blot, LC3II and Beclin1 using Immunofluorescence staining, and autophagic vacuole using Transmission electron microscopy (TEM).
Immunofluorescence staining
Following treatments with curcumin after 24 hours, the ADMSCs were fixed with 4% paraformaldehyde for 15 minutes. The cells were washed three times with cold PBS Tween each time for 5 minutes. In the next step for permeabilization, we used 0.5% Triton-X 100 for 15 minutes. The cells were washed 3 times with PBS Tween, each time for 5 minutes. Then, cell blocking was performed with 1% BSA for 30 minutes. Cells were incubated over night with anti-LC3B (1/200) and anti-Beclin 1 1/2000 at 4°C. The supernatant was discarded, and the cell monolayer was washed with PBS Tween for 3 times, each time for 5 minutes. In the next step, goat anti-rabbit IgG secondary antibody, Alexa Fluor Plus 488 conjugates (green) was diluted in the dark with a ratio of 1.200 in PBS and added to each plate containing cells for 1 hour. The supernatant was removed, and the cells were washed with PBS Tween 3 times, each time for 5 minutes. Then, to stain the cell nucleus, 4, 6-diamidino2-phenylindole (DAPI) was used for 1 minute. The results of the reactions were then observed under a fluorescence microscope (Olympus ix 71).29
Transmission electron microscopy
ADMSCs were divided into curcumin and control groups. ADMSCs were centrifuged (1500 rpm, 5 minutes) following treatment with curcumin for 24 hours and the cell pellet was initially fixed with 2.5% glutaraldehyde for 7 days. Then, it was washed twice with PBS for 20 minutes and post-fixed in the dark with 1% OsO4 for 2 hours. Next, it was dehydrated using graded ethanol for 20 minutes and embedded in a resin block and thinned to less than 100 nm on an ultramicrotome. The sections were stained with lead citrate and uranyl acetate. The ultrastructural evaluation was observed using transmission electron microscopy (LEO 906 Germany, 100 kV).30
Isolation and characterization of EVs from human ADMSCs
ADMSCs cells were divided into two groups receiving 2µM curcumin or without receiving curcumin and were cultured in α-MEM containing 10% FBS and 1% penicillin, and streptomycin at 37°C with 5% CO2. ADMSCs were seeded into T75 flasks and when the cells reached 80% confluence, the treatment group received curcumin (2µM) for 24 hours. The condition media from each group (control and curcumin group) were centrifuged at 800 × g for 5 minutes and then the pellet was discarded. In the second stage, the media surface was centrifuged at 5000 × g for 10-15 minutes. Finally, the supernatant was ultra-centrifuged twice at 20000 × g for 30 minutes. Then, the sedimented extracellular vesicles were suspended in 1 mL of PBS. Next, we evaluated of the markers related to autophagy, including Anti-Atg7, Anti- LC3, Anti- Beclin 1. The evaluation of EVs characterization including Anti-CD9, Anti-CD63, Anti-CD81, Anti-Calnexin antibodies, and anti-beta actin-loading control antibodies was also performed using Western blot analysis. Particles sizes were measured via dynamic light scattering (DLS) technique and the BCA Protein concentration of EV lysates was determined using the BCA Protein Quantification kit.31
Incorporation of the EVs into HEK-293 cells
Purified ADMSCs-EVs were labeled with Calcein-AM as previously described. Membrane permeant labels such as Calcein AM can be used to label the lumen of EVs. Once calcein-AM enters the EVs, it will be hydrolyzed by esterases present in the EV lumen. Calcein is a fluorescent and membrane-permeable live-cell labeling dye and the label will be trapped inside EVs. This protocol was performed using the Gray et al method.32 First, we dissolved the calcine in DMSO. For every 100 µg EVs, about 4-5 µl of calcein AM was needed. To uptake the EVs in HEK-293 the following steps were required:
-
Calcein AM was solubilized in DMSO to produce a 10x solution (1 mM). Next, this stock solution was diluted in PBS to a final concentration of 0.5x as a working solution.
-
Extracellular vesicle pellets were resuspended in 100 μL calcein-AM working solution.
-
The labeled EVs were incubated at 37°C for 20 minutes to allow for intra-vesicular esterase activity to render the calcein-AM fluorescent.
-
The labeled EVs suspensions were incubated with cells for 48 hours.
-
Cells were washed with PBS, fixed in 4% PFA, stained with DAPI, and imaged using common FITC channel (calcein excitation max 495 nm/emission max 516 nm).
Scanning electron microscope (SEM)
First, the EVs were fixed with glutaraldehyde 2.5%. Then, they were washed twice with PBS for 20 minutes. The samples were sputter-coated with a thin layer of gold and were dried by lyophilizer for 48 hours after preparation for Scanning Electron Microscope (SEM360, Cambridge, UK).33
Induction of fibrosis in HEK-293 cells
HEK-293 was cultured in high glucose Dulbecco's Modified Eagle's Medium (HG-DMEM) supplemented with 1% penicillin and streptomycin and 10% FBS on six-well culture plates and treated with different doses of H2O2 (1-10 mM/mL) after 24 and 72 hours with 70% confluence cultures.8 Then, the appropriate dose was selected using LD50 with MTT assay. Next, the cells were divided into four groups: 1) control group (incubated in HG-DMEM containing 10% FBS), 2) Fibrosis group (exposed to H2O2 at a concentration of 0.8 mM/mL), 3) Normal EVs treatment group (which was exposed to H2O2 and treated by non-autophagy EVs (NEVs) (50µM)), and 4) Autophagic EVs treatment group (which was exposed to H2O2 and treated by AEVs (50µM)). The cells were then collected after 24 and 96 hours for real-time PCR for vimentin, E-cadherin, TGF-β1, collagen I genes, and enzyme-linked immunosorbent assay (ELISA) analysis for collagen I.
MTT assay
The Cells (HEK-293 or ADMSCs) were seeded into 96-well plates with 80 000 cells in passage 3 and incubated for 24, 48, and 72 hours with the α-MEM medium in ADMSCs and DMEM/High glucose HEK-293 cells. The ADMSCs were treated with curcumin (1, 2, 5, 10, 15, 17, 20, 25, 30 µM) and HEK-293 stimulated with H2O2 (1-10 mM/mL) after 24 hours. Then, 24 hours after receiving curcumin and H2O2, the supernatant was removed. To each well, 10 μL of MTT solution (5 mg/mL concentration) was added and they were kept in a 37° incubator for 4 hours. Then, the supernatant of each well was removed. To dissolve the formazan crystals, 100 μL of isopropyl alcohol was added to each well. Then, the contents of each well were transferred from the plate to another well and the light absorption of each well was quantified by measuring at a wavelength of 570 nm using the ELISA reader to calculate the reading and the percentage of cell life.34
Western blot analysis
Western blot analysis was performed to measure the expression of autophagic proteins from ADMSCs following treatment with curcumin for 24 hours and EVs marker after ADMSCs-EVs extraction. The expression of proteins from the curcumin group was compared with that of the control group. The cell plate (EVs, ADMSCs), divided into control and curcumin groups, was first washed with PBS. RIPA buffer was used for cell pellet lysis with equal volume and 5-10 times using Laemmli sample buffer. Lysates were added to the cell pellet inside the microtube. The sample was then vortexed. After ensuring cell destruction, the sample was centrifuged at 4°C for 14 minutes at 14 000 × g. Protein concentration for autophagy was determined using the Bradford protein quantification kit and protein concentration of EV lysates was determined using the BCA. Western blotting steps for surface markers of EVs (CD9, CD63, CD81) and autophagic markers LC3B, Beclin1, and Atg7 includes the following steps:
-
Transfer of proteins to membranes 0.2 μm Immune-BlotTM polyvinylidene difluoride (PVDF) membrane
-
Membrane blocking with 5% BSA
-
Addition of primary antibodies Anti-Atg7, Anti-LC3B, Anti-Beclin 1, Anti-CD63, Anti-CD9, Anti-CD81 antibodies, Anti-Calnexin antibodies, and anti-beta actin-loading control antibodies for 1 hour at room temperature
-
Addition of secondary antibodies with goat anti-rabbit IgG H&L (HRP)
-
Addition of substrate and detection of specific antibody proteins using GelDoc device or radiographic film. Protein band density was also measured using 2010a gel analyzer software.35
Enzyme-linked immunosorbent assay
After following treatment with H2O2 at 24 and 72 hours, HEK-293 cells were prepared and all the reagents and work standards were performed according to the instructions of the kit for human IL-1β, collagen I, human IL-4, human IL10, TNF-α. We added 200 μL of the sample and standard to each appropriate well and incubated at room temperature for 2 hours. Then, the plate was emptied and washed three times with 400 μL of Wash Buffer. Next, we added 200 μL of antibody IL-1β, TNF-α, collagen I, IL4, and IL10 to the conjugated solution and incubated it at room temperature for 1 hour. Then they were emptied and washed three times with 400 μL of Wash Buffer in the plate kit. Next, 200 μL of TMB development solution was added to each well and incubated for 20 minutes. Also, 50 μL of Stop solutions was added to each well, and optical density was read via ELISA reader at the wavelength of 450 nm. Standard optical absorption and samples were included in Excel and the concentrations were calculated and obtained based on the slope of the line.36
Real-time PCR
HEK-293 cells were treated with H2O2 for 24 and 72 hours and ADMSCs were induced with curcumin after 24 hours. Then the samples were collected and the whole RNA was extracted from the cells (ADMSCs, HEK-293) using TRI Reagent according to the company guidelines. Quantity and quality were evaluated using a Nanodrop spectrophotometer and RNA integrity was evaluated with RNA gel electrophoresis on 1% agarose gel and the results were visualized using a gel documentation system.31 cDNA was produced from 2 μg total RNA using PrimeScriptTM RT Reagent Kit. The final volume reaction mixture was 20 μL and the reaction mixture contained 10 mL TAKARA SYBR Green Master Mix, 10 pM of each primer (forward and reverse), and 2 μL of diluted cDNA. A determined copy number of PCR standard and real-time PCR was used. Sequences of the specific set of primers for autophagy genes (LC3B, ATG7, and Beclin1), pro-inflammatory factors (IL1b, TNF-a), anti-inflammatory factors (IL4, IL10), and fibrosis marker (vimentin, TGF-β1, E cadherin, and collagen I) were used in this study (Table 1). The expression of selected genes was normalized relative to the GAPDH gene. Also, gene expression levels were calculated using the 2-[ΔΔCT] formula.37
Table 1.
Primer sequnces
|
Gene name
|
Sequence [3ˊ→5ˊ] |
Product size (bp)
|
|
LC3B
|
F: 5′GTCTGTCCACTTGGCTAAC3′
R: 5′CACACGGTAGTTACAATAATGTC3′ |
116 |
|
ATG7
|
F: 5′TTAGTAGTGCCTTGGATGTTG3′
R:5′CAGAGTCACCATTGTAGTAATAAC3′ |
117 |
|
Beclin1
|
F: 5′TGGCACAATCAATAACTTCAGG3′
R: 5′GGAACAAGTCGGTATCTCTGA3′ |
150 |
|
Il10
|
F: 5′GTGGAGCAGGTGAAGAATG3′
R: 5′TGTAGGCTTCTATGTAGTTGATG3′ |
100 |
|
TGF-β1
|
F: 5′CTCACGCCTGTAATCCTAGCA3′
R: 5′CCACCTTAGCCTCCAGAGTAG3′ |
162 |
|
IL4
|
F: 5′GCAGTTCTACAGCCACCAT3′
R: 5′GATCGTCTTTAGCCTTTCCAAG3′ |
199 |
|
Vimentin
|
F: 5′GATGTTGACAATGCGTCTCTG3′
R: 5′ACATGCTGTTCCTGAATCTGAG3′ |
137 |
|
E-cadherin
|
F:5′CTTATGATTCTCTGCTCGTGTTTG3′
R:5′CATTCGTTCAAGTAGTCATAGTCC3′ |
118 |
| GAPDH |
F:5′GTTCTTCATTCACTAAGGAAGG3′
R:5′CAAGAGCATCATTGAACTTCAC3′ |
130 |
|
Collagen1
|
F:5′GTGATTGAATACAAAACCACCAAG3′
R: 5′GTTTACAGGAAGCAGACAGG3' |
122 |
|
IL-1b
|
F:5'TACATCAGCACCTCTCAAGCA3'
R: 5'CACATTCAGCACAGGACTCTC 3' |
138 |
|
TNFα
|
F: 5'CTGTGAGGAGGACGAACATC3'
R: 5'TTGAGCCAGAAGAGGTTGAG 3 |
99 |
Abbreviation: F: forward, R: reverse.
Results
Characterization of human ADMSCs
ADMSCs could differentiate into osteoblasts and adipocytes lineages using osteogenic, adipogenic, induction indicating their multipotent capacity media (Fig. 1A, 1B, 1C). Also, Flow cytometry was performed to confirm the identity of the ADMSCs. Cultured ADMSCs expressed high levels of the MSC-specific markers CD73 (65.4%), CD105 (86.5%), and CD90 (95.8%), but these cells were negative for the hematopoietic markers CD34 and CD45 (Fig. 1D-G).
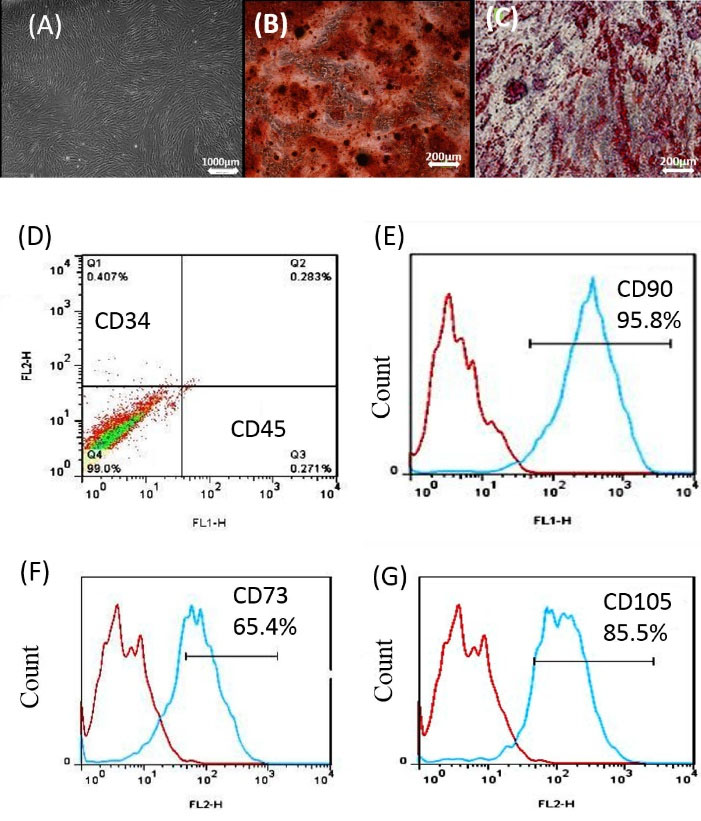
Fig. 1.
Alizarin Red and oil red staining of ADMSCs for osteogenesis and adipogenesis formation. ADMSCs were treated under osteogenic and adipogenic conditions for 21 days (A, B, C). (D, E, F, G) Specific markers of MSCs including CD34-, CD45-, CD90 +, CD105 +, and CD73 + were identified by flow cytometry. ADMSCs: adipose mesenchymal stem cell.
.
Alizarin Red and oil red staining of ADMSCs for osteogenesis and adipogenesis formation. ADMSCs were treated under osteogenic and adipogenic conditions for 21 days (A, B, C). (D, E, F, G) Specific markers of MSCs including CD34-, CD45-, CD90 +, CD105 +, and CD73 + were identified by flow cytometry. ADMSCs: adipose mesenchymal stem cell.
Autophagy induction increased ADMSCs survival
To induce autophagy, the ADMSCs were treated with some doses of curcumin (1, 2, 5, 10, 15, 17, 20, 25, 30 µM) for 24, 48, and 72 hours. The lethal dose (20, 25, 30 µM) and LD50 dose (15 µM) were determined. Among these, a 2 µM Concentration of curcumin had the highest cell proliferation induction (P≤0.001) compared with that of the control group (P≤0.001) in 72 hours, and a dose of 5µM (P <0.05, P <0.01) in 24 and 72 hours. To make sure about the accuracy of the results, we continued the study with different concentrations of 1, 2, and 5 µM (Fig. 2A, 2B, 2C).

Fig. 2.
Results show significant viability or significant difference in cell viability (dose 1, 2, 5 µM) with respect to the untreated control (A, B, C). Dose 1 µM at 24 h has significant difference with dose 1 µM at 72 h, dose 2 µM has significant difference at 24 h with dose 2 at 72 h, and Dose 5 µM has significant difference at 48 h with dose 5 at 72 h. (D, E, F, G, H) show significant gene expression (LC3B and Beclin1 ATG7), protein band and protein level by western blot (LC3B, Beclin1, β actin & Atg7) (dose 1, 2, 5 µM) with respect to the untreated control. Dose 1 at 24h has no significant difference in lc3 and Beclin1 gene expression with control group, dose 2 has no significant difference at 24 h with control group in LC3B, Beclin1 & Atg7, and Dose 5 has s significant difference at 24 h with control group (*P<0.05; **P<0.01; ***P<0.001; * ***P<0.0001).
.
Results show significant viability or significant difference in cell viability (dose 1, 2, 5 µM) with respect to the untreated control (A, B, C). Dose 1 µM at 24 h has significant difference with dose 1 µM at 72 h, dose 2 µM has significant difference at 24 h with dose 2 at 72 h, and Dose 5 µM has significant difference at 48 h with dose 5 at 72 h. (D, E, F, G, H) show significant gene expression (LC3B and Beclin1 ATG7), protein band and protein level by western blot (LC3B, Beclin1, β actin & Atg7) (dose 1, 2, 5 µM) with respect to the untreated control. Dose 1 at 24h has no significant difference in lc3 and Beclin1 gene expression with control group, dose 2 has no significant difference at 24 h with control group in LC3B, Beclin1 & Atg7, and Dose 5 has s significant difference at 24 h with control group (*P<0.05; **P<0.01; ***P<0.001; * ***P<0.0001).
Confirmation of autophagic ADMSCs induction with real-time PCR, Western blot, indirect immunofluorescence/IF, and TEM
To evaluate the autophagy markers such as Beclin1, LC3B, and ATG7, we used real-time PCR and Western blot. For this purpose, the ADMSCs were treated with curcumin at 1, 2, and 5 µM doses for 24 hours. The concentration of 1 µM was not significantly different in the level of autophagy proteins Beclin1, LC3B, and ATG7 compared with those in the control group. Only gene expression of ATG7 (P<0.01) in 1µM concentration was significantly different compared to that of the control group. At 2 µM concentration of curcumin, the genes expression of Beclin1 (P<0.0001), LC3B (P<0.05), and ATG7 (P<0.0001) as well as proteins expression Beclin1 (P<0.0001), LC3B (P<0.0001), and ATG7 (P<0.0001) showed significantly higher numbers compared with those of the control group. Also, at 2 µM concentration, we observed the upregulation of gene expression of Beclin1 (P<0.0001), LC3B (P<0.001), and ATG7 (P<0.0001) which were significantly different compared with 5µM concentration. At 2 µM concentration, no significant difference was observed in gene expression of LC3B compared to1 µM concentration. At 2 µM concentration, upregulation in Beclin1 protein expression was significantly different compared with that of 5µM concentration (P<0.01). Also, at 2 µM concentration, it was found that upregulation in Beclin1 (P<0. 001), LC3B (P<0.0001), and ATG7 (P<0. 01) proteins expression was significantly different compared with that for 1µM concentration. Furthermore, 5µM concentration was significantly different in the level of autophagy proteins Beclin1 (P<0.01), LC3B (P<0.0001), and ATG7 (P<0.01) compared to those of the control group but its protein level (ATG7, LC3B) was not significantly different compared to 2 µM concentration (Fig. 2D, 2E, 2F, 2G, 2H). Because of the observed upregulation in genes and protein expression in 2 µM concentration compared with other concentrations and the control group, the study was continued with 2 µM concentration. Morphology of ADMSCs was observed and it appeared to be round in a concentration of 5 µM (Fig. 3A, 3B, 3C, 3D). To evaluate the autophagy markers in the ADMSCs, which were treated with curcumin at doses of 2µM for 24 hours, IF staining was done against LC3B and Beclin1. LC3B appeared in the nucleus and Beclin1 was observed to have nucleocytoplasmic distribution (Fig. 3E, 3F, 3G, 3H). By induction of autophagy with curcumin (2 µM), a significant difference was observed in an autophagic vacuole inside the cell cytoplasm using TEM in the autophagy group compared to the control group (Fig. 3I, 3J, 3K).
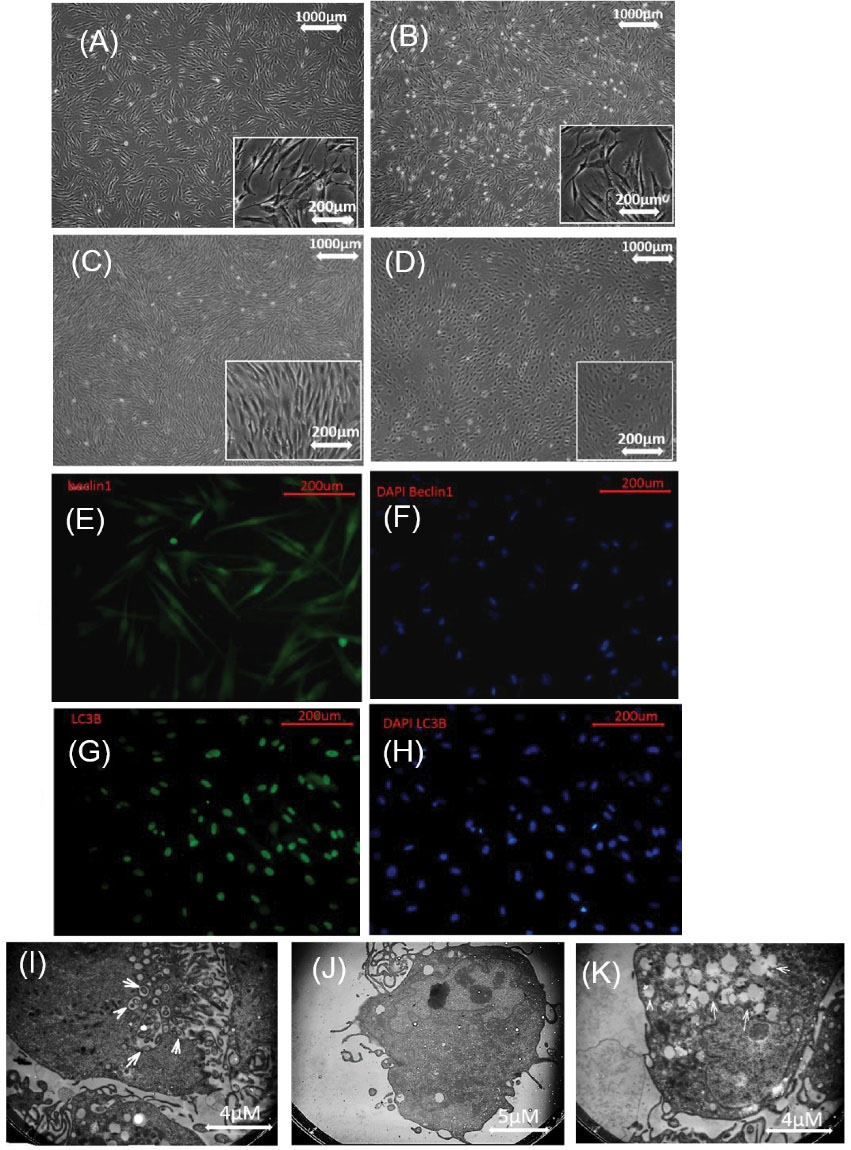
Fig. 3.
Autophagy induced in ADMSCs with curcumin. (A). control, (B): ADMSCs received 1µM curcumin, (C): ADMSCs received 2µM curcumin, (D): ADMSCs received 5 µM curcumin, morphology of the cells is rounded in D. The antibody Beclin1 had nuclear and cytoplasmic expression with DAPI (E, F). Antibodies LC3B were expressed in the nucleus with DAPI (G, H). (I, J), and (K) induction of autophagy, an autophagic vacuole was observed inside the cell cytoplasm with TEM. ADMSCs: adipose mesenchymal stem cell, TEM: Transmission electron microscopes.
.
Autophagy induced in ADMSCs with curcumin. (A). control, (B): ADMSCs received 1µM curcumin, (C): ADMSCs received 2µM curcumin, (D): ADMSCs received 5 µM curcumin, morphology of the cells is rounded in D. The antibody Beclin1 had nuclear and cytoplasmic expression with DAPI (E, F). Antibodies LC3B were expressed in the nucleus with DAPI (G, H). (I, J), and (K) induction of autophagy, an autophagic vacuole was observed inside the cell cytoplasm with TEM. ADMSCs: adipose mesenchymal stem cell, TEM: Transmission electron microscopes.
Characterization of EVs marker and expression of autophagy gene in the AEVs
The evaluation of protein expression related to autophagy (LC3B, Beclin1, and ATG7 antibodies) in AEVs, NEVs, and EVs characterization (CD9, CD63, CD81, and Calnexin antibodies) was performed using Western blot analysis. Increased protein levels of LC3B, Beclin1, and ATG7 were observed in the curcumin (2µM) recipient group (ADMSCs-AEVs) compared to ADMSCs-NEVs (Fig. 4A, 4B, 4C, 4D). Proteins expression related to EVs (CD9, CD63, and CD81) were found in both groups (ADMSCs-AEVs and ADMSCs-NEVs) (Fig. 4E, 4F, 4G, 4H). β-Actin was used as an internal control. After isolation of the EVs, protein concentration was measured with BCA. Their size was first measured using DLS. Also, the intensities of ADMSCs-AEVs (Z average (nm) 638.58, PDI: 0.15416) and ADMSCs-NEVs (Z average (nm) 468.62, PDI: 0.12095) were observed. The size of ADMSCs-AEVs was larger than ADMSCs-NEVs (Fig. 4I, 4J). EVs were seen in round shape with SEM (Fig. 4K). The EVs were detected in HEK-293 cells by Calcein (Fig. 4L, 4M, 4N). Each 1 µL condition media of ADMSCs contained 103 cells equivalent to EVs which yielded about 2.7 mg/mL protein.
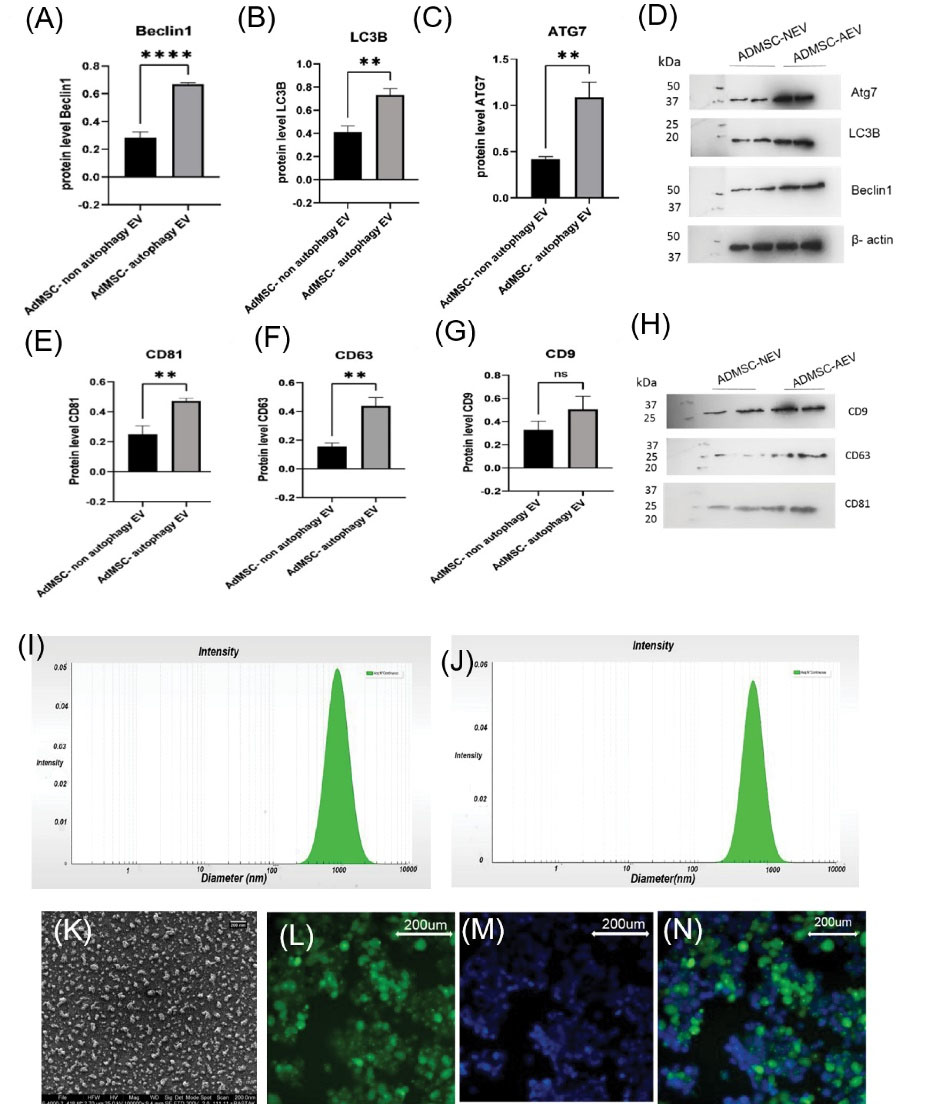
Fig. 4.
(A, B, C) show significant protein expression by western blot (LC3B, Beclin1, b actin & Atg7) in ADMSC-NEV (dose 2) with respect to ADMSC- AEVs. (4E, 4F, 4G) show CD81, CD 63, and CD9 in ADMSC- AEVs and ADMSC-NEVs. (D, H): protein band of LC3B, Beclin1, b actin, Atg7, CD81, CD 63, CD9. (I) shows intensity of ADMSC- AEVs (Z average (nm) 638.58, PDI: 0.15416), (J): picture show intensity of ADMSC- NEVs (Z average (nm) 468.62, PDI: 0.12095) EVs with DLS. (K) shows round shape of EVs with SEM. (L, M, and N) show uptake EVs in HEK-293, L: HEK cells with calcein, M: DAPI, N: merge. EVs: Extracellular vesicles, NEVs: non autophagy EVs, AEVs: autophagy EVs, DLS: Dynamic light scattering, SEM: Scanning Electron Microscope.
.
(A, B, C) show significant protein expression by western blot (LC3B, Beclin1, b actin & Atg7) in ADMSC-NEV (dose 2) with respect to ADMSC- AEVs. (4E, 4F, 4G) show CD81, CD 63, and CD9 in ADMSC- AEVs and ADMSC-NEVs. (D, H): protein band of LC3B, Beclin1, b actin, Atg7, CD81, CD 63, CD9. (I) shows intensity of ADMSC- AEVs (Z average (nm) 638.58, PDI: 0.15416), (J): picture show intensity of ADMSC- NEVs (Z average (nm) 468.62, PDI: 0.12095) EVs with DLS. (K) shows round shape of EVs with SEM. (L, M, and N) show uptake EVs in HEK-293, L: HEK cells with calcein, M: DAPI, N: merge. EVs: Extracellular vesicles, NEVs: non autophagy EVs, AEVs: autophagy EVs, DLS: Dynamic light scattering, SEM: Scanning Electron Microscope.
Viability of HEK-293 by MTT assay in 24 hours
Cell survival was measured after 24 hours of H2O2 stimulation using an MTT assay. At concentrations of 0.2 and 0.3 mM/mL H2O2, the viability of HEK-293 was significantly different compared to the control group (P<0.05). But no significant difference was observed at 0.1 mM/mL. Also, there was a significant difference at 0.4, 0.5, and 0.6 mM/mL concentrations of H2O2 compared with the control group (P<0.01). Cell survival at concentrations of 0.1 mM/mL to 0.6 mM/mL was above 50% (Fig. 5A). For the fibrosis model in this study, the cell survival rate was considered to be less than 50%. The viability of HEK-293 cells at 0.8 mM/mL concentration of H2O2 was observed to be 0.47% and the lethal dose of the H2O2 was determined at a concentration of 1 mM/mL. Mortality in the concentration of 0.7 to 0.9 mM/mL was significant compared with that in the control group (P<0.001 and P<0.0001 respectively). Cell survival rate at three concentrations (0.7, 0.8, and 0.9 mM/mL) was around 50% and long morphology was observed in HEK-293. The study was continued with these three concentrations.
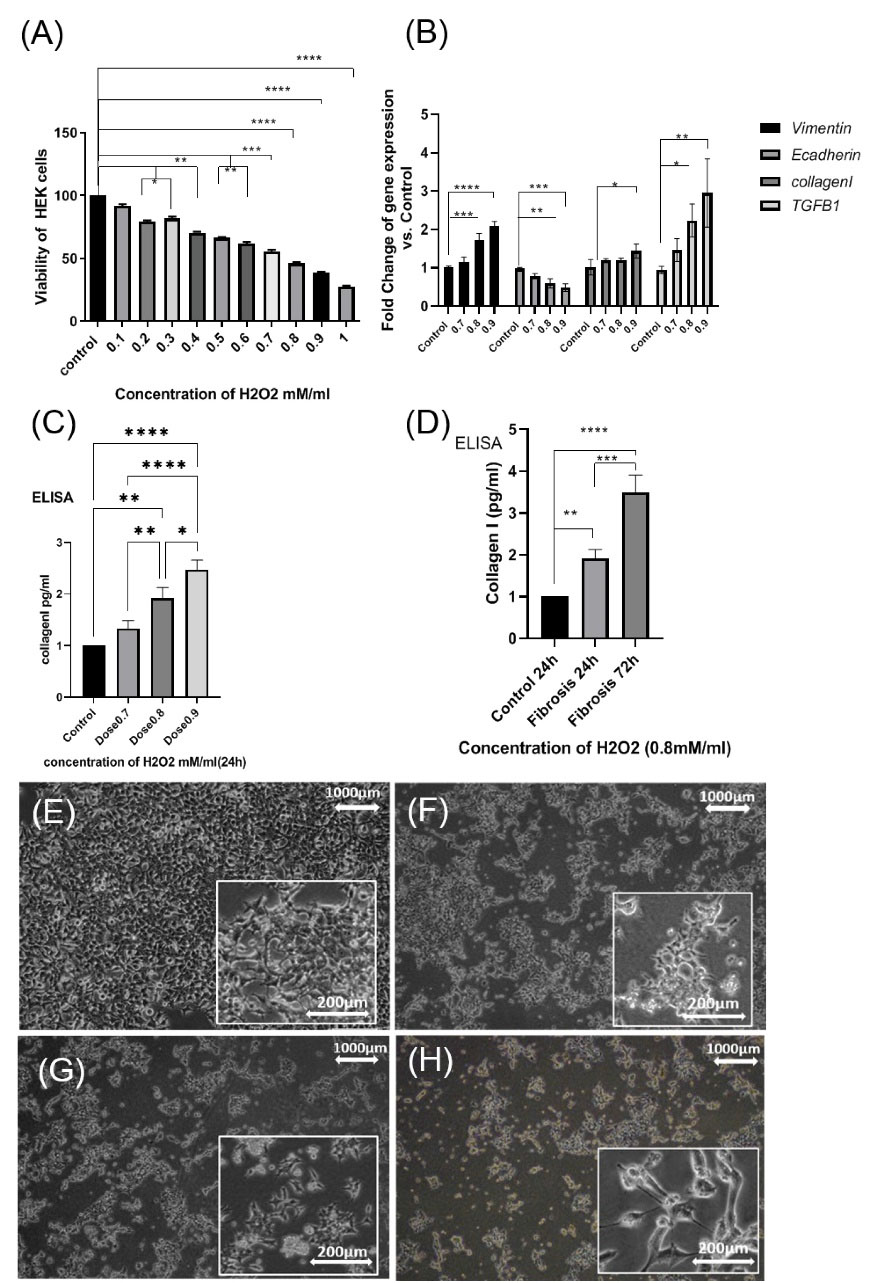
Fig. 5.
(A): show Viability of HEK-293 with MTT assay. Significant difference in Viability cell in HEK-293 in (doses 0.7mM, 0.8 mM, and 0.9mM) with respect to control after 24h H2O2. (B): gene expression of vimentin, E-cadherin, TGF-B1, collagen I, (dose 0.8mM) at 4 h. (C): increase in protein level of collagen I in (dose 0.7mM), (dose 0.8mM), (dose 0.9mM) at 24h by ELISA, (D): increase in protein level of collagen I in (dose 0.8mM) at 24h and 72h by ELISA (* P<0.05; **P<0, 01; ***P<0.001; ****P<0.0001). HEK -293 were stimulated with H2O2. (E); control (F) (0.7mM), (G) (0.8 mM), (H) (0.9 mM) for 4 h and 24 h. (Scale bar= 200µM, 50 µM).
.
(A): show Viability of HEK-293 with MTT assay. Significant difference in Viability cell in HEK-293 in (doses 0.7mM, 0.8 mM, and 0.9mM) with respect to control after 24h H2O2. (B): gene expression of vimentin, E-cadherin, TGF-B1, collagen I, (dose 0.8mM) at 4 h. (C): increase in protein level of collagen I in (dose 0.7mM), (dose 0.8mM), (dose 0.9mM) at 24h by ELISA, (D): increase in protein level of collagen I in (dose 0.8mM) at 24h and 72h by ELISA (* P<0.05; **P<0, 01; ***P<0.001; ****P<0.0001). HEK -293 were stimulated with H2O2. (E); control (F) (0.7mM), (G) (0.8 mM), (H) (0.9 mM) for 4 h and 24 h. (Scale bar= 200µM, 50 µM).
Progressive interstitial fibrosis developed after repeated H2O2 treatment from 4-72 hours
In this study, fibrosis indicators were collagen I, TGF-β, and EMT marker (vimentin, E cadherin). The study had three stages. In the first stage, to cause initial injury, HEK-293 was stimulated with (0.8mM) H2O2 at 4 hours and then the samples were collected to analyze fibrosis genes with real-time PCR. In the second stage, to cause fibrosis, HEK-293 was treated with (0.7, 0.8, and 0.9 mM) H2O2 at 24 hours, then the samples were collected to analyze collagen I using ELISA, and the final concentration was determined. In the third stage to create stable fibrosis, HEK-293 was treated with two repeated doses of (0.8mM) H2O2 at 24 and 72 hours. Then, the cell samples were collected after 96 hours to analyze fibrosis genes with real-time PCR and collagen I using ELISA. In the first stage at 4 hours incubation with H2O2, the mean expression of the vimentin gene at the concentrations of 0.8 and 0.9 mM was significantly higher compared with those of the control group (P<0.001 and P<0.0001, respectively). But at 0.7 mM concentration of H2O2, no significant difference was observed. Also, the mean expressions of the E-cadherin gene at 0.8 mM concentration (P<0. 01) and at 0.9 mM concentration (P<0.0001) were found to be significantly higher compared with those of the control group. However, at a 0.7 mM concentration, no significant difference observed. In addition, the mean expressions of the collagen I gene was significant only at 0.9 mM concentration (P<0.05) compared with the control group. Mean expressions of the TGF-β1 gene at a concentration of 0.8 mM (P<0. 01) and at a concentration of 0.9 mM (P<0.01) were significantly higher compared with those in the control group but at a concentration of 0.7 mM no significant difference was noted (Fig. 5B).
In the second stage at 24 hours incubation with H2O2, the protein level of collagen I was measured among the three concentrations of H2O2 (0.7, 0.8, and 0.9 mM) using the ELISA technique. The mean protein level of collagen I at a concentration of 0.8 mM (P<0.001) and at a concentration of 0.9 mM (P<0.0001) was significantly higher compared with that in the control group. Nevertheless, at a concentration of 0.7 mM, it was not significant compared with that in the control group (Fig. 5C). Therefore, the optimum concentration was determined to be 0.8 mM H2O2. In the third stage, after 72 hours incubation with 0.8 mM H2O2, the sample was collected for 96 hours. The protein level of collagen I at 0.8 mM concentration of H2O2 (P<0. 001) was found to be significant compared with 24 hours (P=0.0008). Finally, the protein level of collagen I at 96 hours was significantly higher (P<0.0001) compared with that of the controls. The results showed that the increase in fibrosis is completely dose- and time-dependent (Fig. 5D). The morphology of the cells after receiving H2O2, under the EMT process, was elongated only in concentrations of 0.8 and 0.9 mM/mL (Fig. 5 E, 5F, 5G, 5H).
The impact of EVs treatment on the model of renal fibrosis (24 hours) after 48 hours incubation with EVs
In the second stage after 24 hours incubation of HEK-293 with 0.8 mM H2O2, initial treatment with AEVs (50 μg/mL) and NEVs (50 μg/mL) was performed. At 48 hours, a sample was collected. The results showed that initial treatment with AEVs and NEVs prevented the progression of injury by downregulation in genes expression of TGF-β1, collagen I, and vimentin, inflammatory gene expression (IL1 and TNF-α), and upregulation in genes expression of E cadherin and anti-inflammatory gene expression (IL4, IL10) in AEVs and NEVs groups compared with the fibrosis group. Moreover, these findings showed a significant increase in E-cadherin, and IL10 as well as a significant decrease in TNF-α in the AEVs group, and a non-significant increase in IL4, TGF-β1, and collagen I, compared with the NEVs group (Fig. 6A, 6B).
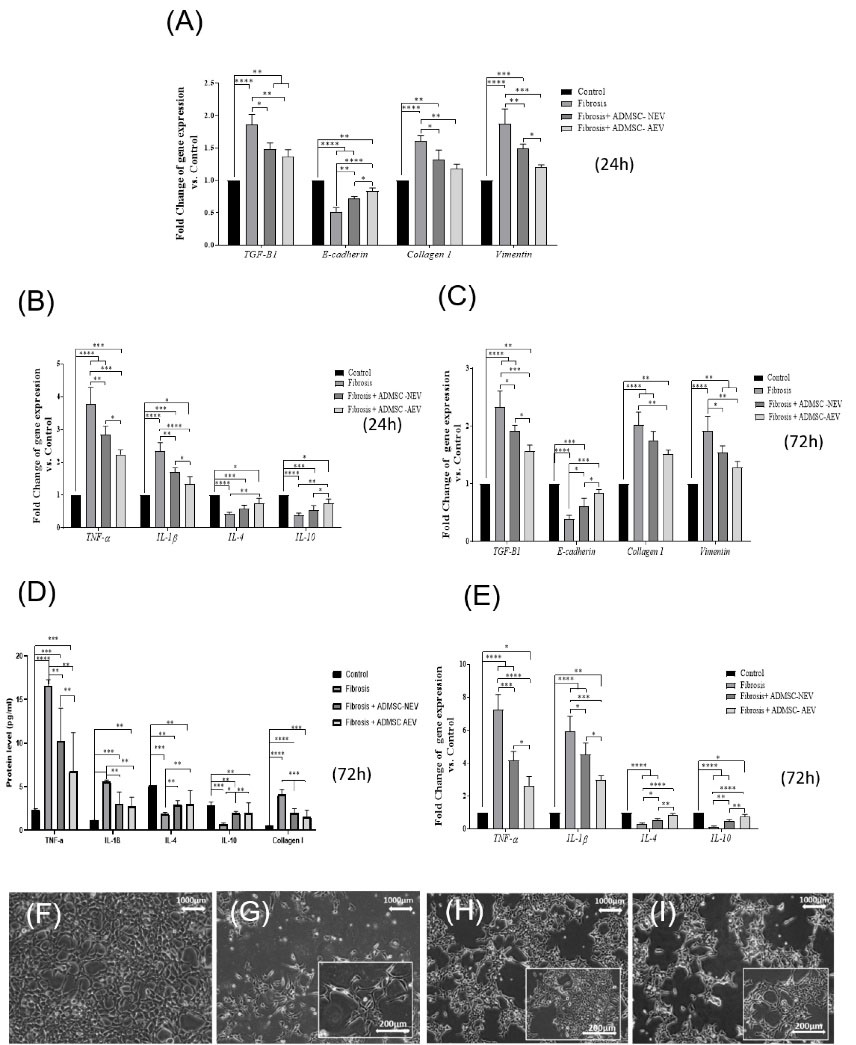
Fig. 6.
At 24 h and 72 h after fibrosis and treatment with EV. The results showed that it prevented the progression of injury by reducing the expression of (TGF-β1, collagen I, and vimentin) and reducing inflammatory in (A, B) at 24 h and (C, E, D) in 72 h. Images show the treatment of Fibrosis HEK-293 cells with EVs. (F): Control, (G): fibrosis, (H): Fibrosis+ AEVs, (I): Fibrosis+ NEVs.
.
At 24 h and 72 h after fibrosis and treatment with EV. The results showed that it prevented the progression of injury by reducing the expression of (TGF-β1, collagen I, and vimentin) and reducing inflammatory in (A, B) at 24 h and (C, E, D) in 72 h. Images show the treatment of Fibrosis HEK-293 cells with EVs. (F): Control, (G): fibrosis, (H): Fibrosis+ AEVs, (I): Fibrosis+ NEVs.
The impact of EVs treatment on the in vitro model of renal fibrosis (72 hours) after 124 hours incubation with EVs
To create stable conditions of fibrosis in the in vitro model and to observe the effective performance of EVs, we treated the cells with 0.8mM concentration H2O2 at 24 and 72 hours. The results showed that the fibrosis with 0.8mM H2O2, created during 72 hours, was more stable in HEK-293 cells due to the production of more collagen I protein, upregulation in genes expression of TGF-β1, collagen I, vimentin, IL1, and TNF-α, and downregulation in genes expression of IL4, IL10, and E cadherin compared to 24 hours incubation with H2O2. HEK-293 was treated with doses of AEVs and NEVs (50 μg/mL) for 96 and 124 hours. After 124 hours treatment with EVs, we observed a significant increase in the gene expression of E cadherin, IL4, and IL10, and a decrease in collagen I, TGF-β1, IL-1β, vimentin, and TNF-α in AEVs and NEVs groups, compared to the fibrosis group. Furthermore, a significant difference in E cadherin, TGF-β1, TNF-α, IL-1β, IL4, and IL10 genes expressions were observed in the AVEs group in comparison to the NEVs group. The results showed significant differences in the protein levels of collagen I, TNF-α, IL-1β, IL4, and IL10 in AEVs, and NEVs compared to those in the fibrosis group and no significant difference in IL-1β, the IL4 protein level in AEVs compared with NEVs (Fig. 6C, 6D, 6E).
Discussion
CKD is caused by a variety of disorders including genetic and congenital abnormalities, side effects of medications, urinary obstruction, diabetes, hypertension, vasculitis, and much more, all leading to renal fibrosis if not appropriately treated. In recent years, therapeutic methods like surgery and medication have been used to repair or replace damaged kidneys. However, transplant rejection, side effects of medications, and high costs for patient care have been observed. One of the potential strategies for treating the renal injury is MSCs, EVs and the Autophagy process. Recent studies have evaluated the therapeutic role of MSC and EVs in renal fibrosis. In this study, we used autophagic EVs to improve renal fibrosis for the first time. Induction of autophagy in the cell can result in reducing inflammation and degradation of extracellular matrix elements.
We created a model of renal fibrosis using H2O2 (0.1-1 mM) exposed to the cells for 4, 24, and 72 hours. According to Kavsak et al, the transition of the phenotype of epithelial cells to myofibroblasts in the kidney (spindle morphology) via the EMT process, results in an imbalance in the synthesis and breakdown of accumulated collagen I.5 We showed that due to treatment with H2O2 at high concentrations, the morphology of HEK-293 cells changes to a spindle shape and expression of inflammatory factors (IL1, TNF-α) and collagen I increased. This may be due to the oxidative stress caused by H2O2 which increased inflammatory mediators, neutrophil permeability, cell stimulation, lipid peroxidation, cell death, and intracellular calcium.9-11 Increased collagen production can be secondary to increased inflammation. According to Li et al, to induce fibrosis and primary damage to the kidney, the renal cells should be treated with H2O2 for 4 hours.38,39 However, our study showed that 4-hour treatment with H2O2 can cause primary damage but not fibrosis to HEK-293. For the first time, we showed a stable and progressive in-vitro model of renal fibrosis. We also increased the duration and frequency of H2O2 and showed that the fibrosis created during 72 hours was more stable in HEK-293 cells than that in 24 hours. Moreover, we found that it leads to more collagen I production compared to the first 24 hours.
A method introduced by Han et al, was used to induce autophagy.40 We used various concentrations of curcumin for this purpose. In consistence with Han et al who showed that pre-treatment with curcumin could increase the survival of HUVECs treated with H2O2,41 we showed that curcumin could increase proliferation of ADMSC only at a concentration of 2 µM. In consistence with Pirmoradi et al, the effect of curcumin at doses of 1 µM and 5µM was an increase in proliferation, a decrease in aging, and an increase in TERT expression in ADMSCs cells.41 However, our results showed that curcumin could increase the proliferation of ADMSCs only at a concentration of 2 µM. The proliferation effects of curcumin may depend on the concentration, duration of treatment, and type of stem cells.41 According to Yang et al, curcumin acts as a double-edged blade for stem cells,42,43 and high doses of curcumin have toxic effects on them. They showed that a dose of 10 µM starts to be toxic. We also showed that doses of 15 µM and 17 µM to 30 µM were lethal. Here, we examined all concentrations of curcumin used in the recent studies to find the best concentration for increasing proliferation and increasing autophagy. According to Wang et al, curcumin is effective in reducing collagen I and inflammatory factors and increasing anti-inflammatory factors in cells. We also showed that curcumin (2µM) could be effective in the improvement of fibrosis by reducing collagen I, inflammatory factors (IL1, TNF-α), and increasing anti-inflammatory factors (IL10, IL4). We showed that using curcumin in a specific dose (2 µM) could induce autophagy and increase protein expression and gene expression of LC3B, ATG7, and Beclin1. Therefore, the results of our study proved that curcumin only at a concentration of at 2 µM could lead to cell proliferation and induce autophagy while preserving the morphology of cells, which is an important finding. According to Ebrahim et al, in the process of autophagy, lysozyme enzymes are released to autophagolysosome. This can result in the breakdown of intracellular collagen and TGF-β1 accumulated in the cell and reduced TGF-β1 level can prevent the EMT process. It eventually reduces excess collagen outside the cell. We also showed that during the process of induction of autophagy, an autophagic vacuole can be found inside the cytoplasm of the cell with TEM. In consistence with the previous studies, we observed therapeutic effects of EVs in AKI or renal fibrosis by showing inhibition of apoptosis and reduction of hypertension and inflammatory factor.46-54 We also showed that treatment with AEVs and NEVs at 24 hours after exposure to H2O2 could prevent the progression of injury by reducing the expression of TGF-β1, collagen I, vimentin, IL-1Β, and TNF-α and increasing E cadherin and anti-inflammatory factors (IL4, IL10). According to Wang et al, treatment with EVs following induction of autophagy in kidney cells, effectively reduces the toxic effects of cisplatin.31 We also showed that the effect of autophagic EVs in preventing injury in 24 hours. EVs and curcumin pre-treatment inhibited mTOR phosphorylation, activated autophagy, and inhibited inflammatory cytokines in renal epithelial cells in response to injury.31 According to the previous result, EVs reduce oxidative stress and inhibit apoptosis.18,21,55 Our results also showed treatment with AEVs and NEVs at 96 and 124 hours after H2O2 in HEK-293 increased the expression of E cadherin, vimentin, IL4, IL10 and decreased expression in collagen I, TGF-β1, IL-1Β, and TNF-α. Our results, for the first time, showed that AEVs could improve fibrosis and the autophagy process can be effective in improving fibrosis by inhibiting inflammatory factors and degrading intracellular collagen I. According to Ebrahim et al, EVs from BM-MSCs could reduce fibronectin and TGF-β1 in the animal model of diabetic nephropathy.45 Alfarano et al reported that injection of microvesicles from bone marrow MSCs increases E-cadherin expression and decreases α-SMA expression.56 We also showed that treatment of damaged HEK-293 with NEVs could increase E-cadherin expression and decrease vimentin expression, which is consistent with the results reported by previous studies. Furthermore, several studies showed that MSC-EVs reduce inflammatory factors and increase anti-inflammatory factors,57-59 which are consistent with our findings. Autophagy of AEVs was more effective in reducing fibrosis, compared with NEVs, after receiving H2O2 (24 and 72 hours). Previous studies have shown that, in the first stage, large EVs have strong procoagulant properties. Also, experimental and clinical studies have shown that MPs/MVs play a major role in the pathophysiology of inflammatory disorders which is related to their effect through the induction of regulatory T cells with immunomodulatory effects.31 We also extracted large EVs (20 k) from condition media of ADMSCs autophagy. Previous studies also pointed to the importance of large EVs due to the presence of ROS metabolic enzymes that regulate ROS signaling pathways in target cells.37 For the first time, our results showed that large AEVs can reduce inflammatory factors in fibrosis. Large EVs origin is from the cell membrane and the role of the cell membrane in the transmission of intracellular contents is important. It explains why EVs play a very important role in reducing fibrosis. The effect of AEVs in reducing inflammatory factors is more prominent compared to NEVs.
Conclusion
The results of our study showed that ADMSCs-AEVs effectively reduced inflammatory factors, and collagen I, and increased anti-inflammatory factors compared with NEVs in fibrotic HEK-293. Based on these results, AEVs can improve in vitro fibrosis in HEK-293. One of the reasons for the improvement of fibrosis is the effect of curcumin-induced autophagy in EVs. These findings suggest that AEVs derived from human ADMSCs can be used as a therapeutic modality for kidney fibrosis.
Acknowledgments
This study is based on a PhD dissertation by Behnaz Ahrabi at the Department of Biology and Anatomical Sciences, School of Medicine, Shahid Beheshti University of Medical Sciences, Tehran. This work was financially supported by Hearing Disorders Research Center (Grant number:11081), Loghman Hakim Hospital, Shahid Beheshti University of Medical Sciences, Tehran, Iran and Royan Institute for Stem Cell Biology and Technology, ACECR, Tehran, Iran.
Competing interests
The authors declare that there is no conflict of interests.
Ethical Statement
This study was approved by the Research Ethics Committee at Shahid Beheshti University of Medical Sciences, Tehran, under the code No. IR.SBMU.REC.1397.009.
Funding
This study is financially supported by Hearing Disorders Research Center (Grant number:11081), Loghman Hakim Hospital, Shahid Beheshti University of Medical Sciences, Tehran, Iran and Royan Institute for Stem Cell Biology and Technology, Tehran, Iran.
References
- Vivekanand JH, Guillermo G, Kunitoshi I. Zou l, Saraladev N. Chronic kidney disease: global dimension and perspectives. Lancet 2013; 382:260-272. doi: 10.1016/S0140-6736(13)60687-X [Crossref] [ Google Scholar]
- López-Hernández FJ, López-Novoa JM. Role of TGF-β in chronic kidney disease: an integration of tubular, glomerular and vascular effects. Cell Tissue Res 2012; 347:141-154. doi: 10.1007/s00441-011-1275-6 [Crossref] [ Google Scholar]
- Hewitson TD. Renal tubulointerstitial fibrosis: common but never simple. Am J Physiol Renal Physiol 2009; 296:F1239-F1244. doi: 10.1152/ajprenal.90521.2008 [Crossref] [ Google Scholar]
- Dungey M, Hull KL, Smith AC, Burton JO, Bishop NC. Inflammatory factors and exercise in chronic kidney disease. Int J Endocrinol 2013; 2013:569831. doi: 10.1155/2013/569831 [Crossref] [ Google Scholar]
- Kavsak P, Rasmussen RK, Causing CG, Bonni S, Zhu H, Thomsen GH. Smad7 binds to Smurf2 to form an E3 ubiquitin ligase that targets the TGFβ receptor for degradation. Mol Cell 2000; 6:1365-1375. doi: 10.1016/S1097-2765(00)00134-9 [Crossref] [ Google Scholar]
- Duffield JS. Cellular and molecular mechanisms in kidney fibrosis. J Clin Invest 2014; 124:2299-2306. doi: 10.1172/JCI72267 [Crossref] [ Google Scholar]
- Zhang Q, Yang YJ, Wang H, Dong QT, Wang TJ, Qian HY. Autophagy activation: a novel mechanism of atorvastatin to protect mesenchymal stem cells from hypoxia and serum deprivation via AMP-activated protein kinase/mammalian target of rapamycin pathway. Stem Cells Dev 2012; 21:1321-1332. doi: 10.1089/scd.2011.0684 [Crossref] [ Google Scholar]
- Li Y, Li Y, Fang Z, Huang D, Yang Y, Zhao D, et al. The effect of Malus doumeri leaf flavonoids on oxidative stress injury induced by hydrogen peroxide (H 2 O 2) in human embryonic kidney 293 T cells. BMC Complement Med Ther 2020. 20: 1-12. 10.1186/s12906-020-03072-6.
- Schieber M, Chandel NS. ROS function in redox signaling and oxidative stress. Currl Biol 2014; 24:R453-R462. doi: 10.1016/j.cub.2014.03.034 [Crossref] [ Google Scholar]
- Ray SK, Fidan M, Nowak MW, Wilford GG, Hogan EL, Banik NL. Oxidative stress and Ca2+ influx upregulate calpain and induce apoptosis in PC12 cells. Brain Res 2000; 852:326-334. doi: 10.1016/S0006-8993(99)02148-4 [Crossref] [ Google Scholar]
- Elmarakby AA, Sullivan JC. Relationship between oxidative stress and inflammatory cytokines in diabetic nephropathy. Cardiovasc Ther 2012; 30:49-59. doi: 10.1016/S0006-8993(99)02148-4 [Crossref] [ Google Scholar]
- Cho KS, Ko IK, Yoo JJ. Bioactive compounds for the treatment of renal disease. Yonsei Med J 2018; 59:1015-1025. doi: 10.3349/ymj.2018.59.9.1015 [Crossref] [ Google Scholar]
- Mutsaers HA, Olinga P. Organ fibrosis: triggers, pathways, and cellular plasticity. Front Med (Lausanne) 2016; 3:55. doi: 10.3389/fmed.2016.00055 [Crossref] [ Google Scholar]
- Mohnen SM, van Oosten MJ, Los J, Leegte MJ, Jager KJ, Hemmelder MH. Healthcare costs of patients on different renal replacement modalities–analysis of Dutch health insurance claims data. PLoS One 2019; 14:e0220800. doi: 10.1371/journal.pone.0220800 [Crossref] [ Google Scholar]
- Wynn TA. Cellular and molecular mechanisms of fibrosis. J Pathol Clin Res 2008; 214:199-210. doi: 10.1002/path.2277 [Crossref] [ Google Scholar]
- Rockey DC, Bell PD, Hill JA. Fibrosis—a common pathway to organ injury and failure. N Engl J Med Overseas Ed 2015; 372:1138-1149. doi: 10.1056/NEJMra1300575 [Crossref] [ Google Scholar]
- Wendler F, Favicchio R, Simon T, Alifrangis C, Stebbing J, Giamas G. Extracellular vesicles swarm the cancer microenvironment: from tumor–stroma communication to drug intervention. Oncogene 2017; 36:877-884. doi: 10.1038/onc.2016.253 [Crossref] [ Google Scholar]
- He J, Wang Y, Lu X, Zhu B, Pei X, Wu J. Micro‐vesicles derived from bone marrow stem cells protect the kidney both in vivo and in vitro by microRNA‐dependent repairing. Nephrology (Carlton) 2015; 20:591-600. doi: 10.1111/nep.12490 [Crossref] [ Google Scholar]
- Yuan B, Liang Y, Wang D, Luo F. MiR‐940 inhibits hepatocellular carcinoma growth and correlates with prognosis of hepatocellular carcinoma patients. Cancer Sci 2015; 106:819-824. doi: 10.1111/cas.12688 [Crossref] [ Google Scholar]
- Borges FT, Melo SA, Özdemir BC, Kato N, Revuelta I, Miller CA. TGF-β1–containing exosomes from injured epithelial cells activate fibroblasts to initiate tissue regenerative responses and fibrosis. Clin J Am Soc Nephrol 2013; 24:385-392. doi: 10.1681/ASN.2012101031 [Crossref] [ Google Scholar]
- Lv LL, Cao YH, Ni HF, Xu M, Liu D, Liu H. MicroRNA-29c in urinary exosome/microvesicle as a biomarker of renal fibrosis. Am J Physiol Renal Physiol 2013; 305:F1220-F1227. doi: 10.1152/ajprenal.00148.2013 [Crossref] [ Google Scholar]
- Klionsky DJ, Eskelinen EL, Deretic V. Autophagosomes, phagosomes, autolysosomes, phagolysosomes, autophagolysosomes… wait, I’m confused. Autophagy 2014; 10:549-51. doi: 10.4161/auto.28448 [Crossref] [ Google Scholar]
- Ding Y, ll Kim S, Lee SY, Koo JK, Wang Z, Choi ME. Autophagy regulates TGF-β expression and suppresses kidney fibrosis induced by unilateral ureteral obstruction. Clin J Am Soc Nephrol 2014; 25:2835-2846. doi: 10.1681/ASN.2013101068 [Crossref] [ Google Scholar]
- Kim SI, Na HJ, Ding Y, Wang Z, Lee SJ, Choi ME. Autophagy promotes intracellular degradation of type I collagen induced by transforming growth factor (TGF)-β1. J Biol Chem 2012; 287:11677-11688. doi: 10.1074/jbc.M111.308460 [Crossref] [ Google Scholar]
- Dou F, Liu Y, Liu L, Wang J, Sun T, Mu F. Aloe-emodin ameliorates renal fibrosis via inhibiting PI3K/Akt/mTOR signaling pathway in vivo and in vitro. Rejuvenation Res 2019; 22:218-229. doi: 10.1089/rej.2018.2104 [Crossref] [ Google Scholar]
- Tyagi N, Dash D, Singh R. Curcumin inhibits paraquat induced lung inflammation and fibrosis by extracellular matrix modifications in mouse model. Inflammopharmacology 2016; 24:335-345. doi: 10.1007/s10787-016-0286-z [Crossref] [ Google Scholar]
- Lv XX, Liu SS, Hu ZW. Autophagy-inducing natural compounds: a treasure resource for therapeutics against tissue fibrosis. J Asian Nat Prod Res 2017; 19:101-108. doi: 10.1080/10286020.2017.1279151 [Crossref] [ Google Scholar]
- Darabi SH, Tiraihi T, Noori-Zadeh A, Rajaei F, Darabi L, Abbaszadeh H. Creatine and retinoic acid effects on the induction of autophagy and differentiation of adipose tissue-derived stem cells into GABAergic-like neurons. J Babol Univ Med Sci 2017; 19:41-49. doi: 10.22088/jbums.19.8.41 [Crossref] [ Google Scholar]
- Boroujeni ME, Simani L, Bluyssen HA, Samadikhah HR, Zamanlui Benisi S, Hassani S. Inflammatory response leads to neuronal death in human post-mortem cerebral cortex in patients with COVID-19. ACS Chem Neurosci 2021; 8:2143-50. doi: 10.1021/acschemneuro.1c00111 [Crossref] [ Google Scholar]
- Khoramgah MS, Ranjbari J, Abbaszadeh H-A, Mirakabad FST, Hatami S, Hosseinzadeh S. Freeze-dried multiscale porous nanofibrous three dimensional scaffolds for bone regenerations. Bioimpacts 2020; 10:73. doi: 10.34172/bi.2020.10 [Crossref] [ Google Scholar]
- Wang B, Jia H, Zhang B, Wang J, Ji C, Zhu X. Pre-incubation with hucMSC-exosomes prevents cisplatin-induced nephrotoxicity by activating autophagy. Stem Cell Res Ther 2017; 8:1-14. doi: 10.1186/s13287-016-0463-4 [Crossref] [ Google Scholar]
- Gray WD, Mitchell AJ, Searles CD. An accurate, precise method for general labeling of extracellular vesicles. MethodsX 2015; 2:360-367. doi: 10.1016/j.mex.2015.08.002 [Crossref] [ Google Scholar]
- Jung MK, Mun JY. Sample preparation and imaging of exosomes by transmission electron microscopy. J Vis Exp 2018(131):56482. doi: 10.3791/56482 [Crossref]
- Boroojen FR, Mashayekhan S, Abbaszadeh HA. The controlled release of dexamethasone sodium phosphate from bioactive electrospun PCL/gelatin nanofiber scaffold. IJPR 2019; 18(1):111. [ Google Scholar]
- Darabi S, Noori-Zadeh A, Rajaei F, Abbaszadeh HA, Bakhtiyari S, Roozbahany NA. SMER28 attenuates dopaminergic toxicity mediated by 6-hydroxydopamine in the rats via modulating oxidative burdens and autophagy-related parameters. Neurochemical Research 2018; 43:2313-23. doi: 10.1007/s11064-018-2652-2 [Crossref] [ Google Scholar]
- Babaei H, Alibabrdel M, Asadian S, Siavashi V, Jabarpour M, Nassiri SM. Increased circulation mobilization of endothelial progenitor cells in preterm infants with retinopathy of prematurity. J Cell Biochem 2019; 120:12194-12195. doi: 10.1002/jcb.26777 [Crossref] [ Google Scholar]
- Ziaeipour S, Ahrabi B, Naserzadeh P, Aliaghaei A, Sajadi E, Abbaszadeh HA. Effects of Sertoli cell transplantation on spermatogenesis in azoospermic mice. Cell Physiol Biochem 2019; 52:421-34. doi: 10.33594/000000030 [Crossref] [ Google Scholar]
- Li J, Li L, Wang S, Zhang C, Zheng L, Jia Y. Resveratrol alleviates inflammatory responses and oxidative stress in rat kidney ischemia-reperfusion injury and H2O2-induced NRK-52E cells via the Nrf2/TLR4/NF-κB pathway. Cell Physiol Biochem 2018; 45:1677-1689. doi: 10.1159/000487735 [Crossref] [ Google Scholar]
- Li Y, Li Y, Fang Z, Huang D, Yang Y, Zhao D. The effect of Malus doumeri leaf flavonoids on oxidative stress injury induced by hydrogen peroxide (H2O2) in human embryonic kidney 293 T cells. BMC Complement Med Ther 2020; 20:1-12. doi: 10.1186/s12906-020-03072-6 [Crossref] [ Google Scholar]
- Han J, Pan XY, Xu Y, Xiao Y, An Y, Tie L. Curcumin induces autophagy to protect vascular endothelial cell survival from oxidative stress damage. Autophagy 2012; 8:812-825. [ Google Scholar]
- Pirmoradi S, Fathi E, Farahzadi R, Pilehvar-Soltanahmadi Y, Zarghami N. Curcumin affects adipose tissue-derived mesenchymal stem cell aging through TERT gene expression. Drug Res (Stuttg) 2018; 68:213-221. doi: 10.1055/s-0043-119635 [Crossref] [ Google Scholar]
- Yang Q, Leong SA, Chan KP, Yuan XL, Ng TK. Complex effect of continuous curcumin exposure on human bone marrow‐derived mesenchymal stem cell regenerative properties through matrix metalloproteinase regulation. Basic Clin Pharmacol Toxicol 2021; 128:141-153. doi: 10.1111/bcpt.13477 [Crossref] [ Google Scholar]
- Attari F, Zahmatkesh M, Aligholi H, Mehr SE, Sharifzadeh M, Gorji A. Curcumin as a double-edged sword for stem cells: dose, time and cell type-specific responses to curcumin. Daru 2015; 23:1-7. doi: 10.1186/s40199-015-0115-8 [Crossref] [ Google Scholar]
- Wang Q, Ye C, Sun S, Li R, Shi X, Wang S. Curcumin attenuates collagen-induced rat arthritis via anti-inflammatory and apoptotic effects. Int Immunopharmacol 2019; 72:292-300. doi: 10.1016/j.intimp.2019.04.027 [Crossref] [ Google Scholar]
- Wang Q, Ye C, Sun S, Li R, Shi X, Wang S. Mesenchymal stem cell-derived exosomes ameliorated diabetic nephropathy by autophagy induction through the mTOR signaling pathway. Cells 2018; 7:226. doi: 10.3390/cells7120226 [Crossref] [ Google Scholar]
- Aghajani Nargesi A, Lerman LO, Eirin A. Mesenchymal stem cell-derived extracellular vesicles for kidney repair: current status and looming challenges. Stem Cell Res Ther 2017; 8:1-12. doi: 10.1186/s13287-017-0727-7 [Crossref] [ Google Scholar]
- Gatti S, Bruno S, Deregibus MC, Sordi A, Cantaluppi V, Tetta C. Microvesicles derived from human adult mesenchymal stem cells protect against ischaemia–reperfusion-induced acute and chronic kidney injury. Nephrol Dial Transplant 2011; 26:1474-1483. doi: 10.1093/ndt/gfr015 [Crossref] [ Google Scholar]
- van Koppen A, Joles JA, van Balkom BW, Lim SK, de Kleijn D, Giles RH. Human embryonic mesenchymal stem cell-derived conditioned medium rescues kidney function in rats with established chronic kidney disease. PloS one 2012; 7:e38746. doi: 10.1371/journal.pone.0038746 [Crossref] [ Google Scholar]
- Zhou Y, Xu H, Xu W, Wang B, Wu H, Tao Y. Exosomes released by human umbilical cord mesenchymal stem cells protect against cisplatin-induced renal oxidative stress and apoptosis in vivo and in vitro. Stem Cell Res Ther 2013; 4:1-13. doi: 10.1186/scrt194 [Crossref] [ Google Scholar]
- Lim RB, Loy EY, Lim GH, Zheng H, Chow KY, Lim ST. Micro‐vesicles derived from human Wharton's Jelly mesenchymal stromal cells mitigate renal ischemia‐reperfusion injury in rats after cardiac death renal transplantation. J Cell Biochem 2018; 119:1879-1888. doi: 10.1002/jcb.26348 [Crossref] [ Google Scholar]
- Collino F, Bruno S, Incarnato D, Dettori D, Neri F, Provero P. AKI recovery induced by mesenchymal stromal cell-derived extracellular vesicles carrying microRNAs. J Am Soc Nephrol 2015; 26:2349-2360. doi: 10.1681/ASN.2014070710 [Crossref] [ Google Scholar]
- Ju GQ, Cheng J, Zhong L, Wu S, Zou XY, Zhang GY. Microvesicles derived from human umbilical cord mesenchymal stem cells facilitate tubular epithelial cell dedifferentiation and growth via hepatocyte growth factor induction. PloS one 2015; 10:e0121534. doi: 10.1371/journal.pone.0121534 [Crossref] [ Google Scholar]
- Jiang ZZ, Liu YM, Niu X, Yin JY, Hu B, Guo SC. Exosomes secreted by human urine-derived stem cells could prevent kidney complications from type I diabetes in rats. Stem Cell Res Ther 2016; 7:1-13. doi: 10.1186/s13287-016-0287-2 [Crossref] [ Google Scholar]
- Ranghino A, Bruno S, Bussolati B, Moggio A, Dimuccio V, Tapparo M. The effects of glomerular and tubular renal progenitors and derived extracellular vesicles on recovery from acute kidney injury. Stem Cell Res Ther 2017; 8:1-15. doi: 10.1186/s13287-017-0478-5 [Crossref] [ Google Scholar]
- Shen B, Liu J, Zhang F, Wang Y, Qin Y, Zhou Z. CCR2 positive exosome released by mesenchymal stem cells suppresses macrophage functions and alleviates ischemia/reperfusion-induced renal injury. Stem Cells Int 2016; 6:2129. doi: 10.1155/2016/1240301 [Crossref] [ Google Scholar]
- Alfarano C, Roubeix C, Chaaya R, Ceccaldi C, Calise D, Mias C. Intraparenchymal injection of bone marrow mesenchymal stem cells reduces kidney fibrosis after ischemia-reperfusion in cyclosporine-immunosuppressed rats. Cell Transplant 2012; 21:2009-2019. doi: 10.3727/096368912X640448 [Crossref] [ Google Scholar]
- Nassar W, El-Ansary M, Sabry D, Mostafa MA, Fayad T, Kotb E. Umbilical cord mesenchymal stem cells derived extracellular vesicles can safely ameliorate the progression of chronic kidney diseases. Biomater Res 2016; 20:1-11. doi: 10.1186/s40824-016-0068-0 [Crossref] [ Google Scholar]
- Zou X, Zhang G, Cheng Z, Yin D, Du T, Ju G. Microvesicles derived from human Wharton’s Jelly mesenchymal stromal cells ameliorate renal ischemia-reperfusion injury in rats by suppressing CX3CL1. Stem Cell Res Ther 2014; 5:1-13. doi: 10.1186/scrt428 [Crossref] [ Google Scholar]
- Semedo P, Correa-Costa M, Antonio Cenedeze M, Maria Avancini Costa Malheiros D, Antonia dos Reis M, Shimizu MH. Mesenchymal stem cells attenuate renal fibrosis through immune modulation and remodeling properties in a rat remnant kidney model. Stem Cells 2009; 27:3063-3073. doi: 10.1002/stem.214 [Crossref] [ Google Scholar]