Bioimpacts. 2025;15:30585.
doi: 10.34172/bi.30585
Original Article
In-silico analysis of CEP55/E2F1/hsa-let-7b-5p/TMPO-AS1 axis-based ceRNA network promoting poor prognosis in lung adenocarcinoma smokers
Prerna Vats Formal analysis, Investigation, Methodology, Software, Validation, Visualization, Writing – original draft, Writing – review & editing, 
Sakshi Nirmal Formal analysis, Investigation, Methodology, Software, Visualization, Writing – original draft, Writing – review & editing,
Gurpreet Bamrah Formal analysis, Investigation, Software, Visualization, Writing – original draft, Writing – review & editing,
Saurabh Srivastava Data curation, Formal analysis, Investigation, Software, Visualization, Writing – original draft, Writing – review & editing,
Rajeev Nema Conceptualization, Data curation, Formal analysis, Funding acquisition, Investigation, Methodology, Project administration, Resources, Software, Supervision, Validation, Visualization, Writing – original draft, Writing – review & editing, , *
Author information:
Department of Biosciences, Manipal University Jaipur, Dehmi Kalan, Jaipur-Ajmer Expressway, Jaipur, Rajasthan, 303007, India
Abstract
Introduction:
Smoking causes severe lung adenocarcinoma. High CEP55 expression correlates with clinico-pathological features, suggesting the mRNA/miRNA/lncRNA-ceRNA network’s crucial to prognosis.
Methods:
The study used databases like TIMER 2.0, UALCAN, OncoMX, GEPIA2, OncoDB, ENCORI, KM Plotter, TNMplot, CancerSEA, CellTracer, GENI, Intogen, miRNet, TISIDB, GSCA, the Enrichr, HDOCK, and LigPlot databases to analyze CEP55 and associated ceRNA expression in lung cancer tumors and normal tissues.
Results:
The CEP55 gene is overexpressed in both lung squamous cell carcinoma (LUSC) and adenocarcinoma (LUAD). Findings suggested that overexpression of CEP55 has a poor prognosis in terms of overall survival (OS) (HR=1.63, CI=1.44–1.84, P=1.4e-15), first progression (FP) (HR=1.81, CI=1.52–2.15, P=6.4e-12), and post-progression survival (PPS) (HR=1.141, CI=1.14–1.74, P=00012). Particularly, high CEP55 expression is significantly associated with OS+LUAD patients (HR=1.55, CI=1.3-1.84, P=7.2e-07) and those with OS+LUAD smokers (HR=1.49, CI=1.15-1.94, P=0.0026). The study found a strong link between lncRNA-TMPO-AS1 overexpression and poor prognosis in LUAD+smokers, and hsa-let-7b-5p downexpression was associated with poor survival in LUAD. The least binding energy or most favourable interaction score between hsa-let-7b-5p and CEP55 was found to be -124.52 kcal/mol.
Conclusion:
Smokers with lung adenocarcinoma had worse prognoses due to higher E2F1, CEP55, and TMPO-AS1 levels. Also, TMPO-AS1 sponge formation with hsa-let-7b-5p may be the cause of this feedback loop.
Keywords: CEP55, Lung adenocarcinoma, ceRNA Network, Prognosis, Smokers
Copyright and License Information
© 2025 The Author(s).
This work is published by BioImpacts as an open access article distributed under the terms of the Creative Commons Attribution Non-Commercial License (
http://creativecommons.org/licenses/by-nc/4.0/). Non-commercial uses of the work are permitted, provided the original work is properly cited.
Funding Statement
RN would like to thank the funding support from Manipal University Jaipur for the Enhanced Seed Grant under the Endowment Fund (No. E3/2023-24/QE-04-05).
Introduction
Lung cancer is the leading cause of cancer-related deaths worldwide, with lung squamous cell carcinoma (LUSC) and adenocarcinoma (LUAD) accounting for most cases.1 Even though diagnosis and treatment have come a long way, biomarkers for early detection, predicting high relapse and death rates, and finding molecular target or personalized therapies are still not good enough.2 Advancements in genomics and transcriptomics offer new perspectives on molecular and regulatory mechanisms involved in lung malignancy, helping to find new target molecules that improve lung cancer patient outcomes.3 High-throughput technologies have enabled the discovery of new biomarkers, particularly for non-coding RNAs (ncRNAs), such as long ncRNAs (lncRNAs) and microRNAs (miRNAs).4 CEP55 (Centrosomal protein of 55 kDa), a key protein in the cytoplasm, plays a crucial role in mitotic exit and cytokinesis.5 It is present at centrosomes during interphase and is associated with the mother centriole.6,7 During mitosis, it diffuses throughout the cell and appears at the cleavage furrow in the late anaphase, as well as in the midbody during cytokinesis. During cytokinesis, CEP55 recruits PDCD6IP and TSG101 to the midbody, but they are not required for microtubule nucleation.8 A study looked at how genes CEP55, hsa-let-7b-5p (miRNA), and TMPO-AS1 (lncRNA) were expressed in lung adenocarcinoma and healthy tissue, which shows the novelty of the study, as identifying the regulatory mechanism working behind the CEP55 dysregulation with the help of a competitive endogenous RNA (ceRNA) network is yet to be discovered. The findings showed that hsa-let-7b-5p expression was lower in lung adenocarcinoma tissue than in healthy tissue. On the other hand, CEP55 and TMPO-AS1 expression were higher in lung adenocarcinoma tissue. This suggests they could play a role in preventing tumor growth. In cancer, E2F1, a transcription factor constantly binds to the promoter region of the CEP55 gene, causing overexpression of CEP55 mRNA in LUAD, leading to chromosomal instability and aggressive tumor growth. The CEP55/E2F1/TMPO-AS1/hsa-let-7b-5p axis is critical for lung adenocarcinoma cell proliferation and metastasis, and it may be a target for therapeutic intervention.
Methods
Expression analysis CEP55
The study used the OncoMX9 database to study the gene expression of the CEP55 gene across TCGA cancers. Further, the TNMplot,10 TIMER 2.0,11 and UALCAN12 databases were used to study the gene expression of CEP55 in pan-cancer. The differential expression analysis of CEP55 was done using the UALCAN, GEPIA213 and ENCORI14 databases, in which the expression level between tumor vs. normal was evaluated in both LUAD and LUSC. Also, UALCAN was used to examine the relationship between CEP55 and patient clinicopathological characteristics such as smoking history and gender. Housekeeping and CEP55 gene expression were validated by the CancerSEA15 database.
Survival analysis
The Kaplan-Meier Plotter16 was utilized for survival analysis on lung cancer datasets, focusing on the gene symbols CEP55, E2F1, TMPO-AS1, and hsa-let-7b-5p, a key factor in the disease. The analysis included the histological subtypes, namely, adenocarcinoma and squamous cell carcinoma, along with their association with smoker patients: "Gene symbol, Affy id: “CEP55: 218542_at; TMPO-AS1: 227578_at; E2F1: 2028_s_at”.
Competitive endogenous RNA (ceRNA) regulatory network analysis
Enrichr17 and UALCAN databases were used to identify lncRNA associated with CEP55, with the co-relation values validated using ENCORI. The prognostic significance was studied using KM Plotter, further, UALCAN was used to analyze lncRNA expression level in patients with smoking history, and the ENCORI, OncoDB databases used for correlation analysis. The study further utilized the miRNet database to analyze the miRNA network linked to lncRNA and CEP55. The correlation between CEP55, lncRNA and miRNA was verified using the ENCORI database. UALCAN was used to identify miRNA differential expression and pathological parameters like smoking status in patients with LUAD. The prognostic significance of CEP55-associated miRNA was evaluated using the KM plotter.
The transcription regulation analysis
The transcriptional factors regulating the role of the CEP55 gene were analyzed using the miRNet18 database. Further, their correlation efficiency associated with CEP55 was found using TIMER, OncoDB,19 and ENCORI. The prognostic value was studied using the KM Plotter, including analysis of histology and histology with smoking history (Affy ID: 2028_s_at; E2F1).
Docking of miRNA and CEP55 protein
miRNA was first modelled using the SWISS-MODEL server,20 which is a homology modelling platform to generate three-dimensional (3D) structures of nucleic acids and proteins. In a similar way, the 3D structure of the CEP55 protein was obtained from the RCSB Protein Data Bank (PBD ID: 3E1R). After preparation of the systems, molecular docking was performed using HDOCK.21 The HDOCK is an algorithm designed to predict the binding modes of protein-protein and protein-RNA complexes. This docking analysis helps explore the binding interface and interaction patterns between the miRNA and the protein. Further investigation of the specific interactions between miRNA and the CEP55 was employed using LigPlot.22
CEP55 biological process and proliferation analysis
The correlation between CEP55 and the proliferation marker MKI67 was found using TIMER2.0, OncoDB, and ENCORI. The regulatory mechanism behind MKI67 was determined using the ENCORI database. GSCA23 was used to determine their expression trend in pathological stages. Further, the participation of CEP55 in various biological processes during lung cancer was determined using the CellTracer, CancerSEA,24 and GENI databases.25 Metastatic participation was visualized using TNMplot, mutation-based analysis was performed using the Intogen database,26 and the correlation between CEP55 overexpression associated with Tumor Immune Infiltrating Cells (TIICs) was determined using TISIDB27 and TIMER2.0.
Statistical analysis
CEP55 gene expression was analyzed using publicly available online database models to compare tumors and normal samples. The relationship between CEP55 gene expression and prognosis was examined. CEP55 performance, heterogeneity, and gene enrichment Log-Rank test was used to compare survival rates, and the significance level was P < 0.05.
Results
CEP55: pan-cancer analysis and prognostic importance
First, we used the OncoMX database to analyze CEP55 expression across various cancers. Results showed that CEP55 was overexpressed in several cancers, with CEP55 being most expressed in lung cancer cases, as shown in Table 1. Similarly, the UALCAN database showed that CEP55 was overexpressed in all the TCGA cancers, as shown in Fig. 1A. Further research using the TIMER 2.0 and UALCAN databases showed that CEP55 was overexpressed in lung adenocarcinoma (LUAD) and lung squamous cell carcinoma (LUSC), as shown in Figs. 1B and C. Next, we analyzed the differential expression of CEP55 in lung cancer (LUAD) and lung squamous cell carcinoma (LUSC) using the UALCAN database. The results showed that CEP55 expression was significantly overexpressed in both subtypes, with a fold change of 8.7 and 9.6, respectively, as shown in Figs. 2A–2B. Using the ENCORI and GEPIA 2 databases, Fig. 2C-E shows a consistent pattern of overexpression in both LUAD and LUSC. We also used the CancerSEA database to evaluate CEP55 gene expression against housekeeping genes, and we noticed an 8-fold increase in LUAD compared to housekeeping genes, as shown in Fig. 2F.
Table 1.
CEP55 pan-cancer analysis
|
UniProtKB
|
Gene Symbol
|
Log2 F.C.
|
P
value
|
Adj.
P
value
|
Significant
|
Expression Trend
|
TCGA Study
|
Patient Freq.
|
Source
|
| Q53EZ4 |
CEP55 |
0.31 |
0.0355 |
0.0616 |
No |
up |
thyroid cancer |
33 |
TCGA |
| 1.95 |
1.01e-29 |
2.73e-27 |
Yes |
up |
stomach cancer |
24 |
| 3.11 |
2.1e-48 |
4.19e-46 |
Yes |
up |
liver cancer |
29 |
| 3.64 |
7.35e-90 |
5.77e-87 |
Yes |
up |
uterine cancer |
16 |
| 1.74 |
6.28e-13 |
2.06e-11 |
Yes |
up |
bladder cancer |
13 |
| 1.79 |
3.92e-46 |
9.43e-44 |
Yes |
up |
Head and neck cancer |
36 |
|
3.78
|
1.88e-257
|
2.25e-254
|
Yes
|
up
|
lung cancer
|
78
|
| 2.09 |
3.92e-14 |
9.55e-12 |
Yes |
up |
esophageal cancer |
7 |
| 1.53 |
5.79e-52 |
2.9e-50 |
Yes |
up |
colorectal cancer |
45 |
| 1.21 |
1.61e-12 |
1.55e-11 |
Yes |
up |
prostate cancer |
42 |
| 2.48 |
6.53e-80 |
4.29e-78 |
Yes |
up |
kidney cancer |
82 |
| 3.42 |
6.48e-188 |
5.06e-185 |
Yes |
up |
breast cancer |
97 |
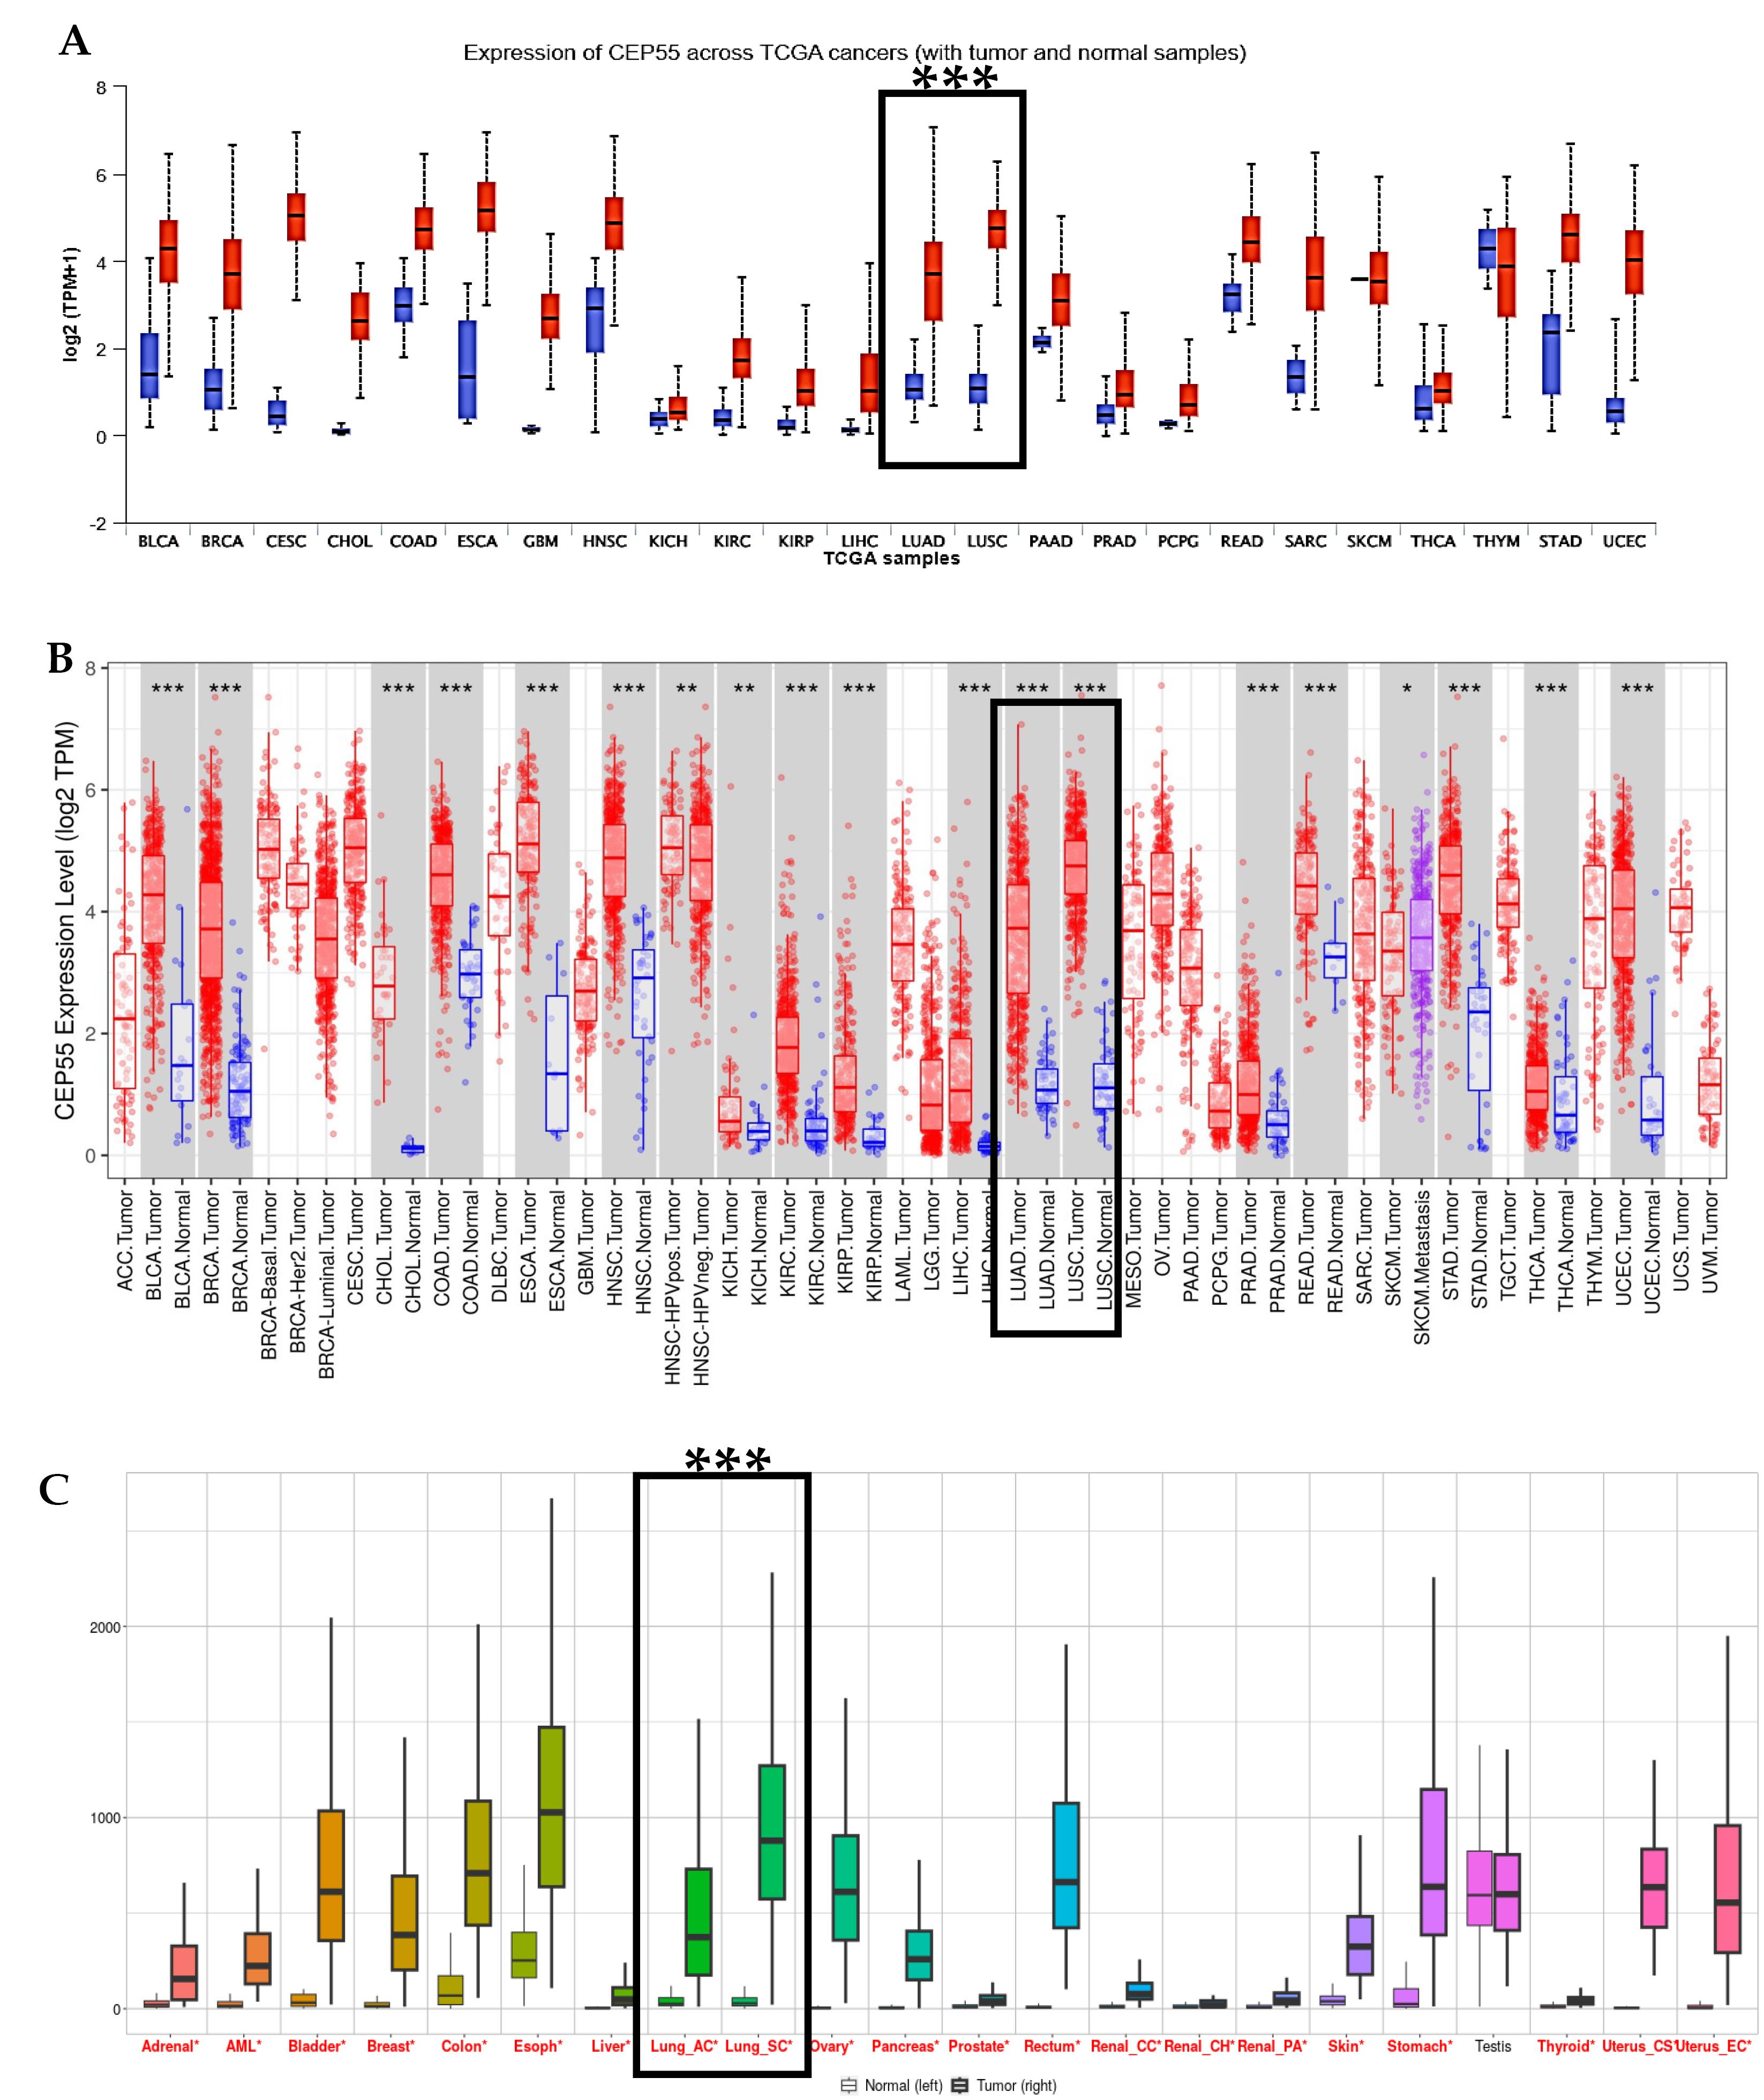
Fig. 1.
Expression Pattern of CEP55 across Pan-Cancer (A) The expression profile of the CEP55 was determined by the UALCAN database; the red boxes indicate their expression level in cancer, and the blue boxes indicate their expression level in normal. (B) TIMER 2.0 database for tumor versus normal samples; the red bar-dot plot indicates tumor, and the blue bar-dot plot corresponds to normal tissue. Error bars represent the SD (***P < 0.001). (C) Expression of CEP55 in pan-cancer by TNMplot database, tumors compared with matched normal samples.
.
Expression Pattern of CEP55 across Pan-Cancer (A) The expression profile of the CEP55 was determined by the UALCAN database; the red boxes indicate their expression level in cancer, and the blue boxes indicate their expression level in normal. (B) TIMER 2.0 database for tumor versus normal samples; the red bar-dot plot indicates tumor, and the blue bar-dot plot corresponds to normal tissue. Error bars represent the SD (***P < 0.001). (C) Expression of CEP55 in pan-cancer by TNMplot database, tumors compared with matched normal samples.
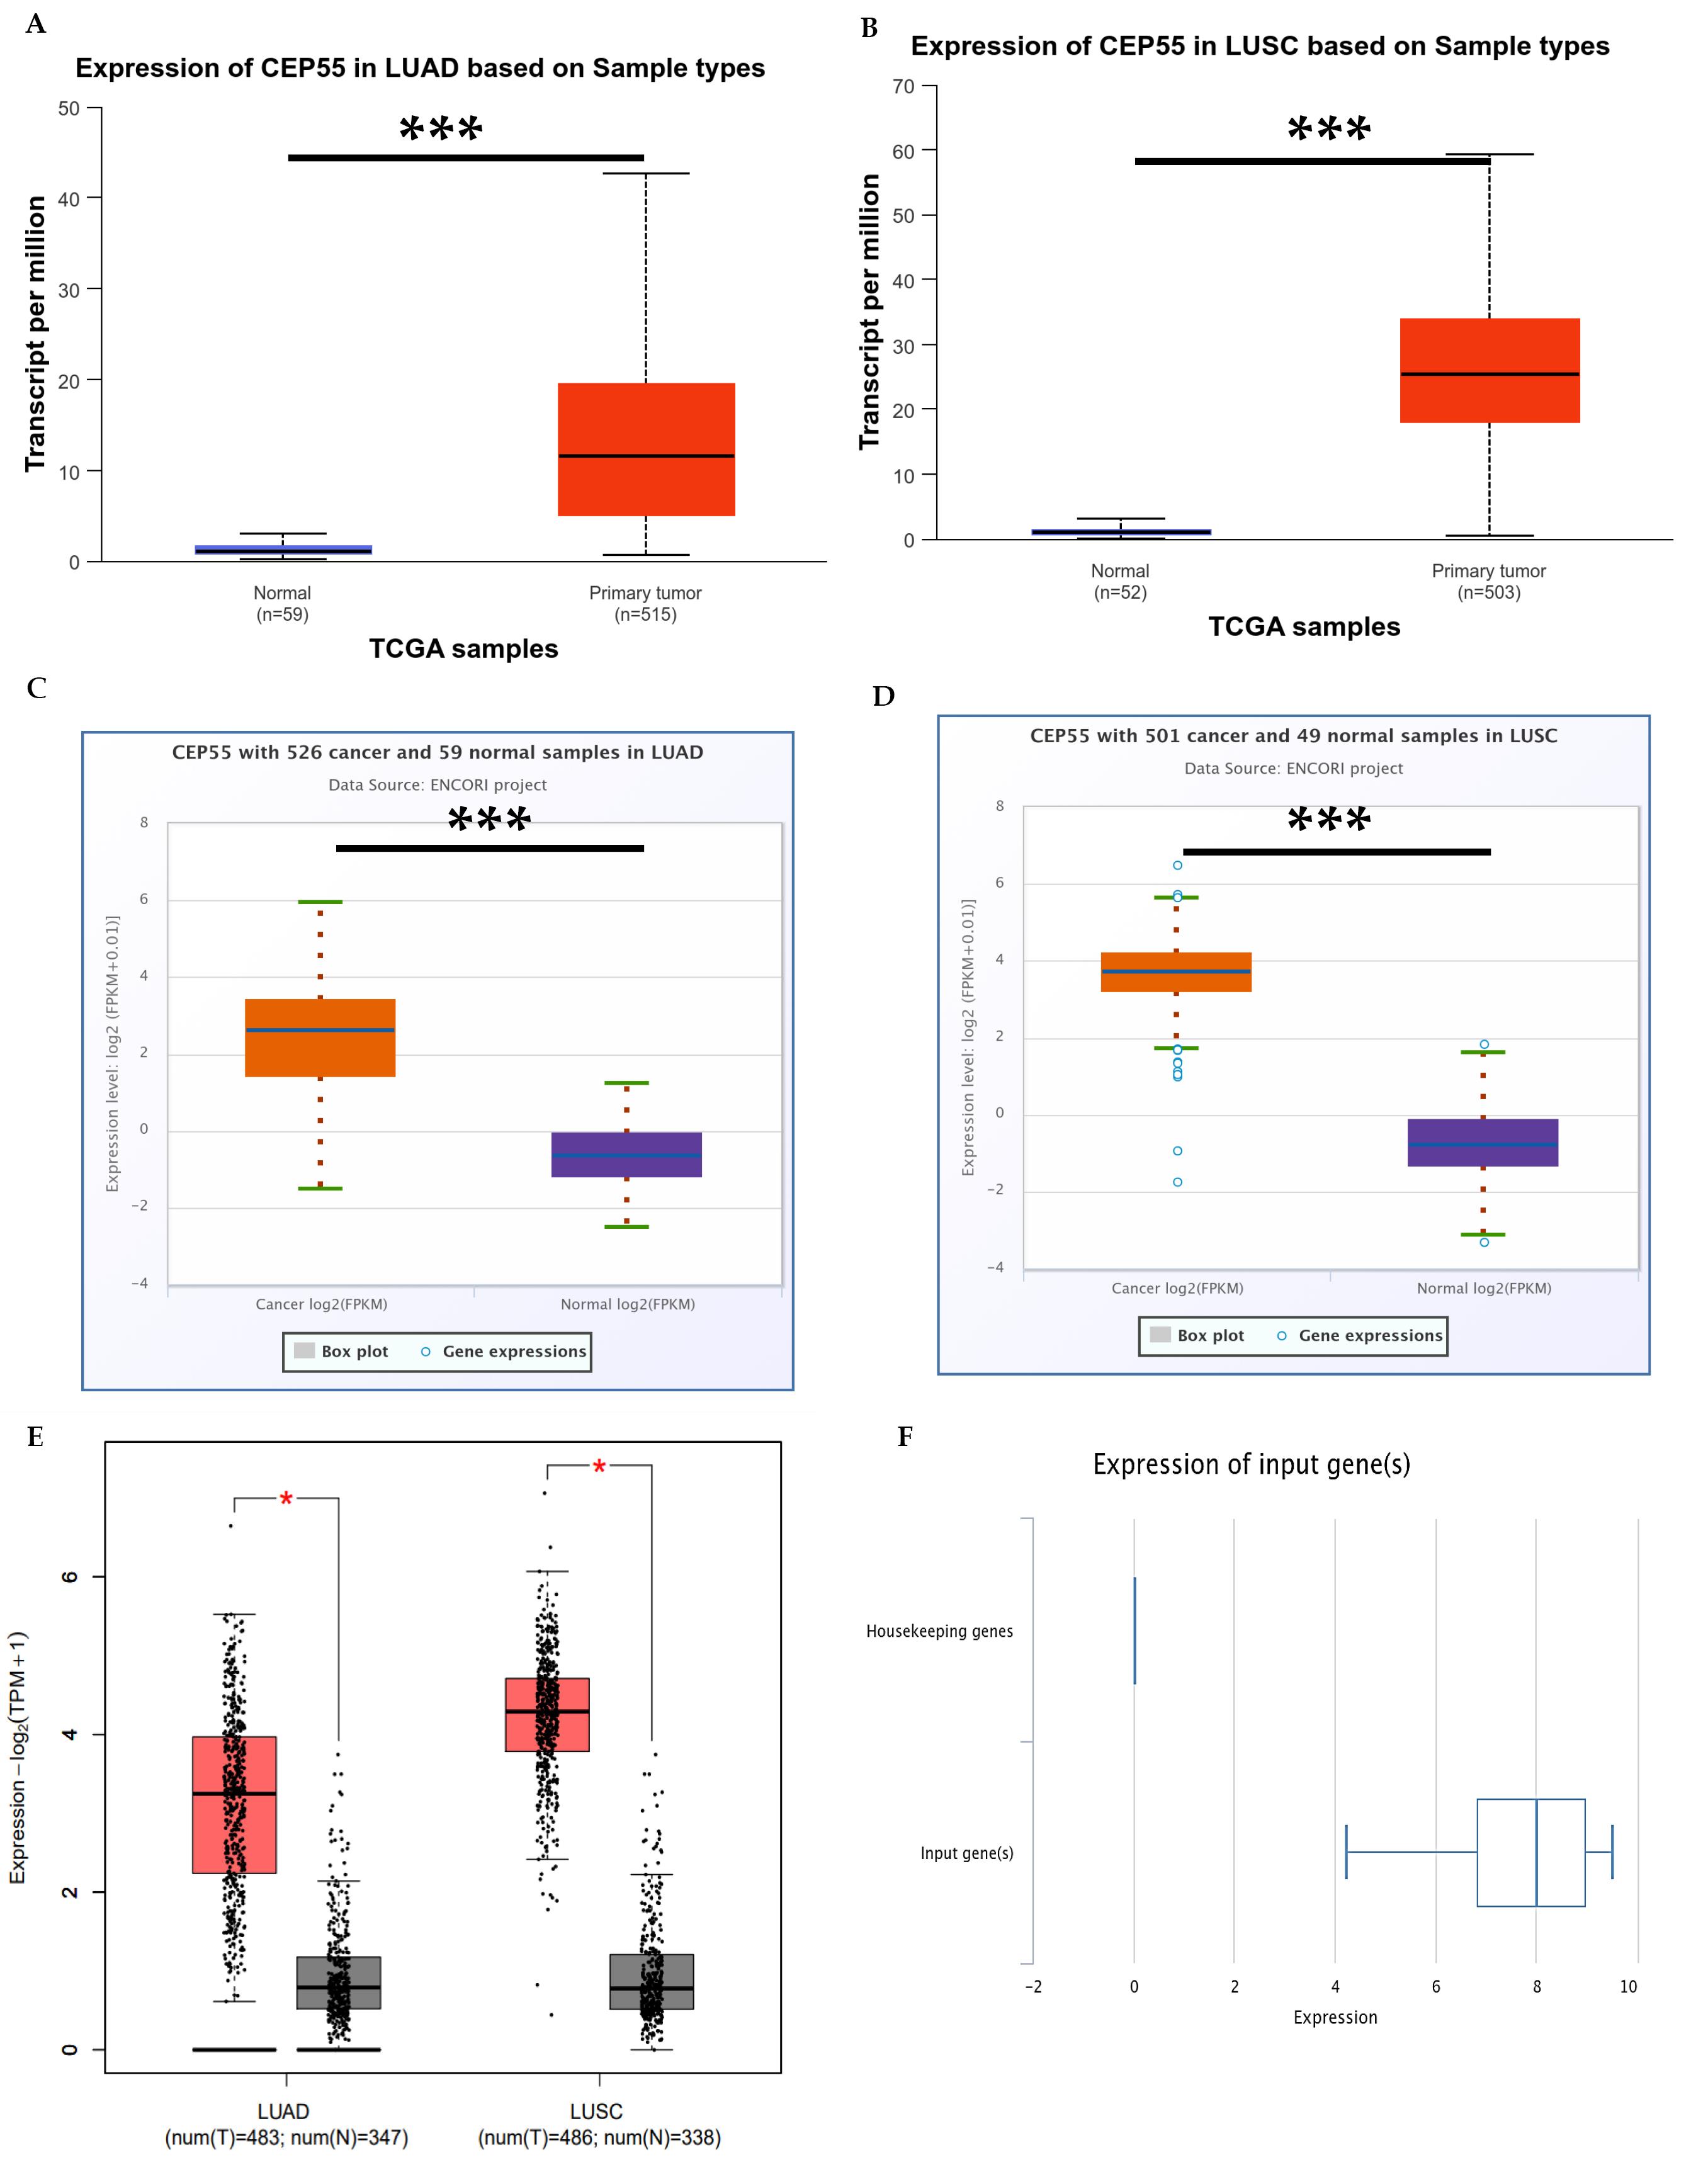
Fig. 2.
Differential expression of CEP55 in lung cancer (A–E), mRNA expression was analyzed in normal lung tissue and primary tumors. UALCAN database showing (A) LUAD (normal n = 59, tumor n = 515), (B) LUSC (normal n = 52, tumor n = 503). Using ENCORI: (C) LUAD (normal n = 59, tumor n = 526), and (D) LUSC (normal n = 49, tumor n = 501). GEPIA2 showing (E) adenocarcinoma (normal N = 347, tumor T = 483), squamous cell carcinoma (normal N = 338, tumor T = 486). The CancerSEA database was used to analyze the expression of the CEP55 gene vs. housekeeping genes.
.
Differential expression of CEP55 in lung cancer (A–E), mRNA expression was analyzed in normal lung tissue and primary tumors. UALCAN database showing (A) LUAD (normal n = 59, tumor n = 515), (B) LUSC (normal n = 52, tumor n = 503). Using ENCORI: (C) LUAD (normal n = 59, tumor n = 526), and (D) LUSC (normal n = 49, tumor n = 501). GEPIA2 showing (E) adenocarcinoma (normal N = 347, tumor T = 483), squamous cell carcinoma (normal N = 338, tumor T = 486). The CancerSEA database was used to analyze the expression of the CEP55 gene vs. housekeeping genes.
The study then established CEP55's prognostic significance using the KM Plotter as shown in Table 2. The results demonstrated a significant association between overexpression of CEP55 and a poor prognosis in terms of overall survival (OS) (HR = 1.63, CI = 1.44–1.84, P = 1.4e-15), first progression (FP) (HR = 1.81, CI = 1.52–2.15, P = 6.4e-12), and post-progression survival (PPS) (HR = 1.141, CI = 1.14–1.74, P = 0.0012) as shown in Fig. 3A-C. Another thing we investigated was the KM plotter for lung cancer classification, which includes LUAD and LUSC. Our research showed that having high levels of CEP55 was linked to a worse prognosis for OS with LUAD (HR = 1.55, CI = 1.3-1.84, P = 7.2e-07), FP with LUAD (HR = 1.94, CI = 1.59-2.38, P = 7.4e-11), and PPS with LUAD (HR = 1.29, CI = 1.01-1.64, P = 0.039), as shown in Fig. 3D–F. Fig. 3G–I revealed no significant association between high expression of CEP55 and a poor prognosis for OS with LUSC (HR = 1.04, CI = 0.85–1.26, P = 0.72), FP with LUSC (HR = 1.21, CI = 0.8–1.82, P = 0.36), or PPS with LUSC (HR = 1, CI = 0.55–1.82, P = 0.99). The study suggests that the overexpression of CEP55 in lung cancer patients is linked to poor prognosis, suggesting it could serve as a prognostic biomarker for high-risk patients.
Table 2.
Survival Index of Lung Cancer Patients: CEP55
|
S. No.
|
Gene
|
Index
|
Patient number
|
Hazard ratio
|
CI
|
Log(P)
|
High expression cohort (months)
|
Low expression cohort (months)
|
| 1 |
CEP55 |
OS |
2166 |
1.63 |
1.44-1.84 |
1.4e-15 |
47 |
93 |
| FP |
1252 |
1.81 |
1.52-2.15 |
6.4e-12 |
11 |
32 |
| PPS |
477 |
1.41 |
1.14-1.74 |
0.0012 |
10 |
20 |
| 2 |
OS + LUAD |
1161 |
1.55 |
1.3-1.84 |
7.2e-07 |
62 |
103 |
| FP + LUAD |
906 |
1.94 |
1.59-2.38 |
7.4e-11 |
12 |
34.9 |
| PPS + LUAD |
376 |
1.29 |
1.01-1.64 |
0.039 |
12.8 |
21 |
| 3 |
OS + LUSC |
780 |
1.04 |
0.85-1.26 |
0.72 |
51.53 |
62 |
| FP + LUSC |
220 |
1.21 |
0.8-1.82 |
0.36 |
11.17 |
14 |
| PPS + LUSC |
51 |
1 |
0.55-1.82 |
0.99 |
8 |
8.71 |
| 4 |
OS + LUAD + Smoker |
546 |
1.49 |
1.15-1.94 |
0.0026 |
71 |
95 |
| FP + LUAD + Smoker |
516 |
1.56 |
1.2-2.02 |
0.00086 |
12 |
28 |
| PPS + LUAD + Smoker |
245 |
1.41 |
1.05-1.91 |
0.023 |
10.38 |
22 |
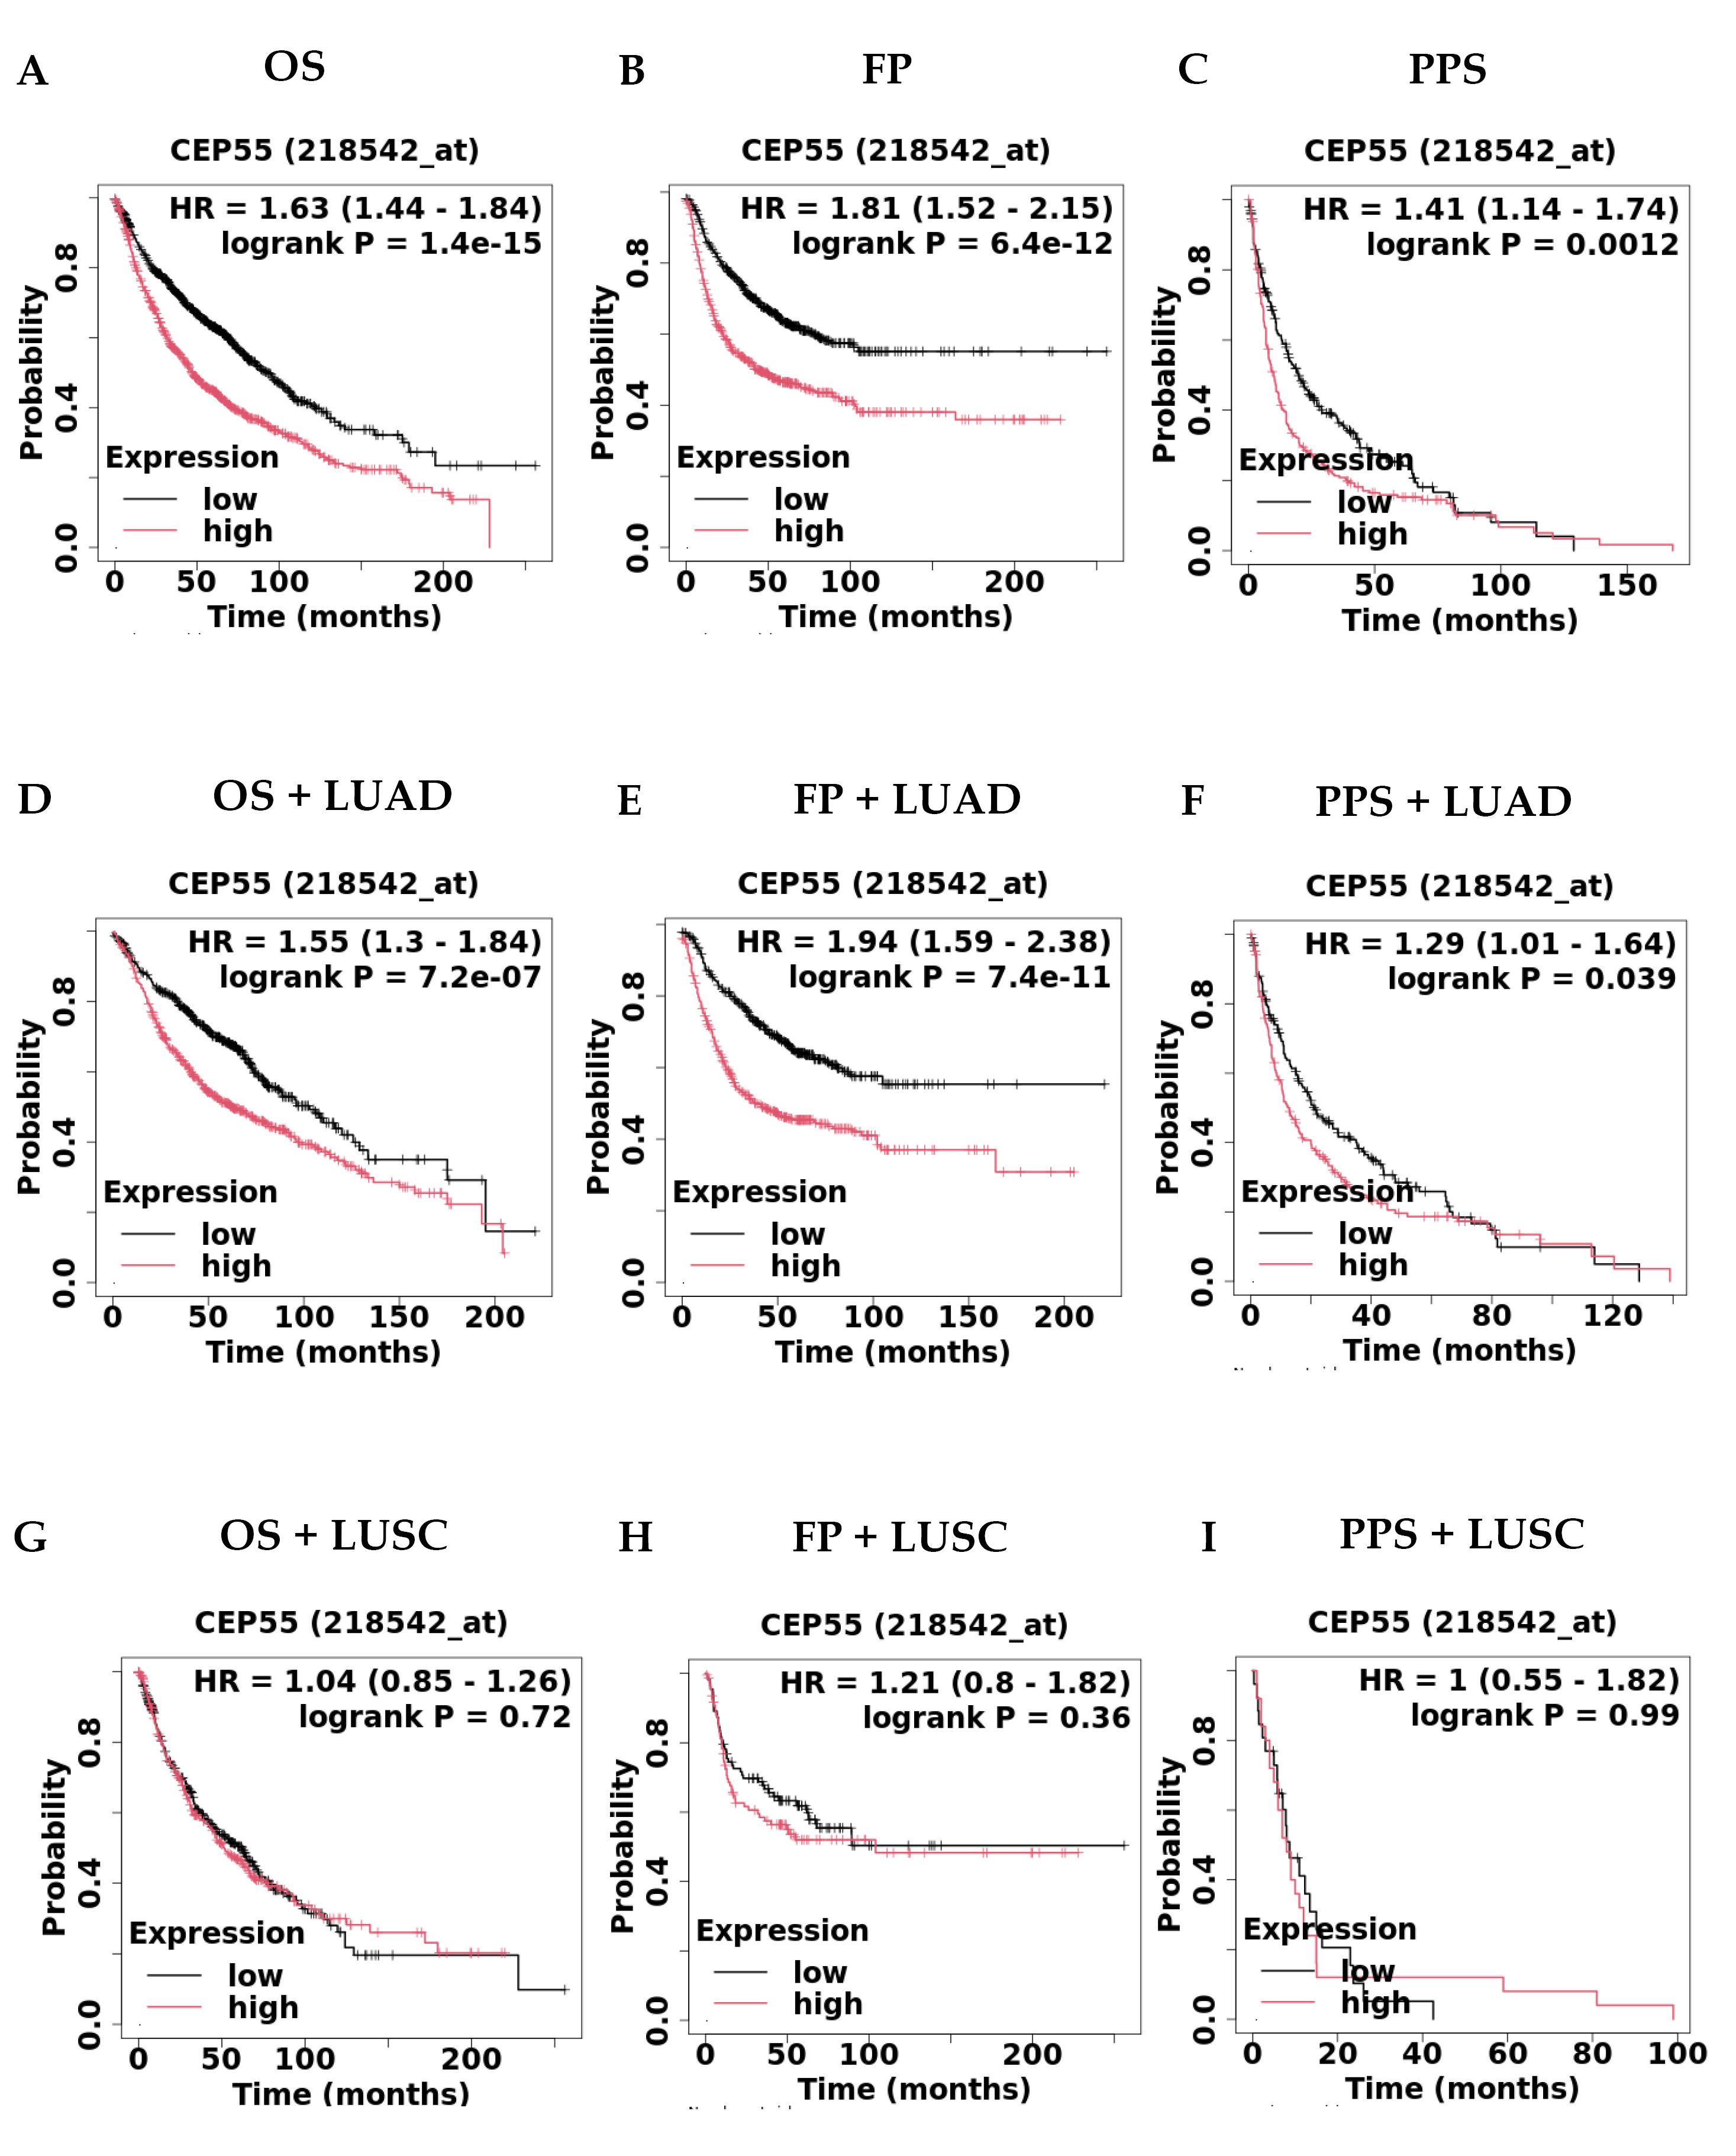
Fig. 3.
Survival analysis of CEP55 overexpression by using KM Plotter in cases of (A) Overall survival (OS) (n = 2166), (B) First progression (FP) (n = 1252), (C) Post progression survival (PPS) (n = 477), (D) OS + LUAD (n = 1161), (E) FP + LUAD (n = 906), (F) PPS + LUAD (n = 376), (G) OS + LUSC (n = 780), (H) FP + LUSC (n = 220), and (I) PPS + LUSC (n = 51).
.
Survival analysis of CEP55 overexpression by using KM Plotter in cases of (A) Overall survival (OS) (n = 2166), (B) First progression (FP) (n = 1252), (C) Post progression survival (PPS) (n = 477), (D) OS + LUAD (n = 1161), (E) FP + LUAD (n = 906), (F) PPS + LUAD (n = 376), (G) OS + LUSC (n = 780), (H) FP + LUSC (n = 220), and (I) PPS + LUSC (n = 51).
The next thing we found was that patients with LUAD who had smoked in the past had significantly lower survival rates in all three types of survival: OS with LUAD + Smoker (HR = 1.49, CI = 1.15-1.94, P = 0.026); FP with LUAD + Smoker (HR = 1.56, CI = 1.2-2.02, P = 0.00086); and PPS with LUAD + Smoker (HR = 1.41, CI = 1.05-1.91, P = 0.023); see Fig. 4A–C. Furthermore, we found that patients with LUAD who had a history of smoking and were male had significantly lower survival rates across all three types of survival (Fig. 4D–F): OS + LUAD + Smoker Male (HR = 1.34); FP with LUAD + Smoker Male (HR = 1.68, CI = 1.19–2.37, P = 0.0031); and PPS with LUAD + Smoker Male (HR = 1.29). In addition, we found that overexpression of CEP55 in patients with LUAD with a history of smoking and females had significantly poorer survival with all three survival statuses: OS with LUAD + Smoker Female (HR = 1.66, CI = 1.12-2.48, P = 0.011), FP with LUAD + Smoker Female (HR = 1.54, CI = 1.03-2.3, P= 0.036), and PPS with LUAD + Smoker Female (HR = 1.65, CI = 1.05-2.58, P = 0.028), as shown in Fig. 4G-I. This suggests that CEP55 may be a potential biomarker for predicting survival in LUAD patients with a history of smoking and females. Our findings suggest that in cases of both male and female LUAD patients with a smoking history, CEP55 could be used as a biomarker for their prognosis.
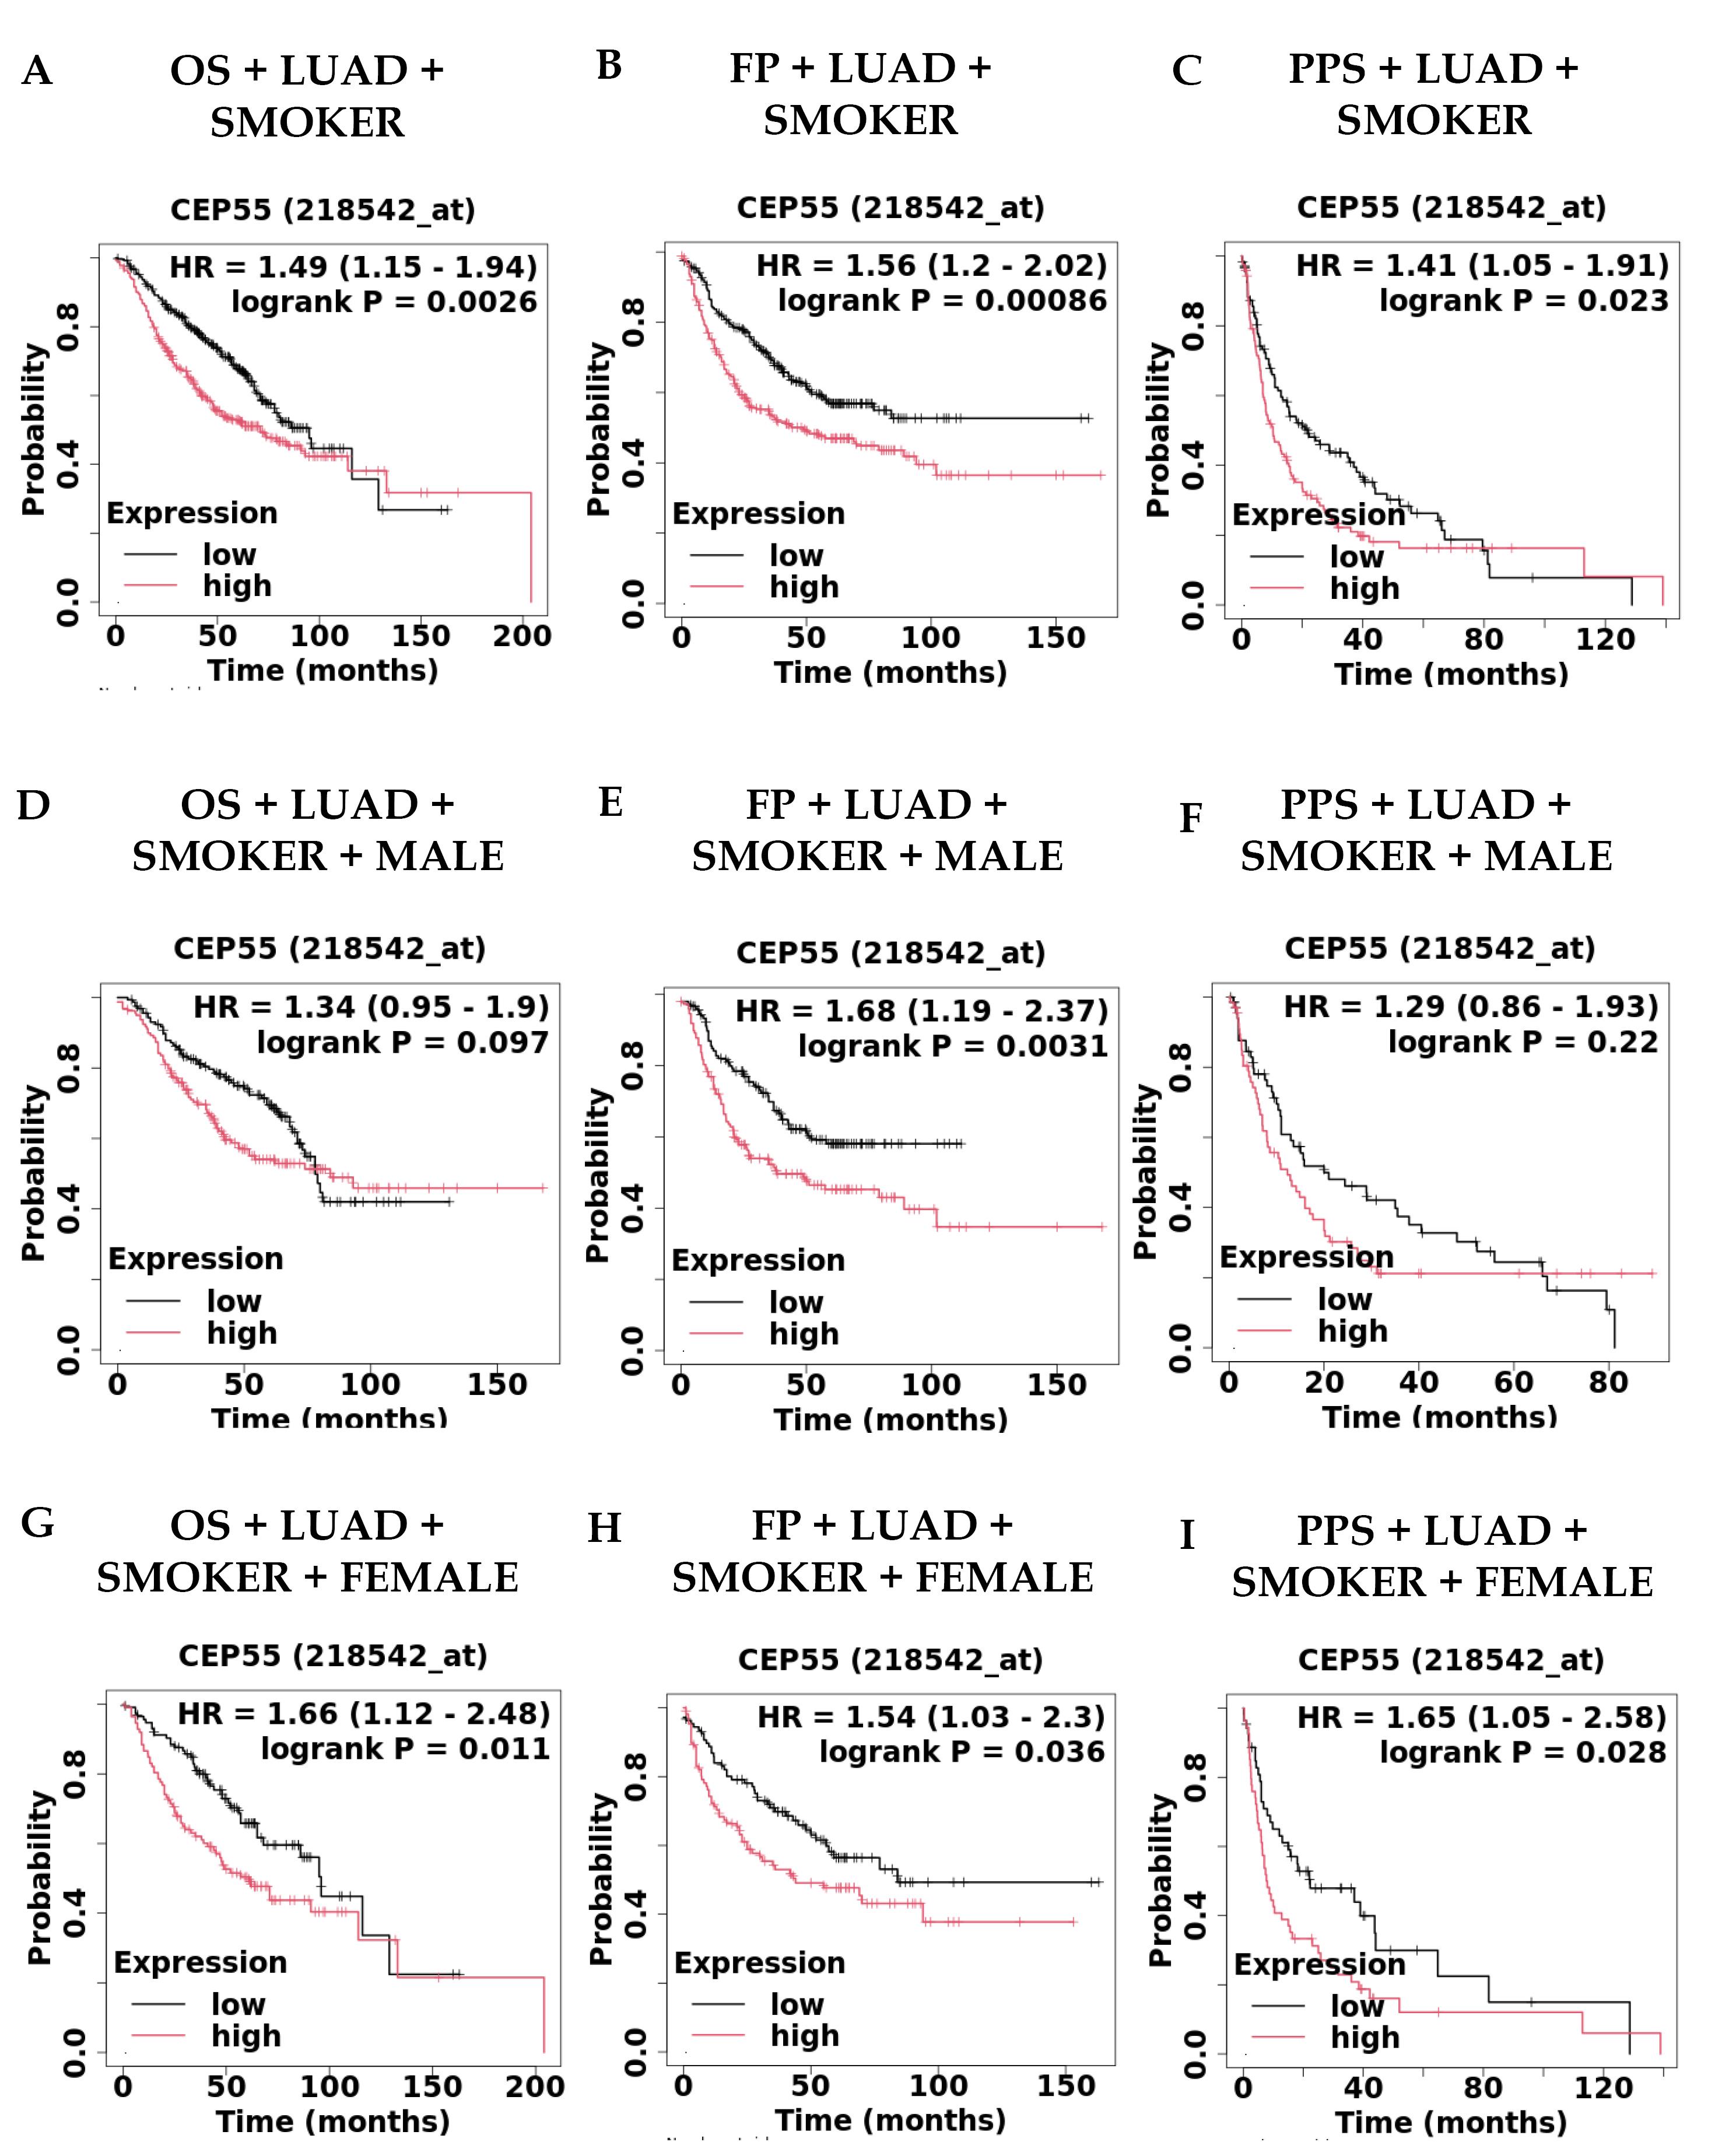
Fig. 4.
Survival analysis of CEP55 overexpression in smoker patients by using KM Plotter in cases of (A) OS + LUAD + Smoker (n = 546), (B) FP + LUAD + Smoker (n = 516), (C) PPS + LUAD + Smoker (n = 245), (D) OS + LUAD + Smoker + Male (n = 319), (E) FP + LUAD + Smoker + Male (n = 299), (F) PPS + LUAD + Smoker + Male (n = 137), (G) OS + LUAD + Smoker + Female (n = 227), (H) FP + LUAD + Smoker + Female (n = 217), and (I) PPS + LUAD + Smoker + Female (n = 108).
.
Survival analysis of CEP55 overexpression in smoker patients by using KM Plotter in cases of (A) OS + LUAD + Smoker (n = 546), (B) FP + LUAD + Smoker (n = 516), (C) PPS + LUAD + Smoker (n = 245), (D) OS + LUAD + Smoker + Male (n = 319), (E) FP + LUAD + Smoker + Male (n = 299), (F) PPS + LUAD + Smoker + Male (n = 137), (G) OS + LUAD + Smoker + Female (n = 227), (H) FP + LUAD + Smoker + Female (n = 217), and (I) PPS + LUAD + Smoker + Female (n = 108).
Analyzing the competitive endogenous RNA regulatory network for CEP55
A wide range of biological and pathological situations, including cancer and immune responses, contain long non-coding RNAs (lncRNAs), which play a significant role in controlling gene expression. This study investigates the synthesis, distribution, functions, and potential therapeutic applications of lncRNAs. We could use these lncRNAs as biomarkers and clinical targets for CEP55. For these purposes, we used the Enrichr database to explore the lncRNAs associated with CEP55 and its network. The top 10 lncRNAs (PRC1-AS1, SGO1-AS1, DEPDC1-AS1, HMMR-AS1, CSRP3-AS1, H2AZ1-DT, LINC01775, TMPO-AS1, DIAPH3-AS1, and RRM1-AS1) were found to have strong relationships with the chosen parameters as shown in Table 3. Finally, we checked the expression of all 10 lncRNAs in LUAD using the UALCAN database. As shown in the Table S1, only five lncRNAs (PRC1-AS1, DEPDC1-AS1, H2AZ1-DT, LINC01775, and TMPO-AS1) were significantly upregulated in LUAD compared to normal. In addition to validating the correlation between CEP55 and the selected five lncRNAs, we found that only DEPDC1-AS1, LINC01775, and TMPO-AS1 exhibit significant correlations (R = 0.512, 0.481, and 0.587, respectively), as illustrated in the Table S2 (see Supplementary file 1). Further, we analyzed all three lncRNAs using the KM plotter database to understand survival and prognosis and found that only the TMPO-AS1 lncRNA was significantly associated with survival status, including LUAD, smoker, male, and female parameters. The results demonstrated a significant association between overexpression of TMPO-AS1 and a poor prognosis in terms of overall survival (OS) (HR = 1.5, CI = 1.29-1.74, P = 7.2e-08), first progression (FP) (HR = 1.9, CI = 1.52-2.38, P = 8.1e-09), and post-progression survival (PPS) (HR = 1.77, CI = 1.32-2.39, P = 0.00013), as shown in Fig. 5A-C.Further, we found that patients with LUAD had significantly lower survival OS with LUAD (HR = 2.16, CI = 1.69-2.76, P = 4.1e-10); FP with LUAD (HR = 1.67, CI = 1.24-2.25, P = 0.00069); and PPS (HR = 1.32, CI = 0.87-2, P = 0.2). as shown in Figure 5D-F and Table S3.
Table 3.
CEP55 associated lncRNAs
|
Index
|
Name
|
P
value
|
Adjusted
P
value
|
Odds ratio
|
Combined score
|
| 1 |
PRC1-AS1 |
1.309e-17 |
2.782e-16 |
865.13 |
33631.66 |
| 2 |
SGO1-AS1 |
1.309e-17 |
2.782e-16 |
865.13 |
33631.66 |
| 3 |
DEPDC1-AS1 |
1.309e-17 |
2.782e-16 |
865.13 |
33631.66 |
| 4 |
HMMR-AS1 |
1.309e-17 |
2.782e-16 |
865.13 |
33631.66 |
| 5 |
CSRP3-AS1 |
7.476e-15 |
7.060e-14 |
499.21 |
16237.80 |
| 6 |
H2AZ1-DT |
7.476e-15 |
7.060e-14 |
499.21 |
16237.80 |
| 7 |
LINC01775 |
7.476e-15 |
7.060e-14 |
499.21 |
16237.80 |
| 8 |
TMPO-AS1 |
7.476e-15 |
7.060e-14 |
499.21 |
16237.80 |
| 9 |
DIAPH3-AS1 |
7.476e-15 |
7.060e-14 |
499.21 |
16237.80 |
| 10 |
RRM1-AS1 |
6.977e-10 |
4.562e-9 |
209.42 |
4415.27 |
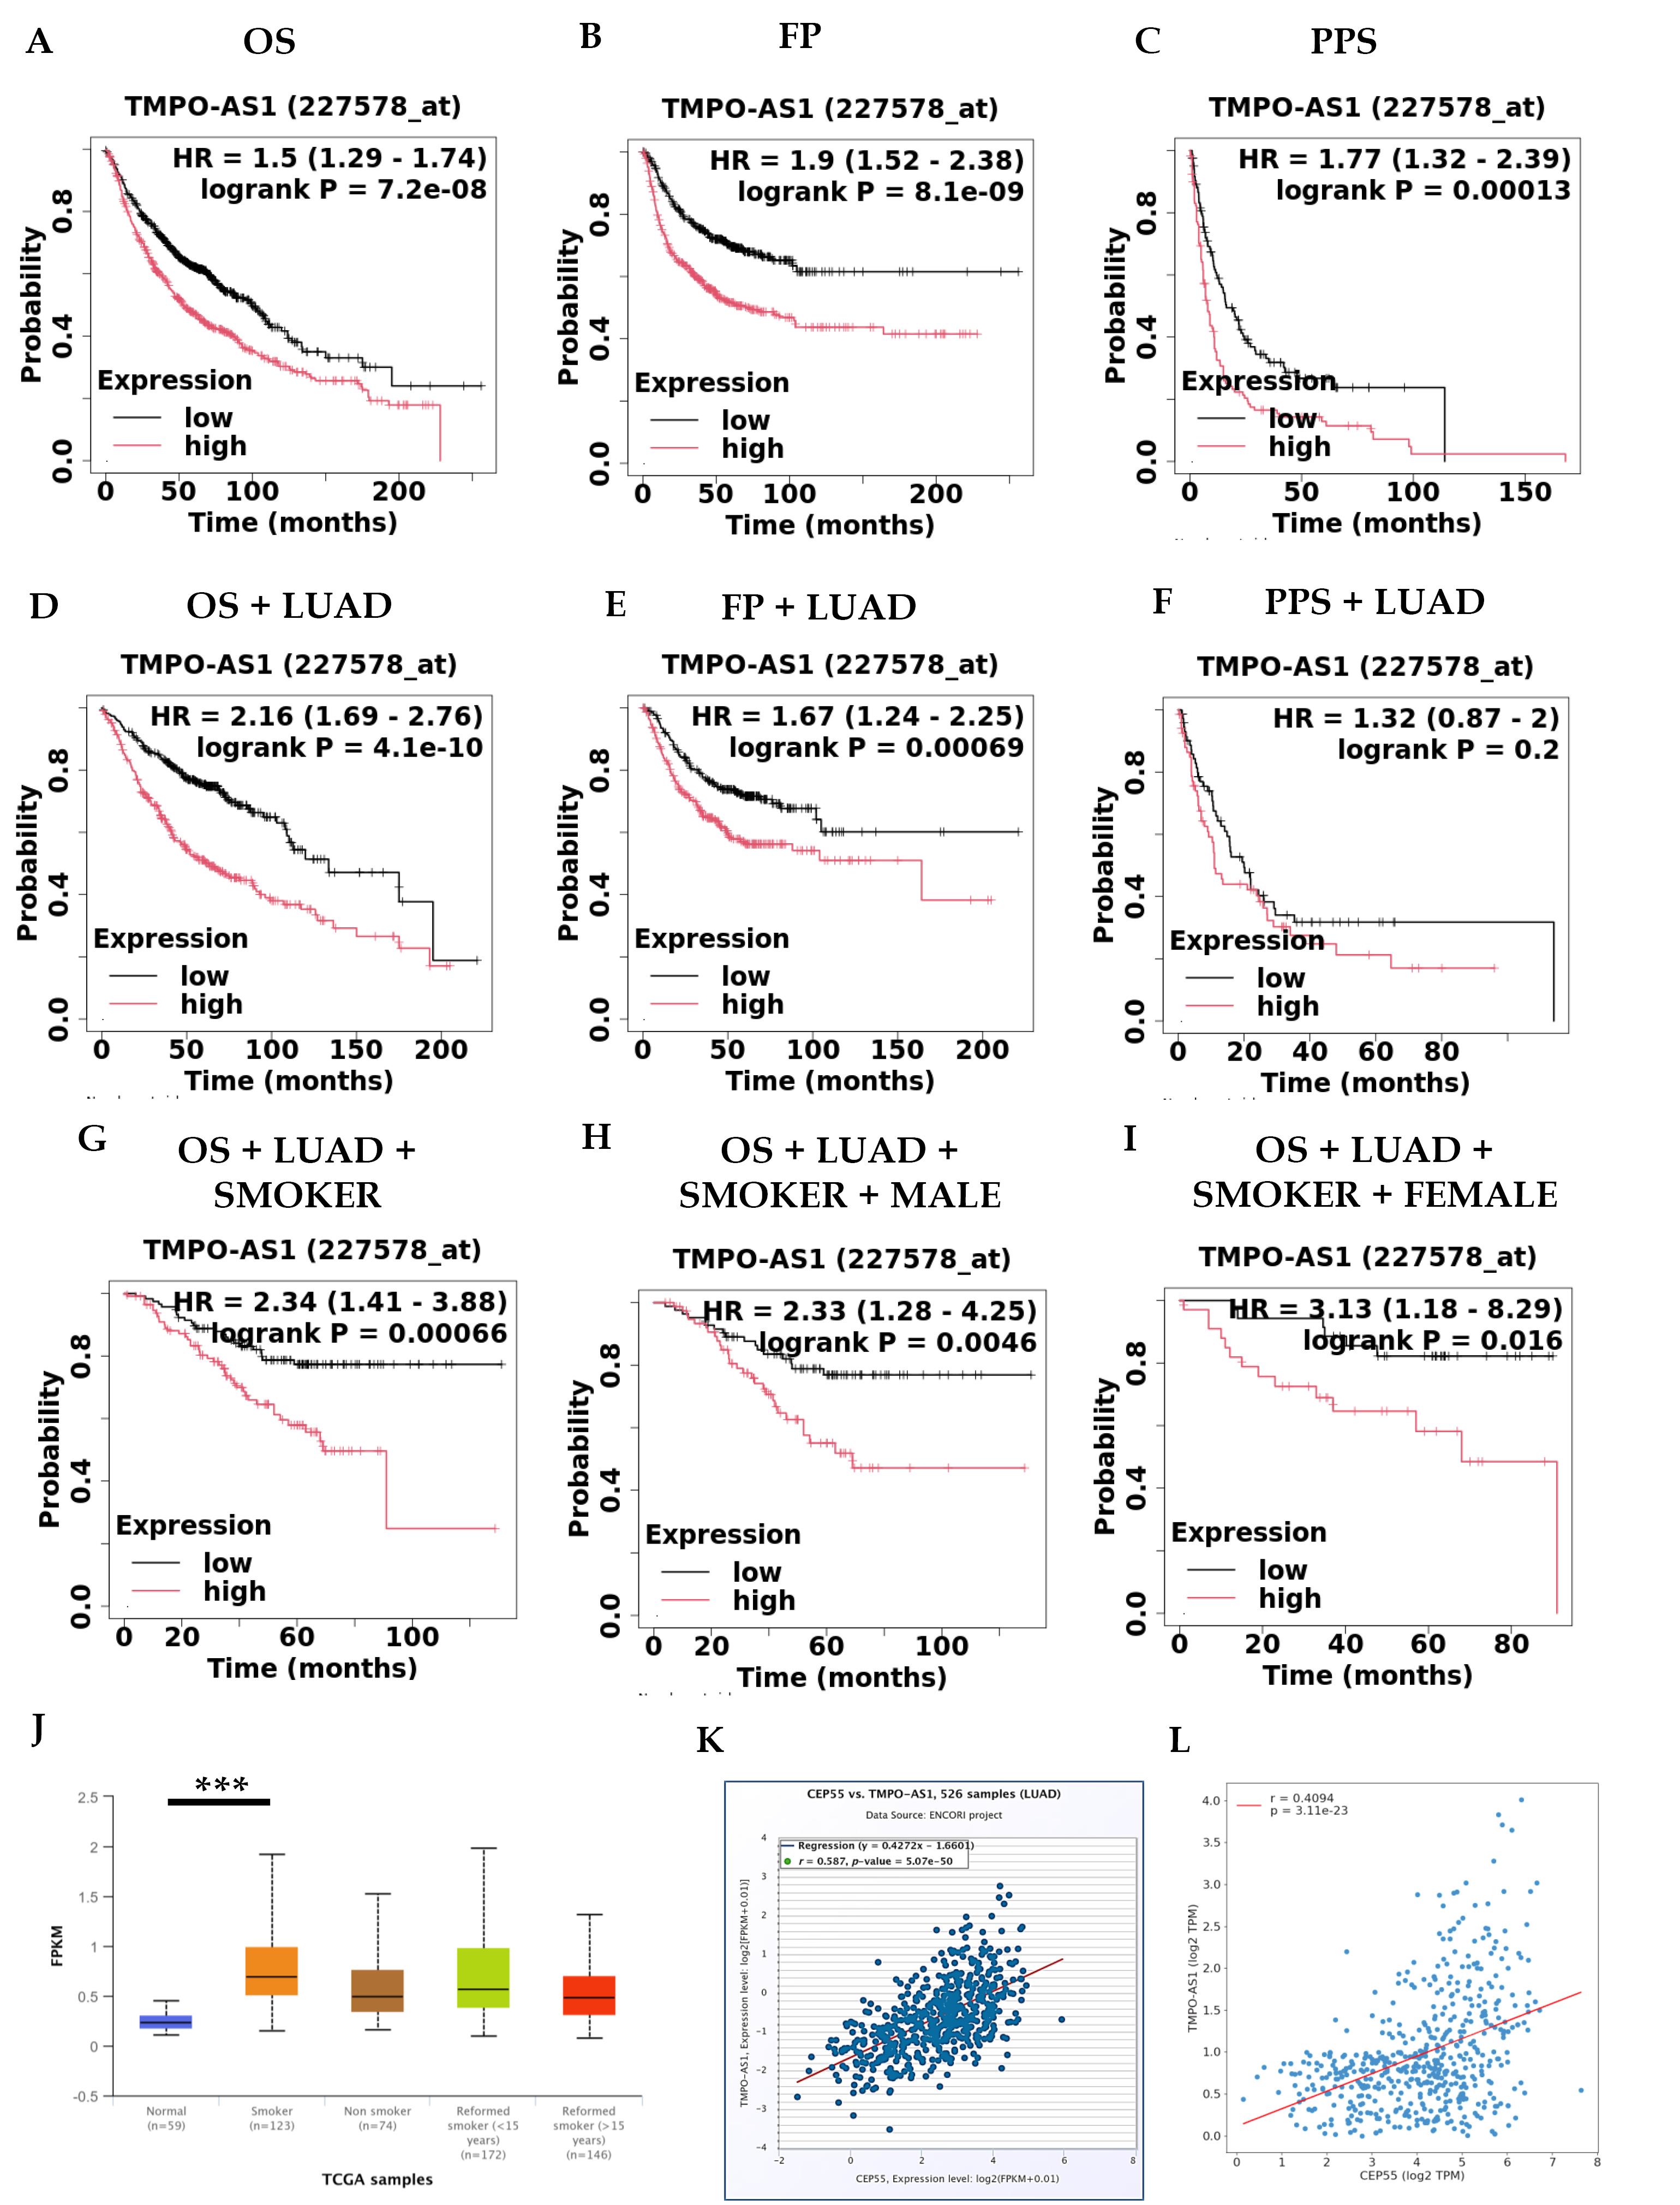
Fig. 5.
Survival analysis of TMPO-AS1 overexpression in LUAD by using KM Plotter in cases of (A) OS (n = 1411), (B) FP (n = 874), (C) PPS (n = 242), (D) OS + LUAD (n = 1161), (E) FP + LUAD (n = 906), (F) PPS + LUAD (n = 376), (G) OS + LUAD + Smoker (n = 546), (H) OS + LUAD + Smoker + Male (n = 319), and (I) OS + LUAD + Smoker + Female (n = 227) (J) TMPO-AS1 expression based on the smoking status by using the UALCAN database. Correlation between CEP55 and TMPO-AS1 using (K) ENCORI and (L) OncoDB databases.
.
Survival analysis of TMPO-AS1 overexpression in LUAD by using KM Plotter in cases of (A) OS (n = 1411), (B) FP (n = 874), (C) PPS (n = 242), (D) OS + LUAD (n = 1161), (E) FP + LUAD (n = 906), (F) PPS + LUAD (n = 376), (G) OS + LUAD + Smoker (n = 546), (H) OS + LUAD + Smoker + Male (n = 319), and (I) OS + LUAD + Smoker + Female (n = 227) (J) TMPO-AS1 expression based on the smoking status by using the UALCAN database. Correlation between CEP55 and TMPO-AS1 using (K) ENCORI and (L) OncoDB databases.
The next thing we found was that those patients with LUAD who had smoked in the past had significantly lower overall survival (OS) rates with LUAD + Smokers (HR = 2.34, CI = 1.41-3.88, P = 0.00066), as shown in Fig. 5G. Furthermore, we found that patients with LUAD who had a history of smoking and were male had significantly lower overall survival rates (Fig. 5H): OS with LUAD + Smoker Male (HR = 2.33, CI = 1.28-4.25, P = 0.0046). In addition, we found that overexpression of TMPO-AS1 in patients with LUAD with a history of smoking and females had significantly poorer overall survival statuses: OS with LUAD + Smoker Female (HR = 3.13, CI = 1.18-8.29, P = 0.016), as shown in Fig. 5I. lncRNA expression with smoking status was validated by using the UALCAN database as shown in Fig. 5J. Finally, we validated the correlation between CEP55 and TMPO-AS1 using the ENCORI and OncoDB databases and we found the correlation values R = 0.587 and 0.4, respectively, as shown in Fig. 5K-L.
As we know, miRNAs and lncRNAs are non-coding RNAs that regulate gene expression, control oncogenic pathways, and limit tumor suppressor expression. They affect cancer development, tumor growth, invasion, and metastasis. They also mediate drug-sensitivity and resistance mechanisms. Pre-clinical and early clinical studies are exploring their potential as new therapeutics. This study summarizes the latest knowledge on using miRNAs and lncRNAs as regulatory molecular mechanisms for CEP55 treatment tools. For this purpose, we utilized the miRNet database, applied the lncRNA parameter, and identified the associated miRNAs. We then selected another parameter, concentric circle, to determine the proximity to the lncRNA. Our findings revealed that hsa-let-7b-5p is a stronger miRNA than other miRNAs, as illustrated in Fig. 6A. We also validated the TMPO-AS1-hsa-let-7b-5p-CEP55 network using the miRNet database and found that the links between TMPO-AS1-hsa-let-7b-5p-CEP55 are very close, as shown in Fig. 6B. Interestingly, Fig. 6C-D reveals a negative correlation between hsa-let-7b-5p, CEP55, and TMPO-AS1 in LUAD patients, as indicated by the correlation values (R = -0.324, R = -0.277, respectively). We also used the ENCORI, UALCAN, and KM plotter databases to look at the expression and survival of hsa-let-7b-5p in LUAD patients. As shown in Fig. 6E–F, hsa-let-7b-5p was significantly downregulated. The downregulation (P = 3.12e-03) of hsa-let-7b-5p in smoker patients is associated with poor survival data (HR = 0.71, CI = 0.53-0.95, P = 0.021), which further strengthens our findings as illustrated in Fig. 6G-H. Our findings revealed that the links between TMPO-AS1, hsa-let-7b-5p, and CEP55 are very close, indicating a strong association between them. This analysis further strengthens our understanding of the regulatory molecular mechanisms involving these components in CEP55 treatment.
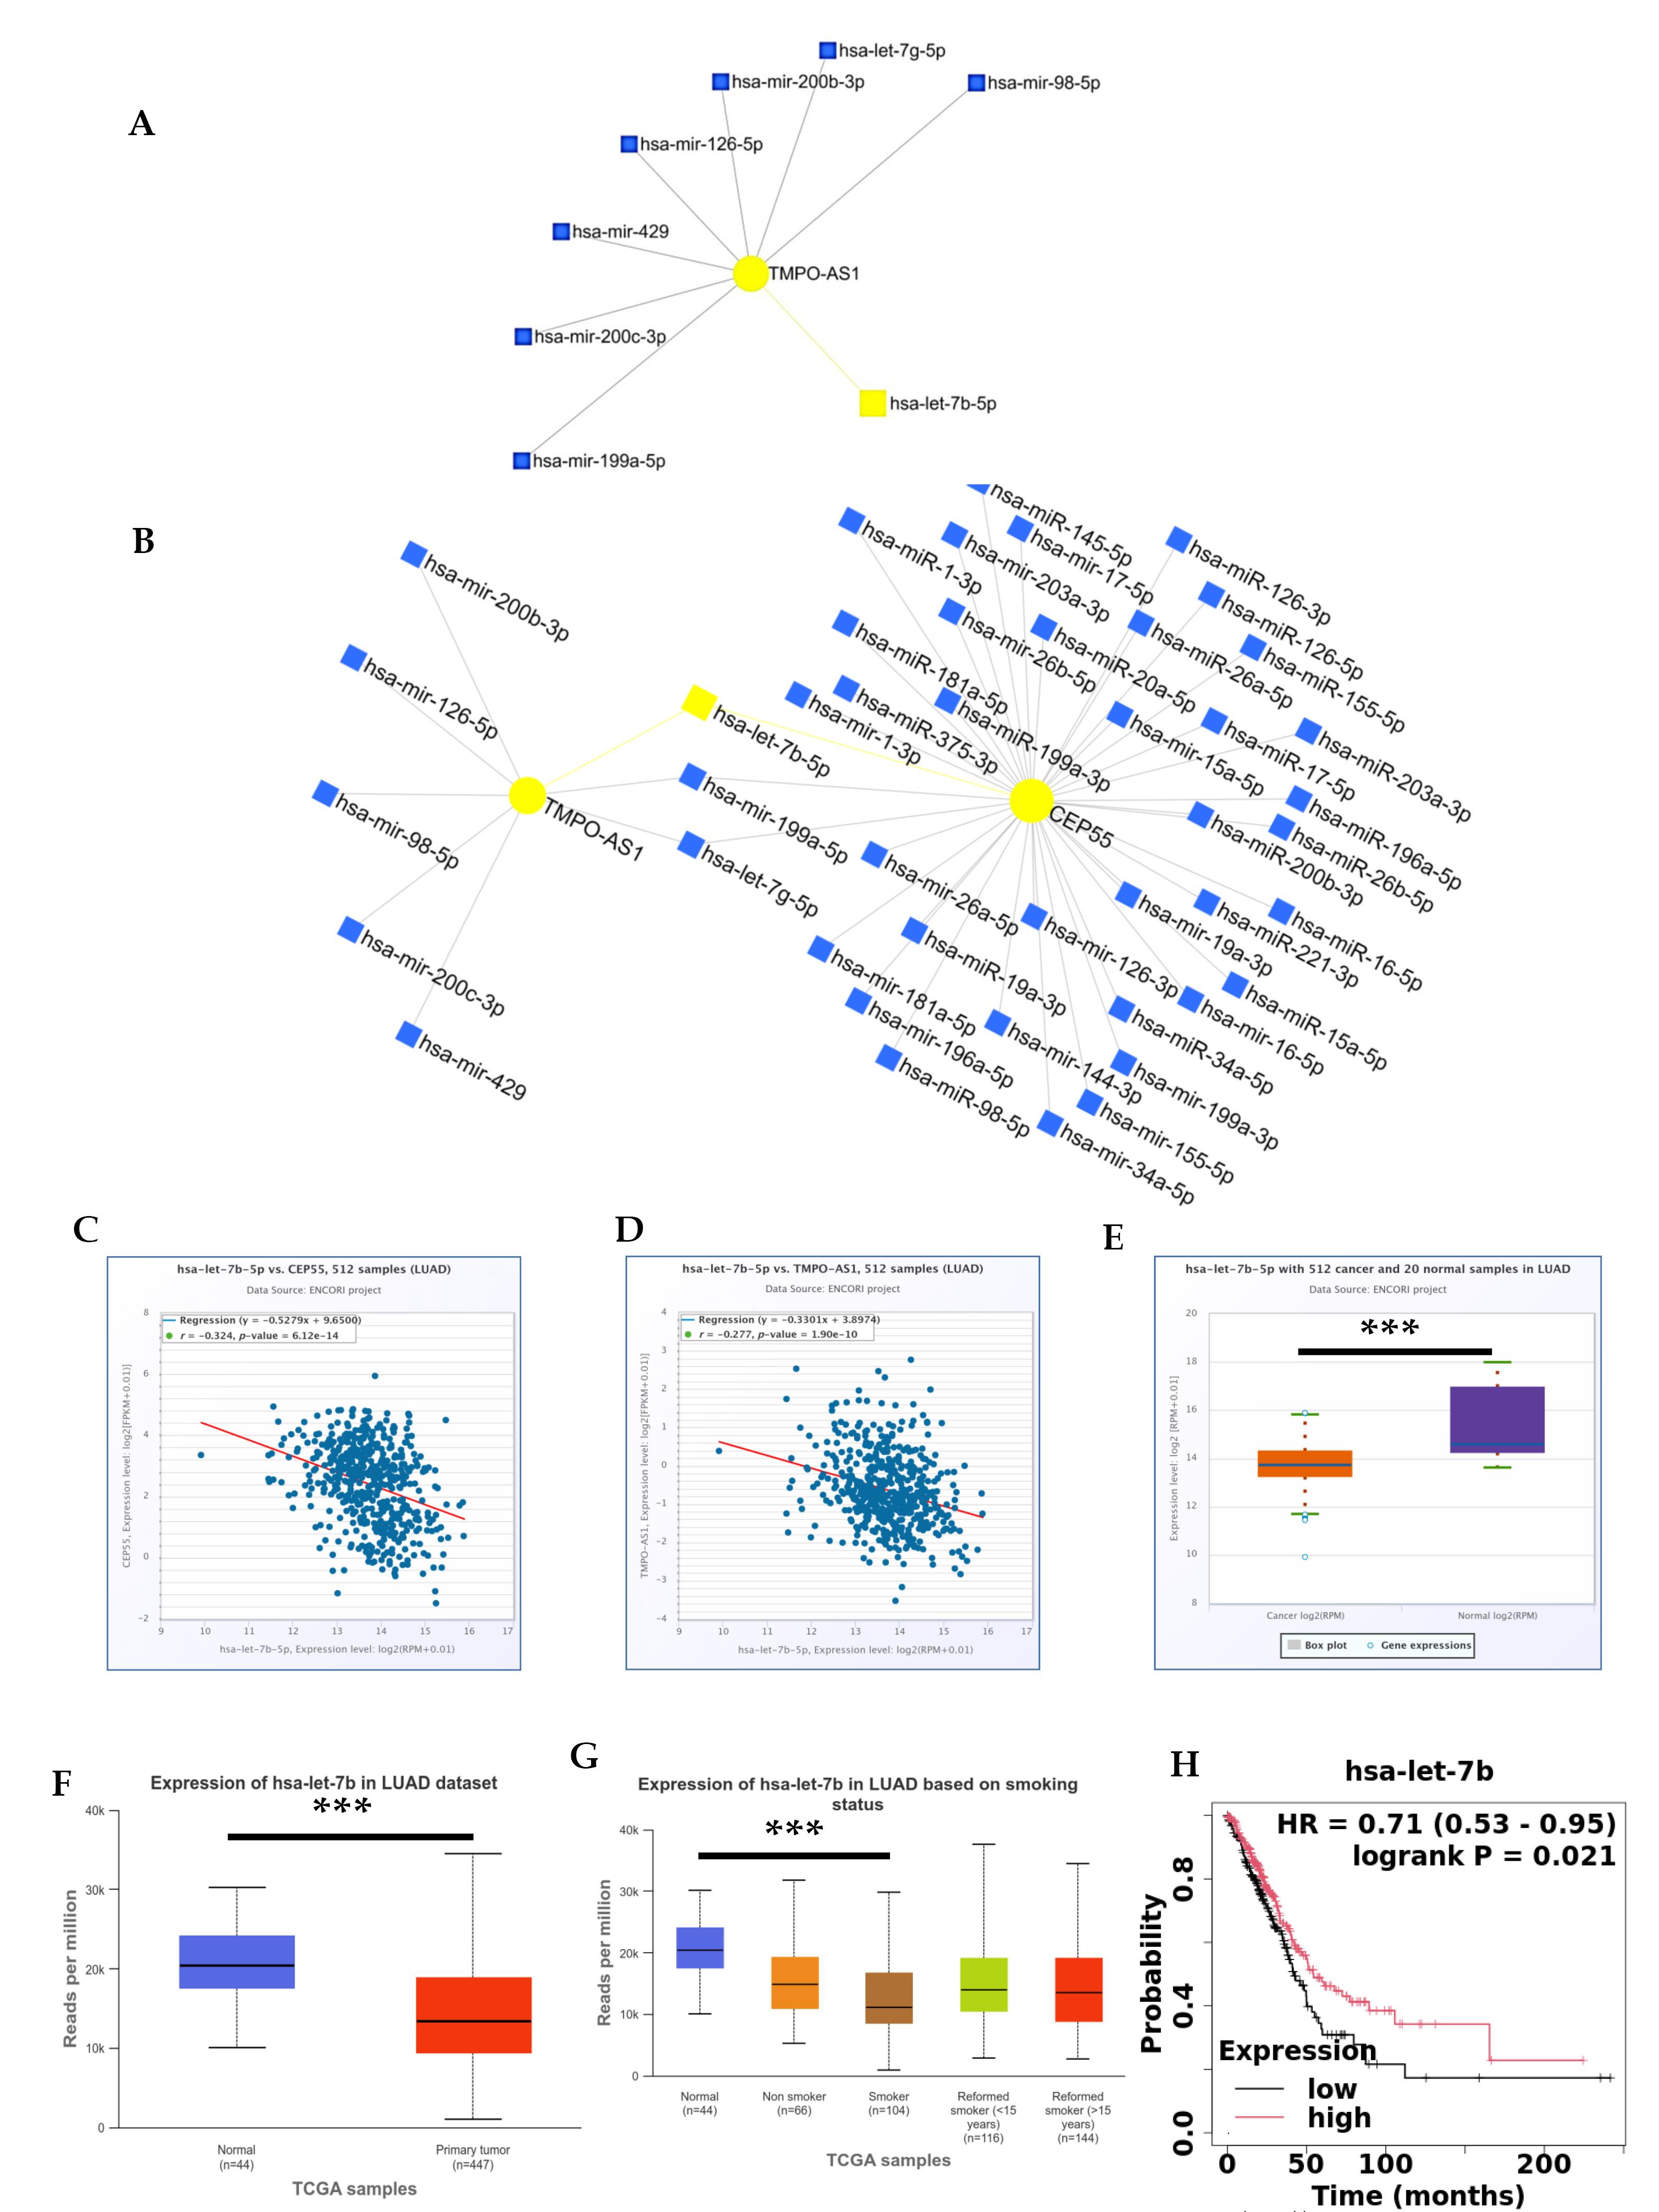
Fig. 6.
Analysis of regulatory mechanisms. Using the miRNet database to create a network between (A) hsa-let-7b-5p/TMPO-AS1 and (B) CEP55/hsa-let-7b-5p/TMPO-AS1. Correlation between (C) hsa-let-7b-5p and CEP55 and (D) hsa-let-7b-5p and TMPO-AS1 using the ENCORI database. Differential expression of hsa-let-7b-5p in lung cancer using (E) ENCORI and (F) UALCAN databases. (G) Expression of hsa-let-7b-5p based on the smoking status by using the UALCAN database, (H) Prognostic significance of hsa-let-7b-5p in LUAD.
.
Analysis of regulatory mechanisms. Using the miRNet database to create a network between (A) hsa-let-7b-5p/TMPO-AS1 and (B) CEP55/hsa-let-7b-5p/TMPO-AS1. Correlation between (C) hsa-let-7b-5p and CEP55 and (D) hsa-let-7b-5p and TMPO-AS1 using the ENCORI database. Differential expression of hsa-let-7b-5p in lung cancer using (E) ENCORI and (F) UALCAN databases. (G) Expression of hsa-let-7b-5p based on the smoking status by using the UALCAN database, (H) Prognostic significance of hsa-let-7b-5p in LUAD.
The mechanistic molecular feedback loop for CEP55/ E2Fs/TMPO-AS1/hsa-let-7b-5p axis
In recent years, there has been growing evidence that molecular feedback loop signals are linked to disease and growth.28 Feedback between molecular and non-coding patterning activities is crucial for complex disease development.28,29 The E2F family of transcription factors (E2F TFs) regulates stemness, tumor progression, metastasis, and anticancer drug resistance.30,31 Despite their involvement in lung cancer development and metastasis, the expression and prognostic value of the E2Fs/CEP55/lncRNA/miRNA axis in lung cancer remain unclear. A study has shown that E2F TFs regulate the expression of CEP55. Therefore, we analyzed the prognostic role of all eight E2F family members using the KM Plotter database and the Jetset probe Affymetrix ID E2F1: 2028_s_at, E2F2: 207042_at, E2F3: 203693_s_at, E2F4: 202248_at, E2F5: 221586_s_at, E2F6: 203957_at, E2F7: 228033_at, and E2F8: 219990_at for three different survival outcomes as shown in Table S4. We observed that only E2F1, E2F4, E2F7, and E2F8 are relevant for lung cancer diagnosed with OS. Furthermore, we examined the survival status of OS/LUAD/smoker/male/female, both individually and in combination, and discovered that only E2F1 significantly correlated with all the parameters, as presented in the Tables S5-S8. Next, we created the network nodes to validate the connection between E2Fs/CEP55/lncRNA/miRNA axis in lung cancer using the miRNet database, and interestingly, we found that E2F1/CEP55/TMPO-AS1/hsa-let-7b-5p are significantly correlated with each other as shown in Fig. S1A. Being important for cell proliferation, we also examined MKI67 in the same network, and surprisingly, it was in close proximity to E2F1/CEP55/TMPO-AS1/hsa-let-7b-5p Axis. Further correlation-based analysis was done by using OncoDB, and we found that CEP55/E2F1/MKI67 were positively correlated in LUAD patients (R = 0.66 and 0.86) as shown in Fig. S1B-S1C. Next, we validated the correlation between CEP55/E2F1/MKI67 by using the TIMER database, and we found that E2F1 and MKI67 were positively correlated with CEP55 in LUAD patients (R = 0.685 and 0.87) as shown in Fig. S1D-S1E. By ENCORI database, we further analyzed E2F1/MKI67 and hsa-let-7b-5p in LUAD patients, and we found negative correlation (r = -0.36 and -032) as shown in Fig. S1F-S1G. We also validated the E2F1/MKI67/TMPO-AS1 axis in LUAD, and we found significant positive correlation (R = 0.58 and 0.63), as shown in Fig. S1H-S1I. The correlation between the E2Fs/CEP55/lncRNA/miRNA axis in lung cancer suggests a complex network of interactions that contribute to disease development and progression. Understanding these relationships could potentially lead to the identification of novel therapeutic targets or biomarkers for lung cancer. Further research is needed to elucidate the precise mechanisms underlying these correlations and their functional significance in lung cancer. We have also used GSCA: Gene Set Cancer Analysis for CEP55/E2F1/TMPO-AS1/MKI67, and we found that all the genes were significantly associated with LUAD stages, as shown in Fig. S1J. Understanding the precise mechanisms underlying these correlations is crucial for gaining insight into the development and progression of lung cancer. By unraveling the intricate network of interactions between E2Fs, CEP55, TMPO-AS1, and hsa-let-7b-5p, researchers can potentially identify novel therapeutic targets and biomarkers that could improve diagnosis, prognosis, and treatment strategies for lung cancer patients. Additionally, this knowledge could contribute to the advancement of precision medicine approaches personalized to individual patients based on the specific molecular characteristics of their tumors.
CEP55-hsa-let-7b-5p interaction using docking procedure
A total of 10 structural models of the hsa-let-7b-5p and CEP55 complex were generated. Table 4 presents the binding energy obtained from the docking process for all 10 structures. Structure 1 with the score of -124.52 kcal/mol is the one with the least binding energy or most favourable interaction score, indicating it was the most likely to represent a stable and biologically relevant interaction. The same structure 1 is presented in Fig. 7, where Fig. 7A shows the density plot of miRNA docked to the specific cite of the protein CEP55 and Fig. 7B shows the hsa-let-7b-5p in molecular form to the binding site. Further investigating the specific interactions between the miRNA and the protein targets using the selected model 1, we employed LigPlot. Fig. 7C presents the schematic diagrams that illustrate hydrogen bonds, hydrophobic interactions, and other key interactions obtained from the LigPlot. It can be inferred from the diagram that the GLU192(A) and ASP188(A) are forming strong electrostatic salt bridge interactions, whereas TYR187(B) and GLN183(B) are interacting with the miRNA with strong hydrogen bonding, providing a stable docked structure. This analysis aids in understanding the nature of the binding interface, providing insights into how the miRNA may influence the function of the CEP55 protein and guiding further experimental validation of these interactions.
Table 4.
Docking structure models and their binding energies
|
RANK
|
1
|
2
|
3
|
4
|
5
|
6
|
7
|
8
|
9
|
10
|
| Docking score |
-124.52 |
-120.60 |
-119.28 |
-116.17 |
-115.23 |
-109.95 |
-106.95 |
-105.98 |
-105.61 |
-105.53 |
| Confidence Score |
0.3753 |
0.3571 |
0.3511 |
0.3370 |
0.3328 |
0.3098 |
0.2965 |
0.2931 |
0.2916 |
0.2912 |
| miRNA rmsd (Å) |
22.58 |
22.37 |
21.98 |
34.05 |
32.92 |
32.03 |
27.97 |
28.27 |
32.46 |
32.92 |
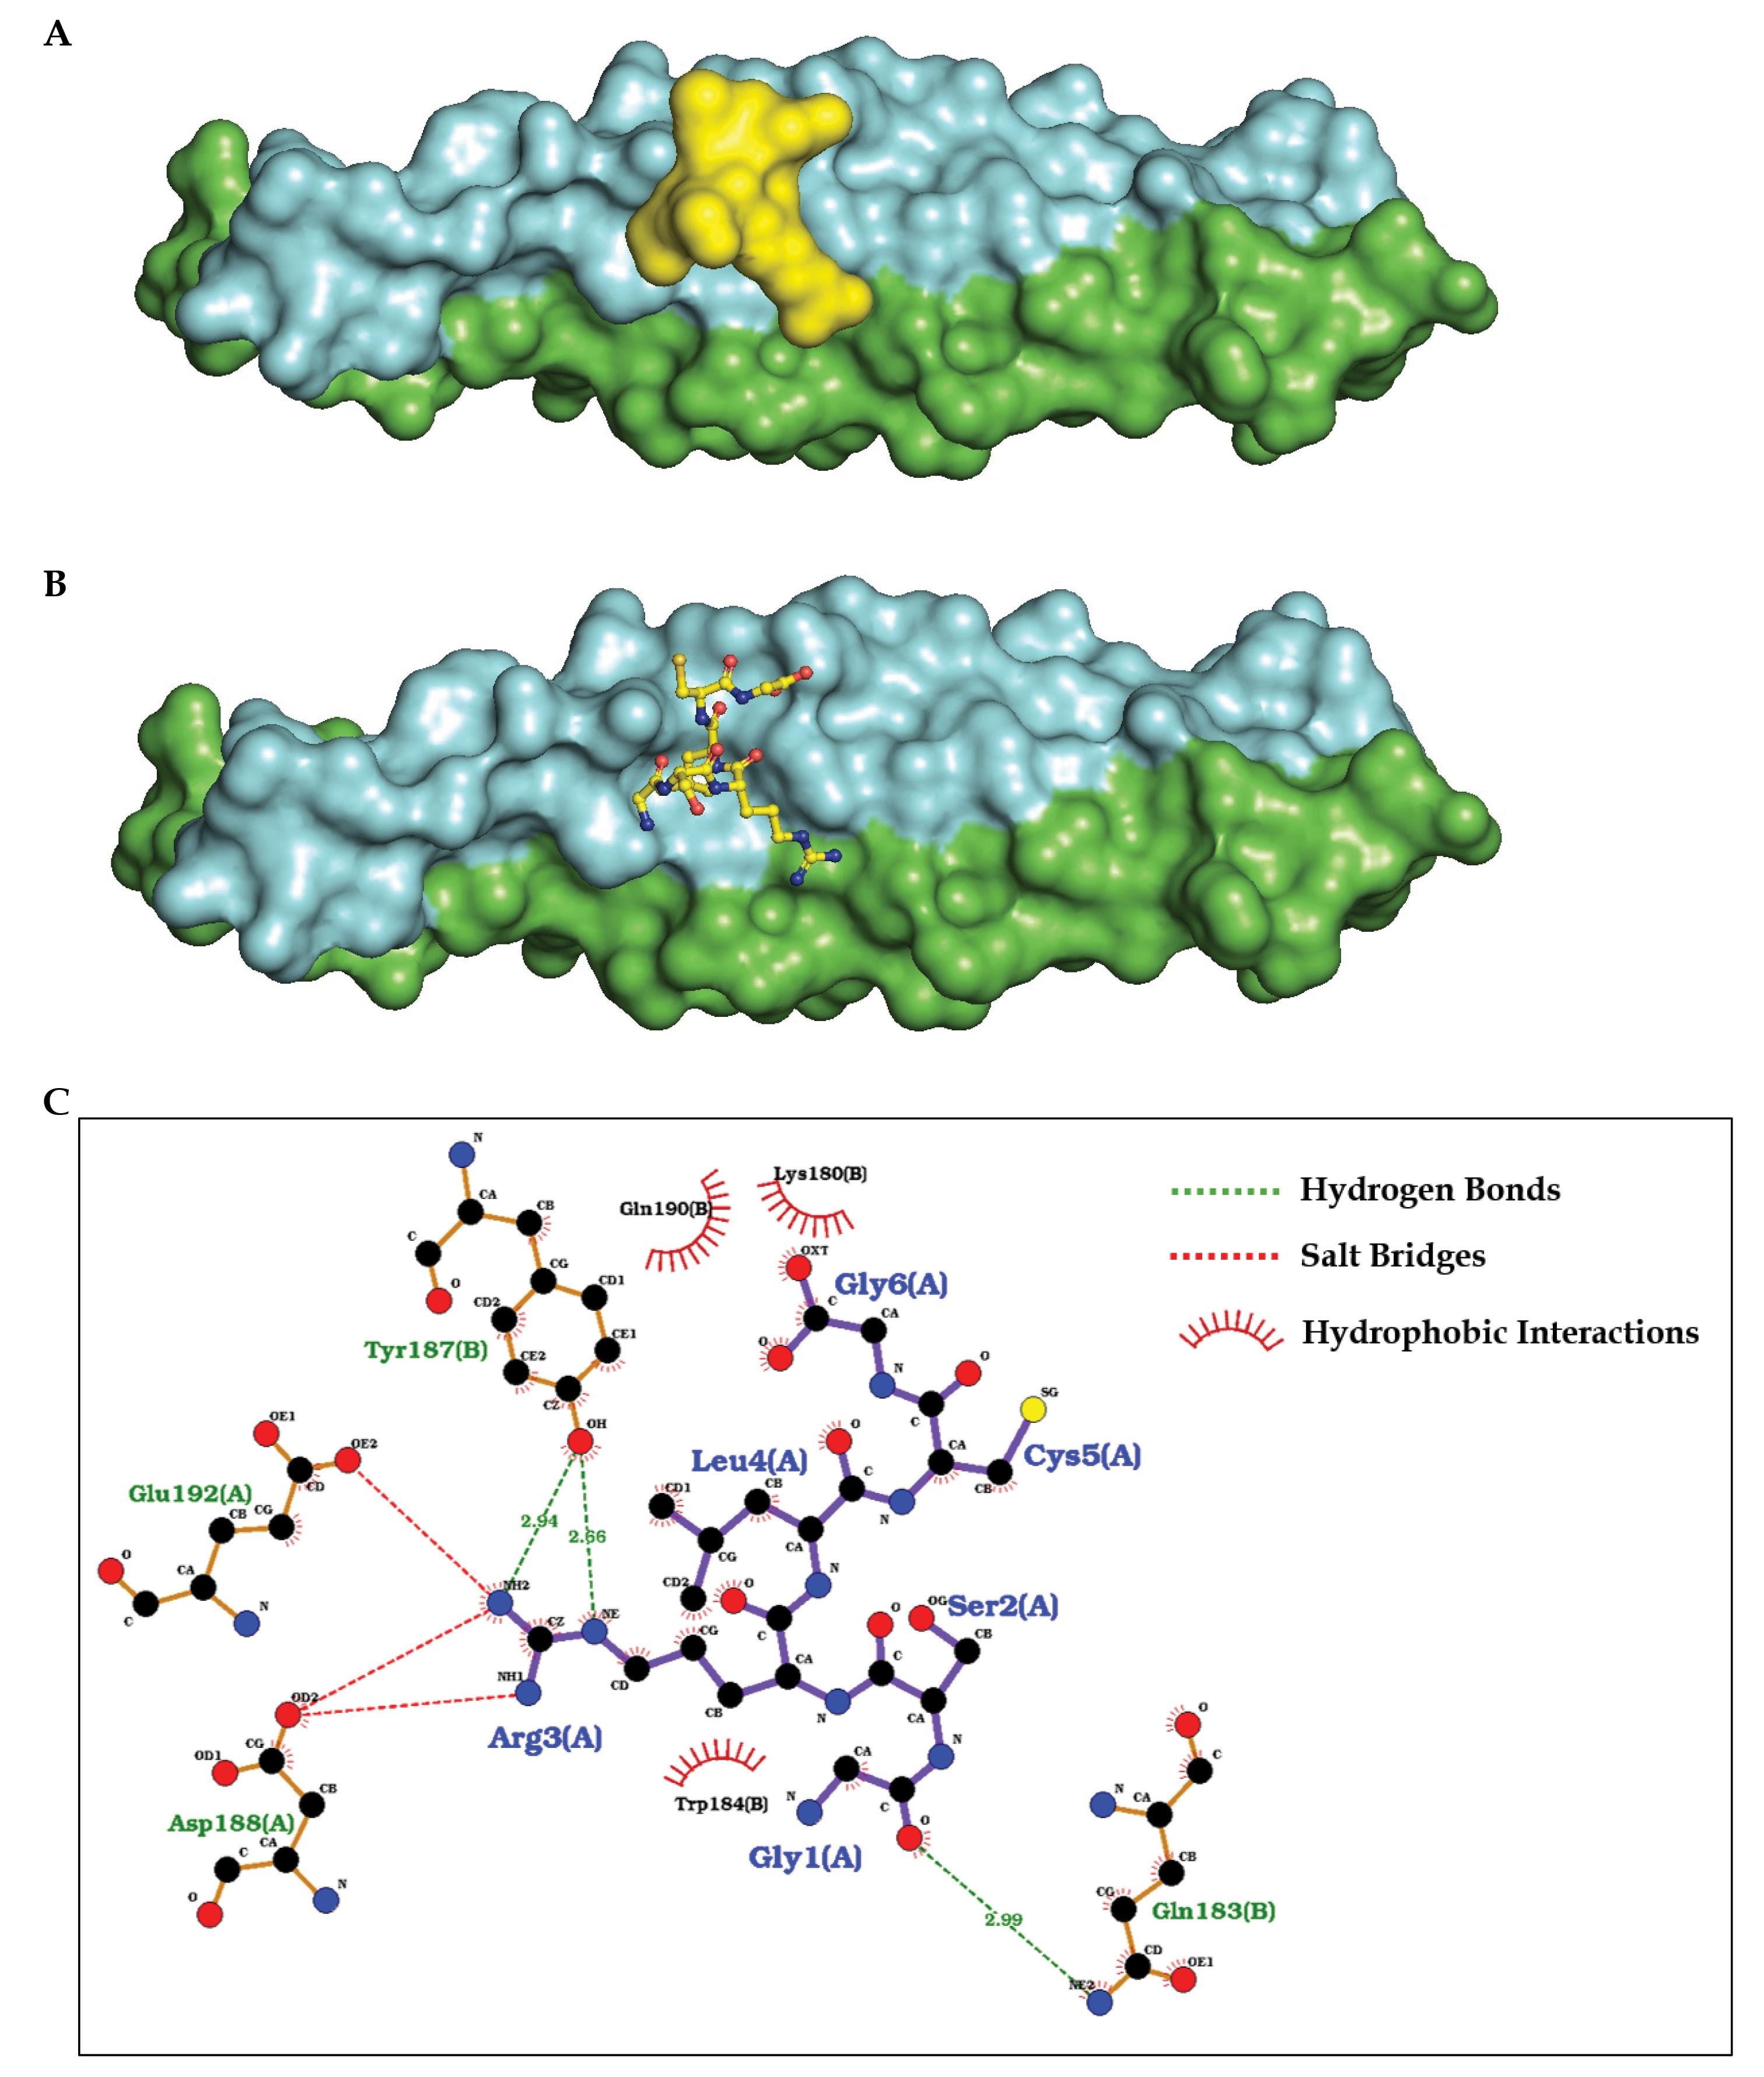
Fig. 7.
(A-B) Surface representation of the CEP55 protein dimer (green and blue), with the hsa-let-7b-5p miRNA highlighted in yellow. (A) The surface view of the overall binding pocket where hsa-let-7b-5p is located. (B) Stick representation of hsa-let-7b-5p within binding pocket. (C) Schematic representation showing the key amino acid residues involved in the binding interface between CEP55 and hsa-let-7b-5p. The highlighted residues (in blue) correspond to hsa-let-7b-5p, while those in green represent the surrounding protein environment of CEP55.
.
(A-B) Surface representation of the CEP55 protein dimer (green and blue), with the hsa-let-7b-5p miRNA highlighted in yellow. (A) The surface view of the overall binding pocket where hsa-let-7b-5p is located. (B) Stick representation of hsa-let-7b-5p within binding pocket. (C) Schematic representation showing the key amino acid residues involved in the binding interface between CEP55 and hsa-let-7b-5p. The highlighted residues (in blue) correspond to hsa-let-7b-5p, while those in green represent the surrounding protein environment of CEP55.
CEP55's role in biological processes, proliferation and tumor infiltration of immune cells
Understanding the involvement of CEP55 in various biological processes during cancer progression is crucial for developing effective treatment strategies. The CellTracer database, based on single-cell RNA sequencing data, provides insights into these processes. Results showed CEP55 overexpression in lung cancer is associated with invasion, proliferation, metastasis, and epithelial-mesenchymal transition, potentially serving as a biomarker, as shown in Fig. S2A. Further, we corroborated our data using the CancerSEA database, and we found that CEP55 overexpression in lung cancer is associated with invasion and proliferation, as shown in Fig. S2B. Further analysis using the GENI database showed CEP55 upregulation in various biological functions, cellular components, and molecular functions such as chromosome segregation, mitotic nuclear division, regulation of chromosome organization, and various other processes related to the G2/M transition phase, as shown in Fig. 8A-C. For metastasis involvement analysis of the CEP55 gene in lung cancer, we used the TNMplot database and found that CEP55 expression is also involved in lung cancer metastasis, as shown in Fig. S2C. The mutation analysis was performed using the Intogen database, which showed 57% of missense mutations, 19% truncating mutations, and 18% synonymous mutations, as shown in Fig. 8D. The implication of such mutations of CEP55 in LUAD could be the reason behind the altered cell cycle regulation, genomic instability, and aneuploidy. These mutations may be related to the overexpression and dysregulation of the CEP55 protein and promote tumor formation. Furthermore, mutations affecting CEP55 can activate oncogenic pathways, such as the PI3K/AKT/mTOR pathway, leading to LUAD progression and poor prognosis.
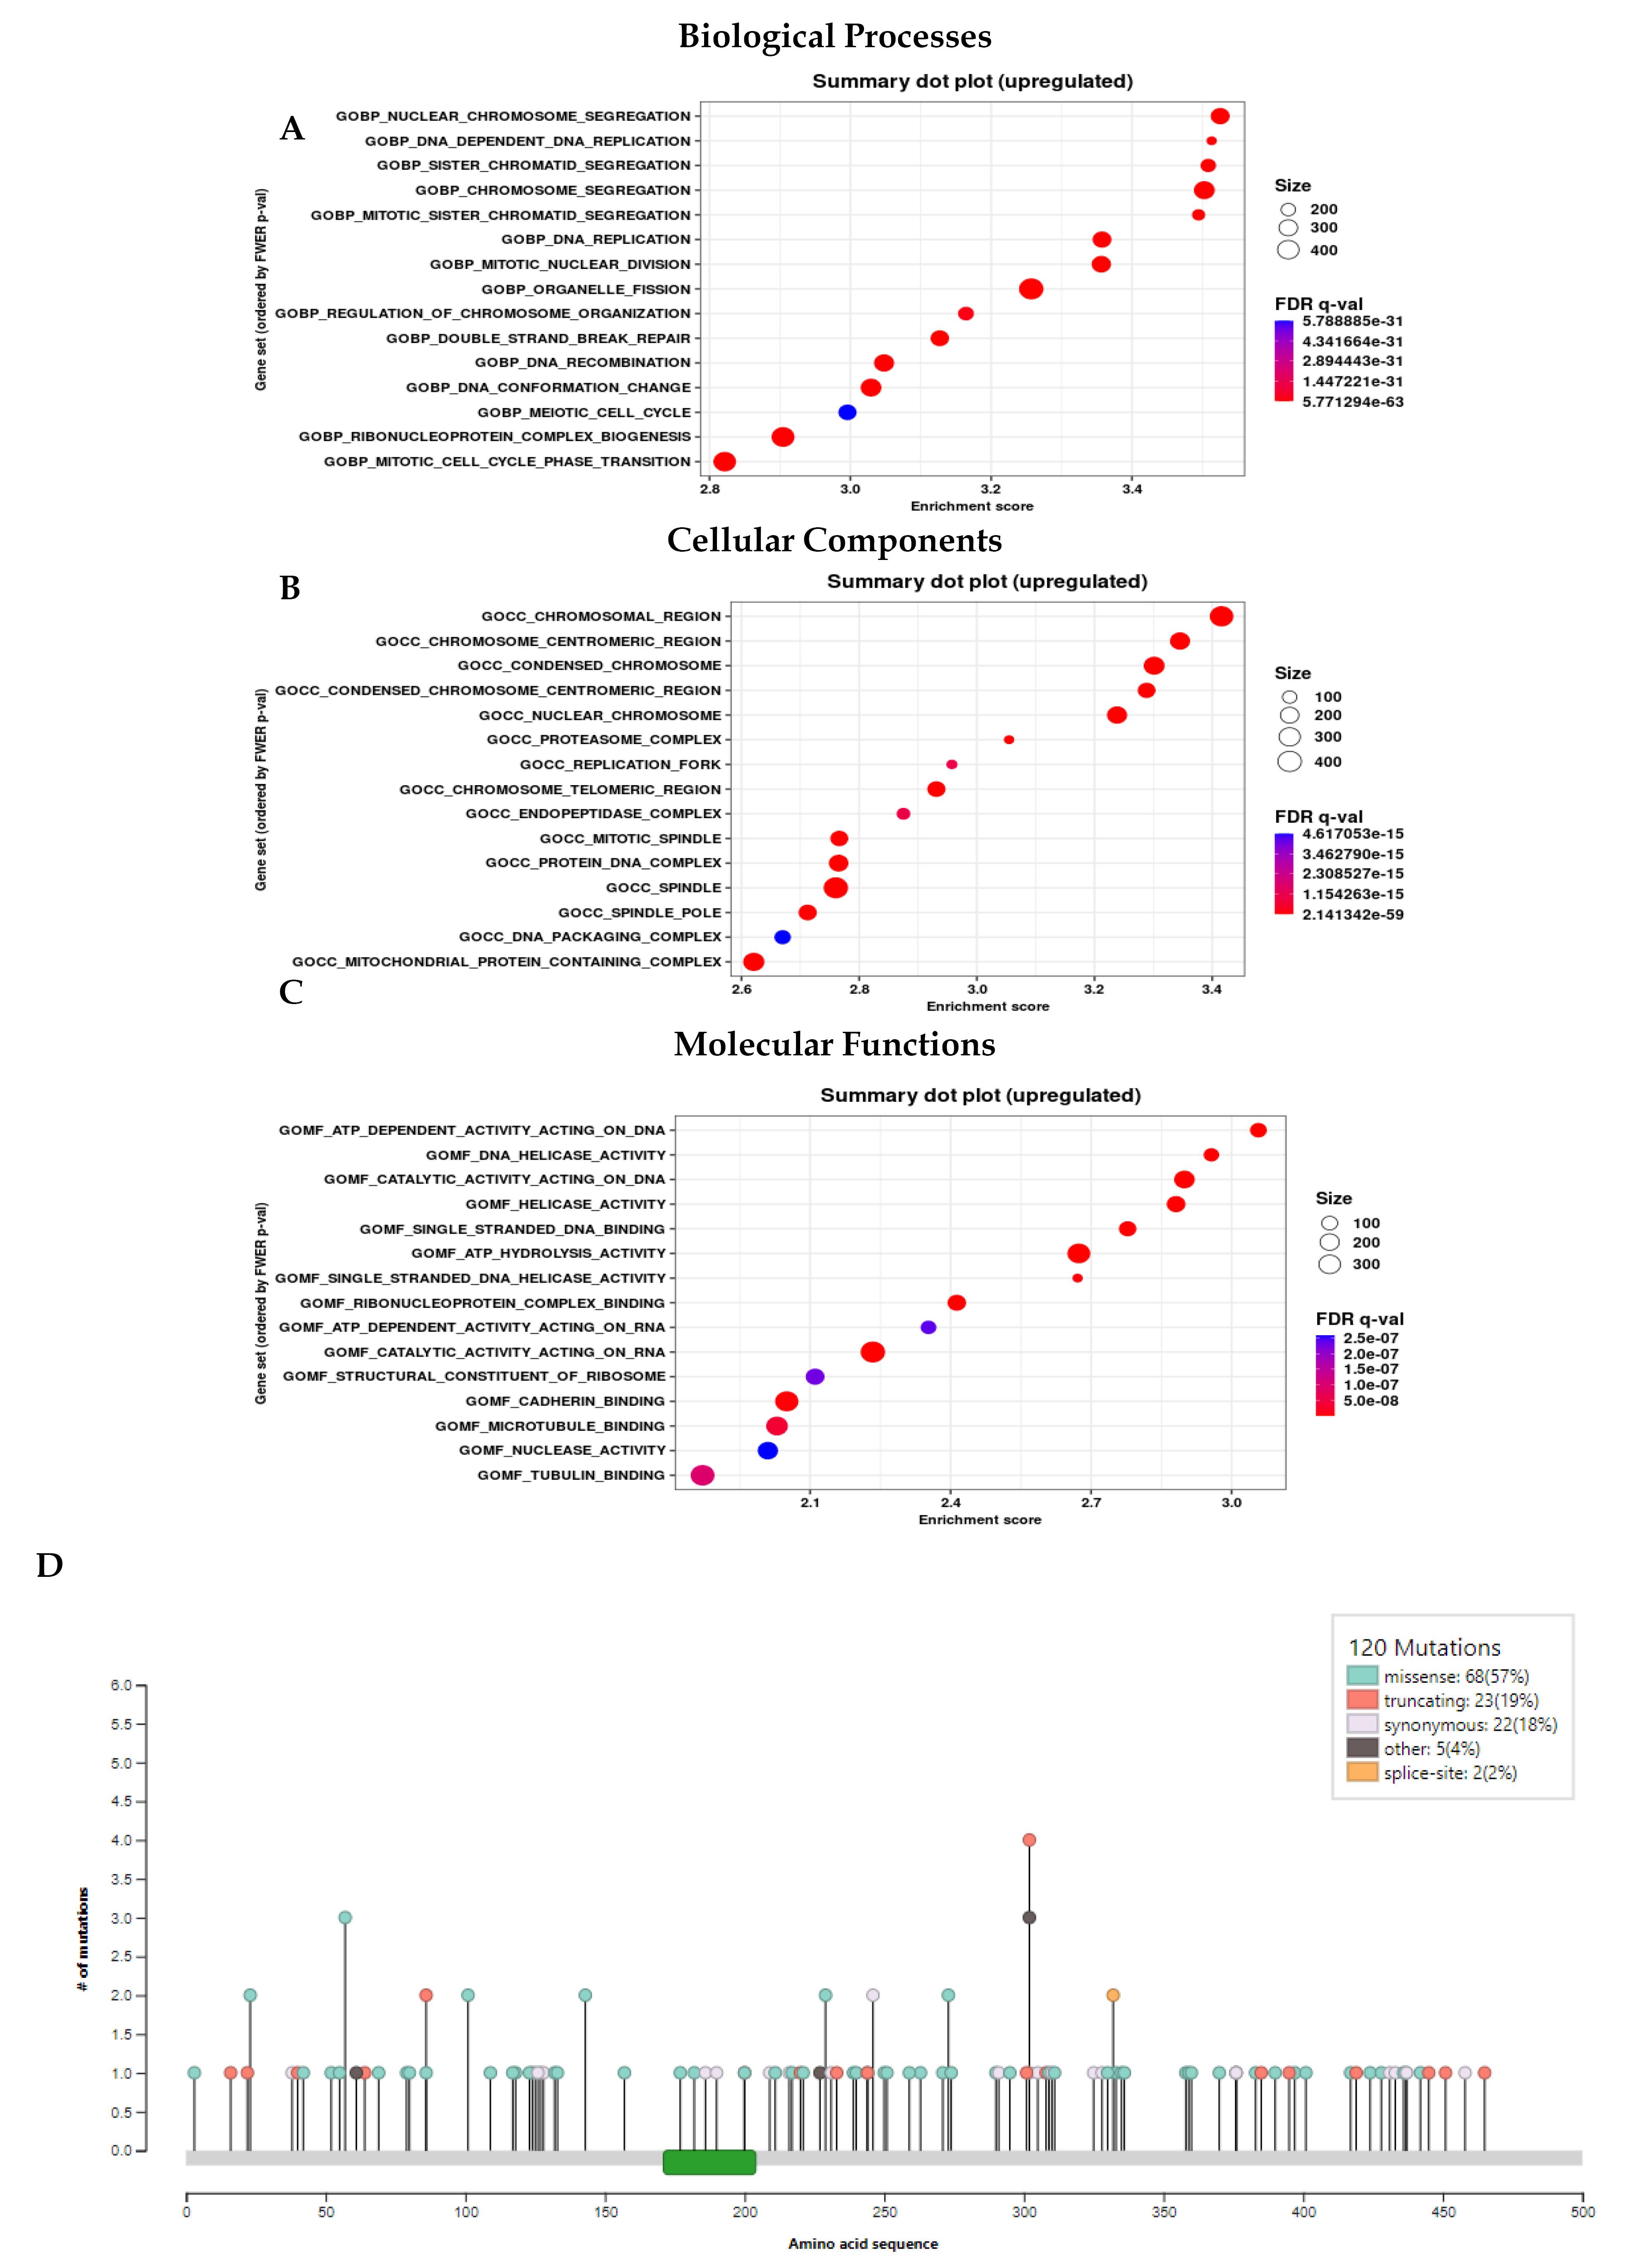
Fig. 8.
(A-C) Gene Enrichment Analysis using GENI database showing CEP55 upregulation in (A) Biological Processes, (B) Cellular Components, and (C) Molecular Functions. (D) Mutation-based analysis using the Intogen database
.
(A-C) Gene Enrichment Analysis using GENI database showing CEP55 upregulation in (A) Biological Processes, (B) Cellular Components, and (C) Molecular Functions. (D) Mutation-based analysis using the Intogen database
Further, the TISIDB database is crucial for determining cancer treatment efficacy and patient prognosis. A study investigated the relationship between CEP55 expression and TIICs using the database. A heatmap was created with various TIICs, including T follicular helper cells, effector memory CD8 cells, regulatory T cells, activated CD4 T cells, NK cells, mast cells, memory B cells, monocytes, neutrophils, eosinophils, and macrophages. However, as shown in Fig. S2D, there was a strong link between the CEP55 gene and the arrival of activated CD4 + cells in LUAD (R = 0.637). Further the study found a strong positive correlation between CEP55 expression and CD4 + cell infiltration in LUAD tumors, as confirmed by analyzing the TIMER 2.0 database with the selection of the CEP55 gene in LUAD panel selection, and we found that CD4 + cells with LUAD (R = 0.76) as shown in Fig. S2E. These findings suggest that targeting CEP55 expression could be a potential therapeutic strategy for lung cancer treatment. By suppressing CEP55 overexpression, it may be possible to inhibit invasion, proliferation, metastasis, and epithelial-mesenchymal transition, ultimately improving patient outcomes. This highlights the importance of further research and development of targeted therapies specifically aimed at CEP55 inhibition.
Discussion
Lung adenocarcinoma is a prevalent malignancy with a high death rate and a low 5-year survival rate.1,32 While early detection may improve a patient's prognosis, the scientific understanding of the onset and progression of LUAD remains inadequate.33 Advancements in genomics have led to the discovery of mRNA, TFs, and non-coding RNAs, such as CEP55/E2F1/TMPO-AS1/hsa-let-7b-5p and its related ceRNA, which regulate gene expression in lung cancer progression. Centrosomal Protein 55 (CEP55), a coiled-coil protein linked to cancer, has been identified as a potential therapeutic target due to its interaction with endosomal sorting components and PI3K catalytic subunit.34 CEP55 is an immunogenic tumor-associated antigen (TAA) and cancer-testis antigen (CTA), making it a potential candidate for cancer vaccine therapies. It can induce an increase in antigen-specific cytotoxic T lymphocytes (CTLs), which could recognize and kill chemotherapy-resistant colon cancer stem cells. CEP55 is expressed in exosomes derived from malignant cells and has the potential to be a non-invasive diagnostic marker for tumors.35 However, a comprehensive picture of CEP55 in the TFs/lncRNA/miRNA/tumor immune microenvironment has not been reported, and small therapeutic compounds targeting CEP55 remain elusive.
CEP55, a gene involved in mitotic exit and cytokinesis, is expressed at low levels in most human tissues except the testis.36 Dysregulation of CEP55 is linked to multiple disease states and aggressive behavior in in-vivo models.37 It is an independent marker of poor clinical outcomes in various malignancies and a strong candidate for vaccine development in breast and colorectal cancers.36,37 In vitro, CEP55 increases anchorage-independent growth, migration, invasion, and promotes tumor formation in nude mice through VEGFA-PI3K/AKT signaling.38 CEP55 is implicated in progression from in situ to invasive breast cancer, and overexpression in primary breast tumors is a marker of chromosomal instability and poor prognosis.39 CEP55 is also elevated in several cancers, including oesophageal cancer, triple negative breast cancer, papillary thyroid carcinoma, lung adenocarcinoma, and lung squamous cell carcinoma.40 This study investigated the molecular mechanism behind CEP55 dysregulation in lung adenocarcinoma and its potential as a prognostic biomarker for lung cancer smoker patients. E2F1 was identified as a potential transcriptional regulator of CEP55, elucidating its contribution to CEP55 dysregulation in LUAD. The study also explored the role of microRNAs and long non-coding RNAs in regulating CEP55 expression through the ceRNA network. A total of 12 miRNAs were associated with CEP55, with hsa-let-7b-5p being the key miRNA negatively correlated with CEP55 expression in LUAD. Downregulation of hsa-let-7b-5p was associated with a poor prognosis. TMPO-AS1, a lncRNA, was positively correlated with CEP55/E2F1 expression and negatively correlated with hsa-let-7b-5p, forming a ceRNA that may regulate CEP55 expression in LUAD. The dysregulation of this ceRNA network was associated with significantly adverse clinical outcomes, emphasizing its significance in lung adenocarcinoma and smokers' prognosis. Based on the biological process analysis, we were able to discover that CEP55 overexpression is associated with aggressive lung adenocarcinoma states, including invasion, proliferation, and metastasis, which provided insight into potential therapeutic strategies for lung cancer that target CEP55. According to the strong positive correlation between CEP55 and MKI67, CEP55 may be associated with an increase in proliferation activity during LUAD following the same regulatory mechanism of E2F1, hsa-let-7b-5p, and TMPO-AS1. Further, understanding the structure of the binding interface and how the miRNA might affect the CEP55 protein’s function was made easier with the use of molecular docking analysis and the results showed a strong binding score of -124.52 kcal/mol.
Conclusion
Smokers and lung adenocarcinoma patients have increased expression of CEP55, which leads to a poor prognosis. E2F1 positively regulates the expression of this gene, which negatively correlates with miRNA hsa-let-7b-5p and positively associates with lncRNA TMPO-AS1. CEP55/E2F1/hsa-let-7b-5p/TMPO-AS1 shows promise as a prognostic biomarker for lung adenocarcinoma and smokers.
Research Highlights
What is the current knowledge?
√ LUAD has been ranked first in the case of both prevalence and mortality.
√ CEP55’s dysregulation has been observed in various cancers.
√ Overexpression of CEP55 is associated with poor prognosis.
What is new here?
√ In LUAD, E2F1 positively regulates CEP55 expression.
√ The ceRNA network shows that miRNA hsa-let-7b-5p and CEP55 are negatively linked, and lncRNA TMPO-AS1 and CEP55 are positively linked.
√ The combination of CEP55/E2F1/hsa-let-7b-5p/TMPO-AS1 holds promise as a prognostic biomarker in lung adenocarcinoma smokers.
Competing Interests
The authors declare that they have no competing interests.
Ethical Approval
This study does not require ethical approval.
Supplementary files
Supplementary file 1 contains Tables S1-S8 and Figs. S1-S2.
(pdf)
Acknowledgements
The authors thank the Department of Biosciences, Manipal University Jaipur for their support.
References
-
Schulz WA. Lung cancer. In: Molecular Biology of Human Cancers. Cham: Springer; 2023. p. 327-36. doi: 10.1007/978-3-031-16286-2_15.
- Passaro A, Al Bakir M, Hamilton EG, Diehn M, André F, Roy-Chowdhuri S. Cancer biomarkers: emerging trends and clinical implications for personalized treatment. Cell 2024; 187:1617-35. doi: 10.1016/j.cell.2024.02.041 [Crossref] [ Google Scholar]
- Restrepo JC, Dueñas D, Corredor Z, Liscano Y. Advances in genomic data and biomarkers: revolutionizing NSCLC diagnosis and treatment. Cancers (Basel) 2023; 15:3474. doi: 10.3390/cancers15133474 [Crossref] [ Google Scholar]
- Zhang X, Xu X, Song J, Xu Y, Qian H, Jin J. Non-coding RNAs' function in cancer development, diagnosis and therapy. Biomed Pharmacother 2023; 167:115527. doi: 10.1016/j.biopha.2023.115527 [Crossref] [ Google Scholar]
- Tandon D, Banerjee M. Centrosomal protein 55: a new paradigm in tumorigenesis. Eur J Cell Biol 2020; 99:151086. doi: 10.1016/j.ejcb.2020.151086 [Crossref] [ Google Scholar]
- Wang G, Chen B, Su Y, Qu N, Zhou D, Zhou W. CEP55 as a promising immune intervention marker to regulate tumor progression: a pan-cancer analysis with experimental verification. Cells 2023; 12:2457. doi: 10.3390/cells12202457 [Crossref] [ Google Scholar]
- Martinez-Garay I, Rustom A, Gerdes HH, Kutsche K. The novel centrosomal associated protein CEP55 is present in the spindle midzone and the midbody. Genomics 2006; 87:243-53. doi: 10.1016/j.ygeno.2005.11.006 [Crossref] [ Google Scholar]
- Mondal G, Rowley M, Guidugli L, Wu J, Pankratz VS, Couch FJ. BRCA2 localization to the midbody by filamin A regulates cep55 signaling and completion of cytokinesis. Dev Cell 2012; 23:137-52. doi: 10.1016/j.devcel.2012.05.008 [Crossref] [ Google Scholar]
- Dingerdissen HM, Bastian F, Vijay-Shanker K, Robinson-Rechavi M, Bell A, Gogate N. OncoMX: a knowledgebase for exploring cancer biomarkers in the context of related cancer and healthy data. JCO Clin Cancer Inform 2020; 4:210-20. doi: 10.1200/cci.19.00117 [Crossref] [ Google Scholar]
- Bartha Á, Győrffy B. TNMplotcom: a web tool for the comparison of gene expression in normal, tumor and metastatic tissues. Int J Mol Sci 2021; 22:2622. doi: 10.3390/ijms22052622 [Crossref] [ Google Scholar]
- Li T, Fu J, Zeng Z, Cohen D, Li J, Chen Q. TIMER20 for analysis of tumor-infiltrating immune cells. Nucleic Acids Res 2020; 48:W509-14. doi: 10.1093/nar/gkaa407 [Crossref] [ Google Scholar]
- Chandrashekar DS, Karthikeyan SK, Korla PK, Patel H, Shovon AR, Athar M. UALCAN: an update to the integrated cancer data analysis platform. Neoplasia 2022; 25:18-27. doi: 10.1016/j.neo.2022.01.001 [Crossref] [ Google Scholar]
- Tang Z, Kang B, Li C, Chen T, Zhang Z. GEPIA2: an enhanced web server for large-scale expression profiling and interactive analysis. Nucleic Acids Res 2019; 47:W556-60. doi: 10.1093/nar/gkz430 [Crossref] [ Google Scholar]
- Li JH, Liu S, Zhou H, Qu LH, Yang JH. starBase v20: decoding miRNA-ceRNA, miRNA-ncRNA and protein-RNA interaction networks from large-scale CLIP-Seq data. Nucleic Acids Res 2014; 42:D92-7. doi: 10.1093/nar/gkt1248 [Crossref] [ Google Scholar]
- Yuan H, Yan M, Zhang G, Liu W, Deng C, Liao G. CancerSEA: a cancer single-cell state atlas. Nucleic Acids Res 2019; 47:D900-8. doi: 10.1093/nar/gky939 [Crossref] [ Google Scholar]
- Győrffy B. Discovery and ranking of the most robust prognostic biomarkers in serous ovarian cancer. Geroscience 2023; 45:1889-98. doi: 10.1007/s11357-023-00742-4 [Crossref] [ Google Scholar]
- Xie Z, Bailey A, Kuleshov MV, Clarke DJ, Evangelista JE, Jenkins SL. Gene set knowledge discovery with Enrichr. CurrProtoc 2021; 1:e90. doi: 10.1002/cpz1.90 [Crossref] [ Google Scholar]
-
Chang L, Xia J. MicroRNA regulatory network analysis using miRNet 2.0. In: Song Q, Tao Z, eds. Transcription Factor Regulatory Networks. New York: Springer; 2023. p. 185-204. doi: 10.1007/978-1-0716-2815-7_14.
- Tang G, Cho M, Wang X. OncoDB: an interactive online database for analysis of gene expression and viral infection in cancer. Nucleic Acids Res 2022; 50:D1334-9. doi: 10.1093/nar/gkab970 [Crossref] [ Google Scholar]
- Waterhouse A, Bertoni M, Bienert S, Studer G, Tauriello G, Gumienny R. SWISS-MODEL: homology modelling of protein structures and complexes. Nucleic Acids Res 2018; 46:W296-303. doi: 10.1093/nar/gky427 [Crossref] [ Google Scholar]
- Yan Y, Tao H, He J, Huang SY. The HDOCK server for integrated protein-protein docking. Nat Protoc 2020; 15:1829-52. doi: 10.1038/s41596-020-0312-x [Crossref] [ Google Scholar]
- Laskowski RA, Swindells MB. LigPlot + : multiple ligand-protein interaction diagrams for drug discovery. J Chem Inf Model 2011; 51:2778-86. doi: 10.1021/ci200227u [Crossref] [ Google Scholar]
- Liu CJ, Hu FF, Xie GY, Miao YR, Li XW, Zeng Y. GSCA: an integrated platform for gene set cancer analysis at genomic, pharmacogenomic and immunogenomic levels. Brief Bioinform 2023; 24:bbac558. doi: 10.1093/bib/bbac558 [Crossref] [ Google Scholar]
- Guo Q, Wang P, Liu Q, Hao Y, Gao Y, Qi Y. CellTracer: a comprehensive database to dissect the causative multilevel interplay contributing to cell development trajectories. Nucleic Acids Res 2023; 51:D861-9. doi: 10.1093/nar/gkac892 [Crossref] [ Google Scholar]
- Hayashi A, Ruppo S, Heilbrun EE, Mazzoni C, Adar S, Yassour M. GENI: A web server to identify gene set enrichments in tumor samples. Comput Struct Biotechnol J 2023; 21:5531-7. doi: 10.1016/j.csbj.2023.10.053 [Crossref] [ Google Scholar]
- Martínez-Jiménez F, Muiños F, Sentís I, Deu-Pons J, Reyes-Salazar I, Arnedo-Pac C. A compendium of mutational cancer driver genes. Nat Rev Cancer 2020; 20:555-72. doi: 10.1038/s41568-020-0290-x [Crossref] [ Google Scholar]
- Ru B, Wong CN, Tong Y, Zhong JY, Zhong SS, Wu WC. TISIDB: an integrated repository portal for tumor-immune system interactions. Bioinformatics 2019; 35:4200-2. doi: 10.1093/bioinformatics/btz210 [Crossref] [ Google Scholar]
- Hannezo E, Heisenberg CP. Mechanochemical feedback loops in development and disease. Cell 2019; 178:12-25. doi: 10.1016/j.cell.2019.05.052 [Crossref] [ Google Scholar]
- Ward LD, Kellis M. Interpreting noncoding genetic variation in complex traits and human disease. Nat Biotechnol 2012; 30:1095-106. doi: 10.1038/nbt.2422 [Crossref] [ Google Scholar]
- Iglesias-Ara A, Westendorp B. Editorial: the role of E2F transcription factors in cancer. Front Oncol 2023; 13:1355610. doi: 10.3389/fonc.2023.1355610 [Crossref] [ Google Scholar]
- Kassab A, Gupta I, Moustafa AA. Role of E2F transcription factor in oral cancer: recent insight and advancements. Semin Cancer Biol 2023; 92:28-41. doi: 10.1016/j.semcancer.2023.03.004 [Crossref] [ Google Scholar]
- Myers DJ, Wallen JM. Lung Adenocarcinoma. In: StatPearls [Internet]. Treasure Island, FL: StatPearls Publishing; 2024. Available from: http://www.ncbi.nlm.nih.gov/books/NBK519578/. Accessed June 25, 2024.
- Ning J, Ge T, Jiang M, Jia K, Wang L, Li W. Early diagnosis of lung cancer: which is the optimal choice?. Aging (Albany NY) 2021; 13:6214-27. doi: 10.18632/aging.202504 [Crossref] [ Google Scholar]
- Xie X, Liang H, Jiangting W, Wang Y, Ma X, Tan Z. Cancer-testis antigen CEP55 serves as a prognostic biomarker and is correlated with immune infiltration and immunotherapy efficacy in pan-cancer. Front Mol Biosci 2023; 10:1198557. doi: 10.3389/fmolb.2023.1198557 [Crossref] [ Google Scholar]
- Inoda S, Hirohashi Y, Torigoe T, Morita R, Takahashi A, Asanuma H. Cytotoxic T lymphocytes efficiently recognize human colon cancer stem-like cells. Am J Pathol 2011; 178:1805-13. doi: 10.1016/j.ajpath.2011.01.004 [Crossref] [ Google Scholar]
- Kalimutho M, Sinha D, Jeffery J, Nones K, Srihari S, Fernando WC. CEP55 is a determinant of cell fate during perturbed mitosis in breast cancer. EMBO Mol Med 2018; 10:e8566. doi: 10.15252/emmm.201708566 [Crossref] [ Google Scholar]
- Yan SM, Liu L, Gu WY, Huang LY, Yang Y, Huang YH. CEP55 positively affects tumorigenesis of esophageal squamous cell carcinoma and is correlated with poor prognosis. J Oncol 2021; 2021:8890715. doi: 10.1155/2021/8890715 [Crossref] [ Google Scholar]
- Sinha D, Nag P, Nanayakkara D, Duijf PH, Burgess A, Raninga P. Cep55 overexpression promotes genomic instability and tumorigenesis in mice. Commun Biol 2020; 3:593. doi: 10.1038/s42003-020-01304-6 [Crossref] [ Google Scholar]
- Kalimutho M, Simmons J, Fernando W, Saunus J, Spring K, Lakhani S. Abstract LB-116: CEP55, a master regulator of cytokinesis in breast cancer pathogenesis. Cancer Res 2014; 74:LB-116. doi: 10.1158/1538-7445.am2014-lb-116 [Crossref] [ Google Scholar]
- Li GS, Zhang W, Huang WY, He RQ, Huang ZG, Gan XY. CEP55: an immune-related predictive and prognostic molecular biomarker for multiple cancers. BMC Pulm Med 2023; 23:166. doi: 10.1186/s12890-023-02452-1 [Crossref] [ Google Scholar]