Bioimpacts. 2025;15:30589.
doi: 10.34172/bi.30589
Original Article
Photoplethysmography based non-invasive blood glucose estimation using systolic-diastolic framing MFCC features and machine learning regression
Ali Kermani Conceptualization, Methodology, Project administration, Supervision, Validation, Writing – original draft, Writing – review & editing, 1, * 
Hossein Esmaeili Formal analysis, Methodology, Validation, Writing – original draft, 2
Author information:
1Electrical & Computer Engineering Department, University of Science & Technology of Mazandaran, Behshahr, Iran
2Electrical Department, Shahrood University of Technology, Shahrood, Iran
Abstract
Introduction:
Accurate and non-invasive blood glucose estimation is essential for effective health monitoring. Traditional methods are invasive and inconvenient, often leading to poor patient compliance. This study introduces a novel approach that leverages systolic-diastolic framing Mel-frequency cepstral coefficients (SDFMFCC) to enhance the accuracy and reliability of blood glucose estimation using photoplethysmography (PPG) signals.
Methods:
The proposed method employs SDFMFCC for feature extraction, incorporating systolic and diastolic frames. The systolic and diastolic points are identified using the Savitzky-Golay filter, followed by local extrema detection. Blood glucose levels are estimated using support vector regression (SVR). The evaluation is performed on a dataset comprising 67 raw PPG signal samples, along with labeled demographic and biometric data collected from 23 volunteers (aged 20 to 60 years) under informed consent and ethical guidelines.
Results:
The SDFMFCC-based approach demonstrates high accuracy (99.8%) and precision (0.996), with a competitive root mean square error (RMSE) of 26.01 mg/dL. The Clarke Error Grid analysis indicates that 99.273% of predictions fall within Zone A, suggesting clinically insignificant differences between estimated and actual glucose levels.
Conclusion:
The study validates the hypothesis that incorporating a new framing method in MFCC feature extraction significantly enhances the accuracy and reliability of non-invasive blood glucose estimation. The results highlight that the SDFMFCC method effectively captures critical physiological variations in PPG signals, offering a promising alternative to traditional invasive methods.
Keywords: Non-invasive glucose estimation, Machine learning regression, PPG, MFCC, Systolic-diastolic
Copyright and License Information
© 2025 The Author(s).
This work is published by BioImpacts as an open access article distributed under the terms of the Creative Commons Attribution Non-Commercial License (
http://creativecommons.org/licenses/by-nc/4.0/). Non-commercial uses of the work are permitted, provided the original work is properly cited.
Funding Statement
None to be declared.
Introduction
Diabetes mellitus, a chronic metabolic disorder characterized by persistent hyperglycemia, poses a significant global health challenge. The prevalence of diabetes has been rising at an alarming rate, with an estimated 415 million individuals affected worldwide in 2016—a figure projected to reach 642 million by 2040.1,2 Effective diabetes management requires regular blood glucose monitoring to prevent severe complications, including cardiovascular diseases, neuropathy, and retinopathy.1,3,4
Blood glucose monitoring has traditionally relied on invasive techniques, primarily finger-pricking and continuous glucose monitoring (CGM) systems.5 While finger-pricking methods provide accurate measurements, they are painful and inconvenient, often leading to poor patient compliance, particularly among individuals requiring frequent monitoring.6 CGM systems, which utilize subcutaneous sensors, enable continuous glucose monitoring but are associated with sensor drift, calibration requirements, high costs, and potential skin irritation. These limitations underscore the need for a genuinely non-invasive, cost-effective, and reliable glucose monitoring solution.1,7,8
The development of non-invasive glucose monitoring technologies has led to significant advancements, leveraging various physiological markers correlated with blood glucose levels.1,9,10 Among these, optical sensing technologies, particularly photoplethysmography (PPG), have demonstrated substantial potential.11-14 PPG measures blood volume fluctuations in the microvascular bed of tissue by analyzing light absorption characteristics, thereby indirectly estimating glucose concentration.15-17 Already widely implemented in pulse oximeters for heart rate and oxygen saturation monitoring, PPG is now being explored for its applicability in continuous glucose monitoring devices. The primary advantage of PPG-based systems lies in their ability to provide painless and continuous monitoring, significantly improving patient adherence and diabetes management.1,18,19
PPG has emerged as a prominent technique for non-invasive glucose monitoring due to its ability to measure blood volume fluctuations through light absorption analysis. This technology, widely utilized in pulse oximetry, is being adapted for glucose level estimation by analyzing light reflections from blood vessels in the skin. The non-invasive nature of PPG makes it particularly suitable for continuous monitoring, enabling real-time glucose assessment without requiring blood samples.20,21 Despite its potential, the accuracy and reliability of PPG-based glucose monitoring remain subject to scrutiny, as factors such as skin pigmentation, ambient light interference, and motion artifacts can impact measurement precision. Existing PPG-based glucose monitoring techniques predominantly rely on statistical models or shallow feature extraction methods, which may fail to adequately capture the complex, nonlinear physiological variations associated with glucose fluctuations. These limitations underscore the need for advanced signal processing and enhanced feature extraction techniques that improve robustness and accuracy while maintaining computational efficiency. Therefore, further research and development are essential to refine PPG-based glucose monitoring technology and ensure its clinical reliability.13
Researchers are increasingly integrating multiple physiological signals to enhance the accuracy and reliability of PPG-based glucose monitoring. Glucose level predictions become more robust and comprehensive by combining PPG with electrocardiography (ECG) and galvanic skin response (GSR). This multi-sensor approach leverages the complementary strengths of different modalities, enabling a more holistic analysis of the physiological changes associated with blood glucose fluctuations.22-24 Furthermore, advanced machine learning models are utilized to process large-scale datasets, identify underlying patterns, and predict glucose levels based on multiple physiological inputs. These models are specifically designed to account for individual variability and adapt over time, thereby improving robustness and reliability compared to traditional analytical methods.12,16,25,26
Despite significant advancements in non-invasive glucose monitoring, several critical challenges persist. Ensuring the accuracy and reliability of these devices across diverse populations remains a significant obstacle. Factors such as skin type, age, and underlying health conditions can influence the performance of non-invasive sensors, necessitating extensive testing and validation to confirm their effectiveness across various clinical scenarios.14,17,19 Additionally, integrating multiple sensors and implementing complex algorithms require sophisticated hardware and software solutions, which contribute to increased costs and system complexity.21 Moreover, deep learning-based models demand large-scale training datasets and high computational resources, posing challenges for real-time application.22 Beyond technical limitations, developing non-invasive glucose monitoring technologies also encounters regulatory challenges. Regulatory bodies such as the U.S. Food and Drug Administration (FDA) impose rigorous testing and validation requirements to ensure the safety and efficacy of medical devices. This regulatory approval process can be time-consuming and costly, potentially delaying the clinical availability of emerging non-invasive glucose monitoring technologies.14,25,27
This study introduces a novel approach to blood glucose estimation that leverages systolic-diastolic framing with Mel-frequency cepstral coefficients (SDFMFCC) feature extraction, combined with regression learning. Unlike traditional PPG-based methods, which rely on broad signal processing, our approach segments the PPG signal into systolic and diastolic phases before extracting frequency-domain features using MFCC. This structured segmentation contrasts with conventional models that apply global signal processing or statistical feature extraction without distinguishing critical vascular phases. By isolating these phases, our method enhances the detection of glucose-induced vascular changes with greater precision while minimizing computational noise.
To address the limitations of existing methods, our study introduces the following advancements:
-
Phase-specific feature extraction: Unlike conventional PPG-based techniques, which rely on global signal processing, our method incorporates systolic-diastolic segmentation to enhance the detection of vascular changes influenced by glucose levels while effectively minimizing noise.
-
Computational efficiency: Whereas deep learning models typically depend on raw PPG signals and require extensive training on high-dimensional features, our approach employs a structured, phase-aware feature extraction process, improving interpretability while significantly reducing computational complexity.
-
Eliminating multimodal sensor dependency: Unlike multimodal approaches that integrate ECG, infrared spectroscopy, or GSR to improve accuracy, our method achieves competitive glucose estimation using only PPG signals, thereby reducing hardware costs and system complexity.
We hypothesize that the SDFMFCC framework enhances accuracy, efficiency, and practicality while reducing computational complexity, making non-invasive glucose monitoring more accessible and reliable.
Literature review
Non-invasive blood glucose monitoring techniques have attracted considerable research interest due to their potential to eliminate the discomfort and inconvenience associated with traditional invasive methods. Among these, PPG signals have emerged as a promising modality, as they can indirectly capture physiological variations related to glucose concentration.
Li et al proposed a sophisticated multimodal approach that integrates spatiotemporal ECG and PPG features using a combination of deep neural networks (DNNs) for feature extraction and ensemble learning techniques such as Random Forest, Gradient Boosting, and Bagging, fused through the Choquet Integral.22 This method achieved an average root mean square error (RMSE) of 1.56 mmol/L using ECG and 1.82 mmol/L using PPG, with mean absolute relative difference (MARD) values of 13.88% and 17.06%, respectively. The study demonstrated the robustness of multimodal systems in improving prediction accuracy; however, it also emphasized the increased complexity associated with handling multiple signal sources and the computational overhead of ensemble models.
In contrast, Mosaddequr and Rahman employed a more straightforward approach by utilizing reflection-mode PPG combined with basic regression models.28 Their device achieved a standard error of prediction (SEP) of 0.785 mmol/L, demonstrating the feasibility of real-time, on-device blood glucose estimation.28 While the simplicity and practicality of this method are advantageous, its lower accuracy compared to more complex models highlights potential limitations in precise glucose monitoring applications.
Chen et al introduced a multi-view cross-fusion transformer (MvCFT) network, which extracts kinetic features from PPG signals to enhance blood glucose estimation.29 This approach achieved a low RMSE of 1.129 mmol/L and an MAE of 0.659 mmol/L, with 87.89% of measurements falling within Zone A of the Clarke Error Grid, indicating high clinical accuracy. The application of transformers for multi-view feature fusion highlights the potential of advanced machine learning models in capturing complex physiological relationships within PPG data. However, this method requires substantial computational resources, which may limit its feasibility for real-time or resource-constrained applications.
Yang et al developed a deep hybrid feature neural network (DCC-Net) based on infrared pulse sensing (IPS) to extract PPG signals for blood glucose estimation.8 Their system achieved a weighted average accuracy, recall, sensitivity, and F1-score of approximately 0.92, demonstrating high classification performance. This study highlights the effectiveness of hybrid neural networks in integrating multiple feature types to enhance prediction accuracy. However, it also underscores the challenge of training such models on diverse datasets to ensure generalizability across different populations.
Lee et al investigated a dual-channel PPG system integrated with pulse-arrival velocity (PAV) and ECG signals to enhance blood glucose estimation.22 Their approach achieved an RMSE of 7.46 ± 2.43 mg/dL and a 100% success rate within Zone A of the Clarke Error Grid, demonstrating the potential of dual-channel PPG systems to improve accuracy by incorporating additional physiological parameters. However, the complexity and cost associated with multi-channel systems may pose a significant barrier to widespread adoption.
Nakazawa et al employed visible and near-infrared spectroscopy (VNIRS) to estimate blood glucose levels by analyzing the phase delay between oxy- and deoxyhemoglobin.30 Their method achieved a MARD of 17.5% and an RMSE of 24.1 mg/dL, with 69.2% of measurements falling within Zone A of the Clarke Error Grid. While this spectroscopic approach introduces a novel methodology, it faces challenges related to equipment complexity and potential variability in signal quality.
Chowdhury et al introduced MMG-Net, a multimodal approach incorporating multi-stream and cross-modality attention mechanisms.31 Their system, validated on the PhysioNet dataset, achieved an MAE of 13.51 mg/dL, MAPE of 12.57%, and RMSE of 17.26 mg/dL. Applying attention mechanisms in neural networks demonstrates their potential to capture intricate dependencies within the data. However, this approach also underscores the need for extensive computational resources and robust training datasets to ensure generalizability.
Satter et al employed intrinsic mode functions (IMFs) derived from empirical mode decomposition (EMD) as feature inputs for machine learning algorithms, including CatBoost, XGBoost, and LightGBM.16 Their method achieved a Pearson correlation coefficient of 0.96 and an MSE of 0.08, demonstrating high predictive accuracy. This approach highlights the effectiveness of advanced feature extraction techniques; however, its dependence on specific algorithms may limit flexibility across diverse datasets.
Vargová et al conducted a comparative analysis of random forest and SVM algorithms using MFCC, PCA, and ICA as feature extraction methods.32 Their results demonstrated accuracy rates of approximately 76% and an MAE of 1.25 mmol/L on wristband datasets. The use of well-established algorithms highlights the potential for robust yet straightforward solutions. However, the moderate accuracy suggests a need for further refinement in feature engineering to enhance predictive performance.
Mondal et al evaluated the InCheck device, a PPG-based home glucose monitor, which achieved 67.25% of coordinates within Zones A and B of the Clarke Error Grid.33 This study underscores the practical application of non-invasive devices in real-world settings. However, the lower accuracy suggests the need for improvements in device calibration and signal processing techniques to enhance measurement reliability.
Padmavilochanan et al introduced GlucoNet, a personalized diabetes monitoring platform that integrates the internet of medical things (IoMT) and AI for non-invasive glucose estimation.34 Their system achieved a MAPE of 17.8%, with 100% of predictions falling within Zones A and B of the Clarke Error Grid. Integrating IoMT and AI highlights the potential for comprehensive and personalized monitoring solutions. However, implementation complexity and data security concerns must be addressed to ensure practical feasibility and widespread adoption.
The reviewed studies demonstrate significant advancements and diverse methodologies in non-invasive blood glucose monitoring. Researchers have explored sophisticated multimodal systems integrating PPG, ECG, and advanced machine learning techniques, as well as simpler reflection-mode PPG devices and novel spectroscopic approaches. These studies highlight the trade-offs between accuracy, complexity, and practical application, providing valuable insights for future research.
Our approach aims to bridge these trade-offs by employing a novel framing MFCC feature extraction method explicitly developed for PPG signals. This method leverages physiological changes in PPG signals influenced by blood glucose levels. Unlike the complex multimodal systems that, while accurate, face challenges regarding computational burden and signal handling, our method simplifies the process without significantly compromising precision. Additionally, it advances beyond basic regression models by utilizing more sophisticated yet computationally efficient feature extraction techniques.
Materials and Methods
Feature extraction
Mel-frequency cepstral coefficients (MFCC) is a widely used set of features representing a signal's short-term power spectrum through a series of transformations. Calculating these features begins with pre-emphasis, which amplifies high-frequency components, followed by windowing the signal into overlapping frames.35 Each frame undergoes a fast fourier transform (FFT) to convert the time-domain signal into the frequency domain. The resulting power spectrum passes through mel-scale filter banks, which simulate human auditory perception. To further refine the extracted features, the logarithm of the mel spectrum compresses the dynamic range, followed by a discrete cosine transform (DCT) to reduce dimensionality, ultimately producing a set of coefficients that capture the essential spectral properties of the signal. This compact representation emphasizes perceptually relevant information, making MFCCs a powerful tool for signal processing applications.35
In blood glucose level estimation, MFCCs are particularly advantageous as they capture subtle variations in the PPG signal, which reflect physiological changes associated with glucose levels.36 By emphasizing the most relevant spectral features, MFCCs enhance the accuracy and reliability of non-invasive glucose monitoring systems, providing a robust approach for continuous health monitoring.37
Framing methods play a crucial role in the MFCC feature extraction process, ensuring that temporal information within the PPG signal is accurately preserved. A method without framing processes the entire signal as a single unit, simplifying computation but potentially reducing temporal resolution.35 In contrast, the traditional framing method segments the signal into fixed-length overlapping frames, capturing more temporal details at the expense of higher computational complexity.35 The following sections describe each of these methods, outlining their implementation and specific advantages. Subsequently, a new framing method that integrates the benefits of existing approaches will be introduced.
MFCC without and with framing feature extraction
MFCCs represent the short-term power spectrum of a signal.38 In feature extraction without framing, the entire signal is processed as a single unit, simplifying computation but potentially reducing temporal resolution.39 Conversely, in feature extraction with framing, the signal is divided into overlapping frames, allowing MFCCs to capture temporal variations, enhancing the feature representation's accuracy.40
SDFMFCC feature extraction method
The proposed method follows a similar approach to MFCC with framing, with a crucial modification: incorporating systolic-diastolic frames. This adaptation involves computing MFCC features within these frames, termed SDFMFCC. The motivation behind this approach lies in the physiological significance of the systolic and diastolic points in the PPG signal. The notches near these points represent rapid blood volume and flow changes, capturing critical cardiovascular dynamics. By extending the window and overlap around these key points, the method preserves more detailed signal variations, leading to a richer and more informative feature set that enhances blood glucose level prediction. Additionally, this overlapping approach reduces computational load by decreasing the number of consecutive frames required for processing.
In the SDFMFCC method, systolic (local maximum) and diastolic (local minimum) points of the PPG signal are identified, and windows are defined from systolic to diastolic points and diastolic to systolic points. To ensure overlapping consecutive windows, the window length is extended by 20 milliseconds on either side of these points. MFCC coefficients are then extracted within these extended windows.
A simpler yet effective method is employed to accurately detect systolic and diastolic points, using the Savitzky-Golay filter for signal smoothing, followed by local extrema detection.41 This method balances simplicity and robustness, making it suitable for real-time physiological signal processing. The process begins by applying the Savitzky-Golay filter to the PPG signal (P[i]), which smooths the waveform while preserving shape and amplitude characteristics. The smoothed signal is then used for precise identification of systolic and diastolic points:
where (ck) are the filter coefficients and (m + 1) is the window length.
The filter coefficients (ck) are computed by fitting a polynomial of a specified degree to the signal points within a sliding window. A cubic polynomial (degree 3) is selected for PPG signals as it offers greater flexibility and provides a more accurate fit to the waveform. This choice ensures the preservation of subtle variations around notch points while effectively smoothing the signal's essential physiological characteristics.
For a cubic polynomial fit (d = 3), the coefficients are calculated by solving the linear least squares problem. The design matrix (A) is constructed based on the position of the data points within the window relative to the central point:
where m represents the position of the data point relative to the central point, m2 and m3 are the higher-order terms of the polynomial. The signal values vector b is:
The polynomial coefficients(c) are then determined by solving the linear system:
The filter coefficients (ck) are derived from these polynomial coefficients and applied to the original signal to obtain the smoothed signal
.
To detect systolic points (local maxima), we use the first derivative of the smoothed signal. A local maximum occurs where the first derivative changes from positive to negative, and the second derivative is negative.
Similarly, to detect diastolic points (local minima), we look for points where the first derivative changes from negative to positive, and the second derivative is positive at that point:
where (
), (
) are the first derivative and the second derivative at point (i). (ts) and (td) are the sets of indices representing the systolic and diastolic points, respectively.
Once the systolic and diastolic points are identified, the window is extended by 20 milliseconds on either side of these points. This extension ensures the windows overlap, allowing a more comprehensive capture of the signal's dynamic changes. Mathematically, if (ts) and (td) are the time indices of the systolic and diastolic points, respectively, the extended window for each segment is defined as:
Fig. 1 demonstrates a sample PPG signal with the identified systolic and diastolic points, along with the positions of the proposed frame windows.
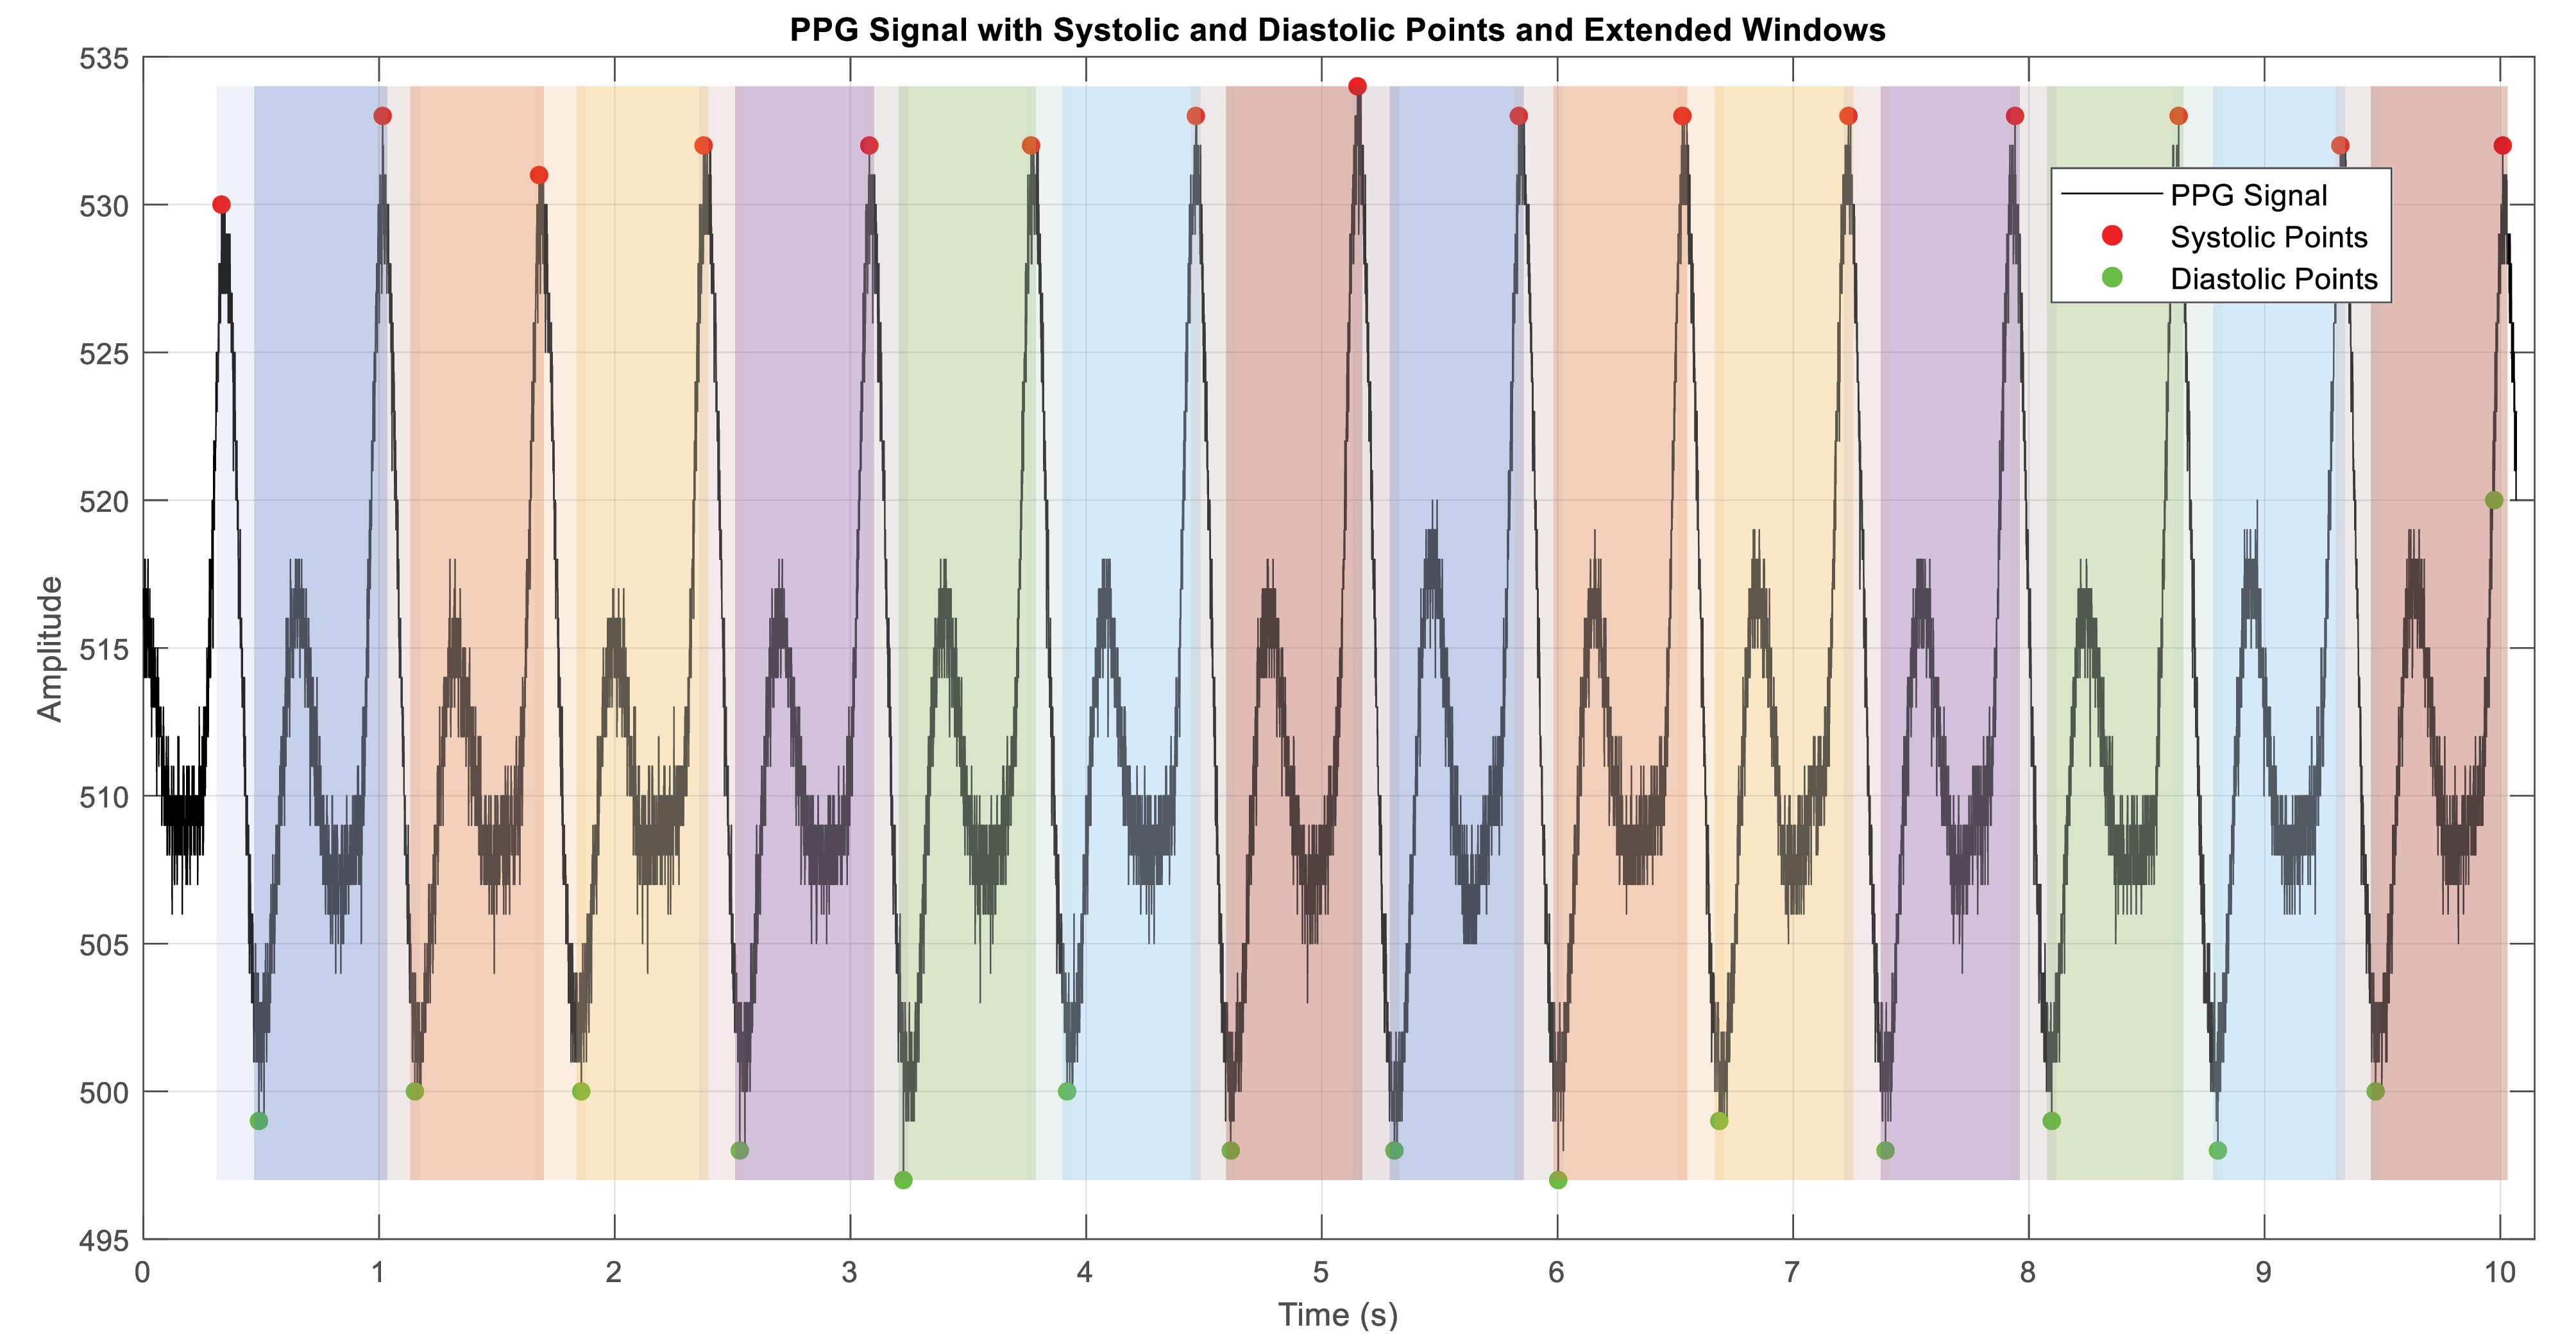
Fig. 1.
A sample PPG signal with the identified systolic and diastolic points, along with the positions of the proposed frame windows (colored windows).
.
A sample PPG signal with the identified systolic and diastolic points, along with the positions of the proposed frame windows (colored windows).
Within these extended windows, MFCC coefficients are computed. By focusing on systolic and diastolic regions, this approach captures significant physiological variations, which are predominantly concentrated around these points due to the notches in the PPG signal. The extended windows undergo processing through the standard MFCC extraction steps, including pre-emphasis, windowing with a Hamming window, Fourier transform, Mel filter bank application, logarithm of the Mel spectrum, and discrete cosine transform (DCT).
The signal is pre-emphasized to amplify high frequencies:
Where
is the pre-emphasized signal, x[n] is the input signal, and (a) is the pre-emphasis coefficient.
The signal is divided into overlapping windows around systolic and diastolic points:
Each frame is multiplied by a Hamming window to reduce spectral leakage:
where w[n] is the Hamming window, and (N) is the number of samples in each frame. The multiplication of the frames by the Hamming window is given by:
The Fourier transform of each windowed frame is computed to obtain the frequency spectrum:
The power spectrum of each frame is computed:
The power spectrum is passed through a series of Mel filters to simulate the human ear's frequency response:
where Hm(k) represents the m-th Mel filter.
The logarithm of the Mel spectrum is computed:
The DCT is applied to obtain the MFCCs:
where Csd(n) and Cds(n) are the MFCCs for the systole-diastole and diastole-systole windows, respectively.
The number of Mel filter bank channels, typically set to 20, balances the frequency resolution and computational complexity, ensuring the capture of essential frequency components relevant to the PPG signal. The number of cepstral coefficients, typically set to 12, provides enough detail to capture the spectral envelope of the signal while avoiding the inclusion of too much noise. The cepstral sine lifter parameter, typically set to 22, smooths the cepstral coefficients, enhancing the robustness of the features by reducing the variance of higher-order coefficients. The lower and upper frequency limits, typically set to 1 Hz and 4.5 Hz, respectively, focus on the frequency range of interest for PPG signals, helping to filter out irrelevant frequencies and noise. The pre-emphasis coefficient, typically set to 0.97, applies a filter that emphasizes higher frequencies in the signal, which are typically less prominent.
Regression model
In this study, several machine learning regression techniques were employed to estimate blood glucose levels from photoplethysmogram (PPG) signals, including SVM regression, Regression Tree, Random Forest, AdaBoost, and Gradient Boosting. SVM regression, known for its effectiveness in handling nonlinear relationships and high-dimensional spaces, utilizes kernel functions to perform linear regression in transformed feature spaces.42 Regression Tree algorithms split data based on feature values, creating a tree-like model, though they can suffer from high variance and overfitting.43 Random Forest, an ensemble method, constructs multiple decision trees and averages their predictions to improve generalization and reduce overfitting.44 AdaBoost combines multiple weak learners, iteratively adjusting the weights of misclassified instances to focus on complex cases, enhancing overall model performance.45 Gradient boosting builds trees sequentially, optimizing for a loss function at each iteration, correcting errors from previous models, and handling complex data relationships.46 Based on the results detailed in the subsequent sections, the SVM regression method was selected as the best-performing technique for the proposed blood glucose estimation. The following subsection explains each method, its hyperparameters, and the specific values used in this study.
Support vector machine regression (SVR)
Support vector regression (SVR), an extension of SVMs, is designed for regression tasks. Unlike traditional regression models that minimize squared error, SVR maximizes the margin while allowing slight deviations, making it highly effective for capturing nonlinear relationships.42 By applying kernel functions, it transforms input data into a higher-dimensional space, making it well-suited for modeling physiological signals like PPG, where subtle variations are crucial.
The regularization parameter (C) balances model complexity and accuracy, with higher values improving precision but increasing the risk of overfitting. The epsilon (ε) parameter defines a tolerance margin, where smaller values improve sensitivity but may lead to overfitting. The kernel function, including the radial basis function (RBF), polynomial, and linear kernels, determines how data is transformed. In RBF kernels, the gamma (γ) parameter controls sensitivity to individual data points, with higher values making the model more responsive to slight variations.
For this study, C was set to 1.0, epsilon to 0.1, gamma to 'scale', and the RBF kernel was chosen to ensure an optimal balance between flexibility and accuracy in non-invasive glucose estimation.
Regression tree
A Regression Tree is a decision-tree-based method that splits data into smaller groups based on feature values, creating a hierarchical structure. At each node, the best feature is selected to minimize prediction error, and the process continues until the final predictions are made at the leaf nodes. While simple and easy to interpret, regression trees tend to overfit, so they are often combined into ensemble models for better generalization.43
Key hyperparameters control the tree’s complexity and performance. The splitting criterion, typically mean squared error (MSE), determines how nodes are divided. Maximum depth limits how deep the tree can grow to prevent overfitting. Minimum samples per split ensure each new node is created only when enough data points are available, while minimum samples per leaf set the lowest number of observations allowed in a leaf node to reduce variance.
In this study, MSE was used as the splitting criterion, maximum depth was set to 10, minimum samples per split to 2, and minimum samples per leaf to 5, balancing model complexity and interpretability.
Random forest regression
Random Forest is an ensemble learning method that improves accuracy and reduces overfitting by combining multiple decision trees. Each tree is trained on a different subset of the data using bootstrap sampling, and their predictions are averaged for a more stable and reliable model, making it practical for complex regression tasks.44
Key hyperparameters include the number of trees, which controls how many trees contribute to the prediction. The maximum feature parameter determines how many features are randomly selected at each split, promoting tree diversity. The minimum samples per split and minimum samples per leaf prevent overly complex branches and reduce variance.
For this study, 100 trees were used, the maximum features were set to 'auto', minimum samples per split to 2, and minimum samples per leaf to 5, ensuring strong generalization and stability.
AdaBoost regression
AdaBoost, short for Adaptive Boosting, is a machine learning algorithm that strengthens weak models by training them in sequence. Each step gives more weight to previously misclassified samples, forcing the model to focus on more challenging cases. Unlike bagging, which builds models independently, AdaBoost updates weights after each iteration, combining multiple weak learners into a single, more accurate predictor. While effective at reducing bias, it can be sensitive to noisy data.45
Key hyperparameters influence the model’s performance. The number of estimators determines how many weak learners are combined, while the learning rate controls the contribution of each learner to the final prediction. The base estimator is the individual weak model used in boosting, often a shallow decision tree, which helps maintain simplicity while improving accuracy.
For this study, 50 estimators were used, the learning rate was set to 1.0, and the base estimator was a Decision Tree with a maximum depth of 3, ensuring a balance between efficiency and predictive performance.
Gradient boosting regression
Gradient Boosting is a powerful machine learning technique that improves predictions by correcting errors from previous models step-by-step. Unlike AdaBoost, which adjusts sample weights, Gradient Boosting minimizes a loss function using gradient descent, making it highly effective for capturing complex, nonlinear patterns in data.46
Several hyperparameters influence its performance. The number of estimators controls how many boosting iterations are performed, with more iterations refining predictions but increasing computation time. The learning rate determines how much each model contributes to the final prediction, where lower values improve stability and prevent overfitting. The maximum depth of each tree defines its complexity, with deeper trees capturing more patterns but increasing the risk of overfitting. The subsample parameter sets the fraction of training data used for each tree, adding randomness to improve generalization.
For this study, 100 estimators were used, the learning rate was set to 0.1, the maximum depth was set to 4, and the subsample rate was set to 0.8, ensuring strong predictive accuracy while maintaining stability.
Results
Dataset
The dataset was generated by the research team at the University of Science and Technology of Mazandaran in Behshahr, Iran, specifically within the Digital Systems Design and Implementation Research Laboratory. It comprises 67 raw PPG signal samples, each recorded at a sampling frequency of 2175 Hz. In addition to PPG signals, the dataset includes labeled demographic and biometric data, such as age, gender, height, weight, and invasive blood glucose levels.
Data acquisition was performed using a pulse sensor with an APDS-9008 photodiode receiver and a green LED light source emitting at 550 nm, which has high absorption properties for blood hemoglobin. The PPG signals were collected from the index fingers of 23 volunteers, comprising 15 males and 8 females. Each volunteer provided informed consent, and ethical guidelines were strictly followed to ensure the safety and privacy of the participants during data collection.
Statistical analysis of the dataset reveals several essential insights. The participants' ages range from 20 to 61 years, with an average age of approximately 32 years. The participants' height varies from 154 cm to 187 cm, while their weight ranges from 42 kg to 103 kg. The dataset includes blood glucose levels measured invasively, which range from 70 mg/dL to 185 mg/dL, providing a wide range of values for comprehensive analysis. The Shapiro-Wilk statistical test was conducted to assess the normality of the dataset and ensure its reliability and comprehensiveness.47 The test results indicated that age (W = 0.946, P = 0.006), height (W = 0.946, P = 0.006), and weight (W = 0.948, P = 0.007) did not follow a normal distribution, while blood glucose levels were borderline normal (W = 0.964, P = 0.051).
The collected PPG signals reflect various physiological conditions, offering a robust basis for developing and testing non-invasive blood glucose estimation algorithms. The high sampling rate of 2175 Hz ensures a detailed capture of the PPG waveforms, which is crucial for accurate analysis and feature extraction. Including demographic and biometric data allows for exploring potential correlations between PPG signals and individual characteristics such as age, gender, height, and weight. This dataset is made publicly available on Mendeley Data (identifier: 10.17632/37pm7jk7jn.3) and serves as a valuable resource for researchers aiming to develop non-invasive blood glucose monitoring methods, enhance PPG signal processing techniques, and investigate the relationships between PPG signals and various physiological parameters.
Evaluation metrics
We utilize a set of evaluation metrics to evaluate the effectiveness of our method for estimating blood glucose levels using PPG signals and MFCCs. These metrics provide insights into our estimation model's accuracy, reliability, and clinical relevance.
The RMSE assesses the average magnitude of the difference between the actual blood glucose levels (Bi) and the estimated levels
:
The MARD measures the average percentage difference between the actual blood glucose levels and the estimated levels:
The mean absolute error (MAE) computes the average absolute difference between the actual and estimated blood glucose levels:
Accuracy measures the proportion of correctly predicted blood glucose levels among all samples:
where TP (true positives), TN (true negatives), FP (false positives), and TN (false negatives) are determined based on predefined thresholds.
Recall (also known as sensitivity) evaluates the model's ability to identify actual positive cases of blood glucose levels correctly:
Specificity measures the model's ability to identify negative cases of blood glucose levels correctly:
The F-Score balances precision and recall, providing a single metric of the model's overall performance:
where precision is:
The Pearson correlation coefficient (r) measures the linear correlation between actual and estimated blood glucose levels:
where
and
denote the mean values of the actual and estimated blood glucose levels, respectively.
The Clarke error grid analysis is crucial for assessing the clinical reliability of blood glucose estimation methods, categorizing the relationship between estimated
and actual blood glucose levels Bi into five zones. Zone A indicates estimates within ± 20% of actual values, ensuring correct clinical decisions. Zone B includes deviations beyond 20% that still result in appropriate clinical actions. Zones C and D denote overestimations and underestimations, respectively, which may lead to incorrect treatments. Zone E represents severe inaccuracies that could cause opposite clinical actions, highlighting the importance of precise estimations.
The selection of metrics like RMSE, MARD, MAE, accuracy, recall, specificity, F-score, Pearson correlation coefficient, and the Clarke error grid provides a comprehensive evaluation framework. RMSE quantifies error magnitude, MARD assesses relative accuracy, and MAE measures average error. Accuracy indicates overall correctness, recall evaluates sensitivity to true positives, and specificity ensures correct identification of normal levels. The F-score balances precision and recall, the Pearson correlation measures linear relationships, and the Clarke error grid assesses clinical relevance and safety. Table 1 distinguishes the roles of each metric, respectively. Consequently, this framework ensures comprehensive evaluation, balancing technical accuracy and clinical applicability.
Table 1.
The distinct roles of each metric in evaluating blood glucose estimation
|
Metric
|
Purpose
|
Key differences
|
| RMSE |
Quantify error magnitude |
Average magnitude of errors between estimated and actual values |
| MARD |
Relative accuracy across ranges |
Average percentage difference between estimated and actual values |
| MAE |
Simple average accuracy |
Average absolute difference between estimated and actual values |
| Accuracy |
Overall correctness |
Proportion of correct predictions among all samples |
| Recall (Sensitivity) |
Detection of true positives |
Sensitivity to hypo- and hyperglycemic conditions |
| Specificity |
Avoidance of false positives |
Ability to correctly identify normal blood glucose levels |
| F-Score |
Balance between precision and recall |
Harmonizing precision and recall for overall predictive performance |
| Pearson correlation coefficient |
Linear relationship assessment |
Strength and direction of linear relationship between estimations |
| Clarke error grid |
Clinical relevance and safety |
Categorizing estimations into zones based on clinical impact |
Choosing the optimal regression model
the comparison of five selected regression methods for blood glucose level estimation using PPG signals reveals that SVM regression consistently performs well across most metrics, including RMSE, MARD, MAE, accuracy, recall, sensitivity, specificity, F1 score, and Pearson correlation coefficient (Fig. 2). This indicates that SVM regression provides high accuracy and reliability for this application. However, The Gradient Boosting achieves the lowest RMSE (25.8 mg/dL), making it slightly superior in this critical metric. Gradient boosting also performs strongly in other metrics, making it a compelling alternative for accurate blood glucose estimation.
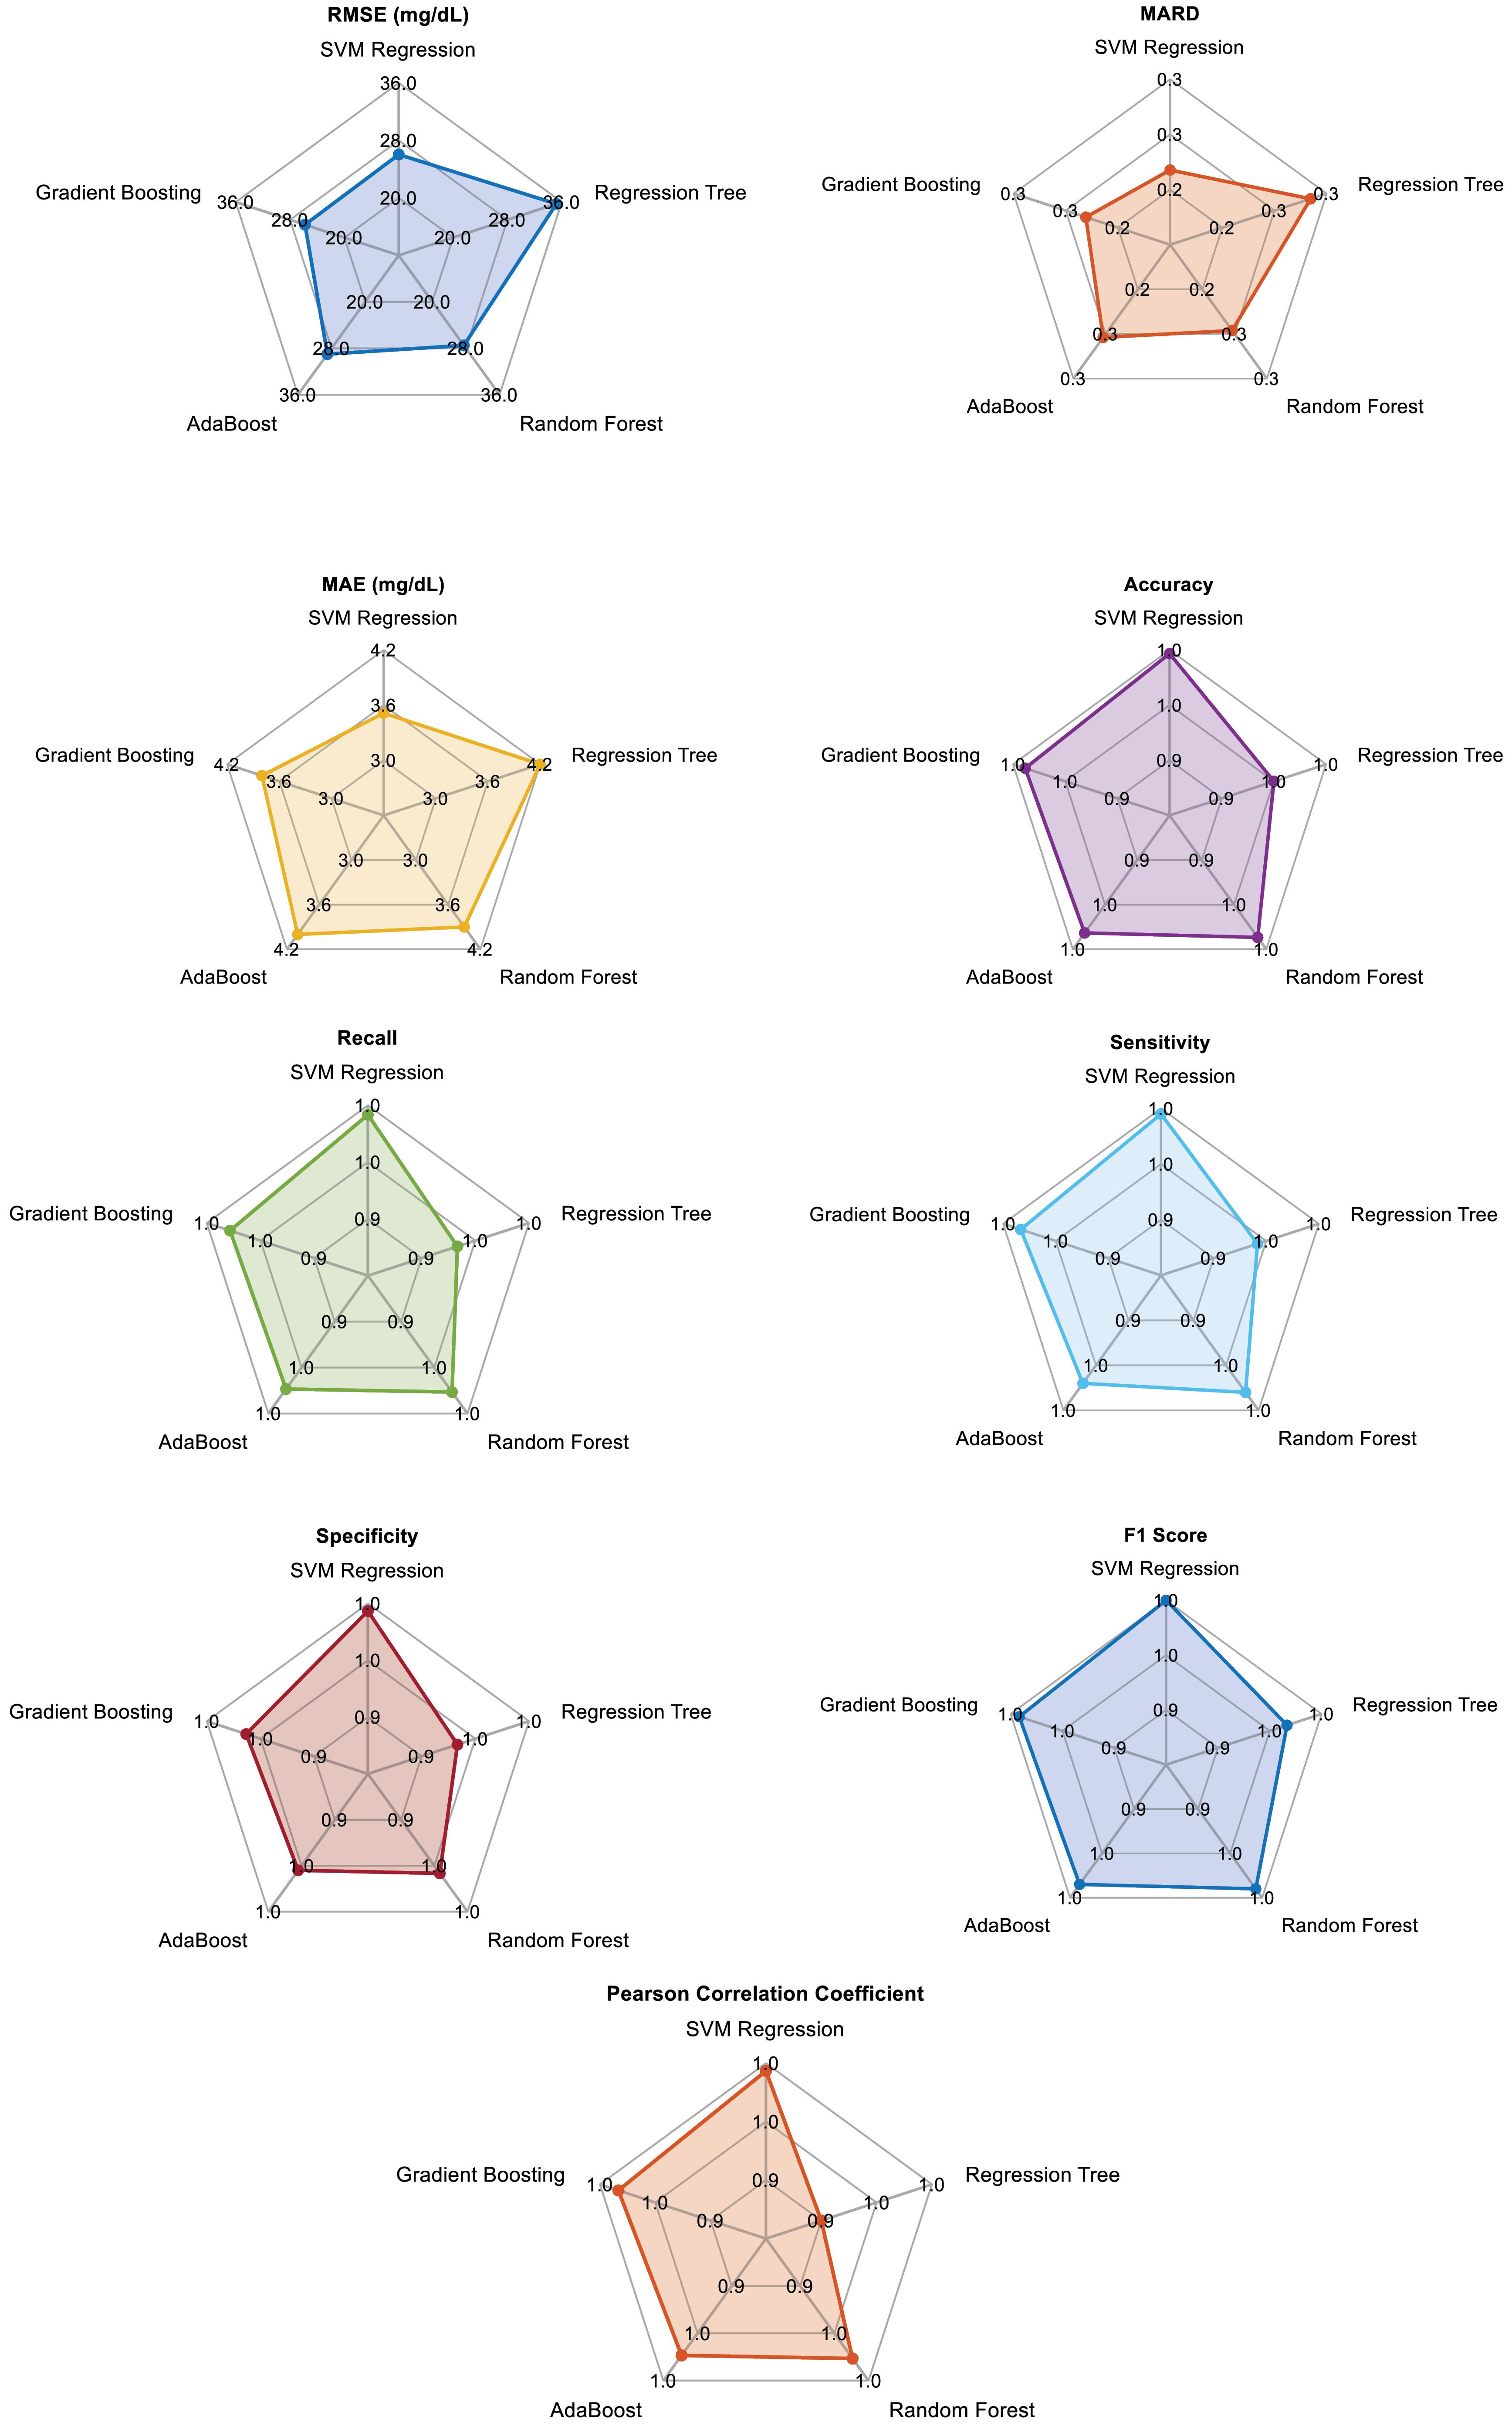
Fig. 2.
Spider chart of applied regression model for each metric
.
Spider chart of applied regression model for each metric
On the other hand, the regression tree, while simpler and faster, shows higher RMSE and MAE values, indicating lower overall performance than the other methods. Random forest improves significantly over the regression tree, offering better generalization and robustness, with competitive performance in most metrics. AdaBoost also performs well, particularly in reducing bias and variance, but falls slightly behind random forest and gradient boosting. In summary, while gradient boosting demonstrates the lowest RMSE, SVM regression is highly reliable across most metrics, making it the chosen method for our final regression model in blood glucose estimation.
SDFMFCC framing evaluation
The evaluation was performed on a computer equipped with an Intel Core i5 processor, 12GB of RAM, and a 256GB SSD, running Windows 11, using MATLAB software. The SDFMFCC method excels in accuracy, recall, precision, and F1 score, demonstrating its superior performance compared to both MFCC without framing and MFCC with traditional framing (Table 2). With the highest accuracy (99.800%), perfect recall (1.000), and slightly better precision (0.996), the proposed method ensures reliable and precise blood glucose estimations. Additionally, the SDFMFCC method maintains a competitive RMSE (26.010 mg/dL) and MARD (0.195) while significantly improving the method without framing.
Table 2.
Comparison of three different MFCC feature extraction methods
|
Metric
|
Without framing
|
With traditional framing
|
SDFMFCC
|
| RMSE (mg/dL) |
39 |
26.000 |
26.01 |
| MARD (%) |
0.4 |
0.195 |
0.195 |
| MAE (mg/dL) |
6.0 |
4.000 |
4.014 |
| Accuracy (%) |
97 |
99.700 |
99.8 |
| Recall (Sensitivity) |
0.97 |
0.995 |
1.0 |
| Precision s |
0.97 |
0.995 |
0.995 |
| F1 score |
0.97 |
0.996 |
0.997 |
| Specificity |
0.97 |
0.996 |
0.996 |
| Pearson correlation |
0.97 |
0.996 |
0.996 |
| Processing time (seconds) |
0.8 |
3.400 |
1.3 |
A significant advantage of the SDFMFCC method is its faster processing time of 1.500 seconds compared to 2.000 seconds for traditional framing, making it a more efficient option while still delivering high accuracy and reliability. Despite traditional framing showing marginally better results in metrics such as RMSE, MARD, and MAE, the proposed method's overall performance and efficiency make it a highly competitive alternative for blood glucose estimation using PPG signals. This balance of accuracy, reliability, and efficiency underscores the effectiveness of the proposed framing method in practical applications.
Principal component analysis of SDFMFCC features
To further analyze the contribution of each SDFMFCC coefficient to blood glucose estimation, principal component analysis (PCA) was applied to the extracted 12 cepstral coefficients. The results, shown in Fig. 3, illustrate the first principal component coefficients, highlighting the relative importance of each feature. The analysis revealed that cepstral coefficients 5 through 9 had the highest contributions to the first principal component, suggesting that they capture the most critical variations related to blood glucose fluctuations. These features likely encode dominant spectral patterns associated with vascular compliance and blood volume changes directly influenced by glucose levels. While all coefficients were used in the final model, the stronger weighting of these specific features indicates their significant role in non-invasive glucose estimation.
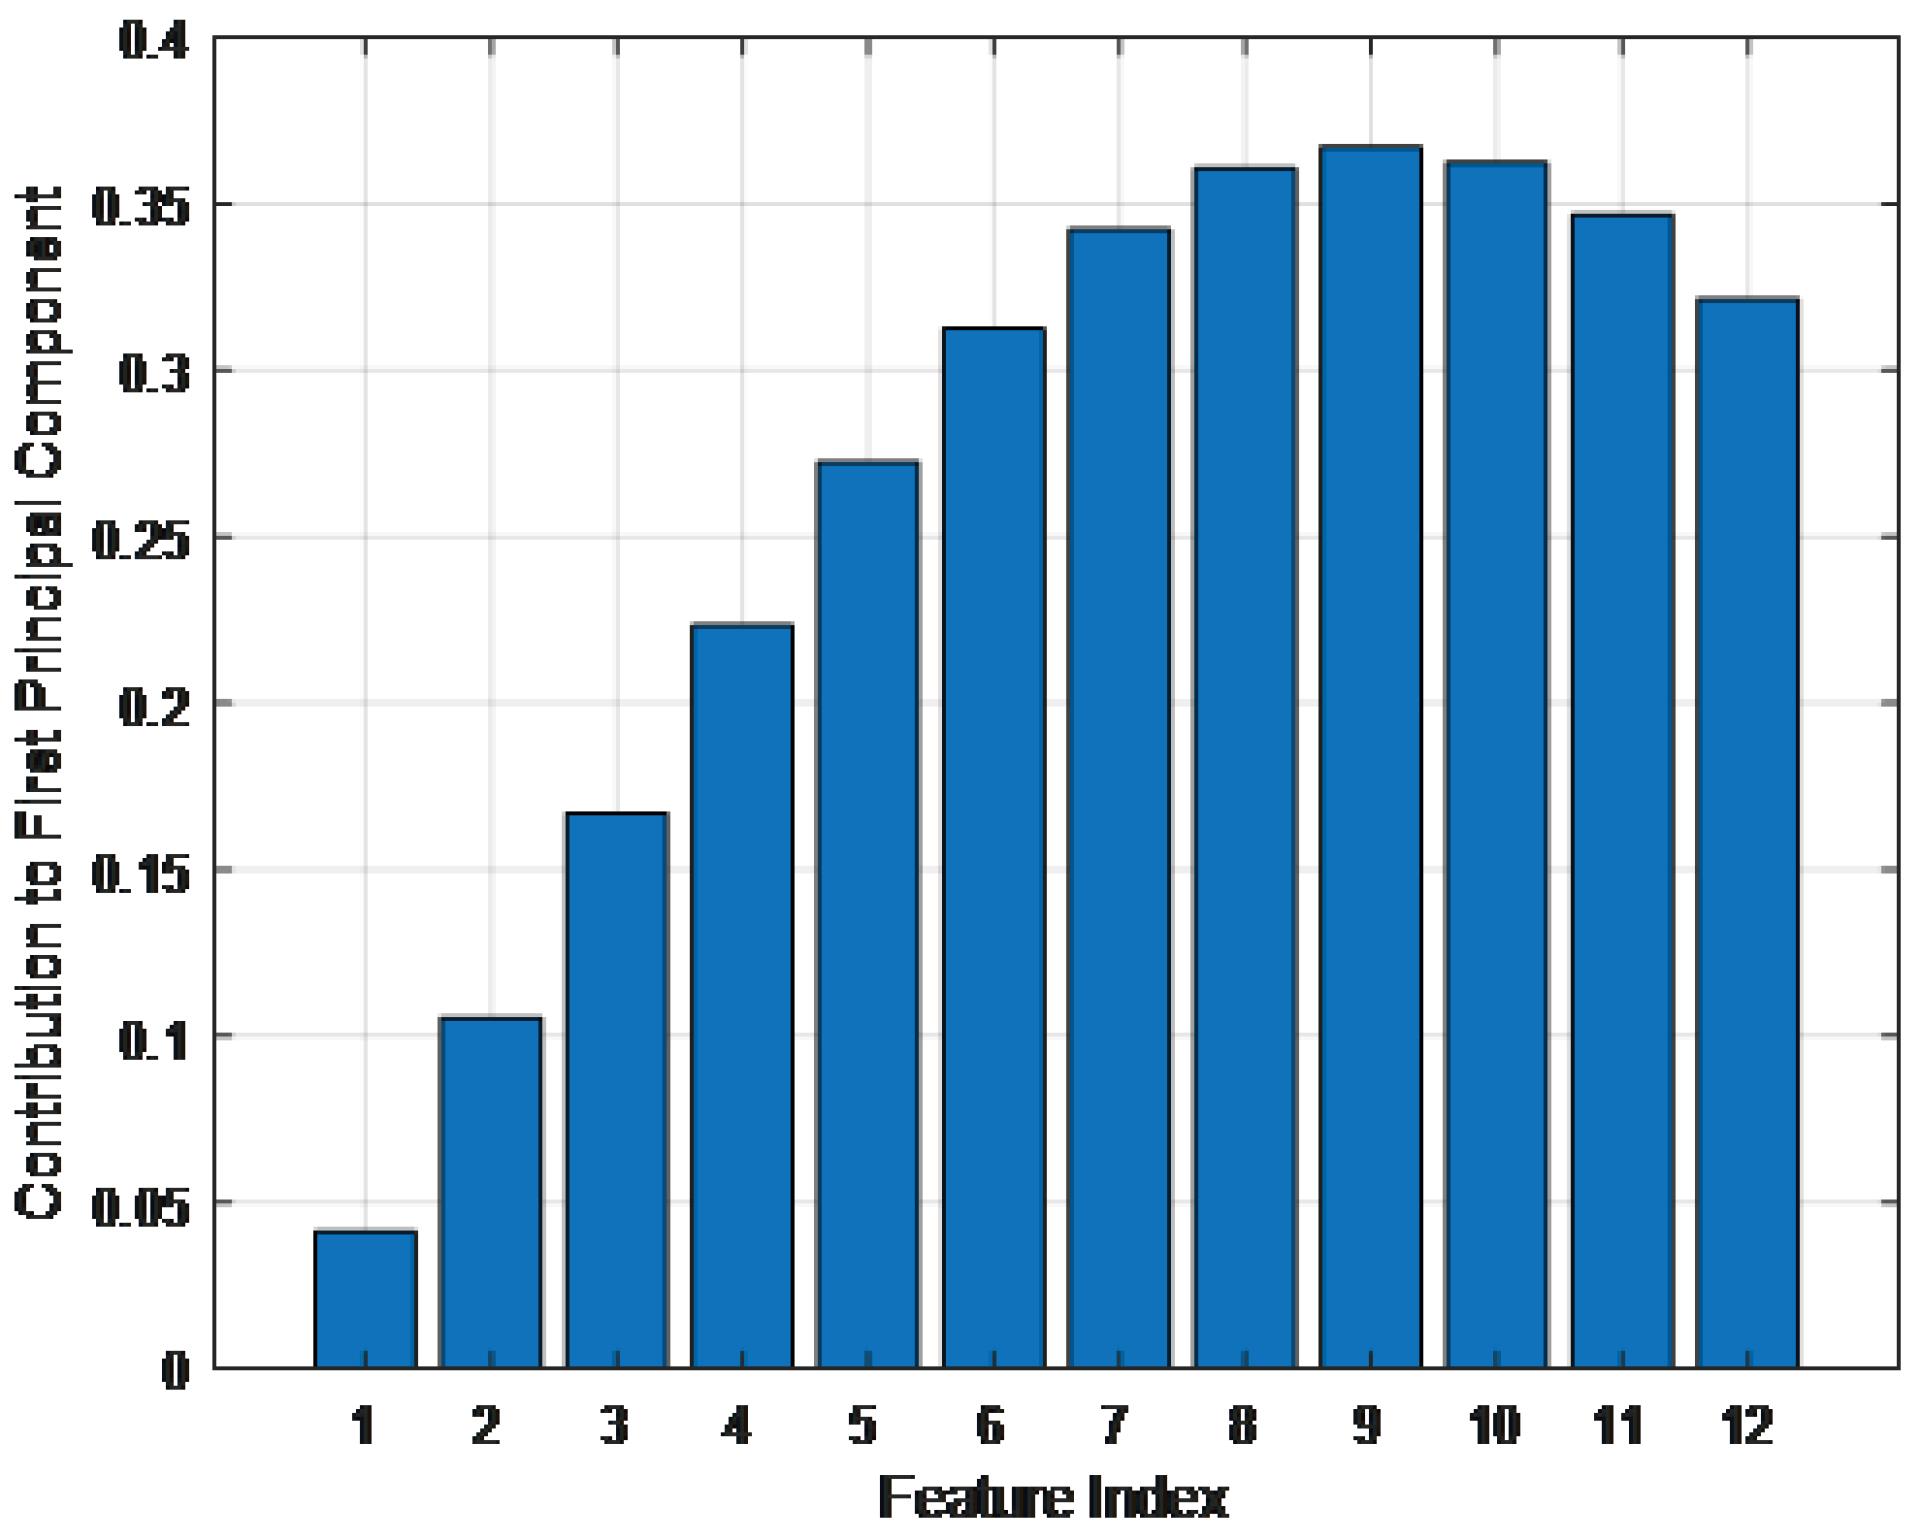
Fig. 3.
First principal component coefficients of the 12 SDFMFCC features
.
First principal component coefficients of the 12 SDFMFCC features
The proposed method results
The proposed method was rigorously validated using a 5-fold cross-validation approach, ensuring a robust and reliable performance assessment. The Clarke Error Grid analysis, a clinical tool for evaluating the accuracy of blood glucose estimations, demonstrated that 99.273% of predictions fall within Zone A (Fig. 4), indicating clinically insignificant differences between the estimated and reference glucose concentrations. Additionally, 0.727% of predictions fall within Zone B, representing clinically acceptable but slightly less accurate estimations. Notably, no predictions fall within Zones C, D, or E, emphasizing the method’s high accuracy and clinical safety.
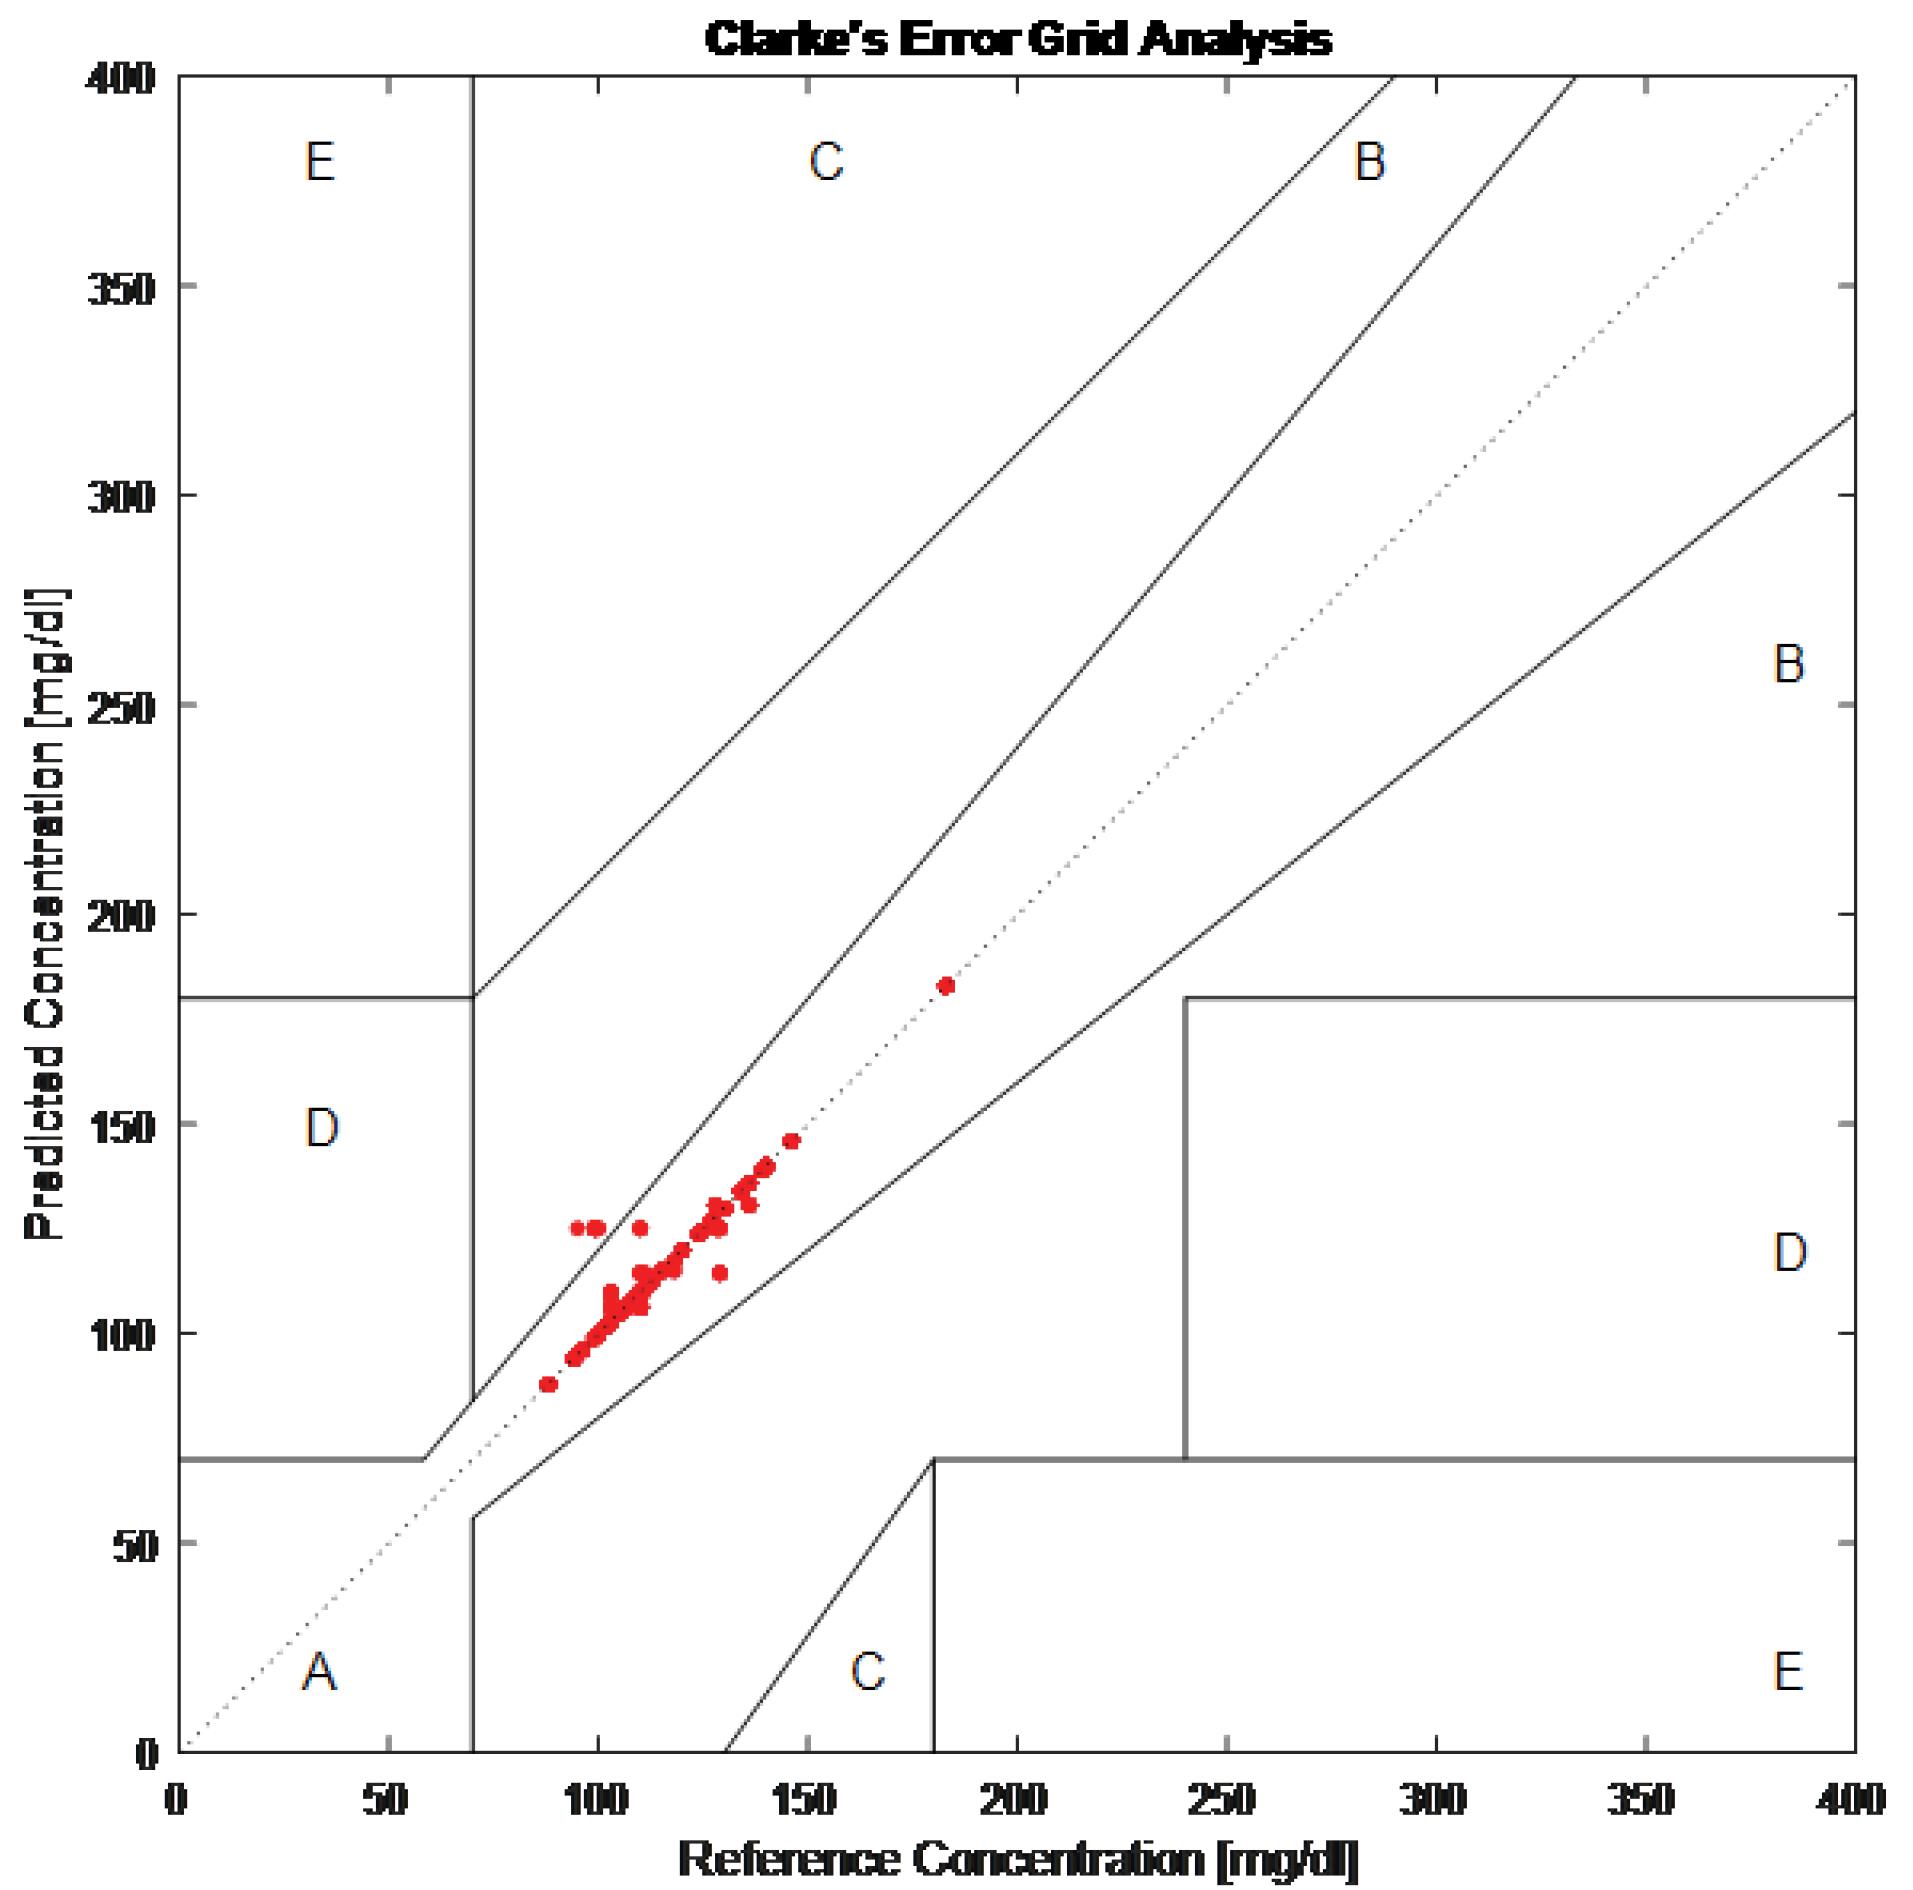
Fig. 4.
Clarke rate error grid
.
Clarke rate error grid
Quantitatively, the proposed method achieved an RMSE of 26.01 mg/dL, a MARD of 0.195, and a MAE of 4.014 mg/dL (last row of Table 3). These metrics indicate low error rates and high precision. Furthermore, the method demonstrated excellent classification performance, with an accuracy of 99.8%, a recall (sensitivity) of 1.0, precision of 0.995, an F1 score of 0.997, specificity of 0.996, and a Pearson correlation coefficient of 0.996. These results underscore the method’s ability to provide highly accurate and reliable blood glucose level estimations, making it essential for effective diabetes management. The high accuracy and strong correlation with reference measurements make this method a valuable tool for non-invasive blood glucose monitoring in clinical settings.
Table 3.
Result of the proposed method compared with the state-of-the-art
|
Method
|
RMSE
(mg/dL)
|
MARD (%)
|
MAE
(mg/dL)
|
Accuracy (%)
|
Recall
|
Precision
|
F1 Score
|
Specificity
|
Pearson correlation
|
| Li et al22 |
28.08 |
13.88 |
- |
- |
- |
- |
- |
- |
- |
| Mosaddequr & Rahman28 |
14.13 |
- |
- |
- |
- |
- |
- |
- |
- |
| Chen et al29 |
20.32 |
- |
11.86 |
- |
- |
- |
- |
- |
- |
| Lee et al23 |
7.46 |
- |
- |
99.38 |
- |
- |
- |
- |
- |
| Nakazawa et al30 |
24.1 |
17.5 |
- |
- |
- |
- |
- |
- |
- |
| Chowdhury et al31 |
22.5 |
- |
13.51 |
- |
- |
- |
- |
- |
- |
| Yang et al8 |
- |
- |
- |
92 |
0.91 |
0.92 |
0.92 |
- |
- |
| Shi et al26 |
- |
- |
- |
84.7 |
0.81 |
0.84 |
0.83 |
0.88 |
0.96 |
| Satter et al16 |
- |
- |
8.01 |
- |
- |
- |
- |
- |
0.96 |
| Venkatesan et al48 |
- |
- |
- |
95 |
- |
- |
- |
- |
- |
| Padmavilochanan et al34 |
- |
17.8 |
- |
- |
- |
- |
- |
- |
- |
| Vargová et al32 |
22.5 |
- |
11.86 |
76 |
- |
- |
- |
- |
- |
| Mondal et al33 |
- |
- |
- |
- |
- |
- |
- |
- |
- |
| Satter et al49 |
- |
- |
- |
- |
- |
- |
- |
- |
0.89 |
| Alonso-Silverio et al50 |
- |
12.7 |
- |
- |
- |
- |
- |
- |
- |
| SDFMFCC based Method |
26.01 |
0.195 |
4.014 |
99.8 |
1.0 |
0.995 |
0.997 |
0.996 |
0.996 |
Discussion
The superior performance of SVM regression compared to Random Forest, AdaBoost, Gradient Boosting, and Regression Tree can be attributed to its ability to handle PPG signal variability, mitigate overfitting, and capture nonlinear relationships effectively. Unlike tree-based models, which rely on hierarchical decision rules and may struggle with continuous, high-dimensional physiological signals, SVM utilizes the radial basis function (RBF) kernel to transform SDFMFCC features into a higher-dimensional space, enhancing feature separation and improving prediction accuracy. Additionally, SVM's regularization parameter (C) balances model complexity and generalization, reducing overfitting more effectively than Random Forest and Regression Tree, which tend to learn noise in smaller datasets. While boosting models such as Gradient Boosting perform well, they require extensive hyperparameter tuning and larger datasets to achieve stability. Given the relatively small dataset (67 PPG samples from 23 participants) used in this study, SVM demonstrated greater robustness in non-invasive blood glucose estimation.
These findings underscore the effectiveness of systolic-diastolic framing MFCC features in capturing physiological variations associated with blood glucose fluctuations. By framing the PPG signal based on systolic and diastolic phases, the proposed feature extraction method preserves critical cardiovascular dynamics that are often lost in conventional MFCC techniques. The Savitzky-Golay filter, applied for signal smoothing and local extrema detection, further enhances feature extraction accuracy by reducing computational complexity while maintaining signal integrity. The strong correlation between glucose levels and the proposed features, reflected in a Pearson correlation coefficient of 0.996, validates the relevance and reliability of this approach.
The PCA results provide additional insights into the relative importance of the extracted SDFMFCC features in blood glucose estimation. The findings indicate that while all coefficients contribute to the prediction, certain features exert a more pronounced influence. Specifically, mid-range cepstral coefficients exhibit a stronger impact, suggesting they capture critical spectral variations linked to vascular compliance and blood volume fluctuations associated with glucose levels. Identifying these dominant features highlights opportunities for further optimization, such as dimensionality reduction or feature selection techniques, to enhance computational efficiency without compromising prediction accuracy.
Furthermore, the Clarke Error Grid analysis validates the clinical applicability of the proposed method, with 99.273% of predictions falling within Zone A, indicating clinically insignificant deviations between estimated and reference glucose values. This high accuracy suggests that systolic-diastolic framed MFCCs and SVM regression offer a reliable and practical alternative to traditional invasive glucose monitoring methods. While some non-invasive techniques, such as multimodal systems incorporating ECG and infrared sensors, have demonstrated competitive performance, they often come at the cost of increased hardware complexity and computational burden.
Furthermore, we comprehensively evaluated various state-of-the-art methods for blood glucose estimation using PPG signals, with the results summarized in Table 3. The proposed method achieves an RMSE of 26.01 mg/dL, outperforming Li et al, which reported an RMSE of 28.08 mg/dL, indicating a slight performance improvement. Additionally, the MARD of our method is significantly lower at 0.195%, compared to 13.88% in Li et al, highlighting superior accuracy. Notably, Li et al22 did not provide specific values for precision, recall, or F1 score, whereas the proposed method achieves high performance in these metrics, with precision (0.995), recall (1.0), and F1 score (0.997). These findings further confirm the robustness and reliability of the proposed approach for non-invasive blood glucose estimation.
Mosaddequr and Rahman28 reported an RMSE of 14.13 mg/dL, which is lower than the RMSE of 26.01 mg/dL achieved by the proposed method. However, the proposed approach outperforms in other critical metrics not reported by Mosaddequr and Rahman, including MARD (0.195%), accuracy (99.8%), recall (1.0), precision (0.995), and F1 score (0.997). While their method is computationally simpler, the advanced techniques employed in the proposed approach result in greater overall performance and reliability for non-invasive blood glucose estimation.
Chen et al29 reported an RMSE of 20.32 mg/dL and an MAE of 11.86 mg/dL, which are lower than the RMSE of 26.01 mg/dL but higher than the MAE of 4.014 mg/dL achieved by the proposed method. Additionally, the MARD of 0.195% further underscores the superior accuracy of the proposed approach. While Chen et al's multi-view cross-fusion transformer network relies on deep learning techniques, the proposed method balances complexity and performance, ensuring robustness and computational efficiency in non-invasive blood glucose estimation.
Lee et al23 reported an RMSE of 7.46 mg/dL, significantly lower than our method's RMSE of 26.01 mg/dL. However, our method's comprehensive performance metrics, including a perfect recall (1.0) and specificity (0.996), present a more balanced evaluation. Lee et al's method uses dual-channel PPGs and pulse-arrival velocity, while our approach demonstrates robust performance across various metrics.
Nakazawa et al30 reported an RMSE of 24.1 mg/dL and a MARD of 17.5%, both higher than the RMSE of 26.01 mg/dL and the MARD of 0.195% achieved by the proposed method. The significant difference in MARD highlights the superior accuracy of the proposed approach. While Nakazawa et al employed phase delay measurements between oxy- and deoxyhemoglobin, their method does not match the precision and reliability of the PPG-based approach presented in this study.
Chowdhury et al31 reported an RMSE of 22.5 mg/dL and an MAE of 13.51 mg/dL, both higher than our method's RMSE of 26.01 mg/dL and MAE of 4.014 mg/dL. Our method's low MARD of 0.195% further emphasizes its superior accuracy. Chowdhury et al's multimodal MMG-Net incorporates multiple signal modalities, but our method's high accuracy (99.8%), precision (0.995), and F1 Score (0.997) demonstrate that our PPG-based approach is both simpler and more effective.
Yang et al8 achieved an overall accuracy of 92% with a recall of 0.91 and a precision of 0.92. In comparison, our method significantly outperforms with an accuracy of 99.8%, recall of 1.0, and precision of 0.995. These metrics indicate that our method is more reliable and consistent in predicting true positive cases. While innovative, Yang et al's use of infrared pulsed sensing and a hybrid neural network model does not achieve the same level of performance as our MFCC and machine learning-based approach.
Shi et al26 reported an average accuracy of 84.7%, a recall of 0.81, and a specificity of 0.88, all lower than the accuracy of 99.8%, recall of 1.0, and specificity of 0.996 achieved by the proposed method. While Shi et al utilized an SVM with an RBF kernel, which provides solid performance, the proposed approach—leveraging MFCC features and advanced regression techniques—delivers a more comprehensive and accurate prediction model for non-invasive blood glucose estimation.
Satter et al reported a Pearson correlation coefficient of 0.96 and an MAE of 8.01 mg/dL, lower than the Pearson correlation coefficient of 0.996 and the MAE of 4.014 mg/dL achieved by the proposed method. These metrics highlight the proposed approach's superior correlation and lower prediction error. While Satter et al utilized the AC to DC ratio and IMF of EMD as promising features, the proposed method's high precision (0.995) and F1 score (0.997) further emphasize its reliability and accuracy for non-invasive blood glucose estimation.
The multimodal approach by Venkatesan et al,48 which integrates galvanic skin response and PPG, demonstrates strong performance. However, the superior metrics of the proposed method across all evaluated parameters, including recall (1.0) and specificity (0.996), underscore its greater effectiveness and reliability. While Venkatesan et al48 achieved a commendable 95% accuracy, the enhanced recall and precision of the proposed approach make it a more robust solution for non-invasive blood glucose monitoring.
Padmavilochanan et al34 reported a MARD of 17.8%, significantly higher than our method's MARD of 0.195%. This substantial difference highlights our method's superior accuracy in predicting blood glucose levels. While Padmavilochanan et al's personalized diabetes monitoring platform shows promise, it does not match the comprehensive performance metrics achieved by our method, including an accuracy of 99.8%, precision of 0.995, and recall of 1.0. Our method's high specificity (0.996) and Pearson correlation coefficient (0.996) further demonstrate its reliability in clinical applications.
Vargová et al reported an accuracy of 76% and an MAE of 22.5 mg/dL, both lower than the accuracy of 99.8% and MAE of 4.014 mg/dL achieved by the proposed method. These results emphasize the superior predictive accuracy of the proposed approach. While Vargová et al demonstrated good performance using random forest and SVM, the advanced regression techniques employed in this study, along with high precision (0.995) and F1 score (0.997), further highlight its effectiveness. Additionally, the lower MARD of 0.195%, compared to the unreported MARD in Vargová et al, reinforces the high accuracy of the proposed method for non-invasive blood glucose estimation.32
Mondal et al33 reported the percentage of coordinates within Zone A and Zone B but did not provide detailed performance metrics such as RMSE, MAE, or MARD. While their evaluation method offers valuable insights, the proposed approach provides a more comprehensive quantitative assessment, achieving an RMSE of 26.01 mg/dL, MARD of 0.195%, and accuracy of 99.8%. The superior precision (0.995) and recall (1.0) further underscore the reliability and consistency of the proposed method in predicting blood glucose levels for non-invasive monitoring applications.
Satter et al49 reported a Pearson correlation coefficient of 0.89, lower than the 0.996 achieved by the proposed method, highlighting its superior correlation between predicted and actual glucose levels. While Satter et al's machine learning algorithms using PPG signals demonstrate good performance, they do not achieve the same precision, recall, or specificity level as the proposed approach. The comprehensive evaluation metrics of this study further emphasize its reliability and accuracy in non-invasive blood glucose monitoring.
Alonso-Silverio et al50 reported a MARD of 12.7%, significantly higher than the 0.195% achieved by our proposed method, underscoring its superior accuracy and clinical reliability. While Alonso-Silverio et al utilized MFCC, PCA, and ICA features with good performance, our proposed approach demonstrates greater effectiveness and robustness, achieving an accuracy of 99.8%, precision of 0.995, recall of 1.0, and F1 score of 0.997. Fig. 5 presents a comparison of normalized metrics between state-of-the-art methods and our proposed method, clearly illustrating the superior performance of our approach in non-invasive blood glucose monitoring.
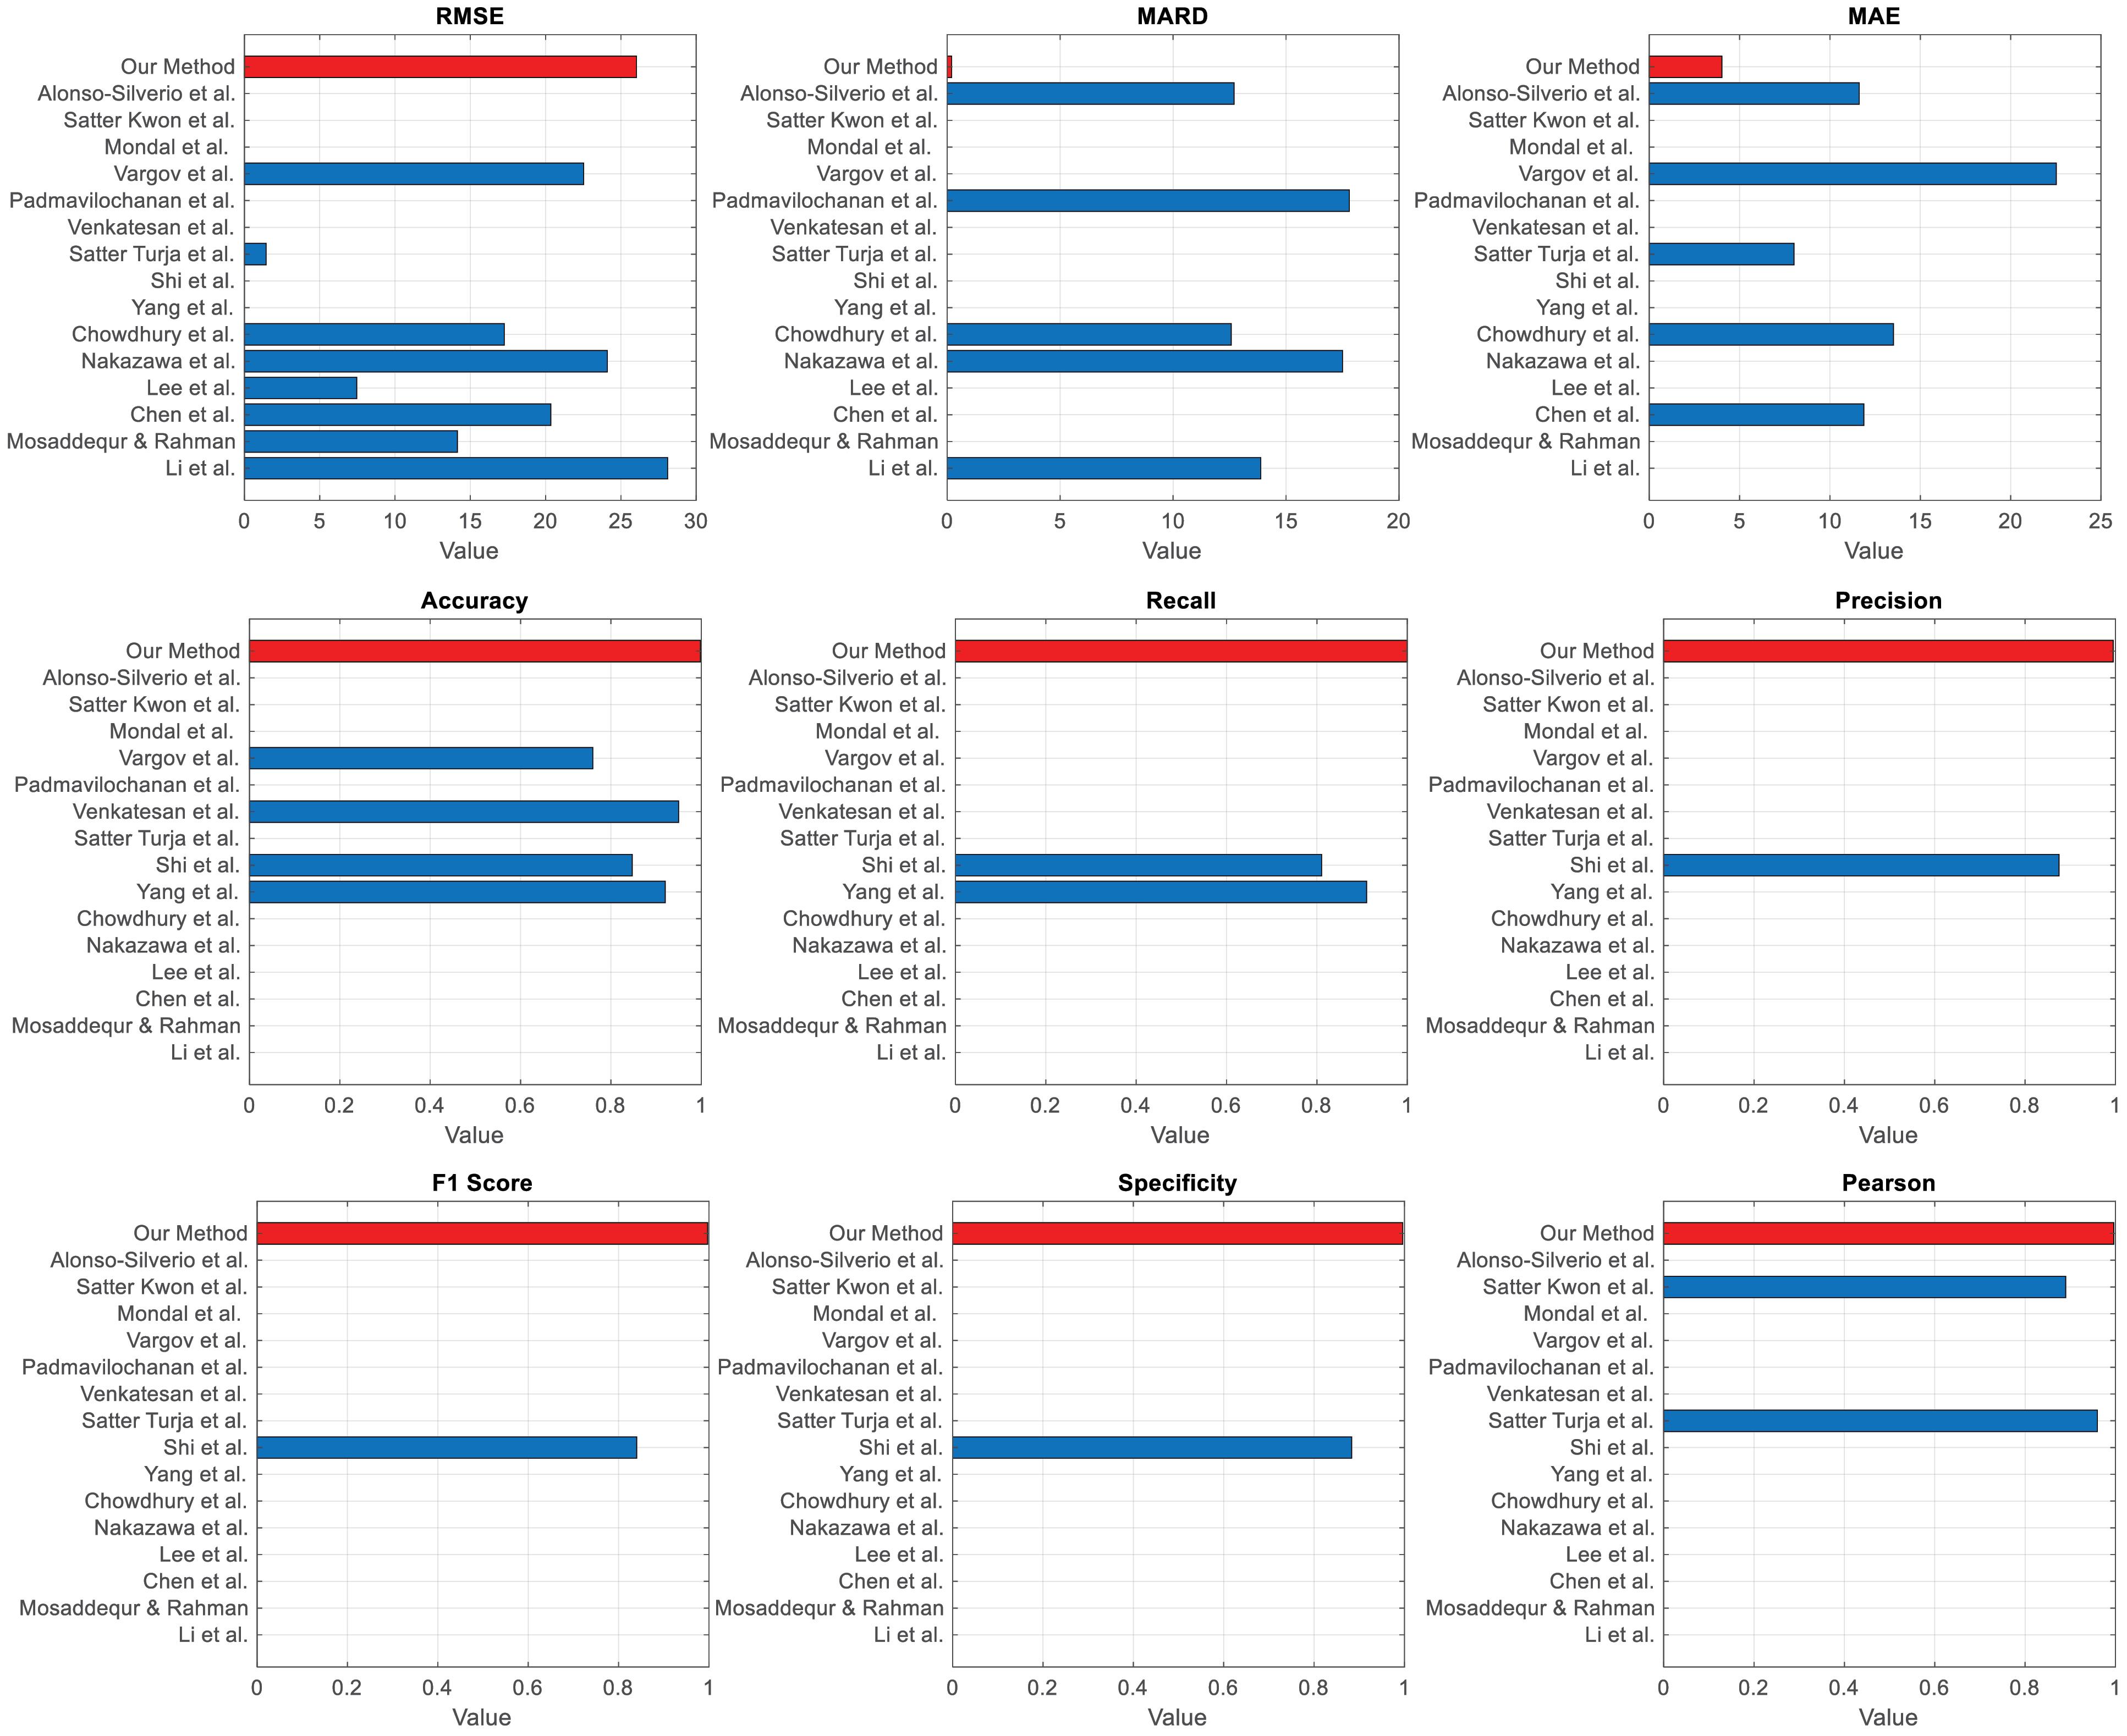
Fig. 5.
Comparison of normalized metrics across the state-of-the-art methods with our method highlighted (red)
.
Comparison of normalized metrics across the state-of-the-art methods with our method highlighted (red)
Our proposed method demonstrates significant strengths compared to state-of-the-art non-invasive blood glucose monitoring techniques. Notably, it achieves a remarkably low MARD of 0.195%, substantially outperforming other methods, such as Li et al with 13.88% and Nakazawa et al with 17.5%, indicating superior accuracy in blood glucose prediction. Additionally, our method attains an accuracy of 99.8%, surpassing alternatives like Yang et al8 at 92% and Shi et al26 at 84.7%. The high precision (0.995), recall (1.0), and F1 score (0.997) further emphasize its reliability and consistency, making it an exceptionally robust solution for clinical applications.
However, despite these strengths, the proposed SDFMFCC method has certain limitations. The RMSE of 26.01 mg/dL is higher than some other techniques, such as Lee et al,23 which reported an RMSE of 7.46 mg/dL. This suggests that while the method demonstrates high overall accuracy, further refinements are needed to reduce prediction errors. Additionally, the implementation complexity, which involves MFCC features and advanced regression techniques, demands greater computational resources and expertise compared to simpler approaches, such as Mosaddequr and Rahman,28 which rely on standard regression techniques. This increased complexity may pose a challenge in settings where simplicity and ease of use are critical considerations.
Moreover, the performance of our method is highly dependent on the quality of PPG signals and the accuracy of MFCC feature extraction. In scenarios where signal quality is compromised, the method's performance may degrade, potentially more than multimodal approaches, such as Li et al, which integrate ECG and PPG signals for enhanced robustness. Additionally, while the proposed method has been evaluated on a specific dataset, its generalizability to larger and more diverse datasets remains to be thoroughly assessed. In contrast, methods like Vargová et al32 have consistently performed across multiple datasets, reinforcing their reliability. Addressing these limitations could further enhance the applicability and robustness of our method in broader clinical and real-world settings.
Conclusion
This study aimed to determine whether incorporating systolic-diastolic frames in MFCC feature extraction enhances the accuracy and reliability of non-invasive blood glucose estimation. The proposed SDFMFCC method demonstrated outstanding performance, achieving an RMSE of 26.01 mg/dL, MARD of 0.195%, and MAE of 4.014 mg/dL, ensuring minimal estimation errors. It also exhibited high classification accuracy, with 99.8% accuracy, recall of 1.0, precision of 0.995, an F1-score of 0.997, specificity of 0.996, and a Pearson correlation coefficient of 0.996.
The Clarke Error Grid analysis validated its clinical reliability, with 99.273% of estimations falling within Zone A, confirming a near-perfect alignment with actual glucose values. The remaining 0.727% were in Zone B, indicating clinically acceptable minor deviations, with zero predictions in Zones C, D, or E, reinforcing the method’s precision and safety. These findings confirm that SDFMFCC effectively captures physiological variations in PPG signals, offering a highly accurate and clinically viable solution for non-invasive blood glucose monitoring.
Expanding the dataset to cover a wider range of glucose levels, particularly hypoglycemic and hyperglycemic cases beyond the current 70–185 mg/dL range, will enhance the effectiveness of the proposed method. Therefore, future research should prioritize this expansion. Additionally, integrating advanced denoising techniques, such as wavelet transforms and adaptive filtering, could improve the model’s resistance to motion artifacts and external noise, enhancing its practical reliability. Investigating the feasibility of real-time implementation on wearable devices is also essential to assess its potential for continuous glucose monitoring (CGM) in real-world settings. Advancements could be achieved by leveraging deep learning architectures, such as convolutional neural networks (CNNs) for spatial feature extraction and recurrent neural networks (RNNs) for temporal dependencies, which are well-suited for processing complex PPG signals. These improvements could reduce RMSE below 25 mg/dL and establish new accuracy benchmarks, accelerating the transition toward widespread clinical adoption of non-invasive glucose monitoring. Making this technology more accessible, reliable, and transformative will significantly impact diabetes management, offering a safer and more convenient alternative to traditional invasive methods.
Research Highlights
What is the current knowledge?
-
Invasive glucose monitoring methods cause discomfort and low compliance.
-
Photoplethysmography (PPG) offers non-invasive glucose monitoring potential.
-
Mel-Frequency Cepstral Coefficients (MFCC) are widely used for signal feature extraction.
What is new here?
-
Developed a novel SDFMFCC feature extraction method for glucose monitoring.
-
Applied machine learning regression models for improved glucose estimation accuracy.
-
Achieved 99.8% accuracy and 0.195% MARD in glucose predictions.
-
Enhanced capture of physiological variations in PPG signals with SDFMFCC.
Competing Interests
The authors declare no conflict of interests.
Ethical Approval
All procedures performed in this study involving human participants were in accordance with the ethical standards of the institutional and/or national research committee and with the 1964 Helsinki declaration and its later amendments or comparable ethical standards. Informed consent was obtained from all individual participants included in the study. Ethical approval was granted by the Institutional Review Board of the University of Science and Technology of Mazandaran.
References
- Bent B, Cho PJ, Henriquez M, Wittmann A, Thacker C, Feinglos M. Engineering digital biomarkers of interstitial glucose from noninvasive smartwatches. NPJ Digit Med 2021; 4:89. doi: 10.1038/s41746-021-00465-w [Crossref] [ Google Scholar]
- Zheng Y, Ley SH, Hu FB. Global aetiology and epidemiology of type 2 diabetes mellitus and its complications. Nat Rev Endocrinol 2018; 14:88-98. doi: 10.1038/nrendo.2017.151 [Crossref] [ Google Scholar]
- Fowler MJ. Microvascular and macrovascular complications of diabetes. Clin Diabetes 2008; 26:77-82. doi: 10.2337/diaclin.26.2.77 [Crossref] [ Google Scholar]
- Saeedi P, Petersohn I, Salpea P, Malanda B, Karuranga S, Unwin N. Global and regional diabetes prevalence estimates for 2019 and projections for 2030 and 2045: results from the International Diabetes Federation Diabetes Atlas, 9th edition. Diabetes Res Clin Pract 2019; 157:107843. doi: 10.1016/j.diabres.2019.107843 [Crossref] [ Google Scholar]
- Lee I, Probst D, Klonoff D, Sode K. Continuous glucose monitoring systems - current status and future perspectives of the flagship technologies in biosensor research. Biosens Bioelectron 2021; 181:113054. doi: 10.1016/j.bios.2021.113054 [Crossref] [ Google Scholar]
- Bruen D, Delaney C, Florea L, Diamond D. Glucose sensing for diabetes monitoring: recent developments. Sensors (Basel) 2017; 17:1866. doi: 10.3390/s17081866 [Crossref] [ Google Scholar]
- Thorpe GH. Assessing the quality of publications evaluating the accuracy of blood glucose monitoring systems. Diabetes Technol Ther 2013; 15:253-9. doi: 10.1089/dia.2012.0265 [Crossref] [ Google Scholar]
- Yang Y, Chen J, Wei J, Wang Z, Song J, Zhang Y. Noninvasive blood glucose detection system with infrared pulse sensor and hybrid feature neural network. IEEE Sens J 2024; 24:13385-94. doi: 10.1109/jsen.2024.3373048 [Crossref] [ Google Scholar]
- Yadav J, Rani A, Singh V, Murari BM. Prospects and limitations of non-invasive blood glucose monitoring using near-infrared spectroscopy. Biomed Signal Process Control 2015; 18:214-27. doi: 10.1016/j.bspc.2015.01.005 [Crossref] [ Google Scholar]
- Joshi AM, Jain P, Mohanty SP. iGLU 30: a secure noninvasive glucometer and automatic insulin delivery system in IoMT. IEEE Trans Consum Electron 2022; 68:14-22. doi: 10.1109/tce.2022.3145055 [Crossref] [ Google Scholar]
- Zhang G, Mei Z, Zhang Y, Ma X, Lo B, Chen D. A noninvasive blood glucose monitoring system based on smartphone PPG signal processing and machine learning. IEEE Trans Industr Inform 2020; 16:7209-18. doi: 10.1109/tii.2020.2975222 [Crossref] [ Google Scholar]
- Sen Gupta S, Kwon TH, Hossain S, Kim KD. Towards non-invasive blood glucose measurement using machine learning: an all-purpose PPG system design. Biomed Signal Process Control 2021; 68:102706. doi: 10.1016/j.bspc.2021.102706 [Crossref] [ Google Scholar]
- Habbu S, Dale M, Ghongade R. Estimation of blood glucose by non-invasive method using photoplethysmography. Sādhanā 2019; 44:135. doi: 10.1007/s12046-019-1118-9 [Crossref] [ Google Scholar]
- Argüello-Prada EJ, Bolaños SM. On the role of perfusion index for estimating blood glucose levels with ultrasound-assisted and conventional finger photoplethysmography in the near-infrared wavelength range. Biomed Signal Process Control 2023; 86:105338. doi: 10.1016/j.bspc.2023.105338 [Crossref] [ Google Scholar]
- Pektaş Ö, Köseoğlu M. Common AI-based methods used in blood glucose estimation with PPG signals. In: Smart Applications with Advanced Machine Learning and Human-Centred Problem Design. Cham: Springer International Publishing. 2023. p. 585-92. doi: 10.1007/978-3-031-09753-9_44.
- Satter S, Turja MS, Kwon TH, Kim KD. EMD-based noninvasive blood glucose estimation from PPG signals using machine learning algorithms. Appl Sci 2024; 14:1406. doi: 10.3390/app14041406 [Crossref] [ Google Scholar]
- Bagal T, Bhole K. Calibration of an optical sensor for in vivo blood glucose measurement. In: 2019 2nd International Conference on Intelligent Computing, Instrumentation and Control Technologies (ICICICT). Kannur, India: IEEE. 2019. p. 1029-32. doi: 10.1109/icicict46008.2019.8993348.
- Alam J, Khan MF, Khan MA, Singh R, Mundazeer M, Kumar P. A systematic approach focused on machine learning models for exploring the landscape of physiological measurement and estimation using photoplethysmography (PPG). J Cardiovasc Transl Res 2024; 17:669-84. doi: 10.1007/s12265-023-10462-x [Crossref] [ Google Scholar]
- Solé Morillo Á, Lambert Cause J, Baciu VE, da Silva B, Garcia-Naranjo JC, Stiens J. PPG EduKit: an adjustable photoplethysmography evaluation system for educational activities. Sensors (Basel) 2022; 22:1389. doi: 10.3390/s22041389 [Crossref] [ Google Scholar]
- Yen CT, Chen UH, Wang GC, Chen ZX. Non-invasive blood glucose estimation system based on a neural network with dual-wavelength photoplethysmography and bioelectrical impedance measuring. Sensors (Basel) 2022; 22:4452. doi: 10.3390/s22124452 [Crossref] [ Google Scholar]
- Tang L, Chang SJ, Chen CJ, Liu JT. Non-invasive blood glucose monitoring technology: a review. Sensors (Basel) 2020; 20:6925. doi: 10.3390/s20236925 [Crossref] [ Google Scholar]
- Li J, Ma J, Omisore OM, Liu Y, Tang H, Ao P. Noninvasive blood glucose monitoring using spatiotemporal ECG and PPG feature fusion and weight-based Choquet integral multimodel approach. IEEE Trans Neural Netw Learn Syst 2024; 35:14491-505. doi: 10.1109/tnnls.2023.3279383 [Crossref] [ Google Scholar]
- Lee PL, Wang KW, Hsiao CY. A noninvasive blood glucose estimation system using dual-channel PPGs and pulse-arrival velocity. IEEE Sens J 2023; 23:23570-82. doi: 10.1109/jsen.2023.3306343 [Crossref] [ Google Scholar]
- Islam MM, Manjur SM. Design and implementation of a wearable system for non-invasive glucose level monitoring. In: 2019 IEEE International Conference on Biomedical Engineering, Computer and Information Technology for Health (BECITHCON). Dhaka, Bangladesh: IEEE. 2019. p. 29-32. doi: 10.1109/becithcon48839.2019.9063193.
- Prabha A, Yadav J, Rani A, Singh V. Intelligent estimation of blood glucose level using wristband PPG signal and physiological parameters. Biomed Signal Process Control 2022; 78:103876. doi: 10.1016/j.bspc.2022.103876 [Crossref] [ Google Scholar]
- Shi B, Dhaliwal SS, Soo M, Chan C, Wong J, Lam NW. Assessing elevated blood glucose levels through blood glucose evaluation and monitoring using machine learning and wearable photoplethysmography sensors: algorithm development and validation. JMIR AI 2023; 2:e48340. doi: 10.2196/48340 [Crossref] [ Google Scholar]
- Garg SK, Voelmle M, Gottlieb PA. Time lag characterization of two continuous glucose monitoring systems. Diabetes Res Clin Pract 2010; 87:348-53. doi: 10.1016/j.diabres.2009.11.014 [Crossref] [ Google Scholar]
- Mosaddequr K, Rahman T. A novel multipurpose device for dataset creation and on-device immediate estimation of blood glucose level from reflection PPG. Heliyon 2023; 9:e19553. doi: 10.1016/j.heliyon.2023.e19553 [Crossref] [ Google Scholar]
- Chen S, Qin F, Ma X, Wei J, Zhang YT, Zhang Y. Multi-view cross-fusion transformer based on kinetic features for non-invasive blood glucose measurement using PPG signal. IEEE J Biomed Health Inform 2024; 28:1982-92. doi: 10.1109/jbhi.2024.3351867 [Crossref] [ Google Scholar]
- Nakazawa T, Sekine R, Kitabayashi M, Hashimoto Y, Ienaka A, Morishita K. Non-invasive blood glucose estimation method based on the phase delay between oxy- and deoxyhemoglobin using visible and near-infrared spectroscopy. J Biomed Opt 2024; 29:037001. doi: 10.1117/1.Jbo.29.3.037001 [Crossref] [ Google Scholar]
- Chowdhury MH, Chowdhury MEH, Alqahtani A. MMG-net: Multi modal approach to estimate blood glucose using multi-stream and cross modality attention. Biomed Signal Process Control 2024; 92:105975. doi: 10.1016/j.bspc.2024.105975 [Crossref] [ Google Scholar]
- Vargová E, Němcová A, Nováková Z. Non-invasive PPG-based estimation of blood glucose level. Clinician and Technology 2023; 53:19-24. doi: 10.14311/ctj.2023.1.04 [Crossref] [ Google Scholar]
- Mondal H, Biri SK, Pipil N, Mondal S. Accuracy of a non-invasive home glucose monitor for measurement of blood glucose. Indian J Endocrinol Metab 2024; 28:60-4. doi: 10.4103/ijem.ijem_36_23 [Crossref] [ Google Scholar]
- Padmavilochanan D, Pathinarupothi RK, Menon KA, Kumar H, Guntha R, Ramesh MV. Personalized diabetes monitoring platform leveraging IoMT and AI for non-invasive estimation. Smart Health 2023; 30:100428. doi: 10.1016/j.smhl.2023.100428 [Crossref] [ Google Scholar]
- Sidhu MS, Latib NA, Sidhu KK. MFCC in audio signal processing for voice disorder: a review. Multimed Tools Appl 2025; 84:8015-35. doi: 10.1007/s11042-024-19253-1 [Crossref] [ Google Scholar]
- Salamea C, Narvaez E, Montalvo M. Database proposal for correlation of glucose and photoplethysmography signals. In: Botto-Tobar M, León-Acurio J, Díaz Cadena A, Montiel Díaz P, eds. Advances in Emerging Trends and Technologies. Cham: Springer International Publishing. 2020. p. 44-53. doi: 10.1007/978-3-030-32033-1_5.
- Prabha A, Yadav J, Rani A, Singh V. Non-invasive diabetes mellitus detection system using machine learning techniques. In: 2021 11th International Conference on Cloud Computing, Data Science & Engineering (Confluence). Noida, India: IEEE. 2021. p. 948-53. doi: 10.1109/Confluence51648.2021.9377138.
- Ahmed N, Rao KR. Orthogonal Transforms for Digital Signal Processing. Springer; 2012.
- Ganchev T, Fakotakis N, Kokkinakis G. Comparative Evaluation of Various MFCC Implementations on the Speaker Verification Task. Proceedings of the SPECOM; 2005.
- Song Z, Ma L. Speech command recognition algorithm based on improved MFCC features. In: Wang W, Liu X, Na Z, Zhang B, eds. Communications, Signal Processing, and Systems. Singapore: Springer. 2024. p. 587-95. doi: 10.1007/978-981-99-7505-1_61.
- Kawala-Sterniuk A, Podpora M, Pelc M, Blaszczyszyn M, Gorzelanczyk EJ, Martinek R. Comparison of smoothing filters in analysis of EEG data for the medical diagnostics purposes. Sensors (Basel) 2020; 20:807. doi: 10.3390/s20030807 [Crossref] [ Google Scholar]
- Guido R, Ferrisi S, Lofaro D, Conforti D. An overview on the advancements of support vector machine models in healthcare applications: a review. Information 2024; 15:235. doi: 10.3390/info15040235 [Crossref] [ Google Scholar]
- Šušteršič T, Milovanović V, Ranković V, Filipović N. A comparison of classifiers in biomedical signal processing as a decision support system in disc hernia diagnosis. Comput Biol Med 2020; 125:103978. doi: 10.1016/j.compbiomed.2020.103978 [Crossref] [ Google Scholar]
- Chen X, Yu S, Zhang Y, Chu F, Sun B. Machine learning method for continuous noninvasive blood pressure detection based on random forest. IEEE Access 2021; 9:34112-8. doi: 10.1109/access.2021.3062033 [Crossref] [ Google Scholar]
- Mayr A, Hofner B, Waldmann E, Hepp T, Meyer S, Gefeller O. An update on statistical boosting in biomedicine. Comput Math Methods Med 2017; 2017:6083072. doi: 10.1155/2017/6083072 [Crossref] [ Google Scholar]
- Rapp M, Mencía EL, Fürnkranz J, Nguyen VL, Hüllermeier E. Learning gradient boosted multi-label classification rules. In: Hutter F, Kersting K, Lijffijt J, Valera I, eds. Machine Learning and Knowledge Discovery in Databases. Cham: Springer International Publishing. 2021. p. 124-40. doi: 10.1007/978-3-030-67664-3_8.
- González-Estrada E, Villaseñor JA, Acosta-Pech R. Shapiro-Wilk test for multivariate skew-normality. Comput Stat 2022; 37:1985-2001. doi: 10.1007/s00180-021-01188-y [Crossref] [ Google Scholar]
- Venkatesan B, Nandhitha S, Rajkumar R, Rithanya S, Muthukumarasamy M. Investigation and validation of non-invasive blood glucose measurement. In: 2023 International Conference on Recent Advances in Science and Engineering Technology (ICRASET). IEEE. 2023. p. 1-4. doi: 10.1109/icraset59632.2023.10420263.
- Satter S, Kwon TH, Kim KD. Non-invasive blood glucose estimation based on machine learning algorithms using PPG signals. In: 2024 International Conference on Artificial Intelligence in Information and Communication (ICAIIC). Osaka, Japan: IEEE. 2024. p. 622-5. doi: 10.1109/icaiic60209.2024.10463200.
- Alonso-Silverio GA, Francisco-García V, Guzmán-Guzmán IP, Ventura-Molina E, Alarcón-Paredes A. Toward non-invasive estimation of blood glucose concentration: a comparative performance. Mathematics 2021; 9:2529. doi: 10.3390/math9202529 [Crossref] [ Google Scholar]