Bioimpacts. 2025;15:30821.
doi: 10.34172/bi.30821
Original Article
Chloroquine inhibits salinomycin-induced autophagy for collaborative anticancer effect in breast cancer
Xiaoting Yang Conceptualization, Formal analysis, Investigation, Project administration, Writing – original draft, 
Zhan Jin Data curation, Formal analysis, Investigation, Validation,
Gao Chen Formal analysis, Investigation, Methodology, Visualization,
Gaobo Hu Conceptualization, Methodology, Project administration, Supervision, Writing – review & editing, , *
Author information:
School of Medicine, Quzhou College of Technology, Kecheng District, Quzhou City 324000, Zhejiang Province, China
Abstract
Introduction:
Breast cancer (BC) presents significant morbidity and mortality challenges. Autophagy plays a contradictory role in BC. The chemotherapeutic agent salinomycin exhibits anticancer effects, but its effectiveness is limited by over-activation of autophagy. This study aimed to investigate the effects and mechanisms of salinomycin and its combination with chloroquine in BC.
Methods:
The MCF-7 and MCF-7 tumor spheroids (MCF-7-TS) BC models were treated separately with salinomycin and autophagy inducer/inhibitor (rapamycin/chloroquine). Cell proliferation, apoptosis, and cell cycle progression were measured using cell counting kit-8 (CCK-8), cell colony assay, and flow cytometry. The expression of apoptosis-related, autophagy-related, and phosphoinositide 3-kinases (PI3K)/protein kinase B (AKT)/mammalian target of rapamycin (mTOR) pathway-related proteins was measured via Western blot. Light chain 3 (LC3) expression was detected via immunofluorescence.
Results:
In the MCF-7 and MCF-7-TS cells, salinomycin inhibited cell viability, p-PI3K/PI3K, p-AKT/AKT, and p-mTOR/mTOR expression, and increased apoptosis and LC3 expression, with reduced tumor spheroid number and volume of MCF-7-TS cells. Interestingly, rapamycin enhanced LC3 expression but prevented apoptosis in salinomycin-treated cells, with elevated tumor spheroid number and volume of MCF-7-TS cells. Moreover, after screening for a suitable ratio of salinomycin and chloroquine (1:2.5), compared to salinomycin group, salinomycin+chloroquine group exhibited decreased tumor spheroid number and volume of MCF-7-TS cells; reduced B-cell lymphoma-2 (Bcl-2), LC3, LC3II/LC3I, and Beclin-1 expression; and enhanced G0/G1 phase arrest and Bcl-2-associated X protein expression in MCF-7 and MCF-7-TS cells.
Conclusion:
Chloroquine enhanced the anticancer efficacy of salinomycin by suppressing salinomycin-induced autophagy, providing a solid theoretical basis for its clinical application in BC.
Keywords: Breast cancer, Salinomycin, Chloroquine, Autophagy, PI3K/AKT/mTOR signaling pathway
Copyright and License Information
© 2025 The Author(s).
This work is published by BioImpacts as an open access article distributed under the terms of the Creative Commons Attribution Non-Commercial License (
http://creativecommons.org/licenses/by-nc/4.0/). Non-commercial uses of the work are permitted, provided the original work is properly cited.
Funding Statement
Not Applicable.
Introduction
Breast cancer (BC) is the most prevalent cancer among women worldwide, accounting for nearly one in four cancer diagnoses and one in six cancer-related deaths.1,2 This heterogeneous disease arises from the interplay of various environmental factors, hormonal influences, and genetic mutations.3 Current clinical treatments, including chemotherapy, radiation therapy, and immunotherapy, often fail to effectively target BC stem cells (BCSCs).4 Consequently, there is a growing emphasis on developing new therapies that specifically address the signaling pathways implicated in the onset, progression, and metastasis of BC.5
Autophagy is a crucial catabolic process in cancer biology, presenting both antitumor and protumor effects that vary by tumor type and stage.6,7 In early carcinogenesis, it aids in preventing genomic instability by degrading damaged cellular components.8 Conversely, as tumors progress, autophagy can enhance stress tolerance, drug resistance, and survival of tumor cells in adverse conditions.9 In triple-negative BC, annexin A2 knockdown causes increased sensitivity to adriamycin and overcomes adriamycin resistance by inhibiting autophagy.10 Yang et al demonstrated that the Aiduqing formula suppressed the growth and metastasis of BC by downregulating autophagy.11 Moreover, the phosphoinositide 3-kinases (PI3K)/protein kinase B (AKT)/mammalian target of rapamycin (mTOR) signaling pathway is crucial for cellular processes such as metabolism and proliferation and has been implicated in tumor growth.12 Autophagy in cancer cells can be inhibited by activating the PI3K/AKT pathway via mTOR activation.13 Sodium cantharidate was found to induce autophagy by inhibiting the PI3K/AKT/mTOR signaling pathway.14 Notably, the ethanol extract of Brucea javanica seed showed anti-triple-negative BC effects by reducing autophagy via the activated PI3K/AKT/mTOR pathway.15 Thus, excessive autophagy is not beneficial for anticancer effects.
Salinomycin is a potent, broad-spectrum antibiotic known for its low resistance and residue levels.16 Evidence suggests that salinomycin is a potential therapeutic medication for BC.17 Moreover, salinomycin and vitamin D3 reportedly exhibit synergistic effects in MCF-7 cells (BC cell line) and mammospheres, inducing G1 cell cycle arrest and multiple cell death pathways, thereby inhibiting the proliferation of BC cells.18 In addition, combination therapy with salinomycin and budesonide has been shown to activate autophagy by inhibiting the AKT/mTOR pathway, offering potential benefits for BC treatment.19 However, high expression of autophagy-related gene 3 (ATG3) promotes autophagy in BC, leading to tumor drug resistance and inhibiting salinomycin-induced apoptosis.20 Additionally, combination therapies, particularly with autophagy inhibitors, have shown promise in enhancing the therapeutic efficacy of chemotherapeutic agents, addressing issues of drug resistance in tumors.21 Therefore, over-activation of autophagy may be involved in promoting BC drug resistance.
Chloroquine, a widely used clinical autophagy inhibitor,22 has demonstrated an anti-estrogen receptor-positive BC effect by inhibiting autophagy.23 Notably, chloroquine overcomes the resistance of triple-negative BC cells to PI3K/AKT inhibitors by inhibiting autophagy and, while enhancing the anticancer effects of paclitaxel.24 Therefore, exploring whether the combination of salinomycin and chloroquine has a synergistic antitumor effect in BC is crucial.
In this study, we used MCF-7 and MCF-7 tumor spheroids (MCF-7-TS) cells as research objects to explore the effect of tumor cell autophagy on the antitumor activity of salinomycin. Additionally, we explored the potential synergistic antitumor effects of the combination of salinomycin and chloroquine in BC, providing a strong theoretical basis for the clinical application of this therapeutic strategy in BC and offering new insights for BC treatment.
Materials and Methods
Cell lines and culture
Human BC cell line MCF-7 was purchased from Shanghai Sebacom Biotechnology Co. (China, Shanghai, iCell, iCell-h129). The cells were cultured in the high-glucose Dulbecco's modified Eagle medium (DMEM, USA, Logan, Utah, Hyclone, SH30243.01) containing 10% fetal bovine serum (China, Zhejiang, Hangzhou, Tianhang, 11011-8615) and 0.1% penicillin/streptomycin (China, Zhejiang, Hangzhou, Genomcell, GNM15140-1) in a CO2 incubator.
MCF-7 cells were cultured in suspension as MCF-7-TS to obtain MCF-7 stem cells, as previously described.25 In brief, MCF-7 cells were plated at 5 × 10⁴ cells/mL in BCSCs conditioned culture medium which consisted of DMEM-F12 supplemented with 2% B27 (USA, New York, Grand Island, GIBCO, 17504-044), 20 ng/mL basic fibroblast growth factor (bFGF, USA, New York, Grand Island, GIBCO, PHG0367), 20 ng/mL epidermal growth factor (EGF, USA, New York, Grand Island, GIBCO, PHG0314), and 1% insulin-transferrin-selenium (ITS, USA, California, Carlsbad, Invitrogen, 41400-045). Spheroplasts were observed under a microscope every other day and supplemented with serum-free medium after 3 days. After 7 days of cultivation, well-grown MCF-7-TS cells forming large cell spheres were aspirated through a 40 μm sterile cell filter. The cells that adhered to the filter were washed with serum-free medium, digested and centrifuged. The resulting cell pellets were resuspended and passaged in a 37 ℃, 5% CO2 incubator. Generally, after the third generation, MCF-7-TS cells with spherical structure and stem cell properties were obtained. The morphology of MCF-7 and MCF-7-TS cells was examined via light microscopy (China, Zhejiang, Yuyao, Shunyu, SOPTOP ICX41). Moreover, the maximum vertical diameter (Dmax) and the minimum vertical diameter (Dmin) of the tumor spheroids were measured using Image J software, and the volume of the tumor spheroids was calculated according to the formula V = (4/3) × π ((Dmax + Dmin)/2)3. The tumor spheroids were counted under an inverted microscope (Japan, Tokyo, Nikon, Ts2-FC).
Hematoxylin-eosin (HE) staining
An HE Staining Kit (China, Beijing, Solarbio, G1120) was used to stain MCF-7 and MCF-7-TS cells and count the tumor spheroids. In brief, MCF-7 and MCF-7-TS cells were collected at the logarithmic growth phase, and the density was adjusted to 1.5 × 10⁵ cells/mL, followed by inoculation in 6-well plates (1.5 × 10⁵ cells/well). The cells were collected and fixed in 4% paraformaldehyde for 1 h. After the cells were washed with distilled water three times, the hematoxylin staining solution was added for 15 min, and then the eosin staining solution was added for 1 min. Observations were made under an inverted microscope and the number of tumor spheroids was counted.
Cell counting kit-8 (CCK-8) assay
The CCK-8 assay was performed to measure cell viability. The MCF-7 and MCF-7-TS cells in logarithmic growth phase were seeded into 96-well plate. Then, the cells were treated with different concentrations of either salinomycin (0.12, 0.37, 1.1, 3.3, 9.9, 29.6, 88.9, and 266.7 μM, USA, New Jersey, HY-15597) or chloroquine (0.3, 0.9, 2.7, 8.2, 24.7, 74.1, 222.2, and 666.7 μM, USA, New Jersey, HY-17589A) alone for 24 h. Subsequently, 10 μL of CCK-8 solution (USA, New Jersey, MCE, HY-K0301) was added to each well. The absorbance (A) value at 450 nm was measured using an enzyme marker (USA, Sunnyvale, MD, CMaxPlus) to calculate cell viability as follows:
Cell viability = (1-(Atreated - Ablank control)/(Acontrol group - Ablank control)) × 100%. Five replicate wells were analyzed in parallel for each cell group.
Cell grouping
The MCF-7 and MCF-7-TS cells were randomly divided into four groups as follows: Control group, salinomycin 7.5 μM group, salinomycin 15 μM group, and salinomycin 15 μM + Rapamycin (mTOR inhibitor and autophagy agonist, USA, New Jersey, MCE, HY-10219) group. Salinomycin concentration was measured using the CCK-8 assay. The cells in the salinomycin 15 μM + Rapamycin group were treated with 15 μM of salinomycin and 200 nM of Rapamycin for 48 h.26
Screening for synergistic ratios of salinomycin and chloroquine
To investigate the combined effects of salinomycin and chloroquine, various molecular ratios of these two agents were evaluated (10:1, 5:1, 2.5:1, 1:1, 1:2.5, 1:5, and 1:10). Cells in the logarithmic growth phase were seeded into 96-well plates (2 × 10³ cells/well) and allowed to grow for 24 h. After this period, each group was dosed according to the above ratios, with three replicate wells per group. After the original medium had been replaced by a fresh one after 72 h of growth, 100 μL of the new medium and 10 μL of CCK-8 reagent were added to each well. Cell viability was determined as described above. Fraction affected (Fa) was equal to 1-cell viability.
CompuSyn Version 1.0 software (USA, NJ, Paramus, Combosyn Inc.) was used to fit the Fa-Combination Index (Fa-CI) curves.27 A CI < 0.9 indicated that the two drugs were synergistic, 0.9 < CI < 1.1 indicated that they were additive and CI > 1.1 indicated that they were antagonistic.28 The common synergistic ratio of salinomycin to chloroquine in MCF-7 and MCF-7-TS cells was screened based on CI values.
Cell colony assay
Cell proliferation ability was assessed using the cell colony assay. MCF-7 and MCF-7-TS cells in the logarithmic growth phase were trypsinized and inoculated into 6-well plates (1.5 × 10⁵ cells/well). Initially, 1 mL of 4% paraformaldehyde (China, Shanghai, Maklin, 30525-89-4) was added to each well, and the cells were then kept in a refrigerator at 4 ℃. After fixation, the cells were washed with phosphate-buffered saline (PBS, USA, Logan, Utah, Hyclone, SH30256.01). Subsequently, 1000 μL of crystal violet staining (China, Shanghai,QiangshunChemical Reagents Co., Ltd., 548-62-9) was added to each well. Images were captured using a digital camera, and the number of purple colonies in each well was counted using Image J software.
Flow cytometry
Apoptosis and cell cycle were detected via flow cytometry using an Apoptosis Kit (USA, New Jersey, BD, 556547) and a Cell Cycle Kit (BD, 550825), respectively. MCF-7 and MCF-7-TS cells were grown in 6-well plates (1.5 × 10⁵ cells/well) for 24 h. The cells were washed with pre-cooled PBS, followed by the addition of 500 μL of binding buffer, 5 μL of Annexin V-FITC, and 10 μL of propidium iodide (PI). After mixing and incubating at room temperature. 400 μL of binding buffer was added and the apoptosis rate was measured via flow cytometry (USA, California, Agilent, NovoCyte). For cell cycle detection, cells were stained with PI staining solution, followed by flow cytometric analysis. The experiment was repeated three times.
Western blot
Western blot was used to detect the PI3K/AKT/mTOR pathway-associated, apoptosis-associated, and autophagy-associated protein expression. MCF-7 and MCF-7-TS cells were lysed using radio Immunoprecipitation assay lysis solution (China, Shanghai, Beytome, P0013D) and the total protein concentration was measured using a bicinchoninic acid (BCA) kit (China, Beijing, Solarbio, pc0020). After sodium dodecyl sulfate polyacrylamide gel electrophoresis, the proteins were transferred to polyvinylidene fluoride (PVDF) membranes, sealed with 5% skimmed milk powder, and washed with Tris-buffered saline containing Tween-20 (TBST). The membranes were then placed in incubation cassettes containing primary antibodies against p-PI3K (Australia, Melbourne, Affinity, AF3242), PI3K (Affinity, AF6241), p-AKT (Affinity, AF3262), AKT (Affinity, AF6259), p-mTOR (Affinity, AF3310), mTOR (Affinity, DF6308), B-cell lymphoma-2 (Bcl-2, Affinity, AF6139), Bcl-2-associated X protein (Bax, England, Cambridge, Abcam, ab182733), light chain 3 (LC3, USA, Boston, CST, 4108s), and β-actin (USA, Chicago, Proteintech, 81115-1-RR), and incubated overnight at 4°C. Membrane were then rinsed and incubated with horseradish peroxidase-conjugated secondary antibodies. Protein bands were detected via electrochemiluminescence, and the protein gray value was calculated using Image J software.
Immunofluorescence
LC3 expression in MCF-7 and MCF-7-TS cells was determined using immunofluorescence. MCF-7 and MCF-7-TS cells were seeded on a culture dish containing a clean coverslip and allowed to adhere to it. Cells were fixed with 4% paraformaldehyde and permeabilized with 0.1% TritonX-100. After washing with PBS, cells were blocked with 5% bovine serum albumin, followed by the addition of the primary antibody against LC3 (England, Cambridge, Abcam, ab192890) and incubation at 4°C overnight. The next day, the samples were rewarmed to room temperature, washed with PBS, and incubated with the secondary antibody goat-anti-rabbit IgG H&L (Alexa FLIOR488) (Abcam, ab150077) at room temperature for 1 h. After washing with PBS, cell nuclei were stained with 4',6-Diamidino-2'-phenylindole and the slides were sealed. The slides were examined, and images were captured using an inverted microscope. The mean fluorescence intensity of each sample was measured using Image J software as a semi-quantitative analysis indicator. Three different fields of view were observed, and the average values were calculated.
Statistical analysis
Data were analyzed using SPSS 21.0, and graphs were prepared using GraphPad Prism 9.0. Measures between groups followed a normal distribution, and chi-square tests, and one-way analysis of variance were performed. Further two-by-two comparisons between groups were performed using Tukey’s test. All data are expressed as mean ± standard deviation (mean ± SD). P < 0.05 indicated statistically significant differences.
Results
Cell morphology and effect of salinomycin on cell viability of MCF-7 and MCF-7-TS cells
The morphology of MCF-7 and MCF-7-TS cells was examined using the light microscopy (Fig. 1A). MCF-7 cells were adherent and epithelial-like cells. In contrast, MCF-7-TS tumor spheroids were spherically agglomerated, with relatively smaller cells and rounded morphology. According to the results of HE staining, the number of tumor spheroids in the MCF-7-TS group was significantly higher than that in the MCF-7 group (MCF-7-TS group: 61.00 ± 5.57, P < 0.01; Fig. 1B).
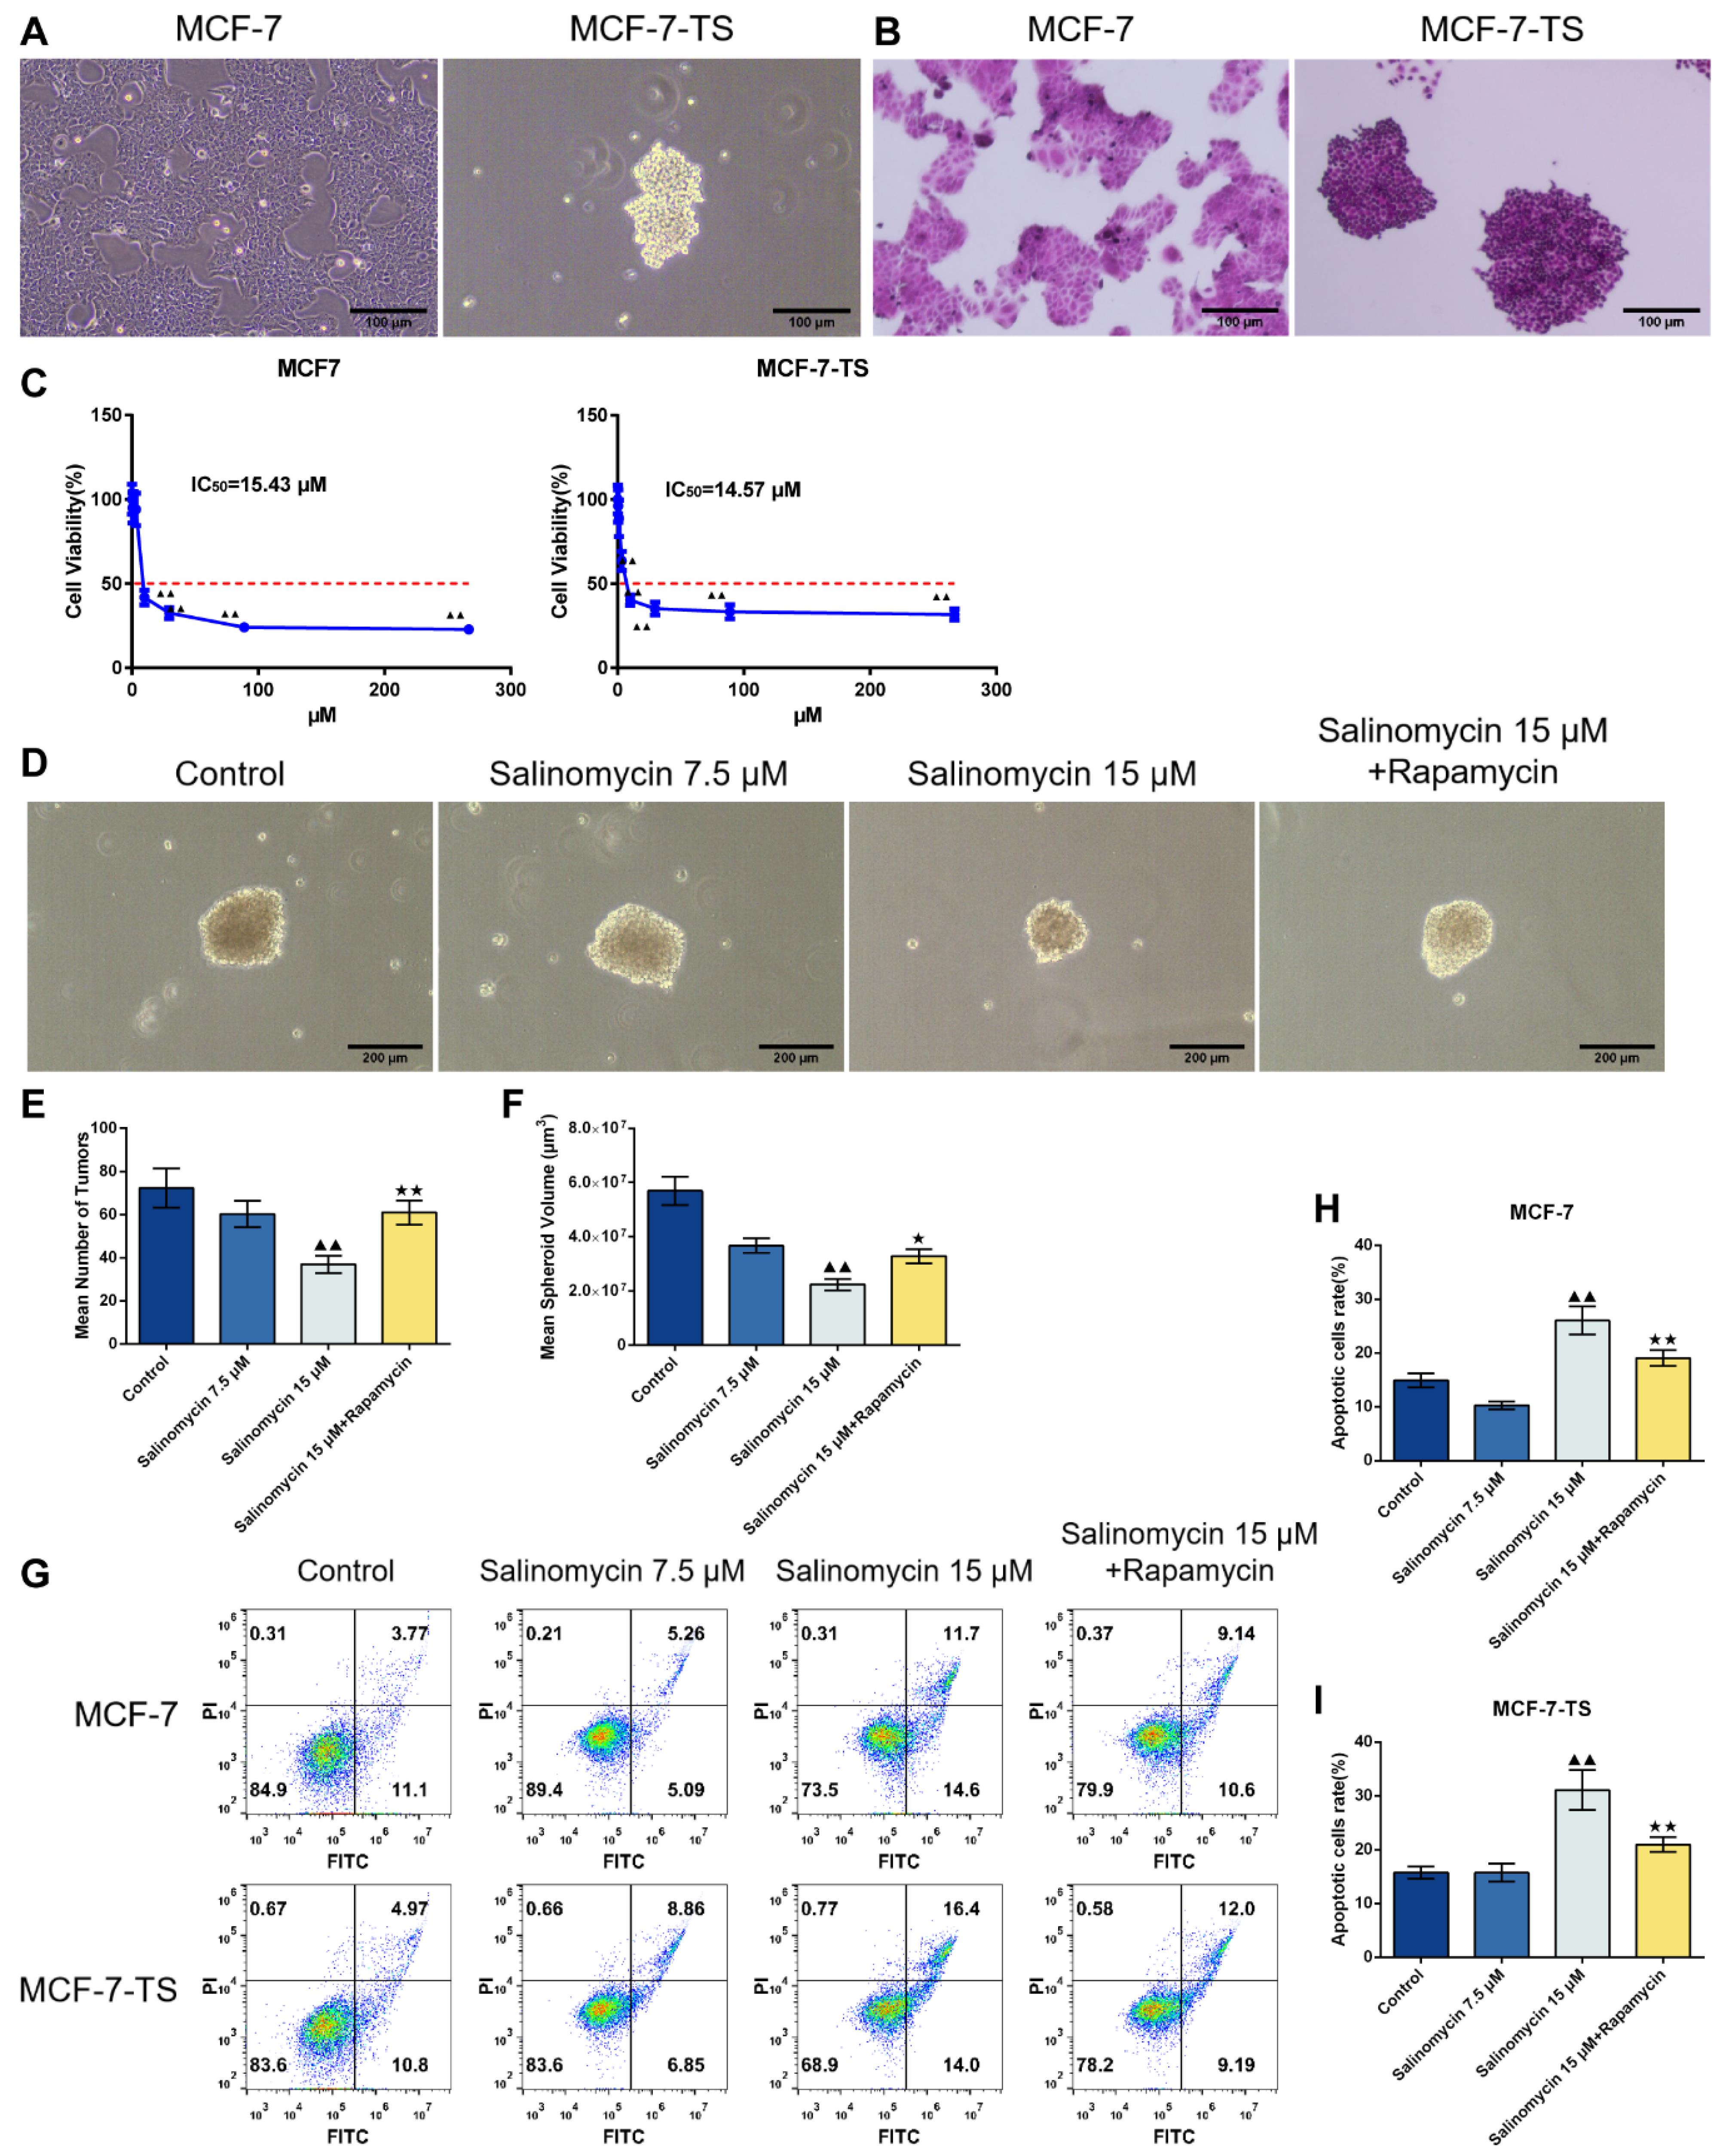
Fig. 1.
Effect of salinomycin on apoptosis in MCF-7 and MCF-7-TS cells.(A) Cell morphology of MCF-7 and MCF-7-TS cells was assessed using the light microscopy (200 × , 100 μm); (B) HE staining was performed in MCF-7 and MCF-7-TS cells (200 × , 100 μm); (C) The CCK-8 assay was used to detect the dose-dependent cytotoxicity of salinomycin in MCF-7 and MCF-7-TS cells. Data are expressed as mean ± SD, n = 3. Compared with the 0.12 μM salinomycin group, ▲▲P < 0.01; (D-F) The tumor spheroid number and volume changes in MCF-7-TS cells in each group were examined using an inverted fluorescence microscope (100 × , 200 μm); MCF-7 and MCF-7-TS cells were treated with 7.5 μM and 15 μM of salinomycin and 200 nM of rapamycin for 48 h; (G-I) Flow cytometry was used to detect apoptosis in MCF-7 and MCF-7-TS cells. Data are expressed as mean ± SD, n = 3. Compared with the control group, ▲▲P < 0.01; Compared with the salinomycin 15 μM group, *P < 0.05, **P < 0.01. Note: MCF-7-TS: MCF-7 tumor spheroids; CCK-8: Cell Counting Kit-8; HE: hematoxylin-eosin.
.
Effect of salinomycin on apoptosis in MCF-7 and MCF-7-TS cells.(A) Cell morphology of MCF-7 and MCF-7-TS cells was assessed using the light microscopy (200 × , 100 μm); (B) HE staining was performed in MCF-7 and MCF-7-TS cells (200 × , 100 μm); (C) The CCK-8 assay was used to detect the dose-dependent cytotoxicity of salinomycin in MCF-7 and MCF-7-TS cells. Data are expressed as mean ± SD, n = 3. Compared with the 0.12 μM salinomycin group, ▲▲P < 0.01; (D-F) The tumor spheroid number and volume changes in MCF-7-TS cells in each group were examined using an inverted fluorescence microscope (100 × , 200 μm); MCF-7 and MCF-7-TS cells were treated with 7.5 μM and 15 μM of salinomycin and 200 nM of rapamycin for 48 h; (G-I) Flow cytometry was used to detect apoptosis in MCF-7 and MCF-7-TS cells. Data are expressed as mean ± SD, n = 3. Compared with the control group, ▲▲P < 0.01; Compared with the salinomycin 15 μM group, *P < 0.05, **P < 0.01. Note: MCF-7-TS: MCF-7 tumor spheroids; CCK-8: Cell Counting Kit-8; HE: hematoxylin-eosin.
The results of the CCK-8 assay (Fig. 1C) demonstrated that salinomycin significantly reduced the viability of MCF-7 and MCF-7-TS cells in a dose-dependent manner. Notably, the IC50 values for MCF-7 and MCF-7-TS cells were 15.43 μM and 14.57 μM, respectively, indicating a similar antitumor effect of salinomycin in MCF-7 and MCF-7-TS cells.
Effect of salinomycin on apoptosis in MCF-7 and MCF-7-TS cells
The tumor spheroid number and volume changes in MCF-7-TS cells in each group were examined using an inverted fluorescence microscope (Fig. 1D-F). Compared with those in the control group, the number and volume of MCF-7-TS cell tumor spheroids were significantly reduced in the salinomycin 15 μM group (P < 0.01). Further rapamycin treatment of MCF-7-TS cells treated with 15 μM of salinomycin led to an increase of the number and volume of MCF-7-TS cell tumor spheroids (P < 0.05 or P < 0.01).
As shown in Fig. 1G-I, the effect of salinomycin on apoptosis in MCF-7 and MCF-7-TS cells was evaluated using flow cytometry. Salinomycin significantly induced apoptosis in both MCF-7 and MCF-7-TS cells (P < 0.01). Furthermore, the application of the mTOR inhibitor, rapamycin, resulted in a substantial reduction in salinomycin-induced apoptosis (P < 0.01), suggesting a pivotal role of the mTOR pathway in mediating the pro-apoptotic effects of salinomycin.
Effect of salinomycin on autophagy in MCF-7 and MCF-7-TS cells
Measurement of LC3 fluorescent expression in MCF-7 and MCF-7-TS cells was conducted by Immunofluorescence assay (Fig. 2A-B). In comparison to the control group, 15 μM of salinomycin effectively induced autophagy in both MCF-7 and MCF-7-TS cells, with higher LC3 fluorescent expression (P < 0.01). Notably, co-treatment with salinomycin and rapamycin significantly enhanced LC3 fluorescence (P < 0.01), indicating a synergistic effect on autophagy induction.
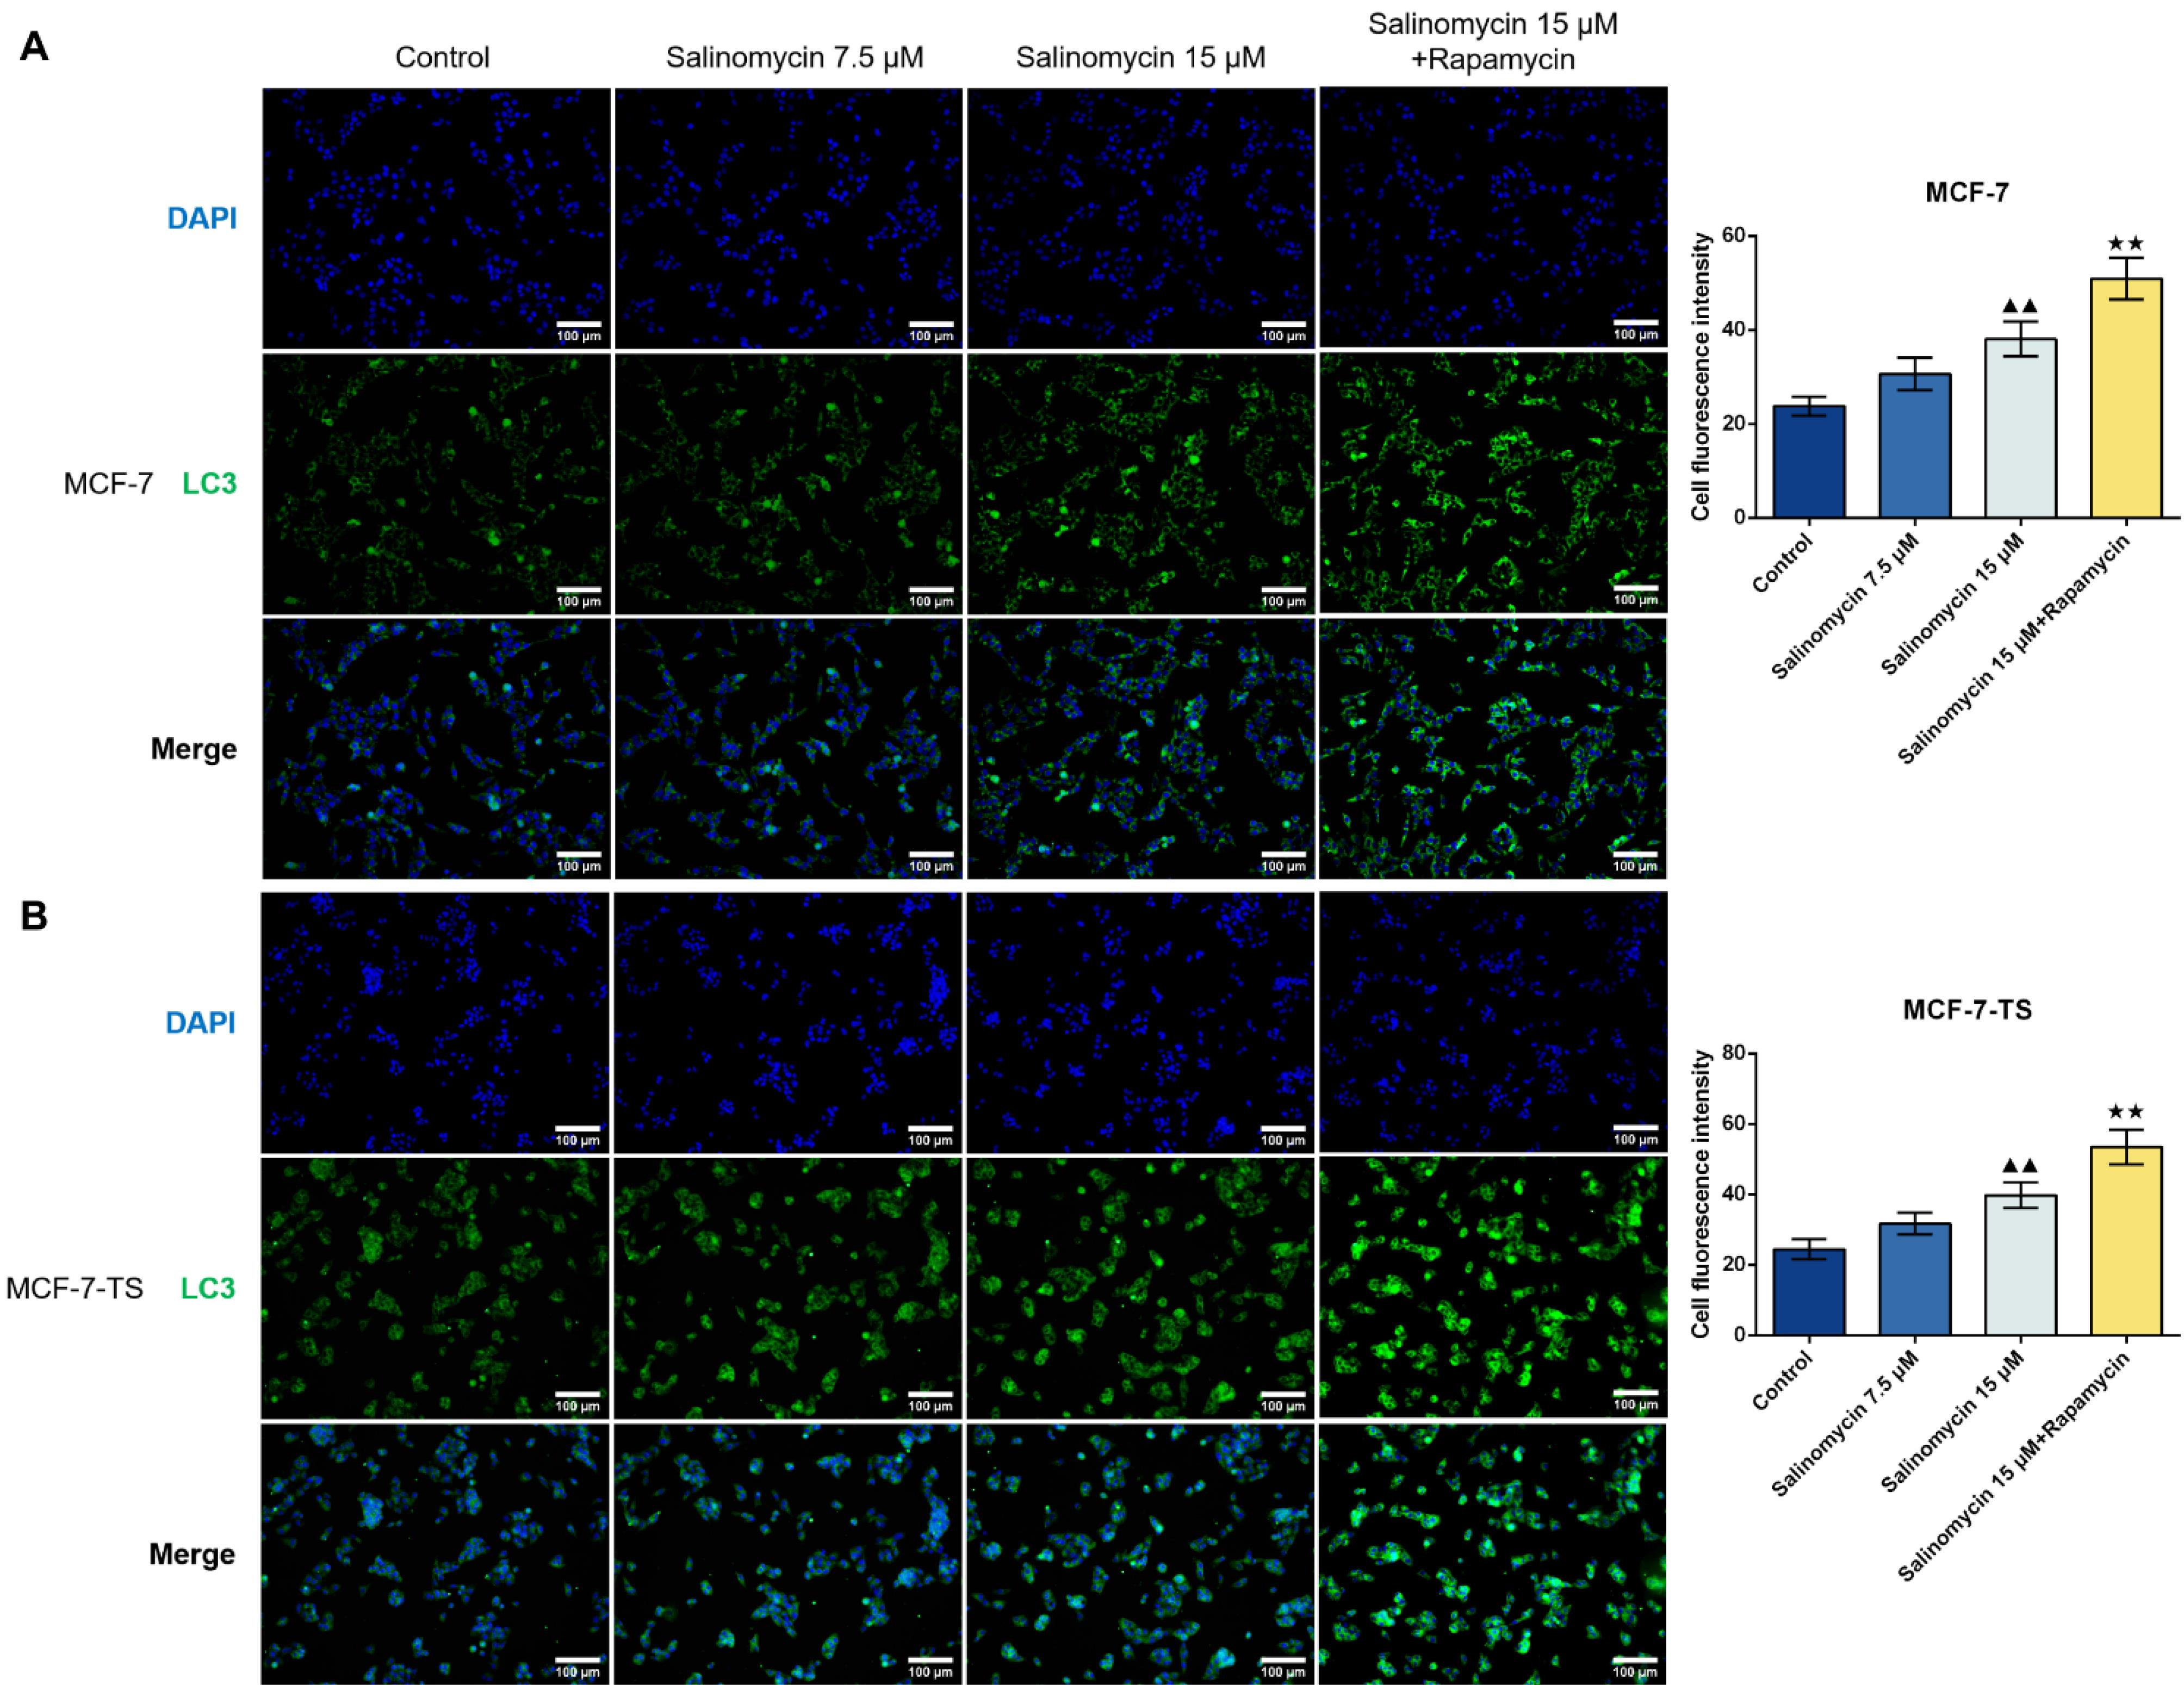
Fig. 2.
Effect of salinomycin on autophagy in MCF-7 and MCF-7-TS cells.(A) Measurement of LC3 expression in MCF-7 cells was conducted by immunofluorescence assay (200 × , 100 μm); (B) LC3 expression in MCF-7-TS cells was detected by immunofluorescence assay (200 × , 100 μm). Data are expressed as mean ± SD, n = 3. Compared with the control group, ▲▲P < 0.01; Compared with the salinomycin 15 μM group, ★★P < 0.01. Note: MCF-7-TS: MCF-7 tumor spheroids; LC3: light chain 3.
.
Effect of salinomycin on autophagy in MCF-7 and MCF-7-TS cells.(A) Measurement of LC3 expression in MCF-7 cells was conducted by immunofluorescence assay (200 × , 100 μm); (B) LC3 expression in MCF-7-TS cells was detected by immunofluorescence assay (200 × , 100 μm). Data are expressed as mean ± SD, n = 3. Compared with the control group, ▲▲P < 0.01; Compared with the salinomycin 15 μM group, ★★P < 0.01. Note: MCF-7-TS: MCF-7 tumor spheroids; LC3: light chain 3.
Effect of salinomycin on the PI3K/AKT/mTOR signaling pathway in MCF-7 and MCF-7-TS cells
Detection of PI3K/AKT/mTOR signaling pathway-related protein expression was done using Western blot assay (Fig. 3). In MCF-7 and MCF-7-TS cells, the salinomycin 15 μM group exhibited lower expression of p-PI3K/PI3K, p-AKT/AKT, and p-mTOR/mTOR than that of control group (P < 0.05). Further rapamycin treatment caused lower p-PI3K/PI3K expression compared with that in the MCF-7 and MCF-7-TS cells of the salinomycin 15 μM group (P < 0.01).
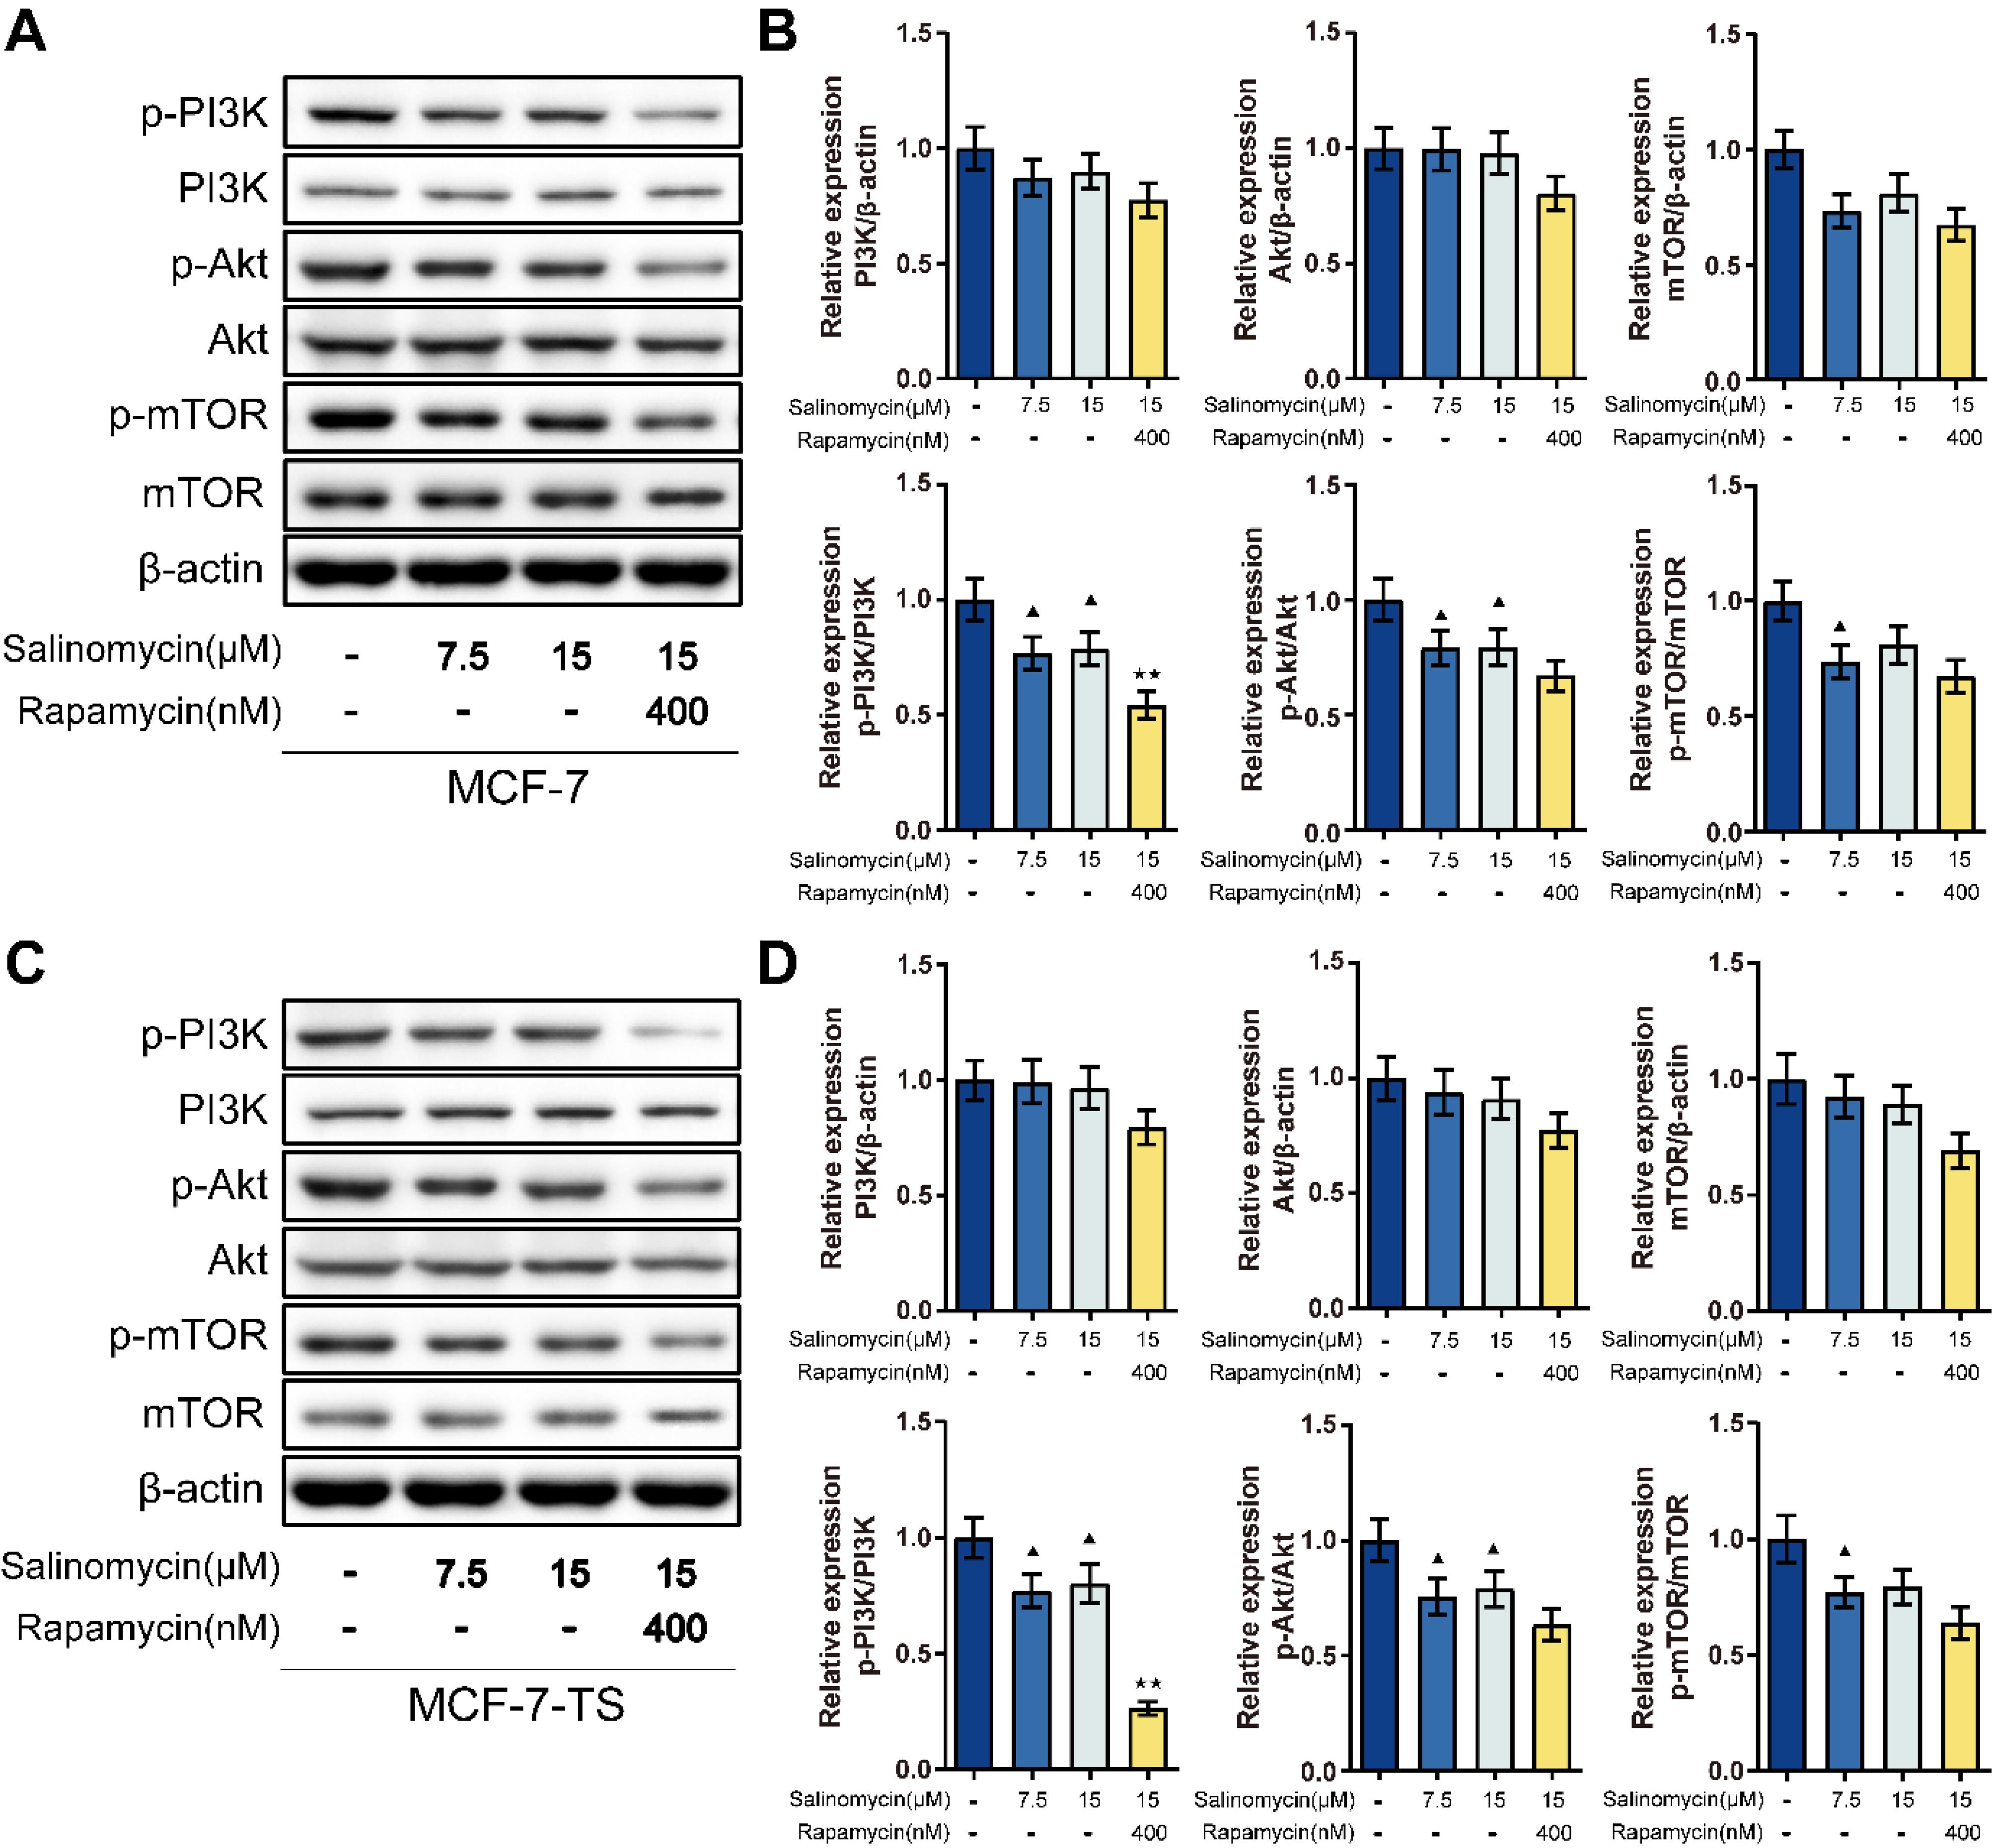
Fig. 3.
Effects of salinomycin on the PI3K/AKT/mTOR signaling pathway in MCF-7 and MCF-7-TS cells.(A-B) Detection of PI3K/AKT/mTOR signaling pathway-related protein expression in MCF-7 cells was done using Western blot assay; (B) Western blot assay was used to measure the PI3K/AKT/mTOR signaling pathway-related protein expression in MCF-7-TS cells. Data are expressed as mean ± SD, n = 3. Compared with the control group, ▲P < 0.05; Compared with the salinomycin 15 μM group, ★★P < 0.01. Note: MCF-7-TS: MCF-7 tumor spheroids; PI3K: phosphoinositide 3-kinases; AKT: protein kinase B; mTOR: mammalian target of rapamycin.
.
Effects of salinomycin on the PI3K/AKT/mTOR signaling pathway in MCF-7 and MCF-7-TS cells.(A-B) Detection of PI3K/AKT/mTOR signaling pathway-related protein expression in MCF-7 cells was done using Western blot assay; (B) Western blot assay was used to measure the PI3K/AKT/mTOR signaling pathway-related protein expression in MCF-7-TS cells. Data are expressed as mean ± SD, n = 3. Compared with the control group, ▲P < 0.05; Compared with the salinomycin 15 μM group, ★★P < 0.01. Note: MCF-7-TS: MCF-7 tumor spheroids; PI3K: phosphoinositide 3-kinases; AKT: protein kinase B; mTOR: mammalian target of rapamycin.
Synergistic ratio of salinomycin and chloroquine in MCF-7 and MCF-7-TS cells
The CCK-8 assay was performed to determine the effects of various concentrations of chloroquine on the inhibition of MCF-7 and MCF-7-TS proliferation and IC50 values. The IC50 values for MCF-7 and MCF-7-TS cells treated with chloroquine were 29.05 μM and 20.07 μM, respectively, suggesting a better antitumor effect of chloroquine on MCF-7-TS cells (Fig. 4A-B). Salinomycin and chloroquine showed a synergistic effect in MCF-7 cells at molar ratios of 1:2.5 and 1:10. When the molar ratio of salinomycin and chloroquine was between 10:1 and 1:5 in MCF-7-TS cells, the CI was less than 1, suggested a synergistic interaction. Importantly, when the ratio exceeded 1, the CI decreased as Fa increased (Fig. 4C-D).
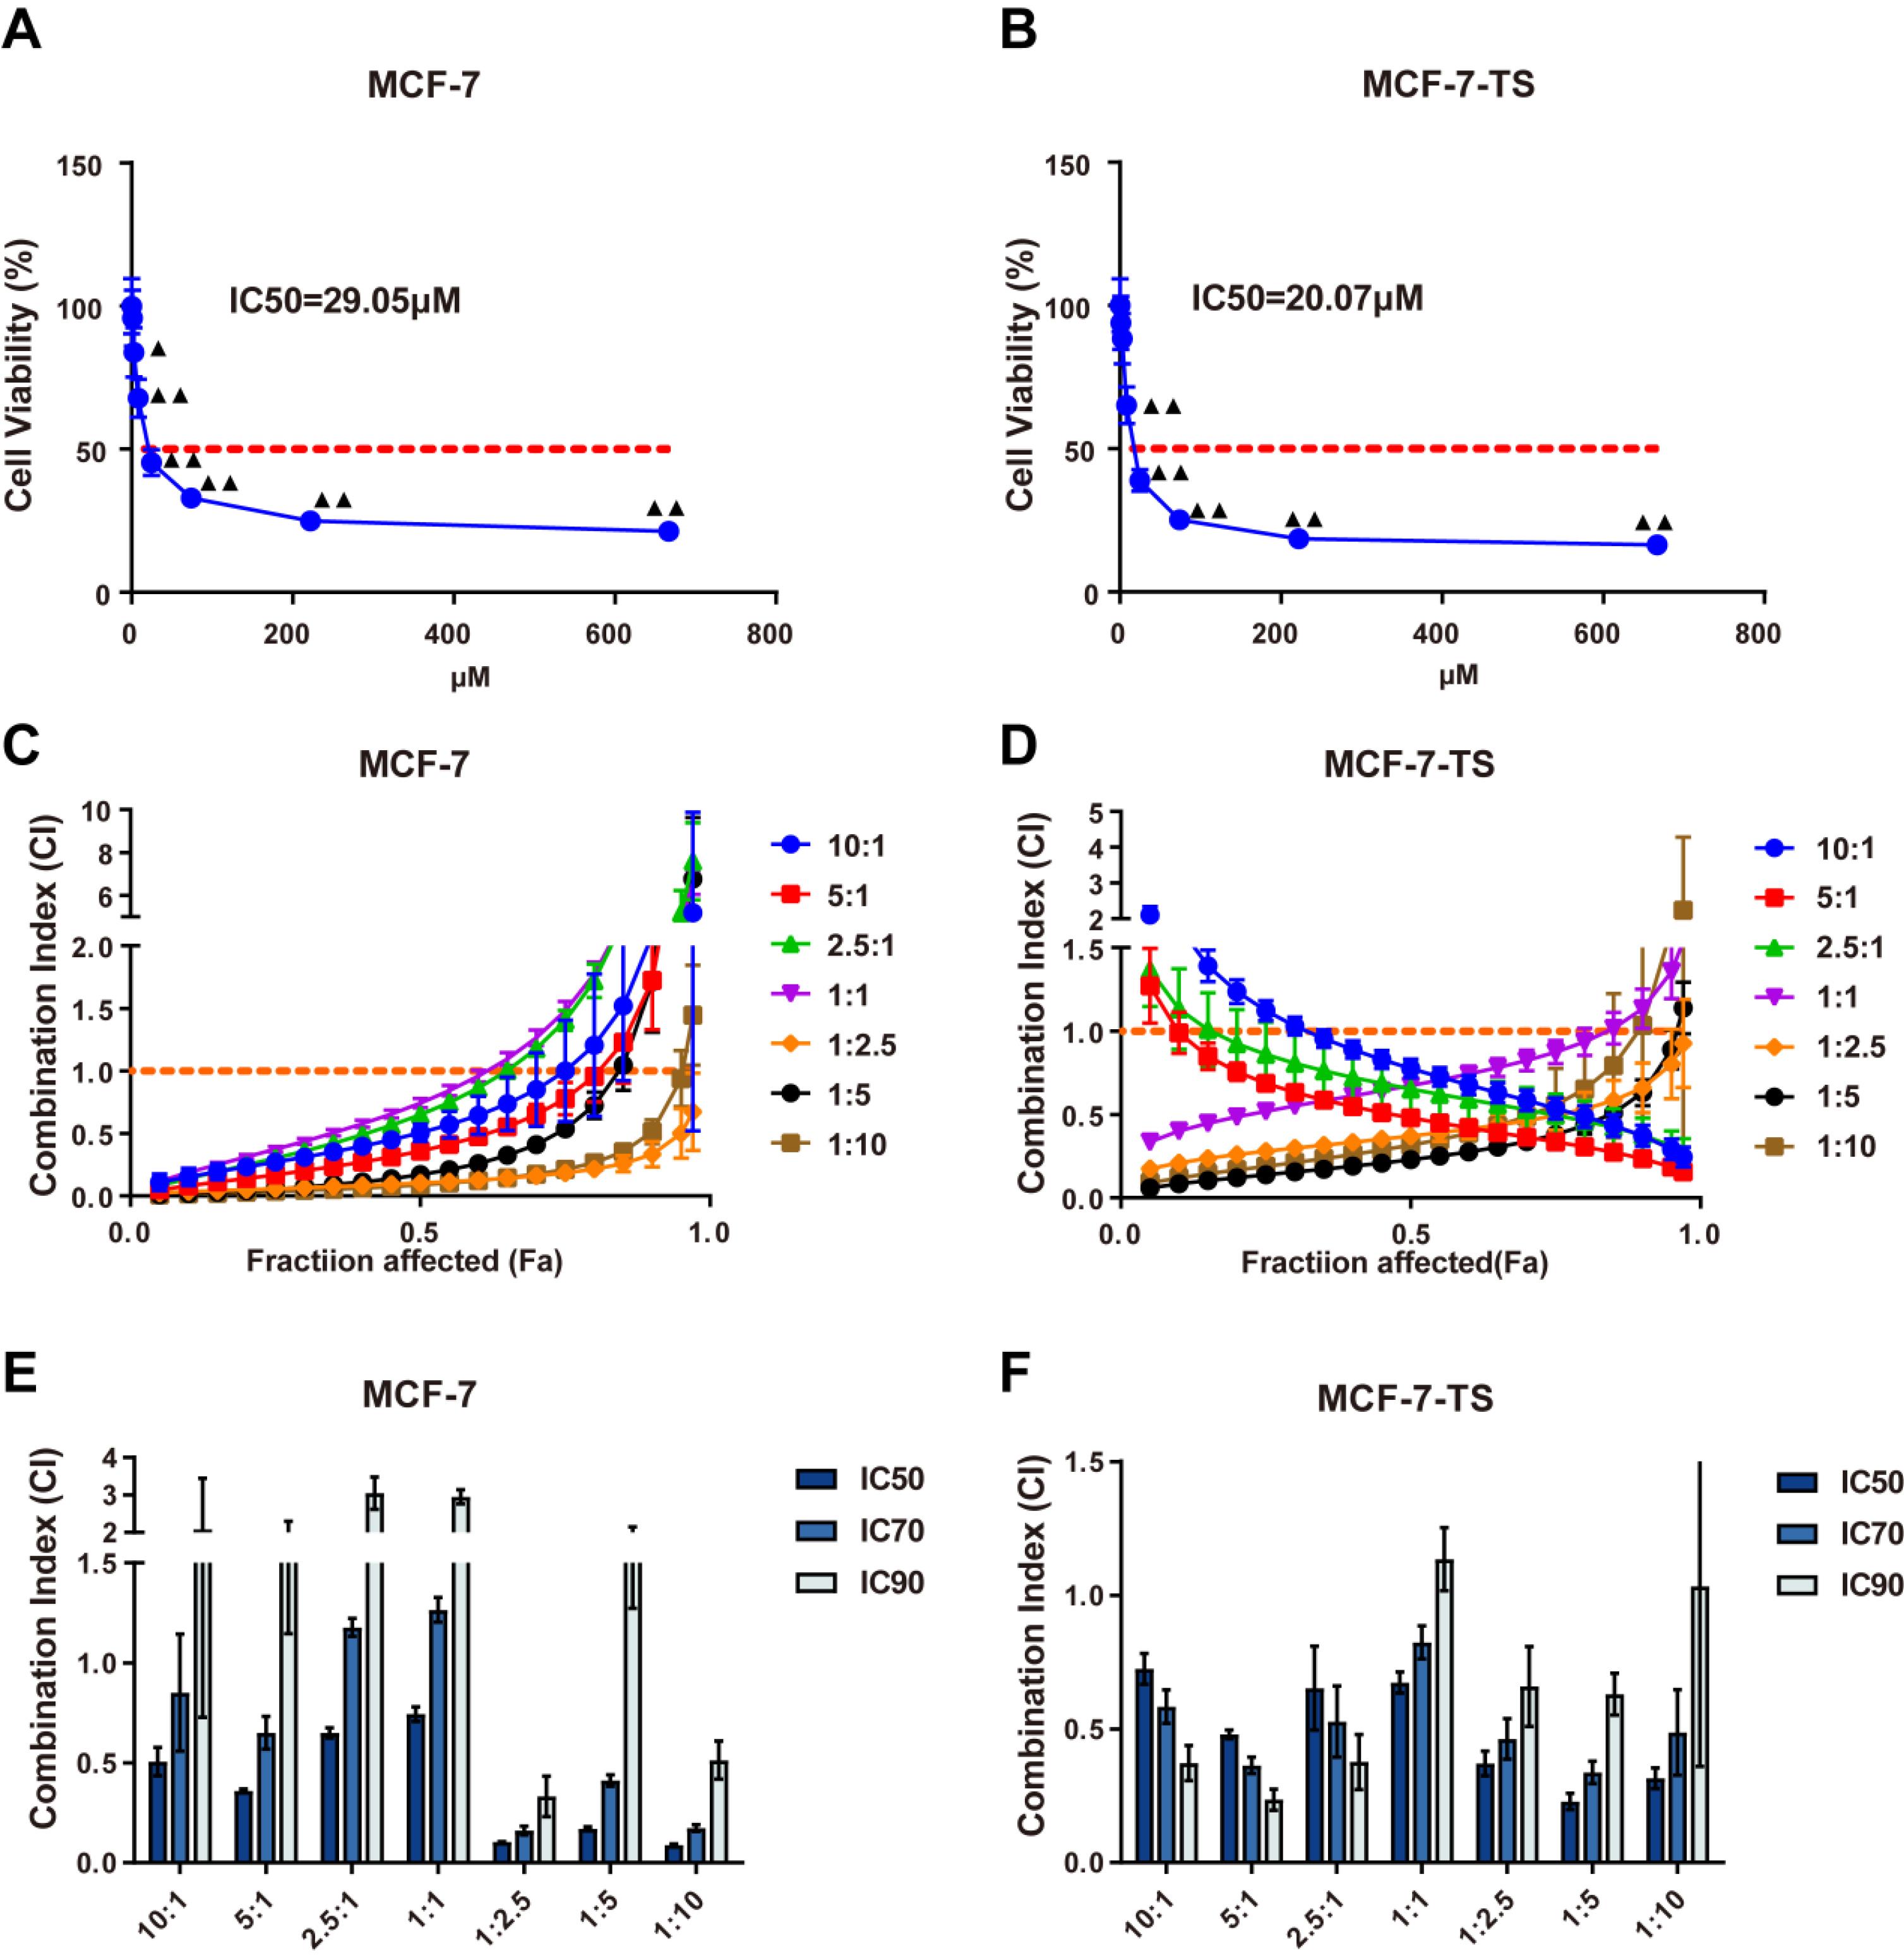
Fig. 4.
Synergistic ratio of salinomycin and chloroquine in MCF-7 and MCF-7-TS cells.(A-B) The CCK-8 assay was performed to measure the effects of various concentrations of chloroquine on the inhibition of MCF-7 and MCF-7-TS proliferation and IC50 values; Compared with the 0.3 μM chloroquine group, ▲P<0.05, ▲▲P<0.01. (C-D) The Fa-CI fitting curve of MCF-7 and MCF-7-TS cells; Fa = 1-cell viability. The Fa-CI fitting curve is a graphical representation used to evaluate the synergies of drug combinations; (E-F) The 50%, 70%, and 90% tumor growth inhibition of MCF-7 and MCF-7-TS cells. Data are expressed as mean ± SD, n = 3. Note: MCF-7-TS: MCF-7 tumor spheroids; Fa-CI: Fraction affected-Combination Index.
.
Synergistic ratio of salinomycin and chloroquine in MCF-7 and MCF-7-TS cells.(A-B) The CCK-8 assay was performed to measure the effects of various concentrations of chloroquine on the inhibition of MCF-7 and MCF-7-TS proliferation and IC50 values; Compared with the 0.3 μM chloroquine group, ▲P<0.05, ▲▲P<0.01. (C-D) The Fa-CI fitting curve of MCF-7 and MCF-7-TS cells; Fa = 1-cell viability. The Fa-CI fitting curve is a graphical representation used to evaluate the synergies of drug combinations; (E-F) The 50%, 70%, and 90% tumor growth inhibition of MCF-7 and MCF-7-TS cells. Data are expressed as mean ± SD, n = 3. Note: MCF-7-TS: MCF-7 tumor spheroids; Fa-CI: Fraction affected-Combination Index.
To identify the appropriate drug ratios for MCF-7 and MCF-7-TS cells, we evaluated the CI at IC50, IC70, and IC90 (Fig. 4E-F). To mitigate the potential adverse effects of the drugs, we selected a salinomycin-to-chloroquine molar ratio of 1:2.5 for our subsequent experiments. Based on the above results, MCF-7 and MCF-7-TS cells were divided into control, salinomycin (15 μM), chloroquine (37.5 μM), and salinomycin + chloroquine groups for follow-up experiments.
Effect of salinomycin and chloroquine on the proliferative capacity of MCF-7 and MCF-7-TS cells
The number of tumor spheroids and the volume of MCF-7-TS cells in the four groups were determined using an inverted fluorescence microscope (Fig. 5A). Both salinomycin and chloroquine treatment led to reduced tumor spheroid number and volume of MCF-7-TS cells in comparison to the control group (P < 0.05 or P < 0.01). When comparing to the salinomycin group or chloroquine group, the salinomycin + chloroquine group showed a decrease in the number and volume of tumor spheroids in MCF-7-TS cells (P < 0.05 or P < 0.01).
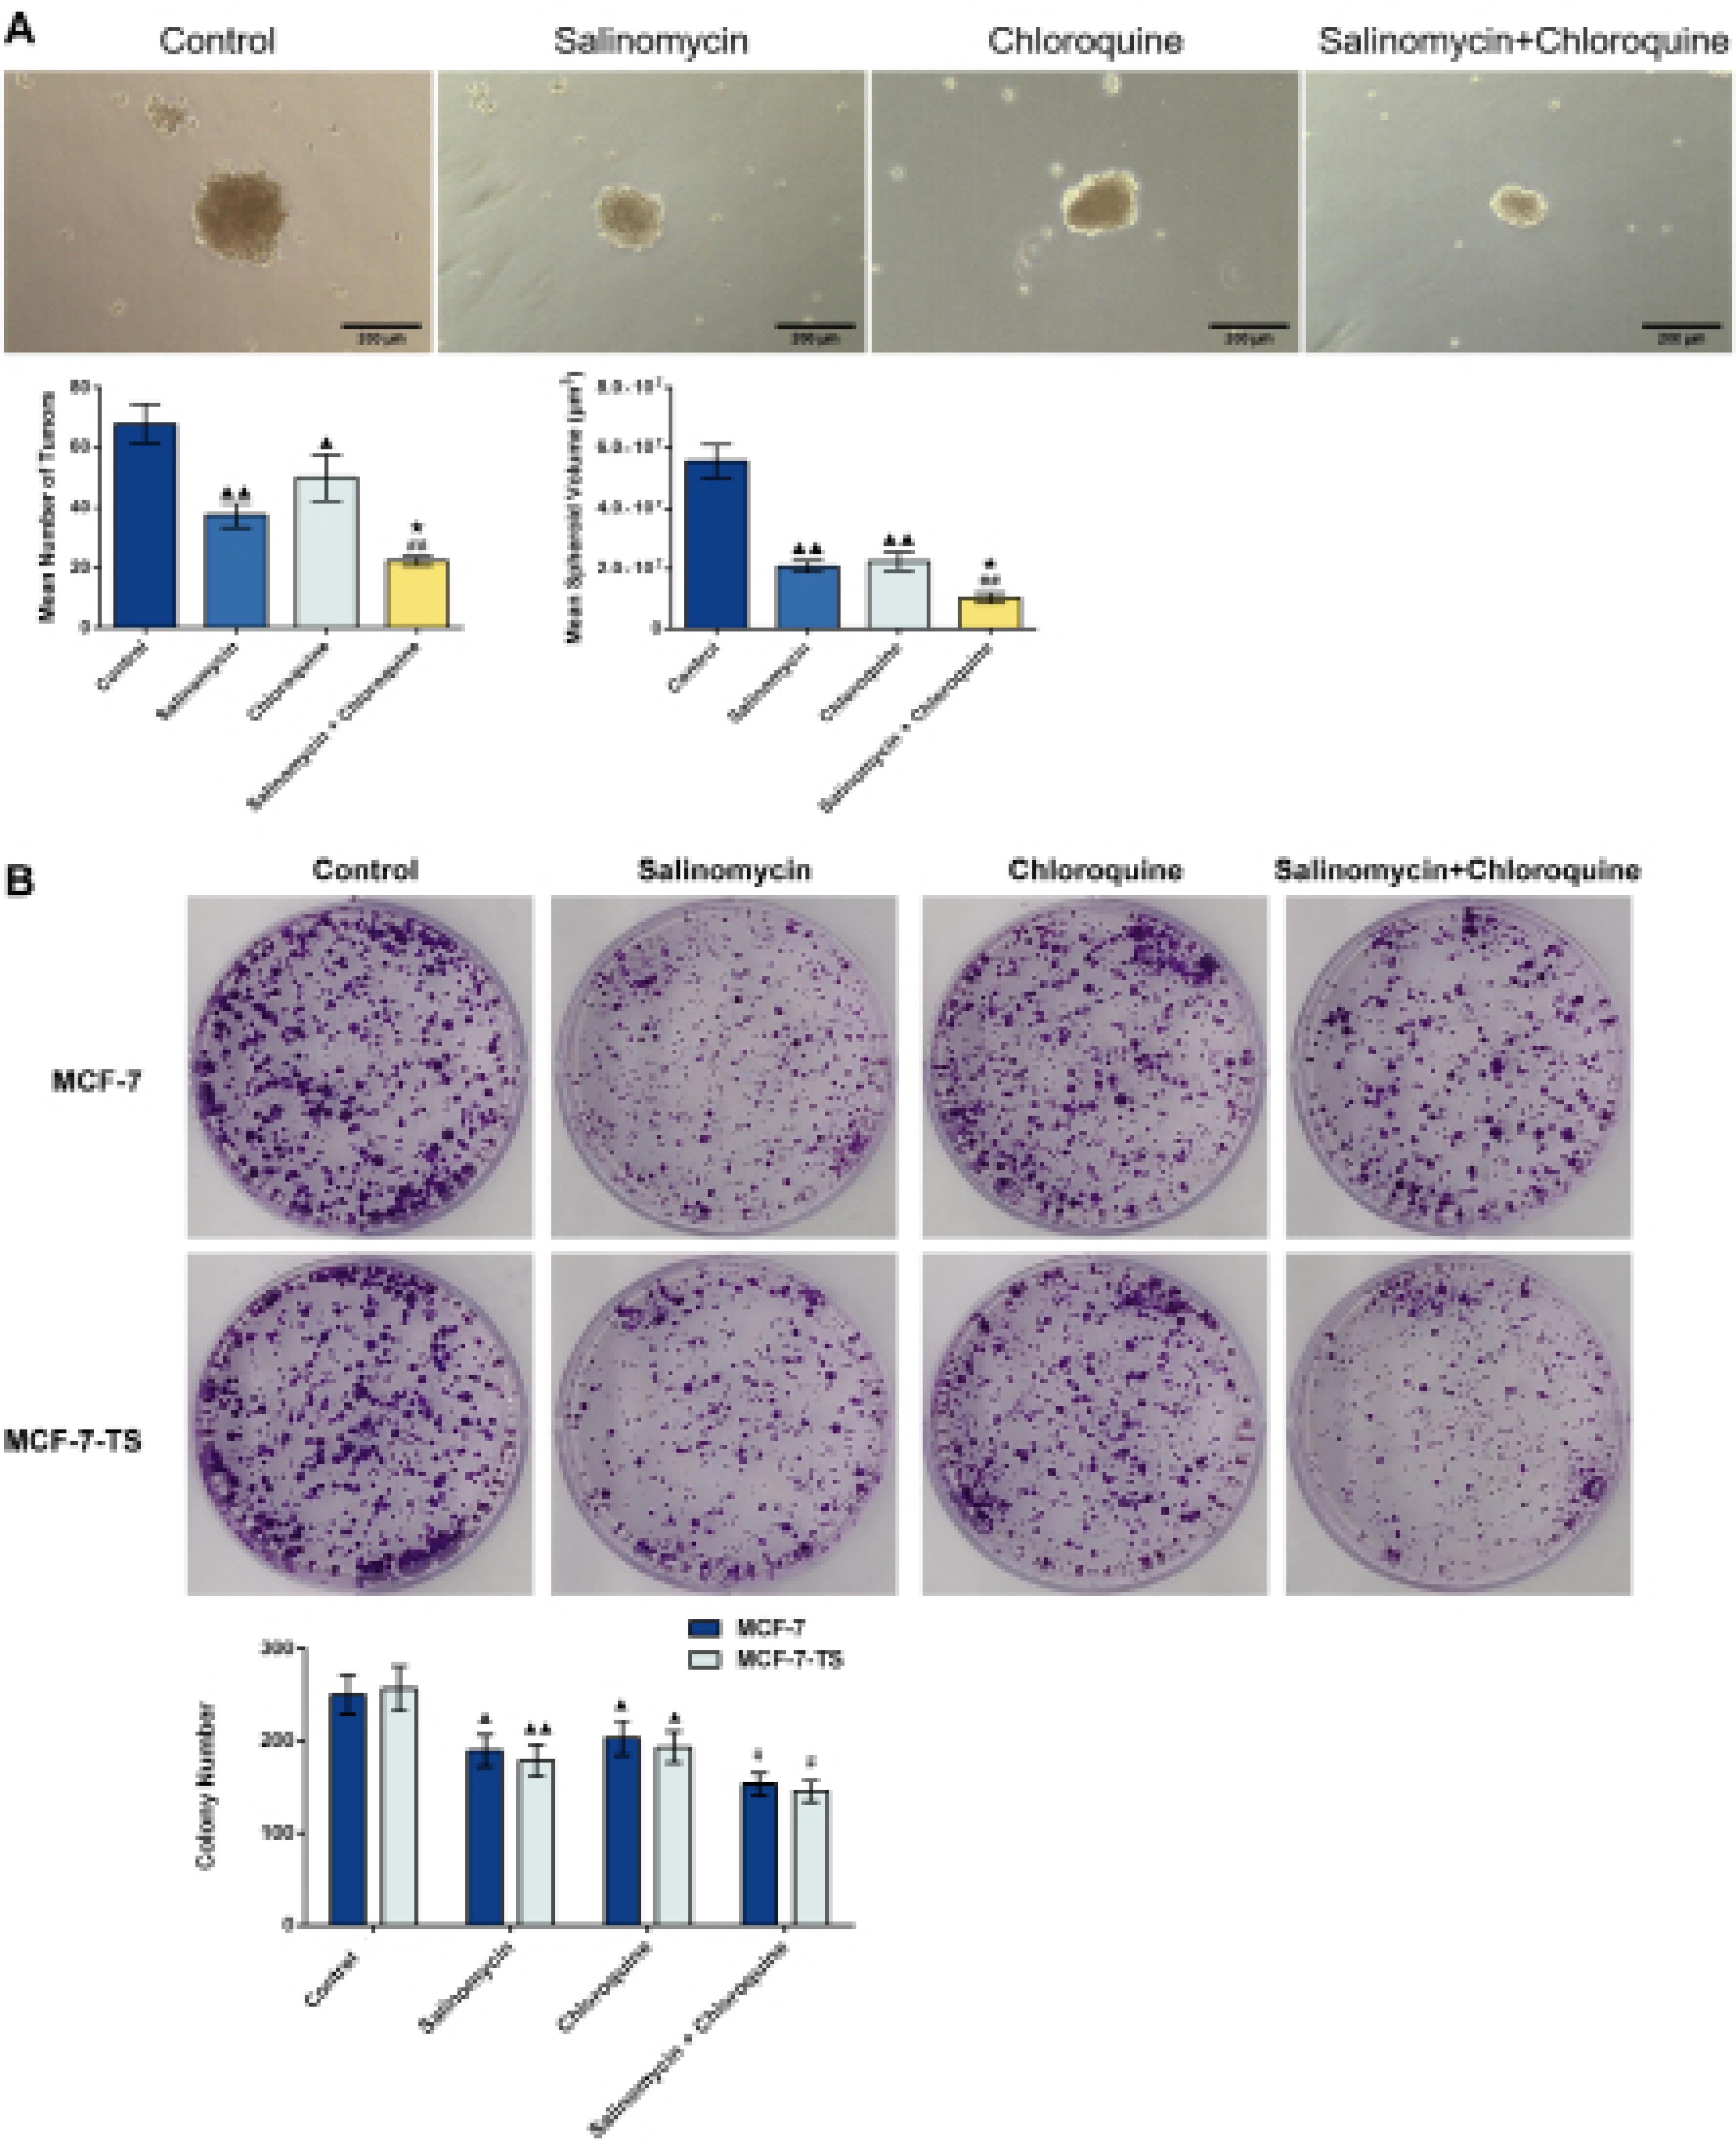
Fig. 5.
Effect of salinomycin and chloroquine on the proliferative capacity of MCF-7 and MCF-7-TS cells. (A) The tumor spheroid number and volume of MCF-7-TS cells were determined using an inverted fluorescence microscope (100 × , 200 μm); MCF-7 and MCF-7-TS cells were treated with 15 μM salinomycin, 37.5 μM chloroquine, or both (under a synergistic ratio of 1:2.5)for 72 h; (B) Cell colony assay was performed to assess the proliferative ability of MCF-7 and MCF-7-TS cells. Data are expressed as mean ± SD, n = 3. Compared with the control group, ▲P < 0.05, ▲▲P < 0.01; Compared with the salinomycin group, ★P < 0.05; Compared with the chloroquine group, #P < 0.05, ##P < 0.01. Note: MCF-7-TS: MCF-7 tumor spheroids.
.
Effect of salinomycin and chloroquine on the proliferative capacity of MCF-7 and MCF-7-TS cells. (A) The tumor spheroid number and volume of MCF-7-TS cells were determined using an inverted fluorescence microscope (100 × , 200 μm); MCF-7 and MCF-7-TS cells were treated with 15 μM salinomycin, 37.5 μM chloroquine, or both (under a synergistic ratio of 1:2.5)for 72 h; (B) Cell colony assay was performed to assess the proliferative ability of MCF-7 and MCF-7-TS cells. Data are expressed as mean ± SD, n = 3. Compared with the control group, ▲P < 0.05, ▲▲P < 0.01; Compared with the salinomycin group, ★P < 0.05; Compared with the chloroquine group, #P < 0.05, ##P < 0.01. Note: MCF-7-TS: MCF-7 tumor spheroids.
Subsequently, a cell colony assay was performed to assess the proliferative ability. As shown in Fig. 5B, compared to control group, the numbers of MCF-7 and MCF-7-TS cell clones were reduced after treatment with salinomycin and chloroquine (P < 0.05 or P < 0.01). In comparison to the chloroquine group, there were decreased numbers of MCF-7 and MCF-7-TS cell clones in salinomycin + chloroquine group (P < 0.05), indicating a significant decrease in proliferative capacity.
Effect of salinomycin and chloroquine on apoptosis in MCF-7 and MCF-7-TS cells
Apoptosis in MCF-7 and MCF-7-TS cells was analyzed by flow cytometry as shown in Fig. 6A. Salinomycin treatment resulted in higher apoptosis rates in MCF-7 and MCF-7-TS cells than in those of the control group (P < 0.01). Additionally, the salinomycin + chloroquine group had elevated apoptosis rates in comparison to the chloroquine group (P < 0.01). Western blot assay was used for test of apoptosis-related protein expression, including B-cell lymphoma-2 (Bcl-2) and Bcl-2-associated X protein (Bax) in MCF-7 and MCF-7-TS cells (Fig. 6B-C). Both salinomycin and chloroquine treatment enhanced Bax expression and reduced Bcl-2 expression than in control group (P < 0.05 or P < 0.01). Compared with treatment alone, the combination of salinomycin and chloroquine resulted in a higher degree of cell apoptosis, with higher Bax expression and lower Bcl-2 expression (P < 0.05 or P < 0.01).
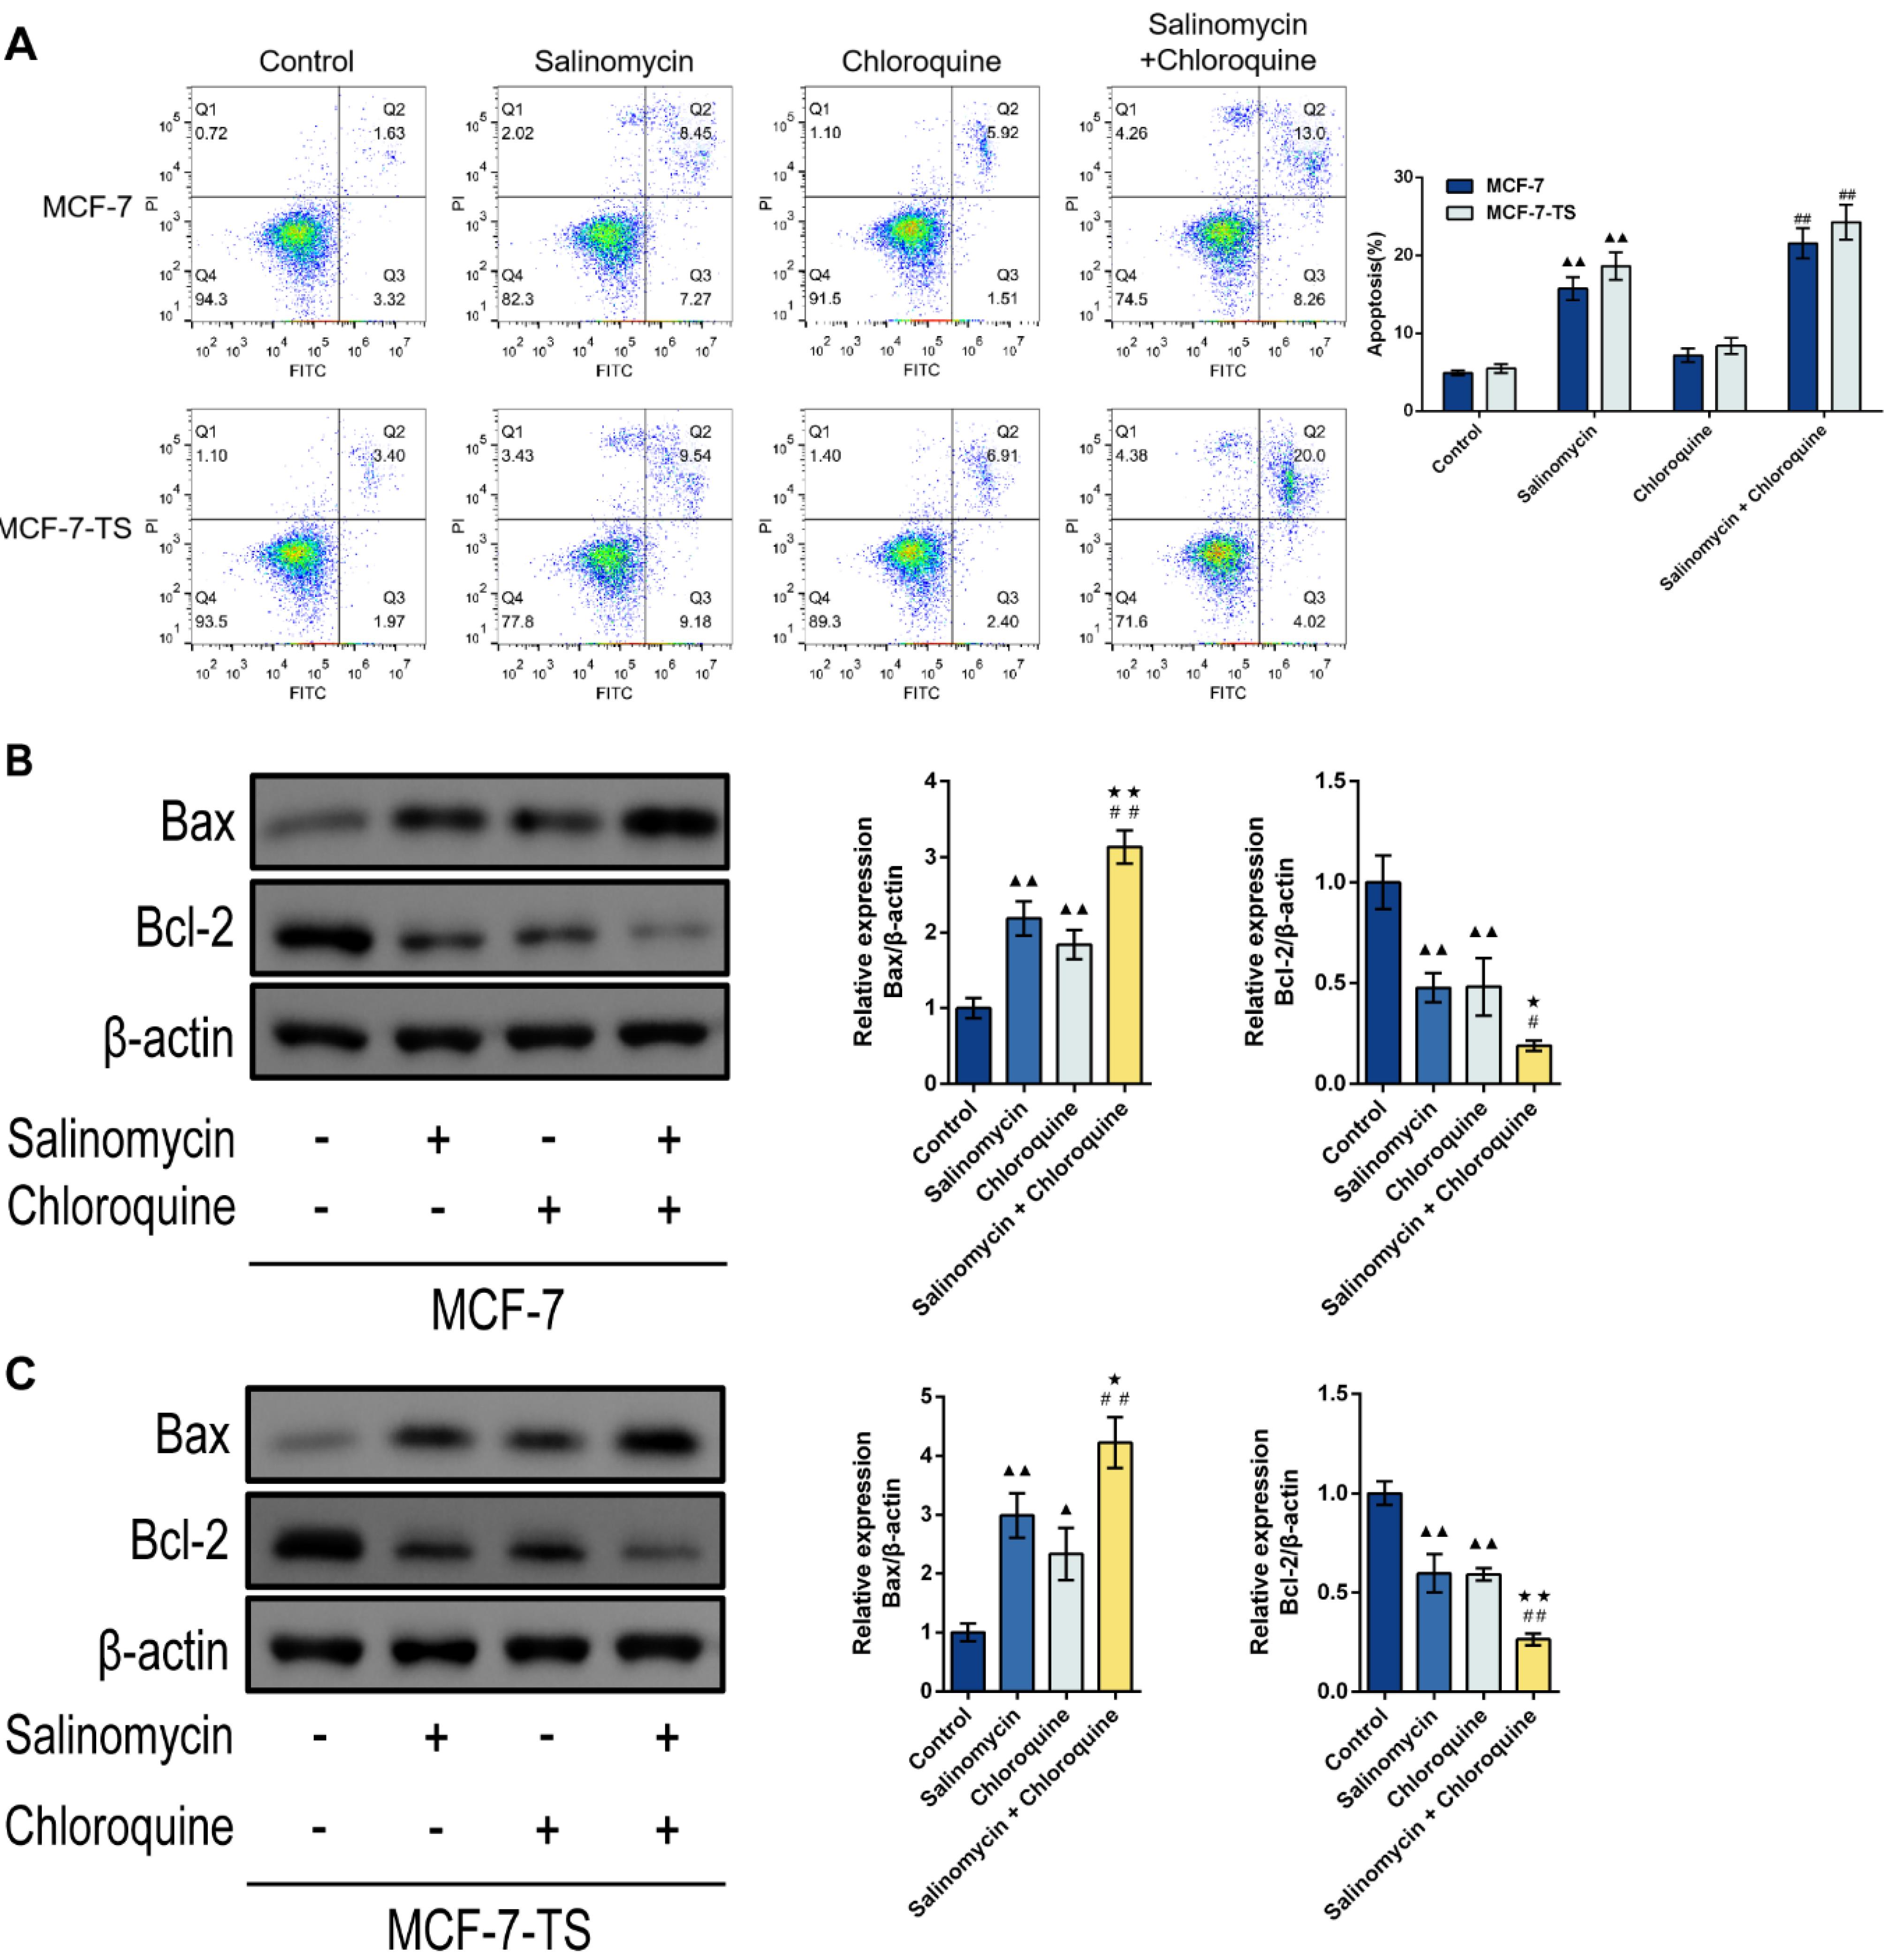
Fig. 6.
Effect of salinomycin and chloroquine on apoptosis in MCF-7 and MCF-7-TS cells. (A) Apoptosis in MCF-7 and MCF-7-TS cells was analyzed by flow cytometry; (B-C) Western blot assay was used to detect the expression of apoptosis-related proteins including Bcl-2 and Bax in MCF-7 and MCF-7-TS cells. Data are expressed as mean ± SD, n = 3. Compared with the control group, ▲P < 0.05, ▲▲P < 0.01; Compared with the salinomycin group, ★P < 0.05, ★★P < 0.01; Compared with the chloroquine group, #P < 0.05, ##P < 0.01. Note: MCF-7-TS: MCF-7 tumor spheroids; Bcl-2: B-cell lymphoma-2; Bax: Bcl-2-associated X.
.
Effect of salinomycin and chloroquine on apoptosis in MCF-7 and MCF-7-TS cells. (A) Apoptosis in MCF-7 and MCF-7-TS cells was analyzed by flow cytometry; (B-C) Western blot assay was used to detect the expression of apoptosis-related proteins including Bcl-2 and Bax in MCF-7 and MCF-7-TS cells. Data are expressed as mean ± SD, n = 3. Compared with the control group, ▲P < 0.05, ▲▲P < 0.01; Compared with the salinomycin group, ★P < 0.05, ★★P < 0.01; Compared with the chloroquine group, #P < 0.05, ##P < 0.01. Note: MCF-7-TS: MCF-7 tumor spheroids; Bcl-2: B-cell lymphoma-2; Bax: Bcl-2-associated X.
Effect of salinomycin and chloroquine on G1 arrest in MCF-7 and MCF-7-TS cells
In Fig. 7A-B, flow cytometry was used to detect the cell cycle changes in MCF-7 and MCF-7-TS cells. In comparison to the control group, both MCF-7 and MCF-7-TS cells in the chloroquine group exhibited a significant accumulation in the G0/G1 phase, with a marked increase in cell numbers (P < 0.05 or P < 0.01), whereas a decrease was observed in the S and G2/M phases in the MCF-7-TS cells (P < 0.05 or P < 0.01). Additionally, the combination of salinomycin and chloroquine also resulted in increased numbers of MCF-7 and MCF-7-TS cells in the G0/G1 phase (P < 0.05 or P < 0.01), with a corresponding decrease in the S and G2/M phases (P < 0.05 or P < 0.01), further reinforcing the effect of these treatments on cell cycle regulation.
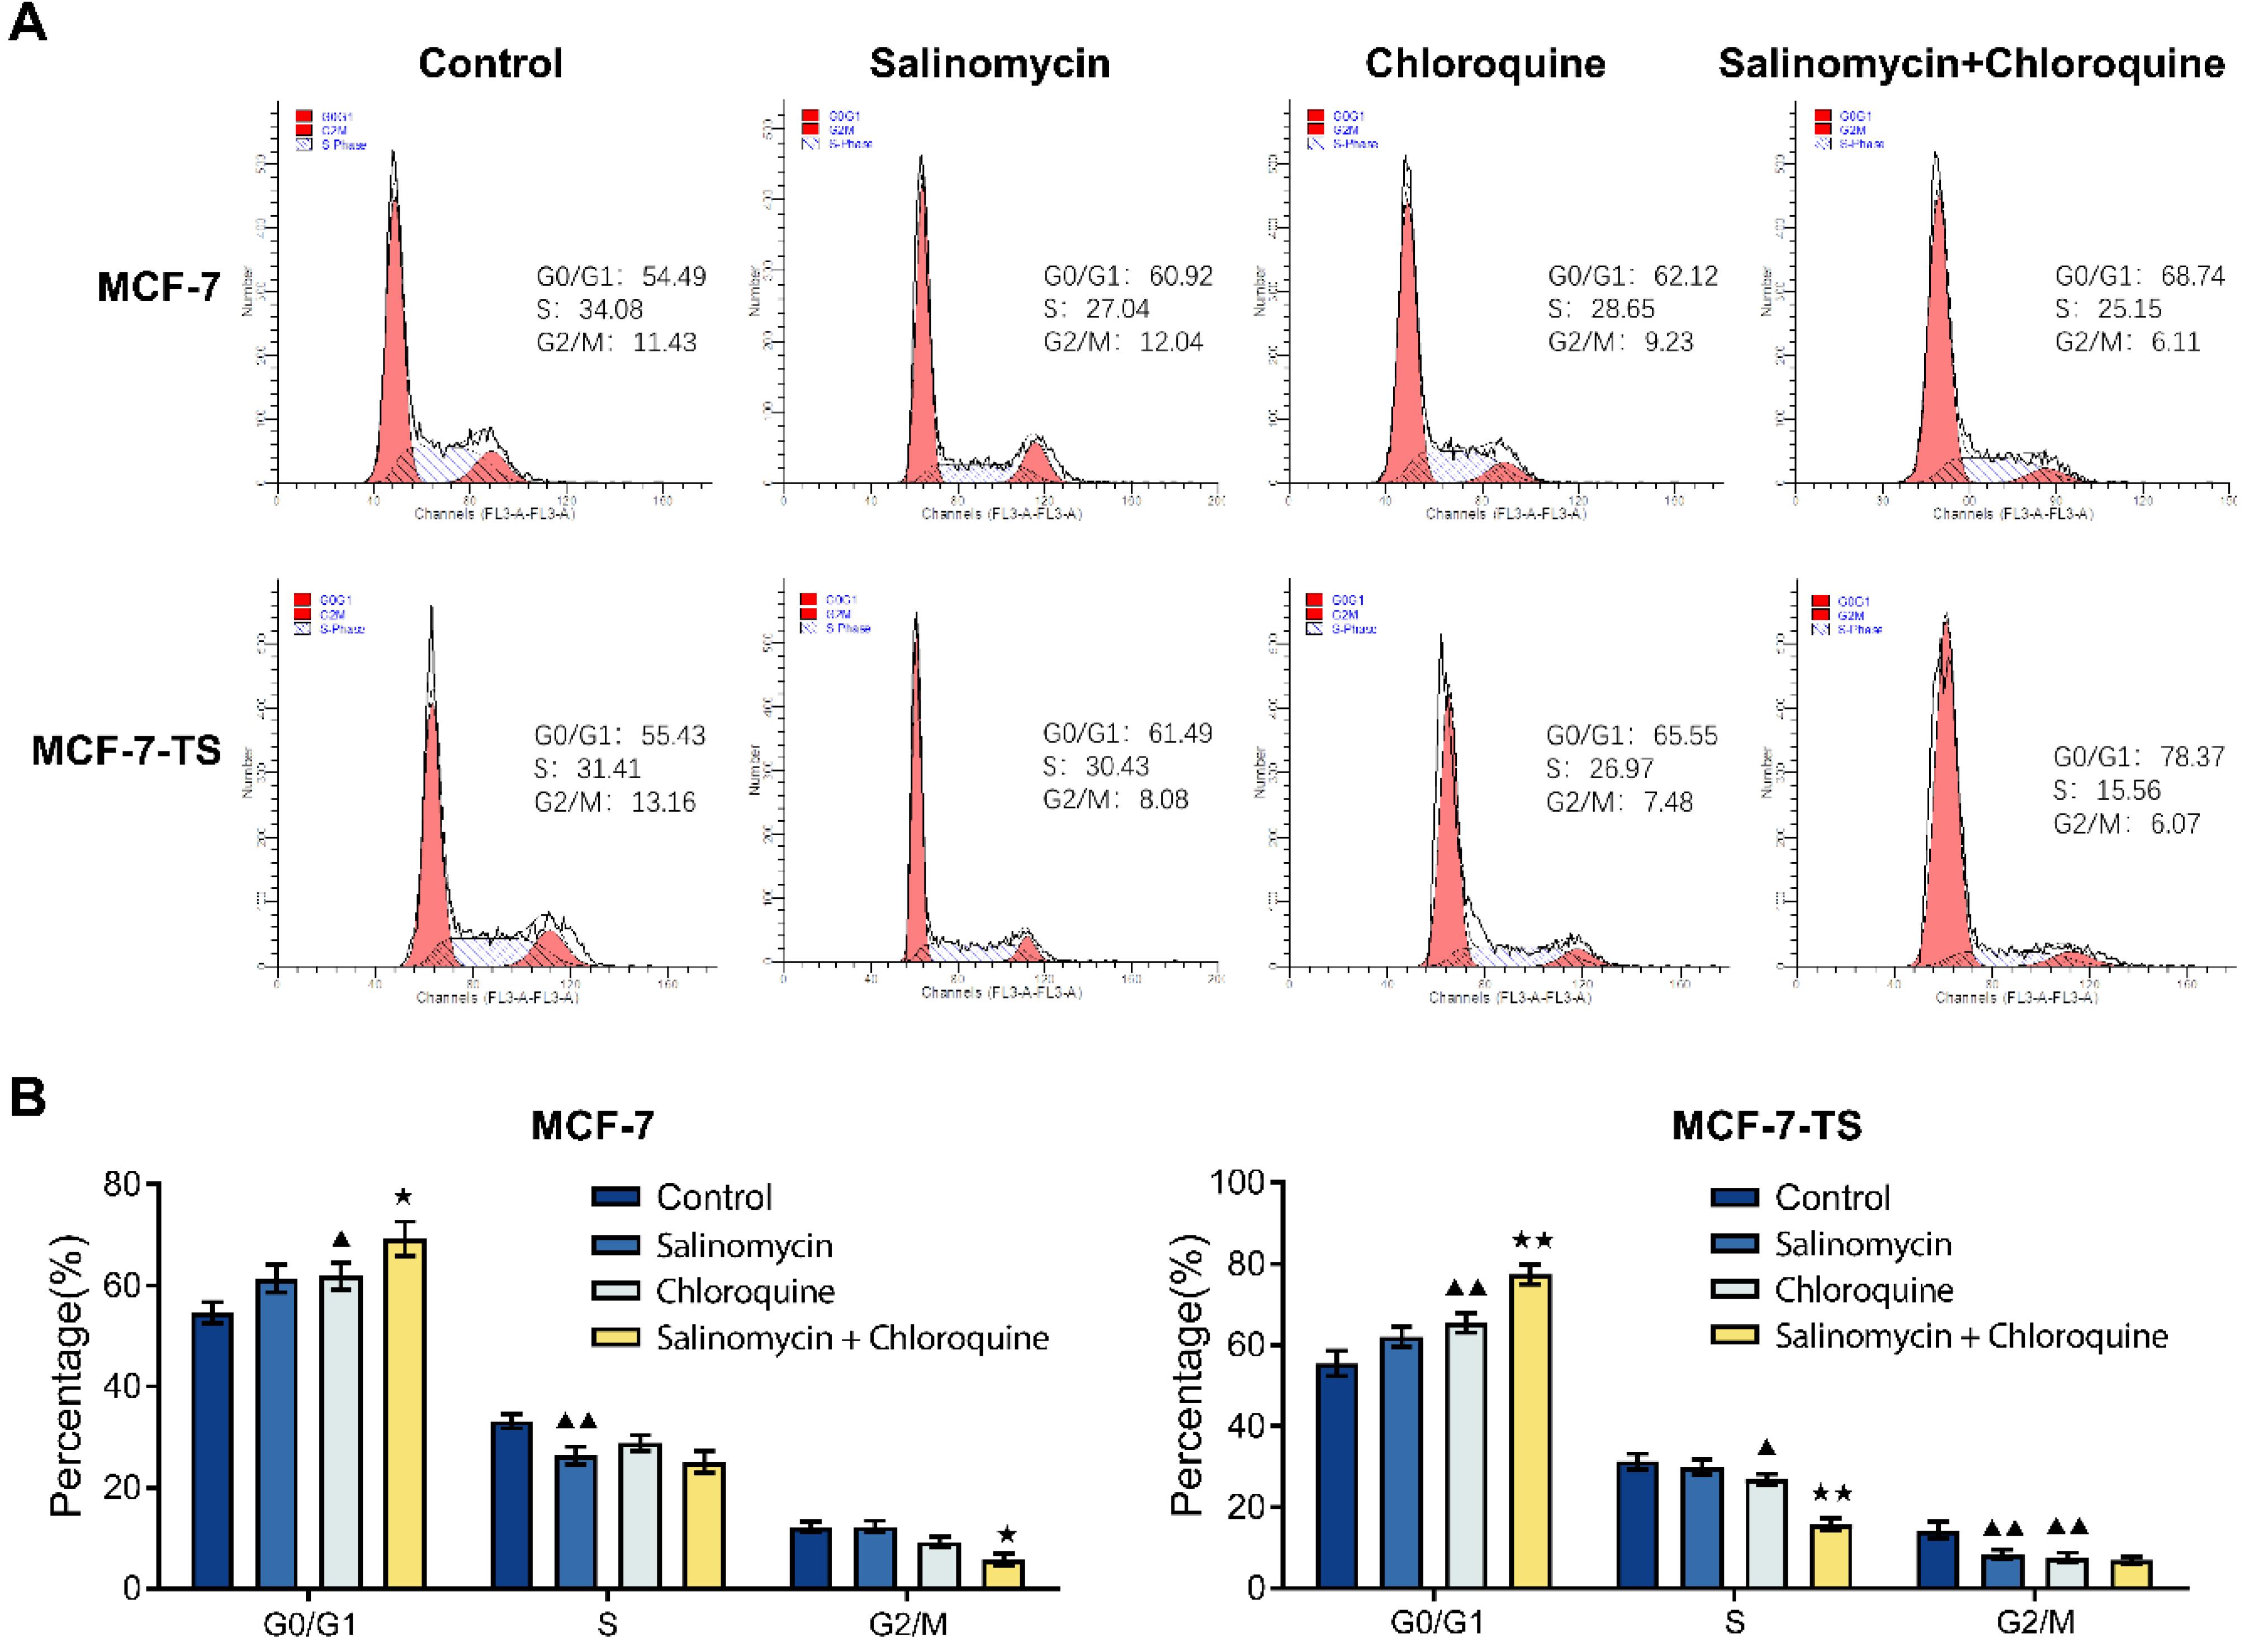
Fig. 7.
Effect of salinomycin and chloroquine on G1 arrest in MCF-7 and MCF-7-TS cells. (A-B) Flow cytometry was used to detect the cell cycle changes in MCF-7 and MCF-7-TS cells. Data are expressed as mean ± SD, n = 3. Compared with the control group, ▲P < 0.05, ▲▲P < 0.01; Compared with the salinomycin group, ★P < 0.05, ★★P < 0.01. Note: MCF-7-TS: MCF-7 tumor spheroids.
.
Effect of salinomycin and chloroquine on G1 arrest in MCF-7 and MCF-7-TS cells. (A-B) Flow cytometry was used to detect the cell cycle changes in MCF-7 and MCF-7-TS cells. Data are expressed as mean ± SD, n = 3. Compared with the control group, ▲P < 0.05, ▲▲P < 0.01; Compared with the salinomycin group, ★P < 0.05, ★★P < 0.01. Note: MCF-7-TS: MCF-7 tumor spheroids.
Effect of chloroquine on salinomycin-induced autophagy in MCF-7 and MCF-7-TS cells
Detection of LC3 fluorescent expression in MCF-7 and MCF-7-TS cells was done using immunofluorescence assay (Fig. 8A-B). There were enhanced LC3 expression in the salinomycin group and reduced LC3 fluorescent expression in the chloroquine group when compared to the control group (P < 0.01). In addition, the salinomycin + chloroquine group caused lower LC3 expression in comparison to the salinomycin group (P < 0.01) and higher LC3 expression in comparison to chloroquine group (P < 0.05). Measurement of LC3II/I and Beclin-1 expression in MCF-7 and MCF-7-TS cells was performed by Western blot (Fig. 8C-D). Consistent with the immunofluorescence results, LC3II/I and Beclin-1 protein expression was enhanced by salinomycin (P < 0.05 or P < 0.01) and reduced by chloroquine (P < 0.05 or P < 0.01) in both MCF-7 and MCF-7-TS cells. The combination of salinomycin and chloroquine treatment led to lower LC3II/I and Beclin-1 expression when comparing to the salinomycin group (P < 0.05 or P < 0.01) and elevated LC3II/I and Beclin-1 expression when comparing to the chloroquine group (P < 0.05 or P < 0.01).
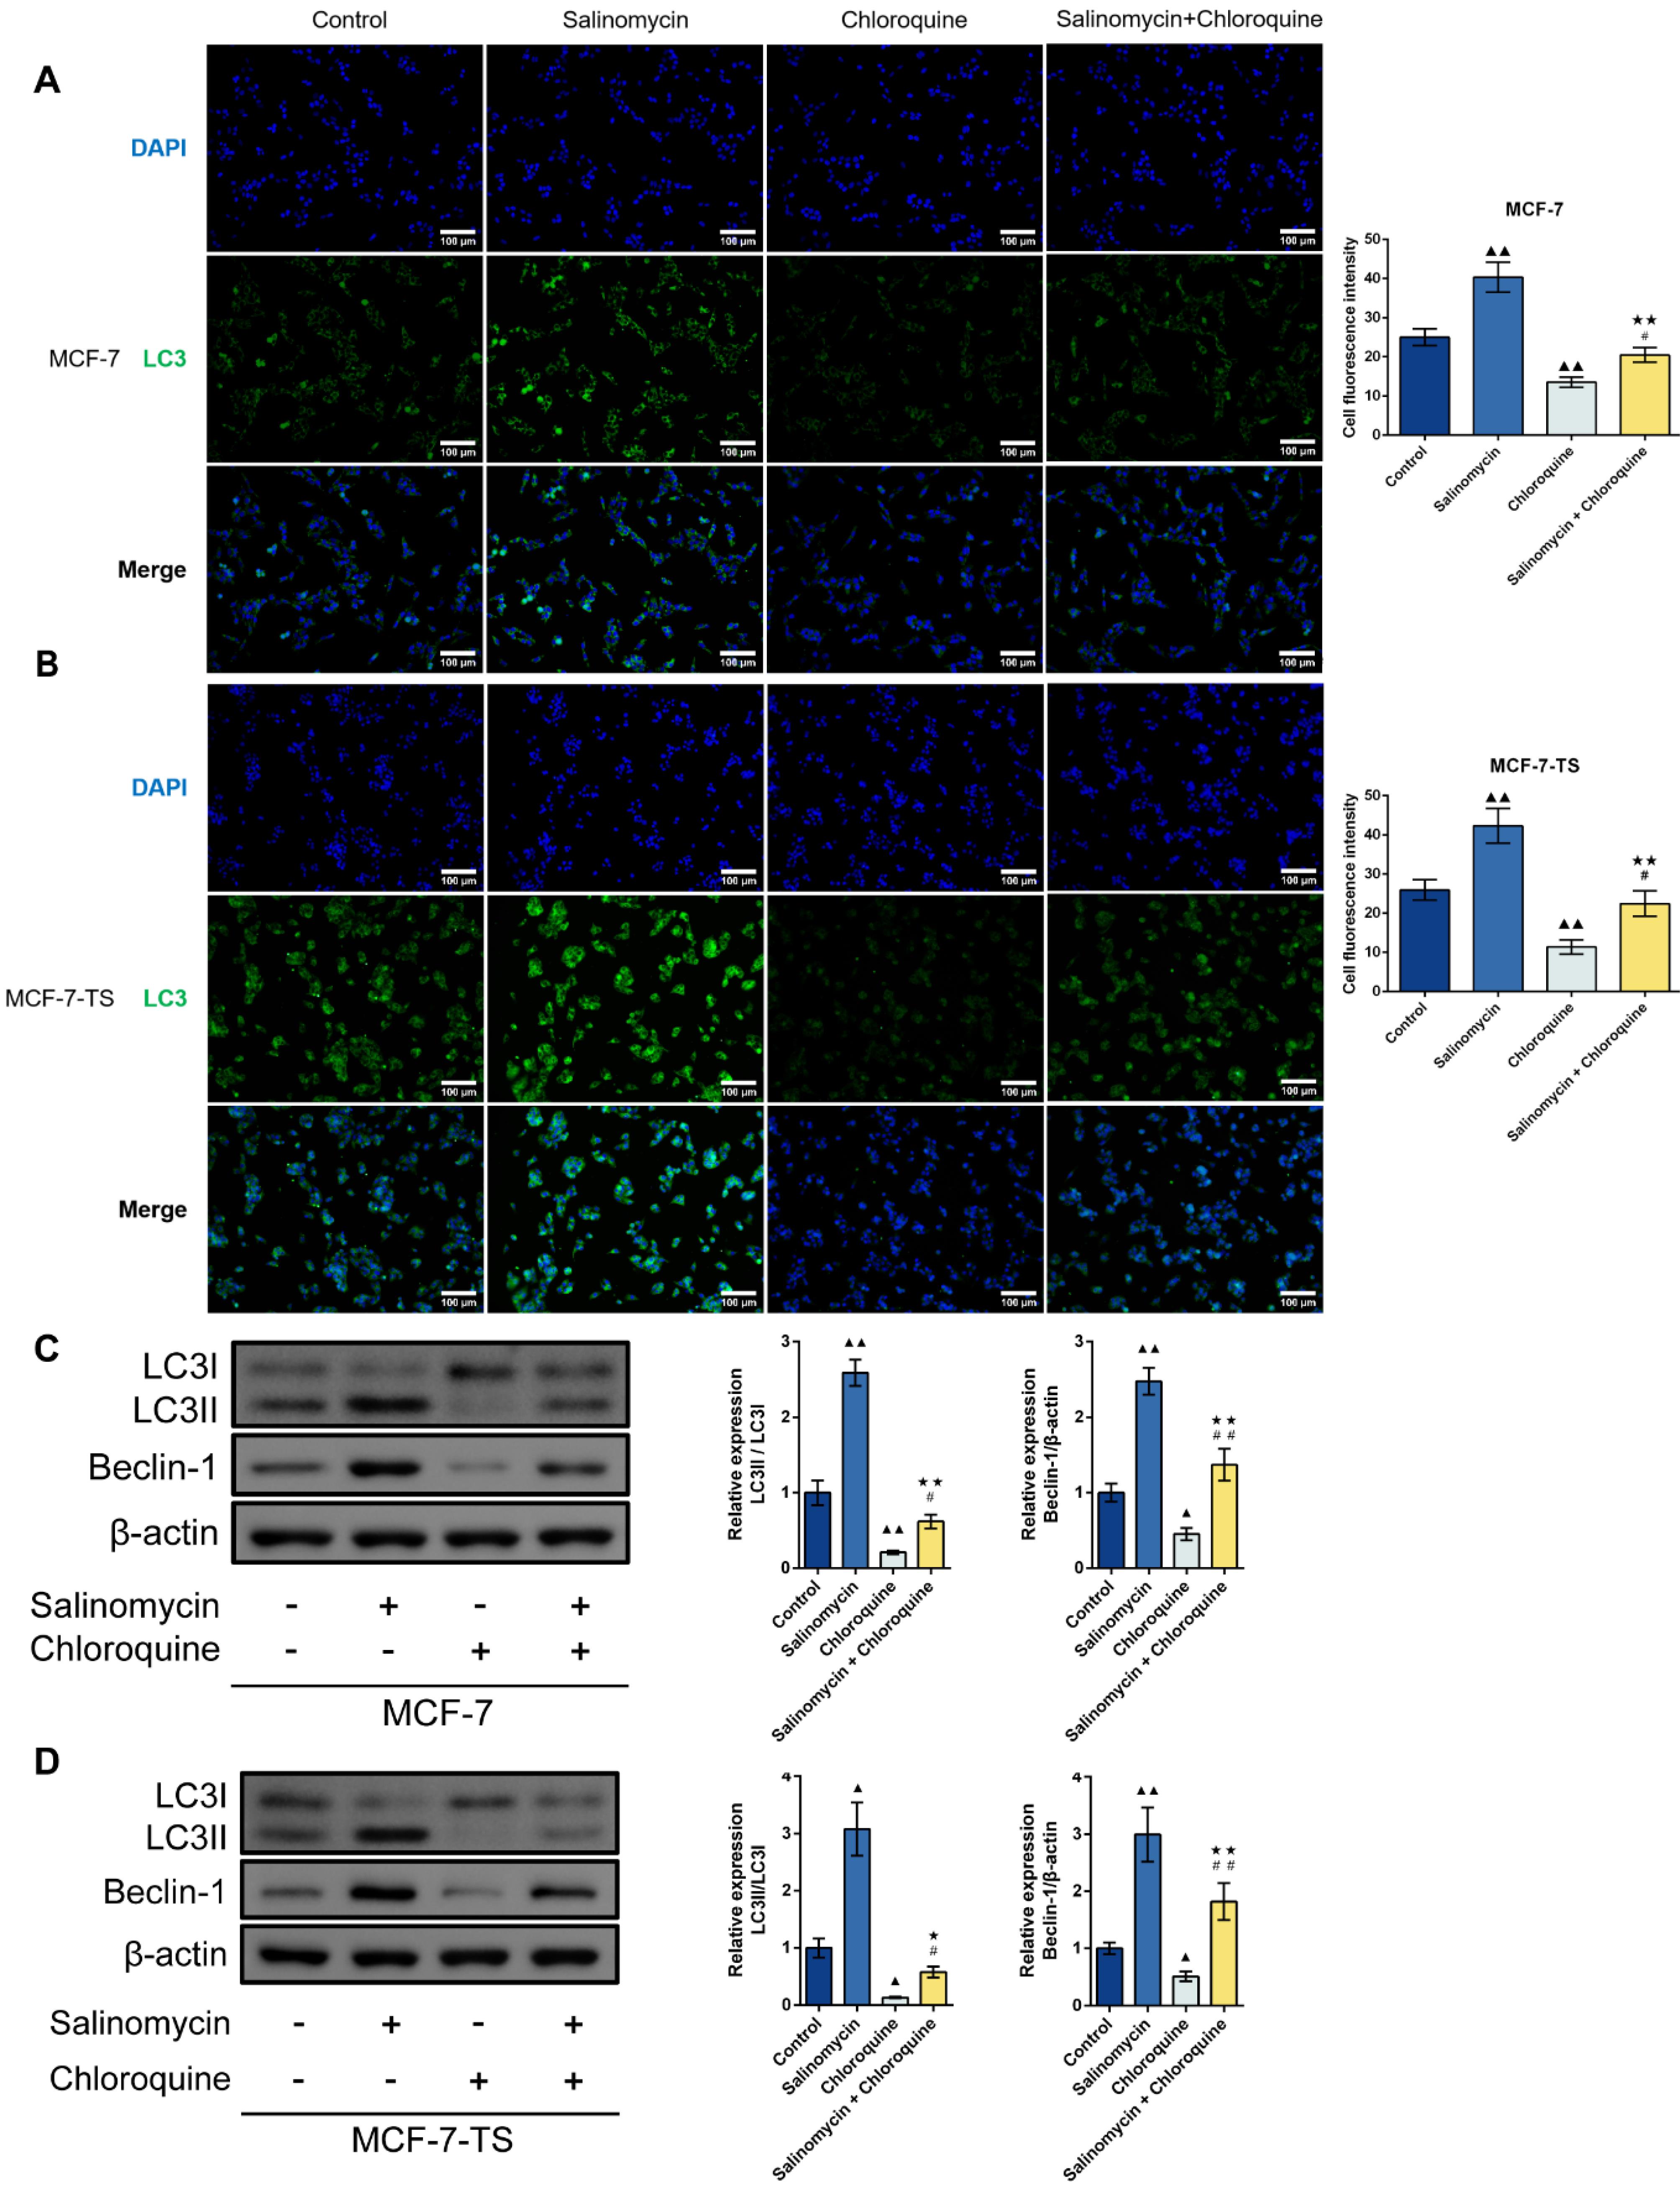
Fig. 8.
Effect of chloroquine on salinomycin-induced autophagy in MCF-7 and MCF-7-TS cells.(A-B) Detection of LC3 expression in MCF-7 and MCF-7-TS cells was done using immunofluorescence assay (200 × , 100 μm); (C-D) Measurement of LC3II/I and Beclin-1 expression in MCF-7 and MCF-7-TS cells was performed by Western blot. Data are expressed as mean ± SD, n = 3. Compared with the control group, ▲P < 0.05, ▲▲P < 0.01; Compared with the salinomycin group, ★P < 0.05, ★★P < 0.01; Compared with the chloroquine group, #P < 0.05, ##P < 0.01. Note: MCF-7-TS: MCF-7 tumor spheroids; LC3: light chain 3.
.
Effect of chloroquine on salinomycin-induced autophagy in MCF-7 and MCF-7-TS cells.(A-B) Detection of LC3 expression in MCF-7 and MCF-7-TS cells was done using immunofluorescence assay (200 × , 100 μm); (C-D) Measurement of LC3II/I and Beclin-1 expression in MCF-7 and MCF-7-TS cells was performed by Western blot. Data are expressed as mean ± SD, n = 3. Compared with the control group, ▲P < 0.05, ▲▲P < 0.01; Compared with the salinomycin group, ★P < 0.05, ★★P < 0.01; Compared with the chloroquine group, #P < 0.05, ##P < 0.01. Note: MCF-7-TS: MCF-7 tumor spheroids; LC3: light chain 3.
Discussion
BC is the most common malignant tumor with the highest incidence among women in China.29 The present study demonstrated that salinomycin activated autophagy and promoted apoptosis by downregulating the PI3K/AKT/mTOR pathway. Notably, further intervention with the autophagy agonist rapamycin reduced apoptosis and increased the tumor spheroid number and volume of MCF-7-TS cells, thereby weakening the anticancer effects of salinomycin in BC. After screening for the optimal salinomycin-to-chloroquine ratio (1:2.5), our study indicated that chloroquine inhibited salinomycin-induced autophagy, enhancing its anticancer properties. These findings provide a strong theoretical basis for its clinical application in BC and offer new directions for BC treatment.
Cancer stem cells, which refer to tumor cells with stem cell characteristics, are widely recognized as an important source of tumor drug resistance and metastasis, and are among the key factors leading to tumor recurrence.17 In addition to targeting BC cells, salinomycin effectively eradicates BCSCs.17 Shen et al. found that low doses of salinomycin inhibited BC growth and metastasis.30 Meanwhile, salinomycin derivatives have been shown to eliminate BCSCs via lysosomal iron targeting.31 Consistent with the results above, salinomycin promoted apoptosis in BC cells (MCF-7) and BCSCs (MCF-7-TS) in our study. Additionally, autophagy induced by salinomycin and budesonide represents as a promising therapeutic strategy for BC.19 However, in BC, hyperactivation of autophagy leads to increased resistance of BC cells to genotoxic drugs.32 As a cytoprotective mechanism in tumors, autophagy maintains cancer cell stemness and promotes tumor proliferation and metastasis.33 Our results indicated that the combination of salinomycin and rapamycin enhanced autophagy in MCF-7 and MCF-7-TS cells, leading to the development of drug resistance and consequently diminishing the antitumor efficacy of salinomycin. Therefore, inhibiting autophagy may be an effective strategy for improving the treatment of chemotherapy-resistant cancers through sustained exposure to chemotherapeutic agents.
Recently, chloroquine, a well-established autophagy inhibitor, has been widely used to improve the efficacy of different chemotherapeutic agents in the treatment of tumors, including BC.24,34 Treatment with hydroxychloroquine and paclitaxel synergistically inhibited autophagy in triple-negative BC cells, reducing tumor stemness and tumor stem cell-like populations, thus inhibiting BC metastasis and recurrence.33 In prostate cancer, depletion of perilipin 3 (PLIN3) enhanced autophagy leading to docetaxel resistance. However, this effect was reversed by chloroquine intervention, suggesting that the combination of chloroquine and docetaxel may increase the efficacy of docetaxel in the treatment of patients with PLIN3-deficient prostate cancer.35 These findings aligned with our results. In the present study, the combination of salinomycin and chloroquine at a ratio of 1:2.5 effectively caused inhibition of the cell viability and proliferation of MCF-7 and MCF-7-TS cells, while promoting apoptosis, with reduced LC3II/I and Beclin-1 protein expression in comparison to the salinomycin group.
Furthermore, G1 arrest was observed following chloroquine treatment of MCF-7 and MCF-7-TS cells in our study. Cell cycle arrest regulates cell proliferation, which is important for antitumor effects.36 In ovarian cancer, the combination of chloroquine and cisplatin induced cell cycle arrest.37 Similarly, hydroxychloroquine was proved to inhibit lung cancer cell growth by causing G1 cell cycle arrest and apoptosis,38 which was highly in agreement with our findings. In our study, the combination of salinomycin and chloroquine in our study led to increased cell cycle arrest in the G0/G1 phase than that of the chloroquine group, suggesting that chloroquine enhanced the anticancer effects of salinomycin. Autophagy and cell cycle are two pivotal processes in tumorigenesis, and to date, conclusive evidence regarding the correlation between autophagy and cell cycle remains lacking.39 Our results showed that co-treatment of MCF-7 and MCF-7-TS cells with salinomycin and chloroquine enhanced cell cycle arrest, indicating that inhibition of autophagy may promote cell cycle arrest. Therefore, cell cycle arrest may exert a protective effect reducing chloroquine-induced autophagy. Our study supports the notion that chloroquine enhances the anticancer efficacy of chemotherapeutic agents, particularly indicating that chloroquine may promote the effect of salinomycin against BC by inhibiting autophagy, offering new therapeutic perspectives for synergistic antitumor strategies.
The PI3K/AKT/mTOR pathway plays a crucial role in regulating cell survival, proliferation, and metabolism, and is often hyperactivated in various cancers.40 The PI3K/AKT/mTOR pathway was upregulated in BC, and mTOR inhibitor may act as a new therapeutic choice.12 Salinomycin downregulated the PI3K/AKT/mTOR pathway to inhibit medullary thyroid carcinoma cell proliferation,41 consistent with our findings. Moreover, PI3K/AKT/mTOR-mediated autophagy has an important regulatory role in cancer therapy and is involved in the regulation of chemosensitivity and drug resistance in tumor cells.42 Wang et al demonstrated that ABBV-744 promoted autophagy in gastric cancer cells by inhibiting the PI3K/AKT/mTOR signaling pathway.43 In the present study, in MCF-7 and MCF-7-TS cells, salinomycin led to reduced PI3K/AKT/mTOR signaling pathway-related protein expression, as well as elevated LC3 expression, with reduced tumor spheroid number and volume of MCF-7-TS cells. However, rapamycin, an inhibitor of mTOR and autophagy activator resulted in an increase of tumor spheroid number and volume of MCF-7-TS cells, and a reduction of apoptosis in MCF-7 and MCF-7-TS cells treated with salinomycin. Therefore, treatment with the combination of chloroquine and salinomycin effectively inhibited salinomycin-induced autophagy, thereby reducing cellular resistance to salinomycin and enhancing its anticancer efficacy, presenting a promising strategy for improving cancer therapeutics.
This study demonstrated through in vitro experiments that the autophagy inhibitor chloroquine effectively suppressed autophagy induced by the chemotherapeutic agent salinomycin, thereby enhancing the anticancer effect of salinomycin. However, the following limitations exist in this study. Since this study was an in vitro antitumor study, there is a lack of in vivo animal studies and further clinical trials to confirm the antitumor mechanism of the combination of salinomycin and chloroquine in vivo. Further animal and clinical studies will be carried out in subsequent trials.
Conclusion
In conclusion, salinomycin activated autophagy and promoted apoptosis by down-regulating the PI3K/AKT/mTOR pathway, and the combination of chloroquine and salinomycin reduced the tumor spheroid number and volume of MCF-7-TS cells and cell colon, and increased apoptosis and cell cycle arrest by inhibiting the salinomycin-induced autophagy to enhanced the anticancer effect of salinomycin. This finding presents a promising avenue for BC treatment, offers new insights into potential therapeutic strategies, and supports the notion that excessive autophagy enhances resistance to BC, potentially serving as a key mechanism underlying the poor efficacy of clinical chemotherapy agents.
Review Highlights
What is the current knowledge?
-
The chemotherapeutic agent salinomycin decelerates the progression of BC by activating autophagy, while the effectiveness of its anticancer effects is limited by over-activation of autophagy.
-
The autophagy inhibitor chloroquine has been widely used to improve the efficacy of different chemotherapeutic agents in the treatment of tumors, including BC.
What is new here?
-
Salinomycin activated autophagy and promoted apoptosis by down-regulating the PI3K/AKT/mTOR pathway to show the anticancer effects in BC.
-
The combination of chloroquine and salinomycin reduced cell colon and increased apoptosis and cell cycle arrest by inhibiting the salinomycin-induced autophagy to enhanced the anticancer effect of salinomycin.
Competing interests
Authors declare no conflict of interests.
Data availability Statement
The data will be available from corresponding author upon reasonable request.
Ethical Approval
Not applicable.
References
-
Azamjah N, Soltan-Zadeh Y, Zayeri F. Global trend of breast cancer mortality rate: a 25-year study. Asian Pac J Cancer Prev 2019. 20: 2015-20. doi: 10.31557/apjcp.2019.20.7.2015.
- Bray F, Laversanne M, Sung H, Ferlay J, Siegel RL, Soerjomataram I. Global cancer statistics 2022: GLOBOCAN estimates of incidence and mortality worldwide for 36 cancers in 185 countries. CA Cancer J Clin 2024; 74:229-63. doi: 10.3322/caac.21834 [Crossref] [ Google Scholar]
- Ranganathan P, Nadig N, Nambiar S. Non-canonical estrogen signaling in endocrine resistance. Front Endocrinol (Lausanne) 2019; 10:708. doi: 10.3389/fendo.2019.00708 [Crossref] [ Google Scholar]
- Mehraj U, Ganai RA, Macha MA, Hamid A, Zargar MA, Bhat AA. The tumor microenvironment as driver of stemness and therapeutic resistance in breast cancer: new challenges and therapeutic opportunities. Cell Oncol (Dordr) 2021; 44:1209-29. doi: 10.1007/s13402-021-00634-9 [Crossref] [ Google Scholar]
- Lappano R, Jacquot Y, Maggiolini M. GPCR modulation in breast cancer. Int J Mol Sci 2018; 19:3840. doi: 10.3390/ijms19123840 [Crossref] [ Google Scholar]
- Cocco S, Leone A, Piezzo M, Caputo R, Di Lauro V, Di Rella F. Targeting autophagy in breast cancer. Int J Mol Sci 2020; 21:7836. doi: 10.3390/ijms21217836 [Crossref] [ Google Scholar]
- Settembre C, Ballabio A. Cell metabolism: autophagy transcribed. Nature 2014; 516:40-1. doi: 10.1038/nature13939 [Crossref] [ Google Scholar]
- Pimentel JM, Zhou JY, Wu GS. Autophagy and cancer therapy. Cancer Lett 2024; 605:217285. doi: 10.1016/j.canlet.2024.217285 [Crossref] [ Google Scholar]
- Liang XH, Jackson S, Seaman M, Brown K, Kempkes B, Hibshoosh H. Induction of autophagy and inhibition of tumorigenesis by Beclin-1. Nature 1999; 402:672-6. doi: 10.1038/45257 [Crossref] [ Google Scholar]
- Koh M, Lim H, Jin H, Kim M, Hong Y, Hwang YK. ANXA2 (annexin A2) is crucial to ATG7-mediated autophagy, leading to tumor aggressiveness in triple-negative breast cancer cells. Autophagy 2024; 20:659-74. doi: 10.1080/15548627.2024.2305063 [Crossref] [ Google Scholar]
- Yang B, Peng F, Zhang Y, Wang X, Wang S, Zheng Y. Aiduqing formula suppresses breast cancer metastasis via inhibiting CXCL1-mediated autophagy. Phytomedicine 2021; 90:153628. doi: 10.1016/j.phymed.2021.153628 [Crossref] [ Google Scholar]
- Miricescu D, Totan A, Stanescu-Spinu II, Badoiu SC, Stefani C, Greabu M. PI3K/AKT/mTOR signaling pathway in breast cancer: from molecular landscape to clinical aspects. Int J Mol Sci 2020; 22:173. doi: 10.3390/ijms22010173 [Crossref] [ Google Scholar]
- Levine B. Cell biology: autophagy and cancer. Nature 2007; 446:745-7. doi: 10.1038/446745a [Crossref] [ Google Scholar]
- Pang JL, Xu LS, Zhao Q, Niu WW, Rong XY, Li SS. Sodium cantharidate promotes autophagy in breast cancer cells by inhibiting the PI3K-Akt-mTOR signaling pathway. Front Pharmacol 2022; 13:1000377. doi: 10.3389/fphar.2022.1000377 [Crossref] [ Google Scholar]
- Chen X, Li S, Li D, Li M, Su Z, Lai X. Ethanol extract of Brucea javanica seed inhibit triple-negative breast cancer by restraining autophagy via PI3K/Akt/mTOR pathway. Front Pharmacol 2020; 11:606. doi: 10.3389/fphar.2020.00606 [Crossref] [ Google Scholar]
- Markowska A, Kaysiewicz J, Markowska J, Huczyński A. Doxycycline, salinomycin, monensin and ivermectin repositioned as cancer drugs. Bioorg Med Chem Lett 2019; 29:1549-54. doi: 10.1016/j.bmcl.2019.04.045 [Crossref] [ Google Scholar]
- Wang H, Zhang H, Zhu Y, Wu Z, Cui C, Cai F. Anticancer mechanisms of salinomycin in breast cancer and its clinical applications. Front Oncol 2021; 11:654428. doi: 10.3389/fonc.2021.654428 [Crossref] [ Google Scholar]
- Marques LA, Semprebon SC, Biazi BI, Felicidade I, Zanetti TA, Baranoski A. Vitamin D3 and salinomycin synergy in MCF-7 cells cause cell death via endoplasmic reticulum stress in monolayer and 3D cell culture. Toxicol Appl Pharmacol 2022; 452:116178. doi: 10.1016/j.taap.2022.116178 [Crossref] [ Google Scholar]
- Sarkar S, Ghosh SS. Synergistic effect of salinomycin with budesonide on TNBC regression via EMT reversal and autophagy induction. J Biochem Mol Toxicol 2024; 38:e70045. doi: 10.1002/jbt.70045 [Crossref] [ Google Scholar]
- Li F, Huang G, Peng P, Liu Y, Li S, Liu L. [Overexpression of autophagy-related gene 3 promotes autophagy and inhibits salinomycin-induced apoptosis in breast cancer MCF-7 cells]. Nan Fang Yi Ke Da Xue Xue Bao 2019; 39:162-8. doi: 10.12122/j.issn.1673-4254.2019.09.06.[Chinese] [Crossref] [ Google Scholar]
- Mulcahy Levy JM, Thorburn A. Autophagy in cancer: moving from understanding mechanism to improving therapy responses in patients. Cell Death Differ 2020; 27:843-57. doi: 10.1038/s41418-019-0474-7 [Crossref] [ Google Scholar]
- Shao L, Li Y, Huang F, Wang X, Lu J, Jia F. Complementary autophagy inhibition and glucose metabolism with rattle-structured polydopamine@mesoporous silica nanoparticles for augmented low-temperature photothermal therapy and in vivo photoacoustic imaging. Theranostics 2020; 10:7273-86. doi: 10.7150/thno.44668 [Crossref] [ Google Scholar]
- Zhou Q, Peng M, Zhou L, Bai J, Tong A, Liu M. Development and validation of a brief diabetic foot ulceration risk checklist among diabetic patients: a multicenter longitudinal study in China. Sci Rep 2018; 8:962. doi: 10.1038/s41598-018-19268-3 [Crossref] [ Google Scholar]
- Cocco S, Leone A, Roca MS, Lombardi R, Piezzo M, Caputo R. Inhibition of autophagy by chloroquine prevents resistance to PI3K/AKT inhibitors and potentiates their antitumor effect in combination with paclitaxel in triple negative breast cancer models. J Transl Med 2022; 20:290. doi: 10.1186/s12967-022-03462-z [Crossref] [ Google Scholar]
- Li W, Li Y, Cui Y, Li S, Zhu Y, Shang C. Anti-tumour effects of a dual cancer-specific oncolytic adenovirus on Breast Cancer Stem cells. J Cell Mol Med 2021; 25:666-76. doi: 10.1111/jcmm.16113 [Crossref] [ Google Scholar]
- Liu X, Meng L, Li X, Li D, Liu Q, Chen Y. Regulation of FN1 degradation by the p62/SQSTM1-dependent autophagy-lysosome pathway in HNSCC. Int J Oral Sci 2020; 12:34. doi: 10.1038/s41368-020-00101-5 [Crossref] [ Google Scholar]
- Lee KS, Lee MG, Kwon YS, Nam KS. Arctigenin enhances the cytotoxic effect of doxorubicin in MDA-MB-231 breast cancer cells. Int J Mol Sci 2020; 21:2997. doi: 10.3390/ijms21082997 [Crossref] [ Google Scholar]
- Ravera S, Ghiotto F, Tenca C, Gugiatti E, Santamaria S, Ledda B. Berberine affects mitochondrial activity and cell growth of leukemic cells from chronic lymphocytic leukemia patients. Sci Rep 2020; 10:16519. doi: 10.1038/s41598-020-73594-z [Crossref] [ Google Scholar]
- Zhang X, Hu M, Li S, Sha S, Mao R, Liu Y. Clinical study on Yanghe decoction in improving neo-adjuvant chemotherapy efficacy and immune function of breast cancer patients. Medicine (Baltimore) 2022; 101:e29031. doi: 10.1097/md.0000000000029031 [Crossref] [ Google Scholar]
- Shen H, Sun CC, Kang L, Tan X, Shi P, Wang L. Low-dose salinomycin inhibits breast cancer metastasis by repolarizing tumor hijacked macrophages toward the M1 phenotype. Eur J Pharm Sci 2021; 157:105629. doi: 10.1016/j.ejps.2020.105629 [Crossref] [ Google Scholar]
- Versini A, Colombeau L, Hienzsch A, Gaillet C, Retailleau P, Debieu S. Salinomycin derivatives kill breast cancer stem cells by lysosomal iron targeting. Chemistry 2020; 26:7416-24. doi: 10.1002/chem.202000335 [Crossref] [ Google Scholar]
- Fedorova O, Daks A, Parfenyev S, Shuvalov O, Netsvetay S, Vasileva J. Zeb1-mediated autophagy enhances resistance of breast cancer cells to genotoxic drugs. Biochem Biophys Res Commun 2022; 589:29-34. doi: 10.1016/j.bbrc.2021.11.088 [Crossref] [ Google Scholar]
- Ren K, He J, Qiu Y, Xu Z, Wang X, Li J. A neutrophil-mediated carrier regulates tumor stemness by inhibiting autophagy to prevent postoperative triple-negative breast cancer recurrence and metastasis. Acta Biomater 2022; 145:185-99. doi: 10.1016/j.actbio.2022.04.017 [Crossref] [ Google Scholar]
- Fong W, To KKW. Repurposing chloroquine analogs as an adjuvant cancer therapy. Recent Pat Anticancer Drug Discov 2021; 16:204-21. doi: 10.2174/1574892815666210106111012 [Crossref] [ Google Scholar]
- Lamprou I, Tsolou A, Kakouratos C, Mitrakas AG, Xanthopoulou ET, Kassela K. Suppressed PLIN3 frequently occurs in prostate cancer, promoting docetaxel resistance via intensified autophagy, an event reversed by chloroquine. Med Oncol 2021; 38:116. doi: 10.1007/s12032-021-01566-y [Crossref] [ Google Scholar]
- Wang J, Liang D, Zhang XP, He CF, Cao L, Zhang SQ. Novel PI3K/Akt/mTOR signaling inhibitor, W922, prevents colorectal cancer growth via the regulation of autophagy. Int J Oncol 2021; 58:70-82. doi: 10.3892/ijo.2020.5151 [Crossref] [ Google Scholar]
- Hwang JR, Kim WY, Cho YJ, Ryu JY, Choi JJ, Jeong SY. Chloroquine reverses chemoresistance via upregulation of p21(WAF1/CIP1) and autophagy inhibition in ovarian cancer. Cell Death Dis 2020; 11:1034. doi: 10.1038/s41419-020-03242-x [Crossref] [ Google Scholar]
- Fu S, Liu L, Wang Y, Liu W, Sun S, Gao XL. Hydroxychloroquine inhibits the growth of lung cancer cells by inducing G1 cell cycle arrest and apoptosis. Pak J Pharm Sci 2024; 37:981-91. [ Google Scholar]
- Ziegler DV, Huber K, Fajas L. The intricate interplay between cell cycle regulators and autophagy in cancer. Cancers (Basel) 2021; 14:153. doi: 10.3390/cancers14010153 [Crossref] [ Google Scholar]
- Glaviano A, Foo AS, Lam HY, Yap KC, Jacot W, Jones RH. PI3K/AKT/mTOR signaling transduction pathway and targeted therapies in cancer. Mol Cancer 2023; 22:138. doi: 10.1186/s12943-023-01827-6 [Crossref] [ Google Scholar]
- Alqahtani T, Kumarasamy VM, Huczyński A, Sun D. Salinomycin and its derivatives as potent RET transcriptional inhibitors for the treatment of medullary thyroid carcinoma. Int J Oncol 2020; 56:348-58. doi: 10.3892/ijo.2019.4916 [Crossref] [ Google Scholar]
- Xu Z, Han X, Ou D, Liu T, Li Z, Jiang G. Targeting PI3K/AKT/mTOR-mediated autophagy for tumor therapy. Appl Microbiol Biotechnol 2020; 104:575-87. doi: 10.1007/s00253-019-10257-8 [Crossref] [ Google Scholar]
- Wang K, Tang J, Fan S, Su H, Yu R, Zhang Y. ABBV-744 induces autophagy in gastric cancer cells by regulating PI3K/AKT/mTOR/p70S6k and MAPK signaling pathways. Neoplasia 2023; 45:100936. doi: 10.1016/j.neo.2023.100936 [Crossref] [ Google Scholar]