Bioimpacts. 2025;15:31075.
doi: 10.34172/bi.31075
Original Article
MicroRNA-372-3p impairs fatty acid metabolism in hepatocellular carcinoma cells by targeting CPT1A and ACSL4
Chinnatam Phetkong Data curation, Formal analysis, Investigation, Methodology, Validation, Writing – original draft, 1, 2, 3 
Thammachanok Boonto Investigation, Methodology, 2, 3
Pannathon Thamjamrassri Investigation, Methodology, 2, 3
Chaiyaboot Ariyachet Conceptualization, Funding acquisition, Project administration, Resources, Supervision, Visualization, Writing – review & editing, 1, 2, 3, *
Pisit Tangkijvanich Funding acquisition, Resources, 2, 3
Author information:
1Medical Science Program, Faculty of Medicine, Chulalongkorn University, Bangkok, 10330, Thailand
2Department of Biochemistry, Faculty of Medicine, Chulalongkorn University, Bangkok, 10330, Thailand
3Center of Excellence in Hepatitis and Liver Cancer, Faculty of Medicine, Chulalongkorn University, Bangkok, 10330, Thailand
Abstract
Introduction:
Hepatocellular carcinoma (HCC) remains a major cause of cancer mortality, and effective therapeutic options are limited. MicroRNA‑372‑3p (miR‑372‑3p) has been implicated in HCC, yet its exact role is unclear.
Methods:
We established miR‑372‑3p‑overexpressing HCC cell lines (HepG2, SNU‑449, JHH‑4) via lentiviral transduction. Malignant phenotypes were assessed with MTT, transwell migration/invasion, and colony‑formation assays. Transcriptomic changes were analyzed by RNA‑sequencing followed by Gene Set Enrichment Analysis. Lipid metabolism was examined using BODIPY/Oil Red O staining, triglyceride quantification, FAOBlue assays, and organelle colocalization imaging. Candidate targets of miR‑372‑3p were computationally predicted and validated by dual‑luciferase reporter assays.
Results:
miR‑372‑3p overexpression significantly reduced cell proliferation by more than 50%, migration by over 30%, invasion by over 30%, and colony formation by more than 50%, supporting its tumor-suppressive role. Transcriptomic analysis identified 1,759 downregulated genes, significantly enriched in pathways associated with fatty acid oxidation (FAO). miR‑372‑3p‑overexpressing cells exhibited increased lipid droplet accumulation, with triglyceride levels elevated by more than 50% and an approximate 50% reduction in FAO activity, indicating defective use under glucose-deprived conditions. High-resolution organelle imaging further revealed diminished physical contacts between lipid droplets and mitochondria, as well as a similar disruption in lipid droplet–lysosome interactions. Dual-luciferase reporter assays confirmed CPT1A and ACSL4 as direct targets of miR‑372‑3p.
Conclusion:
miR‑372‑3p functions as a tumor suppressor in HCC by directly downregulating CPT1A and ACSL4, thereby inhibiting FAO and disrupting lipid metabolism. Targeting this miRNA and FAO axis may offer a novel therapeutic strategy for HCC.
Keywords: microRNA, miR-372-3p, Hepatocellular carcinoma, Lipid metabolism, Fatty acid oxidation, CPT1A, ACSL4
Copyright and License Information
© 2025 The Author(s).
This work is published by BioImpacts as an open access article distributed under the terms of the Creative Commons Attribution Non-Commercial License (
http://creativecommons.org/licenses/by-nc/4.0/). Non-commercial uses of the work are permitted, provided the original work is properly cited.
Funding Statement
This work was financially supported by the Thailand Science Research and Innovation Fund, Chulalongkorn University (HEAF68300072); the Ratchadaphiseksomphot Fund, Graduate Affairs, Faculty of Medicine, Chulalongkorn University (GA66/076 and GA67/003); and the National Science Research and Innovation Fund (NSRF) through the Program Management Unit for Human Resources & Institutional Development, Research and Innovation (PMU-B, B36G660010). C. Phetkong was supported by a scholarship from the Graduate School, Chulalongkorn University, in commemoration of the 72nd anniversary of His Majesty King Bhumibol Adulyadej.
Introduction
Hepatocellular carcinoma (HCC) is the predominant form of primary liver cancer, is a considerable global health challenge and is a predominant factor in cancer-associated mortality, ranking third worldwide.1 By 2040, liver cancer is projected to affect approximately 0.9 million males and 0.4 million females, with mortality rates expected to rise to 0.8 million in males and 0.38 million in females, representing a 55% overall increase.2 This rising incidence is attributed to several risk factors, comprising chronic hepatitis B (HBV) or hepatitis C (HCV) infections, exposure to aflatoxin-contaminated food, excessive alcohol use or alcohol-related liver disease (ALD), and the increasing incidence of metabolic dysfunction-associated steatotic liver disease (MASLD).3 Notably, the incidence of MASLD is projected to increase from 83.1 million in 2015 to 100.9 million by 2030, with an estimated 20% progressing to HCC, underscoring its growing clinical significance.4,5 Despite advancements in hepatocellular carcinoma (HCC) screening and treatment modalities including computed tomography, magnetic resonance imaging, liver biopsy, surgery, liver transplantation, radiation, and chemotherapy, the prognosis for advanced HCC remains poor. The situation underscores the urgent need for innovative therapeutic strategies.6
In recent years, molecular targeted therapy has surfaced as a viable approach for cancer treatment. Among the various molecular targets, microRNAs (miRNAs) have attracted significant attention owing to their crucial function in post-transcriptional gene regulation.7,8 These small non-coding RNAs are ~22 nucleotides long. They regulate gene expression by binding to mRNAs, causing degradation or translational repression. miRNAs can act as tumor suppressors or oncogenes, contingent upon the target genes and signaling pathways they modulate.9-11 An increasing amount of information suggests that miRNAs are essential in regulating various biological processes involved in HCC development and progression.11,12
MicroRNA-372-3p (miR-372-3p), a small non-coding RNA originating from the miR-371-373 gene cluster located on chromosome 19q13.42,13 has emerged as a key player in HCC. miR-372-3p regulates cell proliferation, apoptosis, and metastasis, and enhances chemotherapy response by acting as a tumor suppressor targeting the anti-apoptotic gene Mcl-1.14 Moreover, miR-372-3p is negatively correlated with the oncogenic long non-coding RNA (lncRNA) OSER1-AS1, which promotes Rab23 expression and drives tumor progression.15 miR-372-3p also regulates rapamycin-induced triglyceride accumulation via the lncRNA NEAT1/miR-372-3p/AGPS/APOC4 axis, further emphasizing its potential as a therapeutic target in HCC.16 Although miR-372-3p has been implicated in diverse aspects of HCC progression, its precise function remains contentious, with studies reporting both tumor-suppressive and oncogenic activities.17 To resolve this ambiguity, we employed a transcriptomic approach to define the mechanistic role of miR-372-3p in HCC cells. Our findings demonstrate that miR-372-3p directly impacts lipid metabolism by inhibiting fatty acid oxidation (FAO), thereby revealing a novel metabolic vulnerability in HCC and suggesting its potential as a therapeutic target for this devastating malignancy.
Materials and Methods
Cell culture and lentiviral transduction
The human hepatocellular carcinoma cell lines HepG2 (Cat # HB-8065) and SNU-449 (Cat # CRL-2234), along with the non-tumorigenic human hepatocyte cell line THLE-2 (Cat # CRL-2706), were procured from the American Type Culture Collection (ATCC; Rockville, MD, USA), while the JHH-4 cell line (Cat # JCRB0435) was sourced from the Japanese Collection of Research Bioresources Cell Bank (JCRB; Tokyo, Japan). Cells were cultured in complete growth media (CGM) according to the manufacturers’ protocols and kept at 37 °C in a 5% CO₂ incubator. To establish miR-372-3p-overexpressing (372-OE) HCC cells, we employed a lentiviral vector. The pre-miRNA sequence of miR-372-3p was amplified and cloned into an EcoRI/BamHI-digested pLVX-EF1α-IRES-Puro vector (Addgene plasmid #85132). Lentivirus was generated using second-generation packaging plasmids (pMD2.G, Addgene plasmid #12259, and psPAX2, Addgene plasmid #12260), as previously described.18 Successfully transduced cells were selected with puromycin, and miR-372-3p expression levels were verified by qRT-PCR. The primers used for cloning are listed in Table S1.
Cell proliferation and colony formation assays
Cell proliferation was evaluated by the MTT assay (Invitrogen, Carlsbad, CA, USA). Briefly, HCC cells were cultured in basal medium with 0.5 µg/mL MTT for 60 minutes. Formazan crystals formed during incubation were dissolved in DMSO, and absorbance at 570 nm was measured using a BioTek Synergy HTX Multi-Mode Microplate Reader (Thermo Scientific, Carlsbad, CA, USA). For the colony formation assay, a total of 500–2,000 cells were seeded in 6-well plates, incubated for 2 to 3 weeks, subsequently fixed with methanol, and then stained with crystal violet, and counted for visible colonies containing at least 50 individual cells.
Cell migration and invasion assays
Cell migration and invasion evaluates were conducted with transwell inserts with an 8 μm pore diameter in 24-well plates (Corning, Corning, NY, USA, Cat # 3428). For the invasion assay, the inserts were pre-coated with 200 μg/mL. Matrigel matrix (Corning, Cat #354234) in basal medium. A total of 1 × 10⁵ cells in serum-free media were added into the upper chamber, while cell growth medium was added into the well. Following a duration of 24 hours for SNU-449 and JHH-4, or 96 hours for HepG2, the inserts were fixed with methanol. and subsequently stained with crystal violet. Images were obtained utilizing an EVOS FL Auto 2 Imaging System (Invitrogen). in automated mode, acquiring 10 random fields per insert at a 10X objective. Cell counts in each field were quantified using CELLCOUNTER software19 to evaluate migrated and invaded cells.
RNA sequencing analysis
Total RNA from control and miR-372-3p overexpressing HCC cells was evaluated for quality and integrity utilizing the Agilent Bioanalyzer 2100 system, and RNA libraries were produced with the NEBNext® UltraTM RNA Library Preparation Kit for Illumina®, proceeded by sequencing on the Illumina NovaSeq 6000 platform. Data visualization and analysis were conducted utilizing GraphPad Prism version 10. (GraphPad, San Diego, CA, USA), generating volcano plots and heat maps, with differentially expressed genes (DEGs) selected based on an FDR-adjusted P value < 0.05 and |log2(fold change)| > 0.5. Downregulated DEGs were then analyzed using Gene Ontology Biological Process (GOBP) and Kyoto Encyclopedia of Genes and Genomes (KEGG) databases via ShinyGO 0.77 (http://bioinformatics.sdstate.edu/go77/).20 Gene set enrichment analysis (GSEA) (version 4.3.2)21,22 was employed to explore associations pathway, with the Pathview maps (https://pathview.uncc.edu/)23-25 used to visualize expression localization within identified KEGG pathways. Furthermore, the Search Tool for the Retrieval of Interacting Genes (STRING) database (version 12)26 was utilized to analyze protein–protein interactions among the ten core enrichment genes involved in fatty acid metabolism, applying a default medium confidence score of 0.4.
qRT-PCR analysis
Total and small RNA were isolated using the GeneAll Hybrid-R miRNA kit (General Biosystems, Seoul, Korea, Cat # 325-150). cDNA was synthesized using the RevertAid First Strand cDNA Synthesis Kit (Thermo Scientific, Cat # K1622). Quantitative reverse transcription polymerase chain reaction (qRT-PCR) was performed using a QuantStudioTM 3 Real-Time PCR System (Thermo Scientific) and CAPITALTM qPCR Green Mix HRox (biotechrabbit; Cat # BR0501902). Gene expression levels were measured using the 2-ΔΔCt method, with RPL19 serving as the reference gene. Primer sequences are provided in Table S1.
Lipid droplet induction
Lipid droplet (LD) accumulation was induced by supplementing the CGM with fatty acids (FAs). A 5 mM stock solution of palmitic acid (PA) (Sigma-Aldrich, Cat # 57-10-3) was prepared in ethanol. Oleic acid (OA) (Sigma-Aldrich, Cat # O3008) was added to the PA stock solution to achieve a 2:1 OA:PA molar ratio.27 Cells were treated with the FA mixture at final concentrations of 0 mM (vehicle control, ethanol only), 0.5 mM, or 1 mM for 48 hours.
BODIPY and oil red O staining
Cells were fixed in 4% paraformaldehyde (PFA), permeabilized with 0.1% Triton X-100 for 10 minutes, then stained with Boron-dipyrromethene 493/503 (BODIPYTM 493/503; Sigma-Aldrich; Cat # 790389) and 4′,6-Diamidino-2-phenylindole (DAPI; Invitrogen; Cat # 00-4959-52) in PBS for 15 minutes. For oil red O (ORO) staining, cells were rinsed with PBS, fixed in 4% PFA, washed with PBS, fixed in 60% isopropanol, and stained with a 0.5% ORO solution for 10 minutes. Excess stains were removed by additional PBS washes. Images were acquired in automated mode using an EVOS FL Auto 2 Imaging System (Invitrogen), capturing nine areas per well at 40X with GFP and DAPI channels imaged at equivalent exposures. Each condition was analyzed in triplicates. For image analysis, BODIPY/DAPI staining was quantified to determine LDs per cell using CellProfiler (Broad Institute, Cambridge, MA, USA), as previously described.28 while LDs per field in ORO staining was analyzed using Fiji software as previously described.29
Triglyceride assay
Triglyceride levels were quantified with the Triglyceride Assay Kit (Abcam, Cat # ab65336) in compliance with the manufacturer's specifications. Cells were rinsed, subjected to trypsinization, centrifuged, and subsequently resuspended in 5% NP-40. The samples were frozen at -80°C, heated to 100°C for 5 minutes, then centrifuged at full speed for 2 minutes. The supernatant was diluted and mixed with the triglyceride reagent. After 60 minutes of incubation at room temperature, absorbance was measured at 570 nm. Triglyceride levels were calculated after subtracting background signal from blank wells.
Fatty acid oxidation assay
FAO was measured using FAOBlue (Funakoshi, Tokyo, Japan, Cat # FDV-0033). Briefly, cells were seeded in a 96-well plate, rinsed with PBS, then incubated with 5 µM FAOBlue. in Hank's Balanced Salt Solution (HBSS). Fluorescence intensity was measured using the Varioskan LUX Multimode Microplate Reader (Thermo Scientific, Waltham, MA, USA) continuously at 37 °C, used (λex/em = 380/650 nm), every 1 minute and 30 seconds for a total duration of 90 minutes. The data were plotted as fluorescence intensity versus time, with corrections made by subtracting the signal from control wells. Subsequently, linear regression was employed to ascertain the slope of fluorescence intensity over time.
Glucose deprivation assay
HCC cells were treated with the FA mixture (0.5 mM for SNU-449 cells and 1 mM for JHH-4 cells) for 48 hours to induce lipid droplet accumulation and separated into two groups. The first group was rinsed with PBS and subsequently fixed with 4% PFA. and served as baseline control. The second group was carried on for the glucose deprivation condition where the FA-containing medium was replaced with glucose-free DMEM (Gibco, Cat # 11966025) supplemented with 10% dialyzed FBS (Gibco, Cat # A33820011X). After 24-48 hours, glucose-deprived cells were collected, rinsed with PBS, and fixed with 4% PFA. All fixed samples were subsequently stained with BODIPY and DAPI and analyzed as above described.
Confocal microscopy
HCC cells were seeded on 13 mm poly-D-lysine (PDL)-coated coverslips within a 24-well plate and treated with FA at concentrations of 0 mM, 0.5 mM, and 1 mM for 48 hours in HepG2, SNU-449, and JHH-4 cell lines, respectively. Following treatment, cells were stained with 1X BODIPY, 500 nM MitoSpy Red CMXRos (BioLegend, San Diego, CA, USA, Cat # 424805), and 1X LysoView 633 (Biotium, Fremont, CA, USA, Cat # 70058) for 30 minutes at 37 °C. Following labeling, cells were rinsed with PBS, fixed in 4% PFA for 15 minutes, and mounted using Fluoromount-G containing DAPI (Invitrogen, Cat # 00-4959-52). Images were captured using a Zeiss-LSM-980 confocal microscope with a 63X oil-immersion objective, acquiring z-stacks at 1 µm intervals across four channels (Cy5, MitoTracker Red, AF488, and DAPI) using separate tracks to generate a Maximum Intensity Projection (MIP). Image analysis and processing were conducted using the ZEN 2.3 Lite (Zeiss) and ImageJ Fiji (National Institutes of Health), with individual cells manually selected. For colocalization analysis, interactions between LD, mitochondria (MT), and lysosomes (LS) were identified using the BIOP JACoP plugin, with thresholding applied via the Costes method, and colocalization was reported using Manders' overlap coefficient (M1), where values greater than 0.1 indicated colocalization.30 MT morphology and dynamics were assessed using the Mitochondria Analyzer plugin, with cells segmented and thresholding applied based on the weighted mean method.31
Transmission electron microscopy
SNU-449 cells were treated with a 0.5 mM FA mixture for 48 hours and subsequently fixed with 3% glutaraldehyde for 2 hours. Fixed cells were rinsed three times with PBS, mechanically scraped, resuspended in PBS, and collected in PBS. The cell suspension was subsequently centrifuged at 1100 × g for 10 minutes.32 Post-fixation was performed with osmium tetroxide at room temperature (RT) for 45 minutes, followed by PBS washes. Cells were dehydrated using a graded ethanol series (50%, 70%, 85%, 90%, 95%, and 100%) with a 10-minute incubation at each concentration. Infiltration was carried out through sequential treatments with propylene oxide for 3 minutes, repeated twice, after which the cells were embedded in resin. Ultrathin sections (60–100 nm) were cut parallel to the cellular monolayer using a transmission electron microscope (JEOL JEM-1400Plus) at 15kX magnification. For image analysis, LD-MT contacts,33 as well as mitochondrial area and Feret diameter, were quantified as previously described.34
miRNA-mRNA target prediction and dual luciferase reporter assay
The interactions between ten downregulated core enrichment genes and their predicted miRNA-mRNA targets were analyzed using the multiMiR R package35 with a scoring threshold of ≥ 1, and binding sites were predicted using RNA hybrid tools (https://bibiserv.cebitec.uni-bielefeld.de/rnahybrid).36 The three genes with the lowest minimum free energy (MFE) including CPT1A, ACSL4, and CPT2 were chosen for confirmation using the dual luciferase reporter experiment. The wild-type (WT) and mutant (MUT) sequences of the 3′ untranslated region (3' UTR) of these genes were inserted into p multiMiR GLO vectors (Promega; Cat # E133A) via SacI and XhoI digestion, whereas miR-372-3p was independently cloned using BamHI/HindIII-cut pSilencer (Addgene plasmid; Cat # 85132). The primers used for the cloning are provided in Table S1. HEK293FT cells were co-transfected with these constructs, Luciferase activity was assessed after 48 hours using the BioTek Synergy HTX Multi-Mode Microplate Reader. The activity of Firefly luciferase was adjusted to that of Renilla luciferase to determine relative luciferase activity.
Statistical analysis
Data are presented as mean ± standard deviation (SD). Statistical analysis was performed using GraphPad Prism version 10 (GraphPad Software, San Diego, CA, USA). An unpaired, two-tailed Student's t-test was employed for comparisons between two groups. One-way analysis of variance (ANOVA) was conducted for comparisons involving three or more groups. A P value less than 0.05 was deemed statistically significant. All experiments were independently replicated a minimum of two times, with at least three replicates for each condition.
Results
miR-372-3p expression is downregulated in HCC cells and overexpression impairs malignant phenotypes
To explore the functional relevance of miR-372-3p, we initially assessed its expression levels in three HCC cell lines. (HepG2, SNU-449, and JHH-4) compared to the non-tumorigenic human hepatocyte cell line, THLE-2. Quantitative RT-PCR (qRT-PCR) analysis revealed a significant downregulation of miR-372-3p in all HCC cell lines compared to THLE-2 cells (Fig. 1A), suggesting a potential tumor-suppressive function. To further explore this hypothesis, we generated miR-372-3p-overexpressing (372-OE) HCC cell lines using a lentiviral expression system. Following transduction with a miR-372-3p-expressing lentivirus and selection with puromycin, stable 372-OE cell lines were established. qRT-PCR confirmed significant upregulation of miR-372-3p expression in the 372-OE cell lines in comparison to control cells transduced using an empty vector (Fig. 1B).
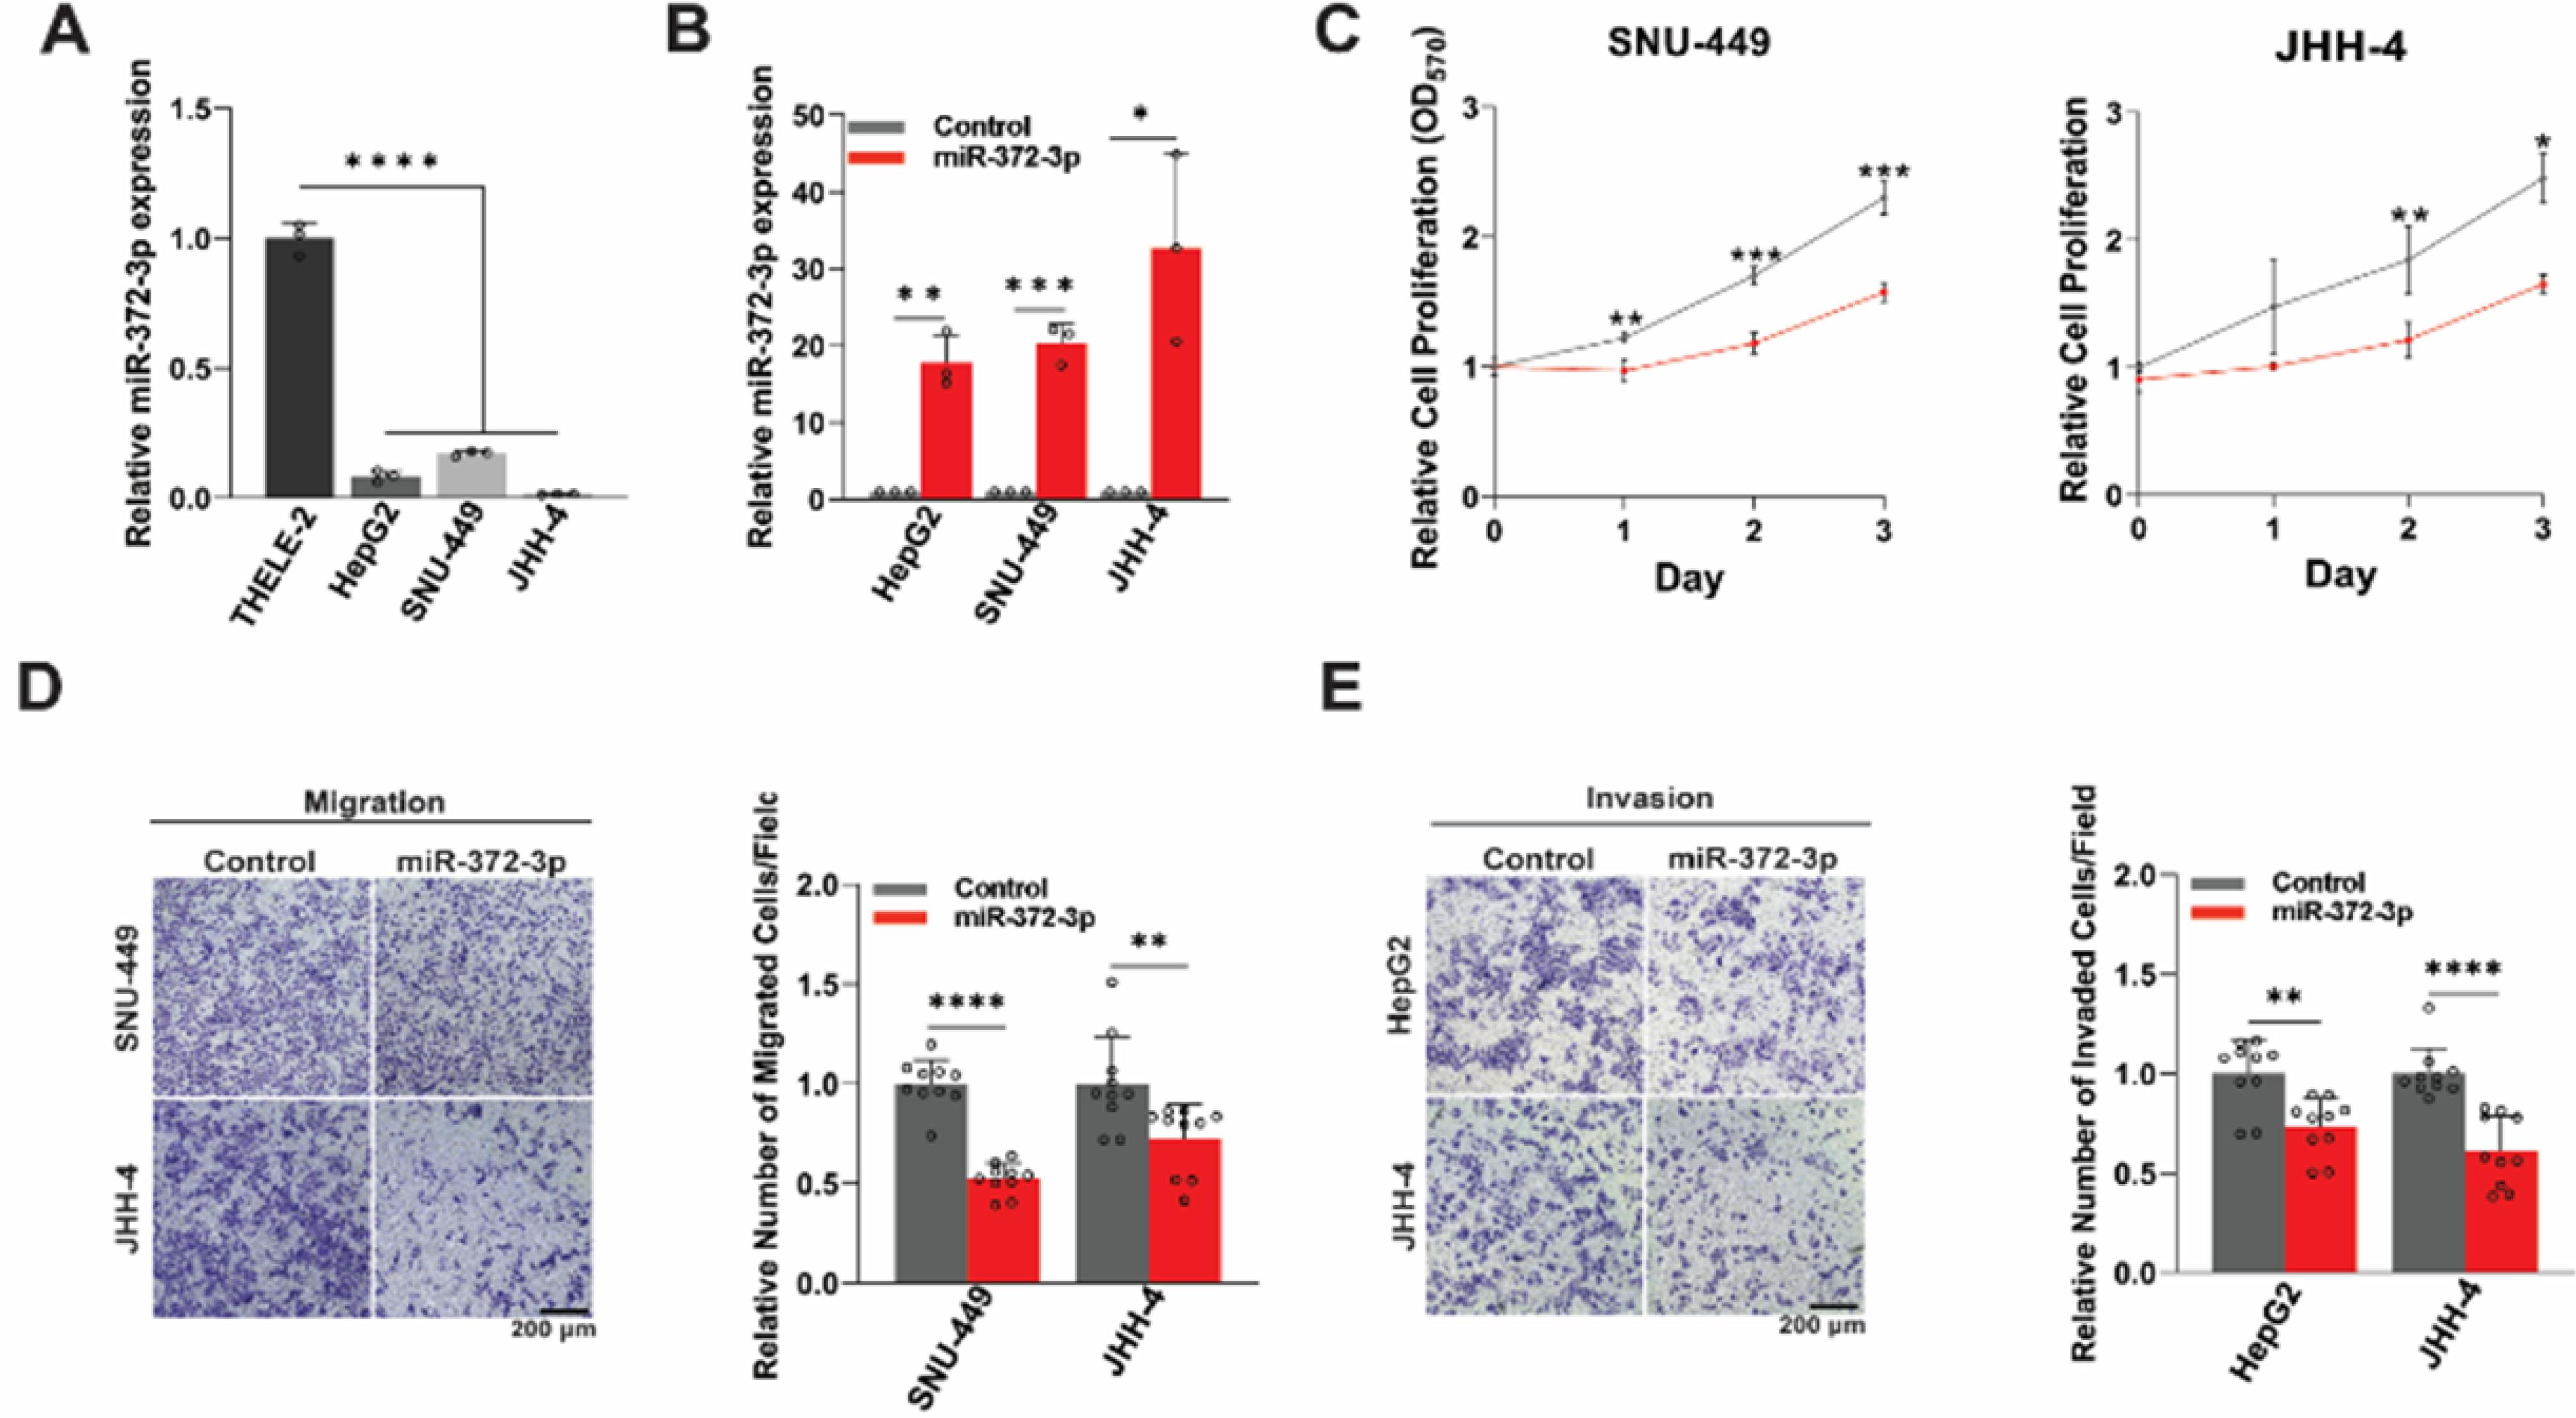
Fig. 1.
Overexpression of miR-372-3p impairs malignant phenotypes of HCC cells. (A) qRT-PCR analysis of miR-372-3p expression in the non-tumorigenic human hepatocyte cell line (THLE-2) compared to three independent HCC cell lines (HepG2, SNU-449, and JHH-4) (n = 3). (B) Lentiviral transduction-mediated miR-372-3p-overexpression (372-OE) in HCC cell lines compared to the control (n = 3). (C) MTT assay assessing the effect of miR-372-3p on HCC cell proliferation (n = 3). (D-E) Transwell migration and invasion assays of control and 372-OE HCC cells with representative images and quantification of relative migrated/invaded cells per field (n = 10). All experiments were quantified using Fiji software, normalized to the control group, and analyzed using one-way ANOVA or Student’s t-test. Data are presented as mean ± SD, with significance levels indicated as *P < 0.05, **P < 0.01, ***P < 0.001, and ****P < 0. 0001. OD: optical density.
.
Overexpression of miR-372-3p impairs malignant phenotypes of HCC cells. (A) qRT-PCR analysis of miR-372-3p expression in the non-tumorigenic human hepatocyte cell line (THLE-2) compared to three independent HCC cell lines (HepG2, SNU-449, and JHH-4) (n = 3). (B) Lentiviral transduction-mediated miR-372-3p-overexpression (372-OE) in HCC cell lines compared to the control (n = 3). (C) MTT assay assessing the effect of miR-372-3p on HCC cell proliferation (n = 3). (D-E) Transwell migration and invasion assays of control and 372-OE HCC cells with representative images and quantification of relative migrated/invaded cells per field (n = 10). All experiments were quantified using Fiji software, normalized to the control group, and analyzed using one-way ANOVA or Student’s t-test. Data are presented as mean ± SD, with significance levels indicated as *P < 0.05, **P < 0.01, ***P < 0.001, and ****P < 0. 0001. OD: optical density.
We then assessed the impact of miR-372-3p overexpression on several malignant phenotypes of HCC cells. MTT assays demonstrated that miR-372-3p overexpression significantly suppressed cell proliferation (Fig. 1C and Fig. S1A). Furthermore, miR-372-3p overexpression significantly reduced cell migration and invasion (Figs. 1D, E). Consistent with these findings, 372-OE cells exhibited a reduced capacity for colony formation (Fig. S1B). These results collectively indicate that miR-372-3p functions as a tumor-suppressive microRNA in HCC cells.
Transcriptomic analysis reveals that miR-372-3p regulates fatty acid metabolism in HCC cells.
To elucidate the molecular mechanisms that govern the functioning of miR-372-3p in HCC, we performed RNA sequencing (RNA-seq) on 372-OE HCC cells. Differential gene expression analysis identified 17,026 genes, of which 1,579 were significantly upregulated and 1,759 were significantly downregulated (FDR-adjusted P < 0.05 and |log2 fold change| > 0.5) (Fig. 2A and Supplementary file 1). Given that miRNAs typically repress target mRNA expression, we focused on the downregulated DEGs for further analysis.
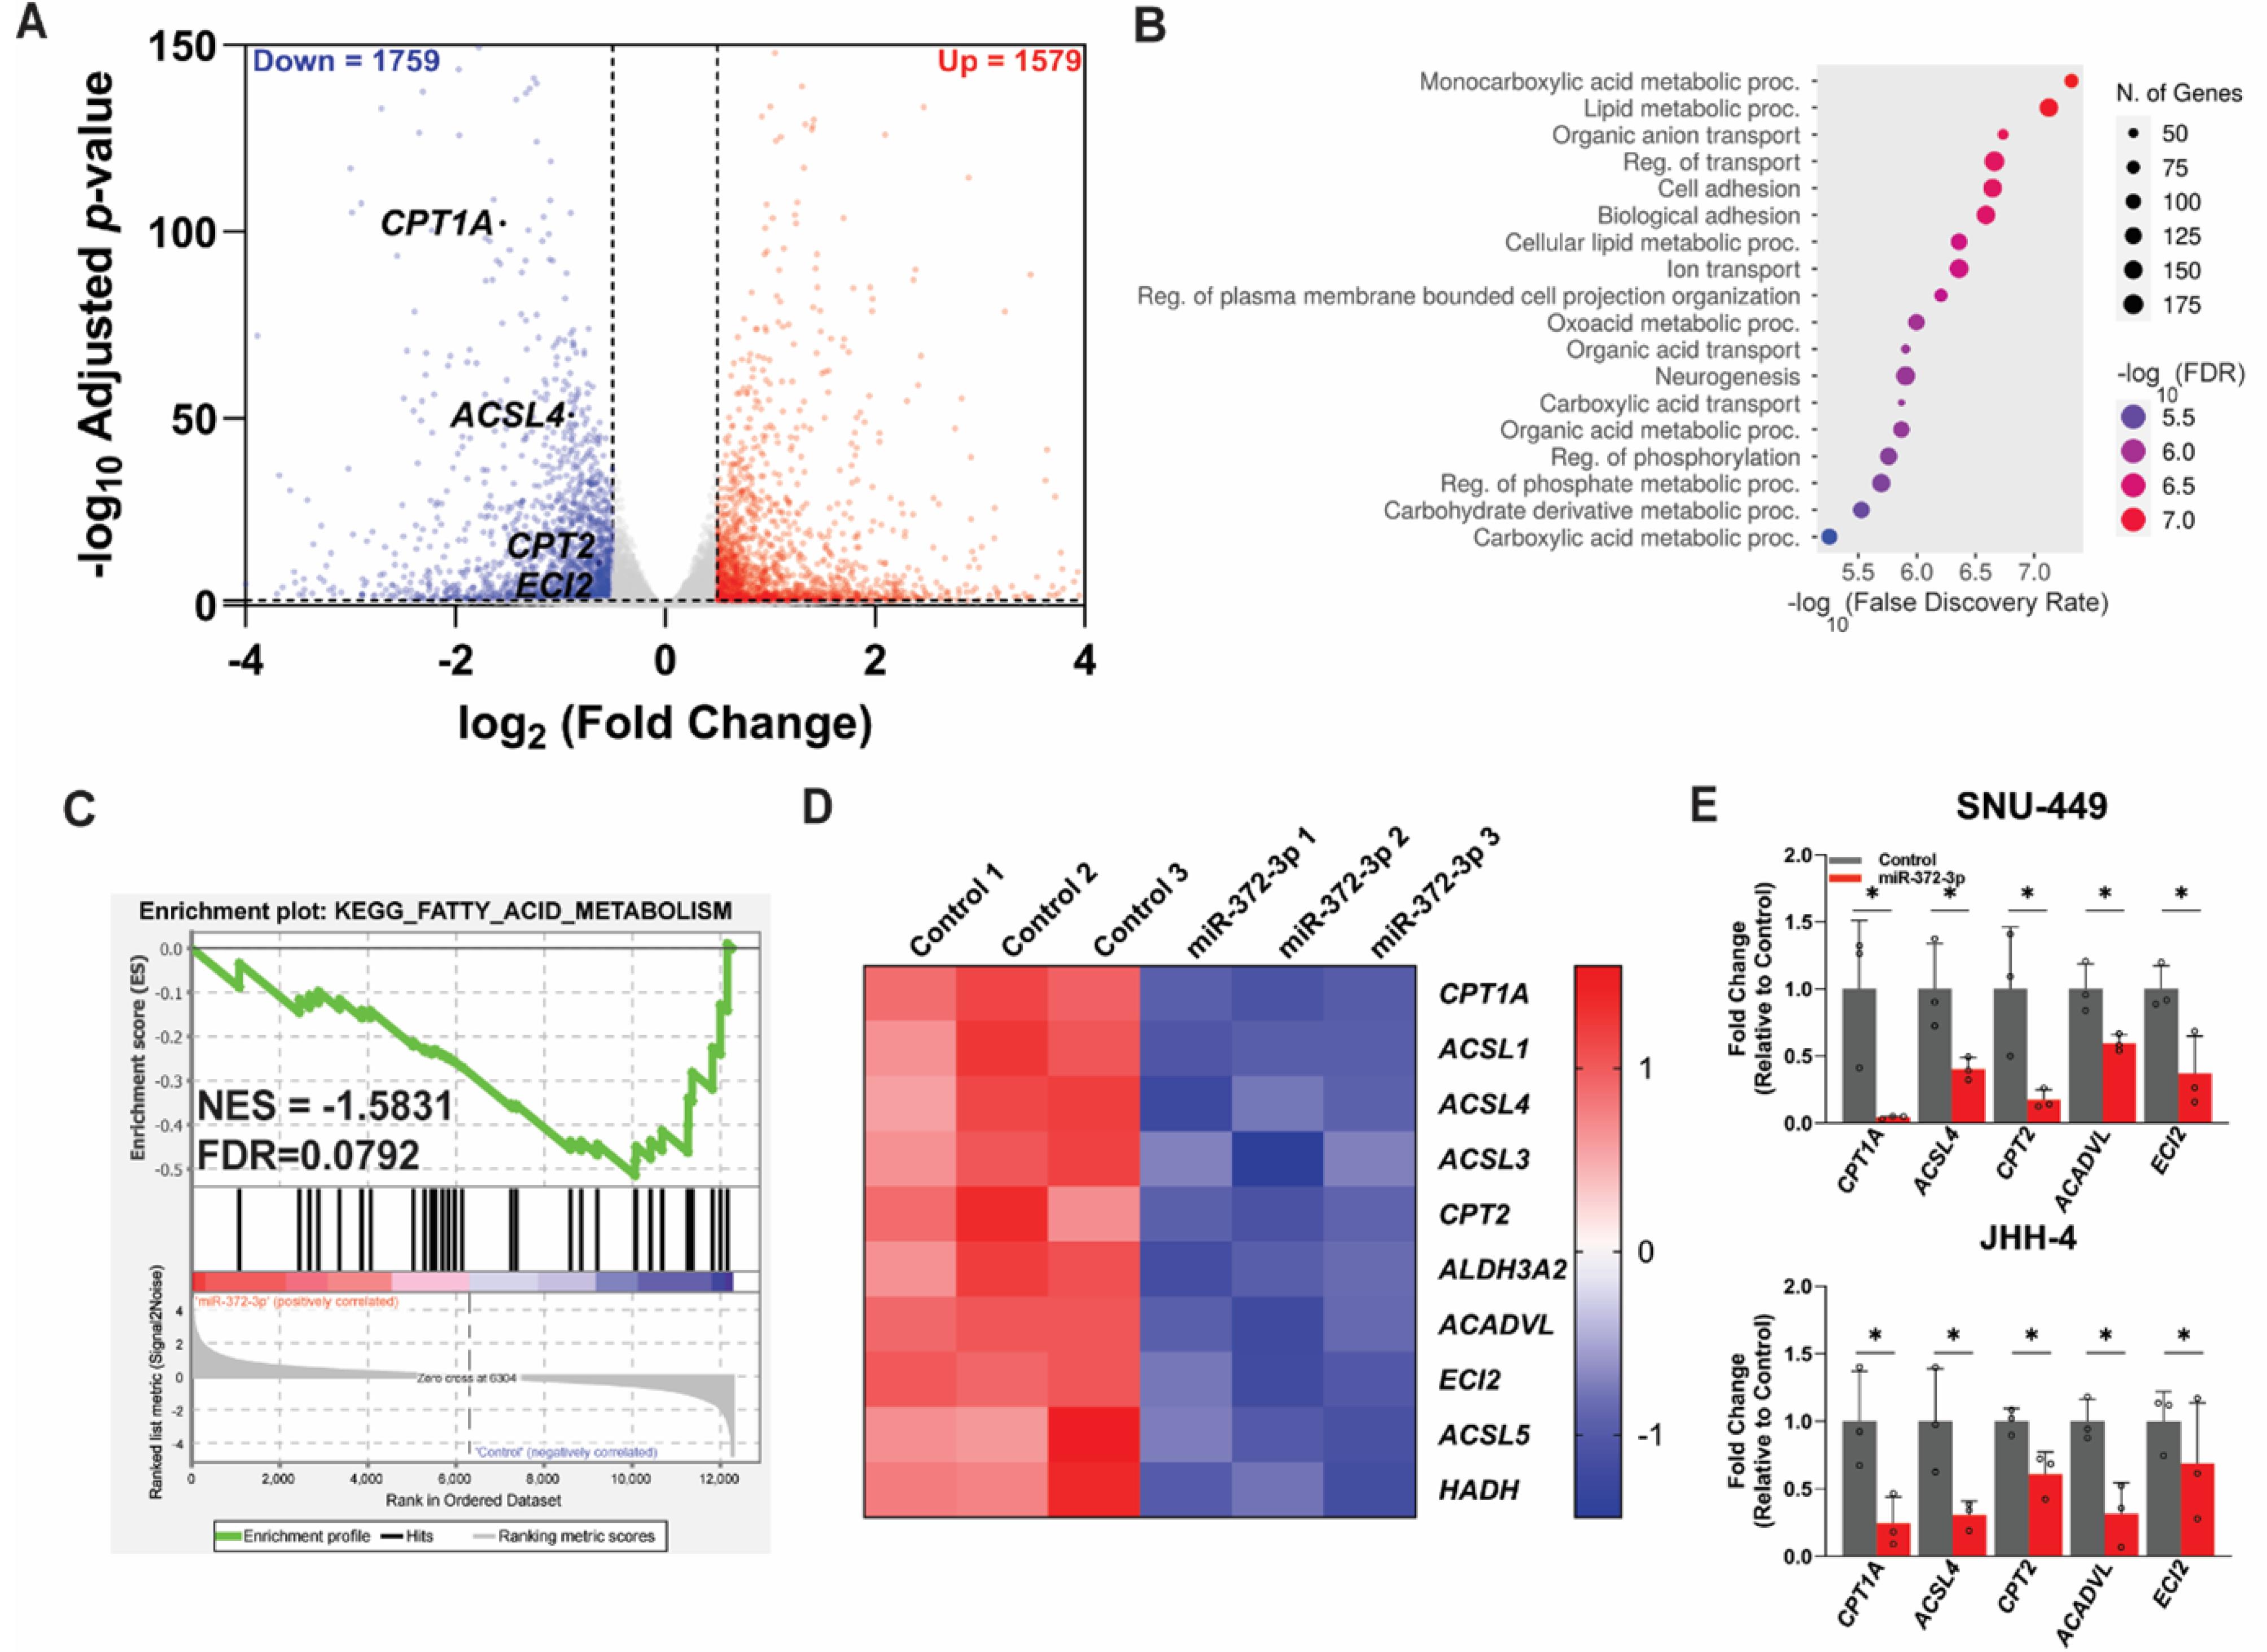
Fig. 2.
RNA-sequencing analysis of HCC cells with miR-372-3p overexpression. (A) Volcano plot displaying differentially expressed genes (DEGs) in 372-OE compared to control cells. Gray nodes represent not significant genes, while red and blue nodes indicate upregulated (n = 1,579) and downregulated (n = 1,759) genes, respectively. DEGs were identified using an FDR-adjusted P value < 0.05 and a log₂fold change threshold of |0.5|. (B) Enrichment analysis of downregulated DEGs using the Gene Ontology Biological Process (GOBP) performed via ShinyGO, with an FDR cutoff of 0.05. (C) Gene Set Enrichment Analysis (GSEA) identified a downregulation of DEGs involved in fatty acid metabolism. (D) The heatmap visualizes the core enrichment genes expression patterns of fatty acid metabolism, where red and blue represent upregulated and downregulated genes. (E) qRT-PCR validation of fatty acid metabolism genes identified in RNA-seq analysis (n = 3). All experiments were normalized to the control group and analyzed using Student’s t-test. Data are presented as mean ± SD, with significance levels indicated as *p < 0.05. NES: Normalized enrichment score, FDR: False discovery rate, proc: process.
.
RNA-sequencing analysis of HCC cells with miR-372-3p overexpression. (A) Volcano plot displaying differentially expressed genes (DEGs) in 372-OE compared to control cells. Gray nodes represent not significant genes, while red and blue nodes indicate upregulated (n = 1,579) and downregulated (n = 1,759) genes, respectively. DEGs were identified using an FDR-adjusted P value < 0.05 and a log₂fold change threshold of |0.5|. (B) Enrichment analysis of downregulated DEGs using the Gene Ontology Biological Process (GOBP) performed via ShinyGO, with an FDR cutoff of 0.05. (C) Gene Set Enrichment Analysis (GSEA) identified a downregulation of DEGs involved in fatty acid metabolism. (D) The heatmap visualizes the core enrichment genes expression patterns of fatty acid metabolism, where red and blue represent upregulated and downregulated genes. (E) qRT-PCR validation of fatty acid metabolism genes identified in RNA-seq analysis (n = 3). All experiments were normalized to the control group and analyzed using Student’s t-test. Data are presented as mean ± SD, with significance levels indicated as *p < 0.05. NES: Normalized enrichment score, FDR: False discovery rate, proc: process.
Gene Ontology Biological Process (GOBP) analysis using ShinyGO 0.77 revealed significant enrichment of downregulated DEGs in lipid metabolism and cellular lipid processes (Fig. 2B). Kyoto Encyclopedia of Genes and Genomes (KEGG) pathway analysis further indicated involvement in metabolic pathways (Fig. S2A). Gene Set Enrichment Analysis (GSEA) corroborated the significant association of miR-372-3p with fatty acid metabolism pathways (FDR < 0.05). Ten core genes involved in FAO were identified, including CPT1A, ACSL1, ACSL4, ACSL3, CPT2, ALDH3A2, ACADVL, ECI2, ACSL5, and HADH (Figs. 2C, 2D). Pathview analysis further demonstrated downregulation of fatty acid biosynthesis, elongation, and degradation pathways within this regulatory network (Figs. S2B-D). STRING network analysis revealed that these ten FAO genes are enriched in GOBP terms related to positive regulation of long-chain fatty acid import across plasma membrane, carnitine shuttle, and long-chain fatty acyl-CoA biosynthetic process (Fig. S2E).
To validate the RNA-seq findings, we performed qRT-PCR analysis of the FAO genes in two HCC cell lines. The results confirmed significant downregulation of these genes in 372-OE cells compared to control cells (Fig. 2E). These data collectively demonstrate that miR-372-3p regulates fatty acid metabolism in HCC cells.
miR-372-3p overexpression promotes lipid accumulation and suppresses fatty acid oxidation in HCC cells
Given the crucial role of FAO in cancer metabolism and the link between impaired FAO and lipid accumulation,37-40 we investigated the effect of miR-372-3p overexpression on these pathways in HCC cells. BODIPY staining revealed a significant increase in the number of lipid droplets (LDs) per cell in 372-OE cells compared to control cells under the basal medium conditions (Fig. 3A). While FA treatment accentuated lipid accumulation in both groups, the effect was more pronounced in 372-OE cells (Fig. 3B). These results were corroborated by oil red O staining (Fig. S3A).
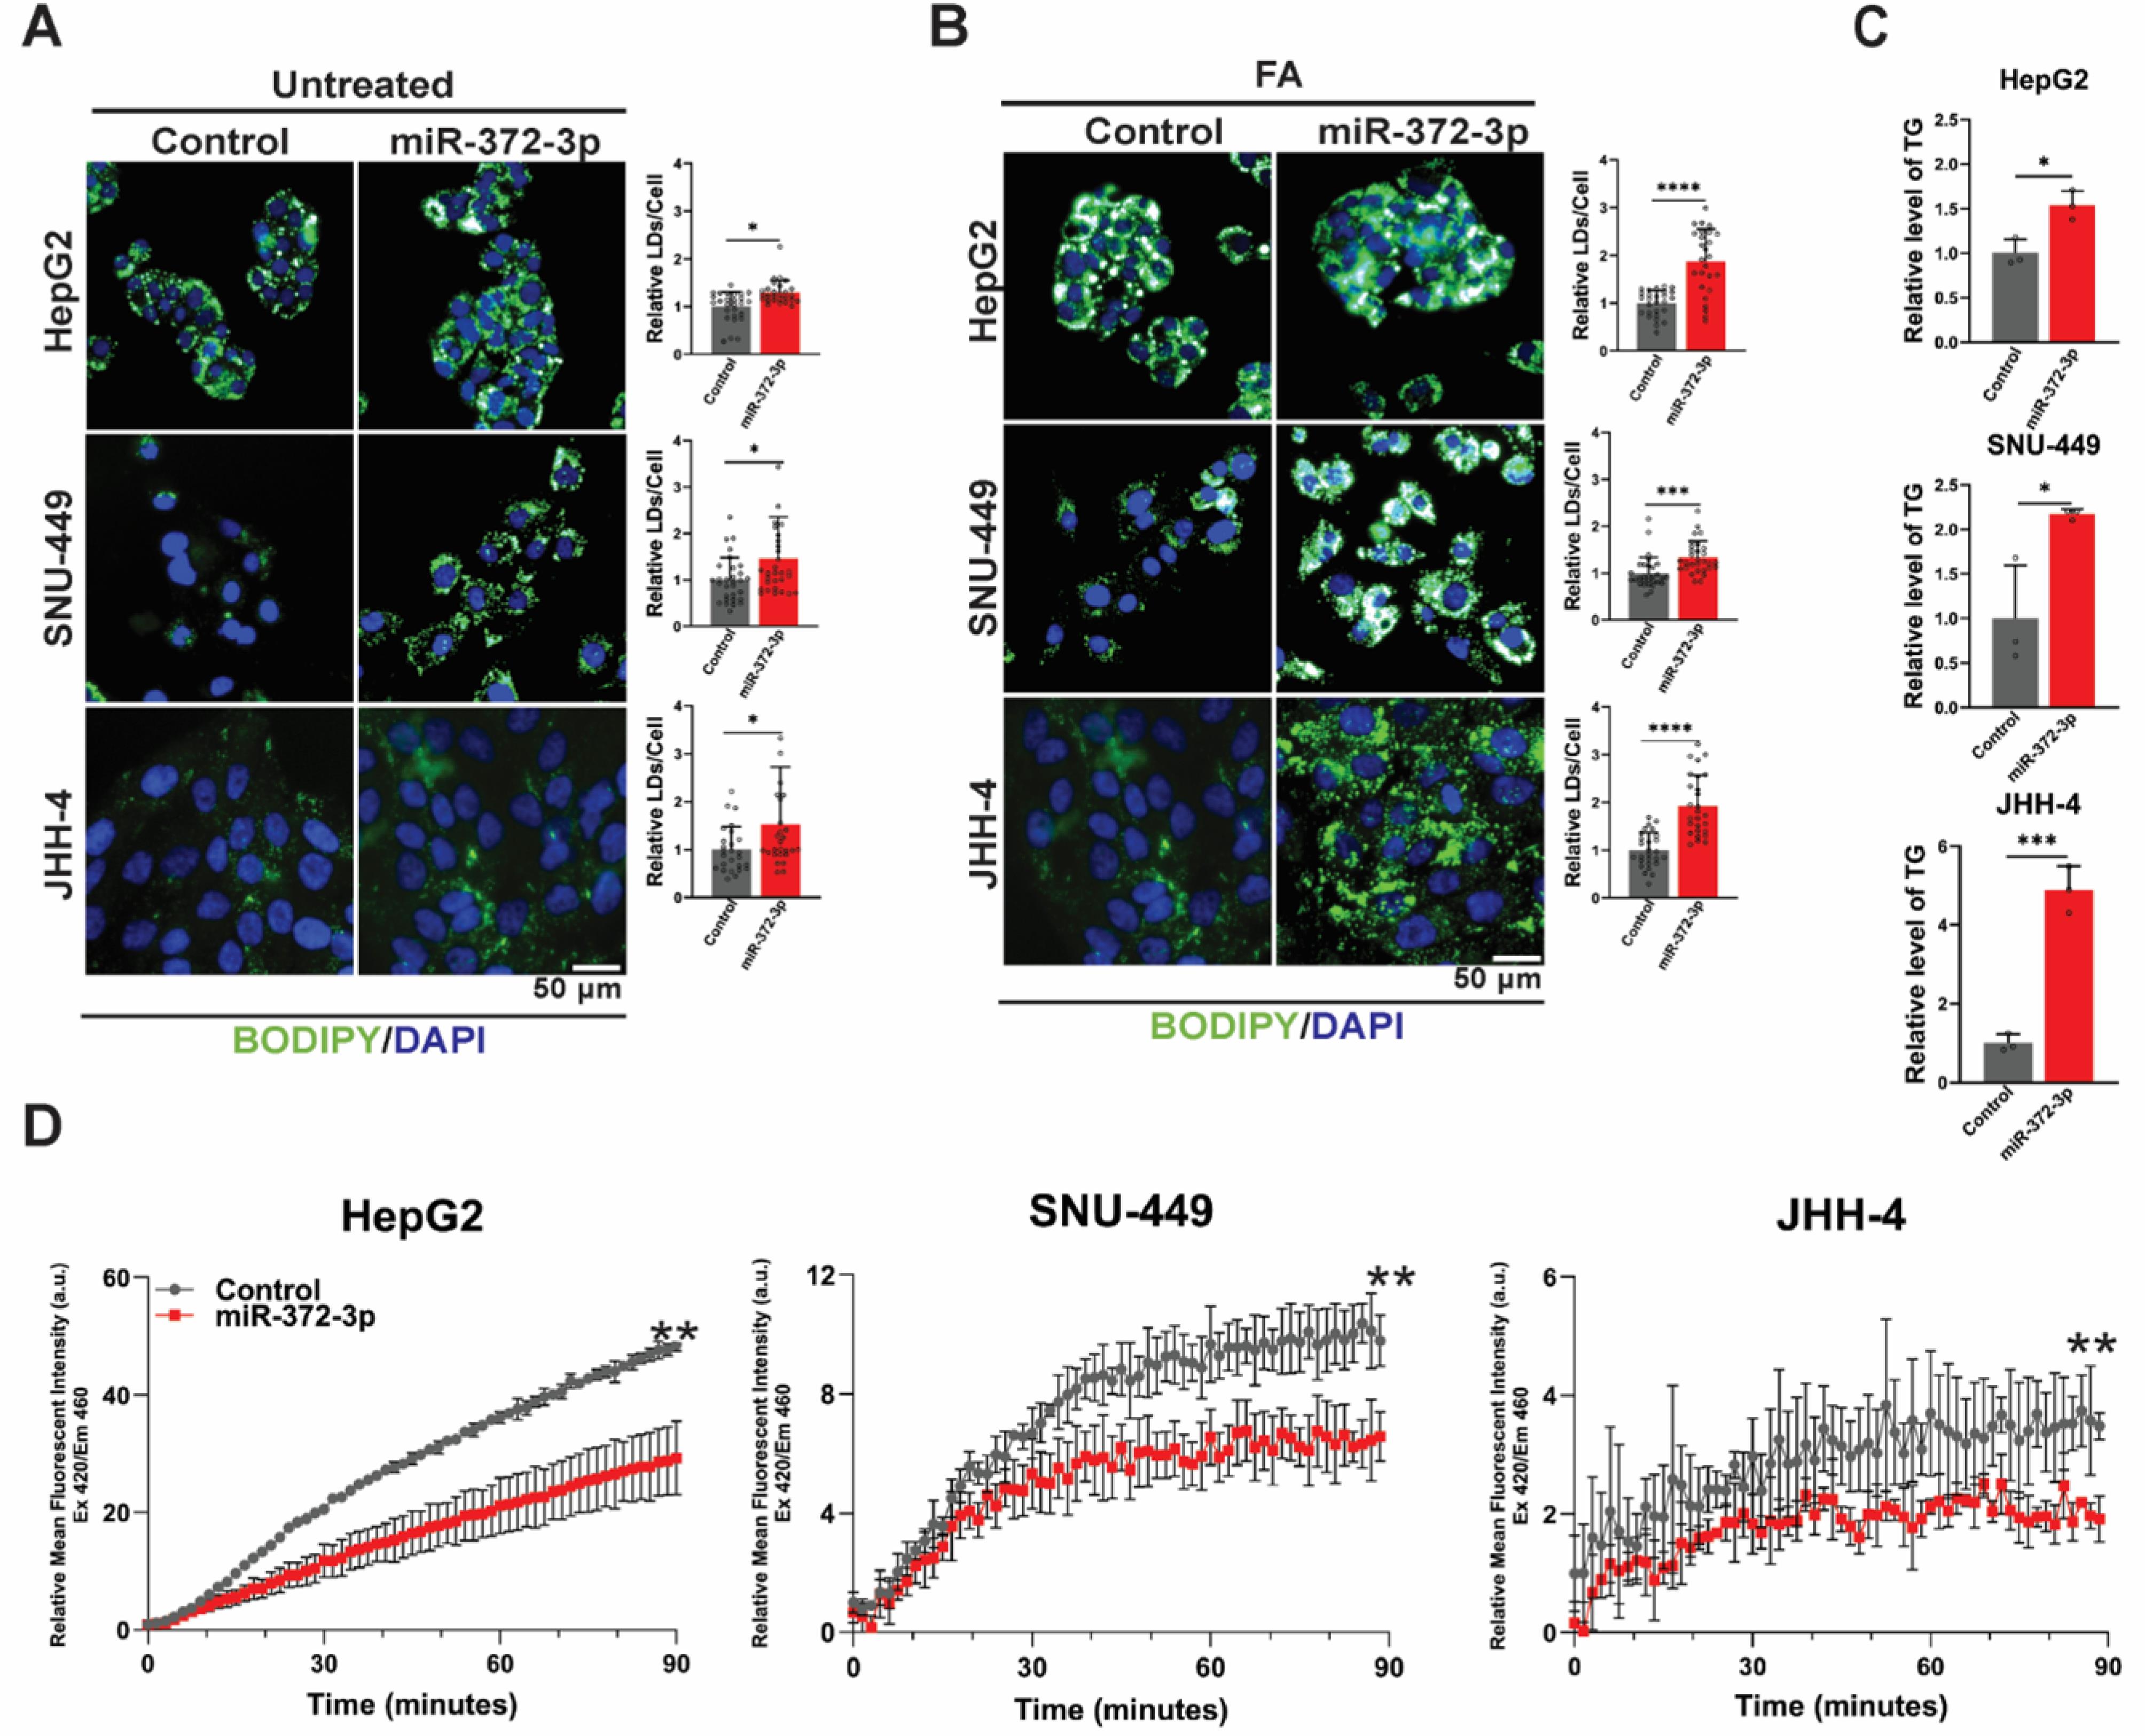
Fig. 3.
Overexpression of miR-372-3p promotes lipid accumulation and impairs fatty acid oxidation (FAO) in HCC cells. (A-B) BODIPY (green)/ DAPI (blue) staining of control and 372-OE HCC cells under basal and fatty acid (FA)-treated conditions with representative images and quantification of lipid accumulation (n = 27). (C) Triglyceride assay measuring intracellular triglyceride levels in control and 372-OE HCC cells (n = 3). (D) FAO blue staining used to measure color development, with a kinetic representation of relative mean fluorescence intensity (arbitrary units; a.u.) at EX420/EM460, indicating FAO activity in control and 372-OE cells (n = 3). All experiments were quantified using quantified using CellProfiler software, normalized to the control group, and analyzed using Student’s t-test. Data are presented as mean ± SD, with significance levels indicated as *P < 0.05, **P < 0.01, ***P < 0.001, and ****P < 0. 0001. BODIPY: Boron-Dipyrromethene 493/503, DAPI: 4′,6-Diamidino-2-phenylindole, EX: Excitation, EM: Emission.
.
Overexpression of miR-372-3p promotes lipid accumulation and impairs fatty acid oxidation (FAO) in HCC cells. (A-B) BODIPY (green)/ DAPI (blue) staining of control and 372-OE HCC cells under basal and fatty acid (FA)-treated conditions with representative images and quantification of lipid accumulation (n = 27). (C) Triglyceride assay measuring intracellular triglyceride levels in control and 372-OE HCC cells (n = 3). (D) FAO blue staining used to measure color development, with a kinetic representation of relative mean fluorescence intensity (arbitrary units; a.u.) at EX420/EM460, indicating FAO activity in control and 372-OE cells (n = 3). All experiments were quantified using quantified using CellProfiler software, normalized to the control group, and analyzed using Student’s t-test. Data are presented as mean ± SD, with significance levels indicated as *P < 0.05, **P < 0.01, ***P < 0.001, and ****P < 0. 0001. BODIPY: Boron-Dipyrromethene 493/503, DAPI: 4′,6-Diamidino-2-phenylindole, EX: Excitation, EM: Emission.
We next measured triglyceride levels, the primary storage form of lipids, in 372-OE and control cells. Triglyceride levels were significantly higher in 372-OE cells, suggesting impaired lipid utilization (Fig. 3C). To directly assess FAO activity, we utilized the FAOBlue assay. 372-OE cells exhibited a significant reduction in FAO activity, as demonstrated by a decrease in the relative mean fluorescence intensity and a decline in the rate of FAO (Relative Slope: 1.00 ± 0.02, 1.00 ± 0.11, and 1.00 ± 0.05 in control vs. 0.65 ± 0.11, 0.67 ± 0.06, and 0.61 ± 0.03 in 372-OE for HepG2, JHH-4, and SNU-449, respectively) (Fig. 3D).
Since miR-372-3p inhibits FAO, this disruption may impair the cell’s ability to utilize LD for cellular energy production. To further confirm this observation, we subjected the cells to glucose deprivation to assess whether 372-OE or control cells could utilize LDs as an energy source under metabolic stress. Under these conditions, cancer cells typically shift their metabolism from glycolysis to FAO.41
The results demonstrated that 372-OE HCC cells poorly utilized LDs, as their number remained relatively unchanged in comparison to the initial glucose deprivation condition. In contrast, control cells efficiently utilized storage lipids, as indicated by a significant reduction in the number of LDs (Fig. 4). These findings demonstrate that miR-372-3p directly suppresses FAO, and its downregulation in HCC cells enhances lipid utilization for energy production, promoting cell proliferation and survival under metabolic stress.
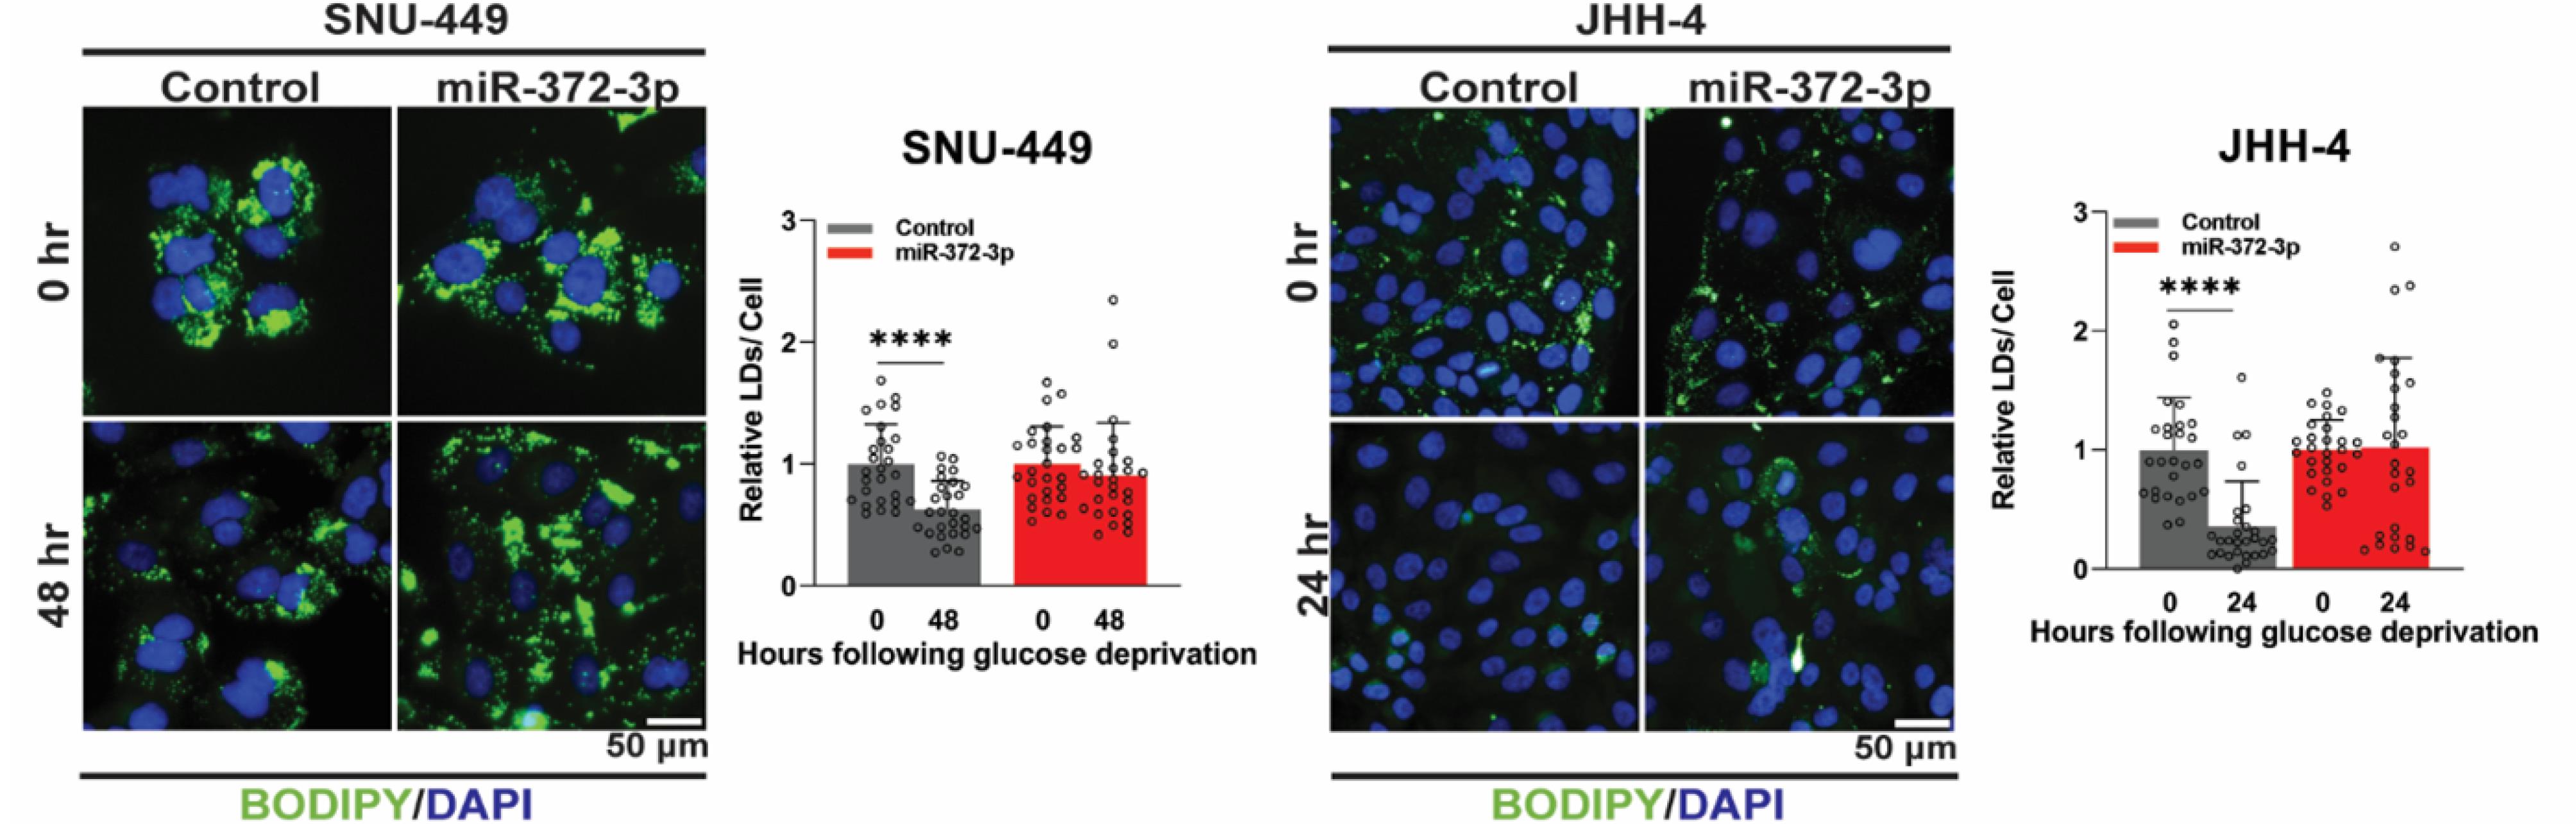
Fig. 4.
Overexpression of miR-372-3p impairs lipid droplet utilization under glucose deprivation in HCC cells. BODIPY (green)/DAPI (blue) staining of control and 372-OE HCC cells under glucose-deprived conditions, with representative images and quantification of lipid accumulation (n = 27). In contrast to control cells. All experiments were quantified using CellProfiler software, normalized to the control group, and analyzed using Student’s t-test. Data are presented as mean ± SD, with significance levels indicated ****P < 0.0001. BODIPY: Boron-Dipyrromethene 493/503; DAPI: 4′,6-Diamidino-2-phenylindole.
.
Overexpression of miR-372-3p impairs lipid droplet utilization under glucose deprivation in HCC cells. BODIPY (green)/DAPI (blue) staining of control and 372-OE HCC cells under glucose-deprived conditions, with representative images and quantification of lipid accumulation (n = 27). In contrast to control cells. All experiments were quantified using CellProfiler software, normalized to the control group, and analyzed using Student’s t-test. Data are presented as mean ± SD, with significance levels indicated ****P < 0.0001. BODIPY: Boron-Dipyrromethene 493/503; DAPI: 4′,6-Diamidino-2-phenylindole.
miR-372-3p overexpression disrupts lipid droplet interactions with mitochondria and lysosomes.
STRING network analysis of GOBP revealed downregulation of genes involved in the carnitine shuttle and fatty acid transport, including CPT1A, ACSL1, ACSL4, ACSL3, CPT2, and ACSL5, suggesting a potential impact on LD trafficking (Fig. S2E). To investigate this further, we examined the interaction between LDs and mitochondria (MT), which is crucial for transferring fatty acids from LDs to MT for FAO under conditions of high energy demand.42 In 372-OE cells, we observed a significant rise in the distance between LDs and MT, as shown by BODIPY and MitoSpy staining. Furthermore, the Manders' coefficient (M1), a measure of colocalization, was reduced, indicating decreased LD-MT association and reduced contact between these organelles in 372-OE HCC cells (Fig. 5).
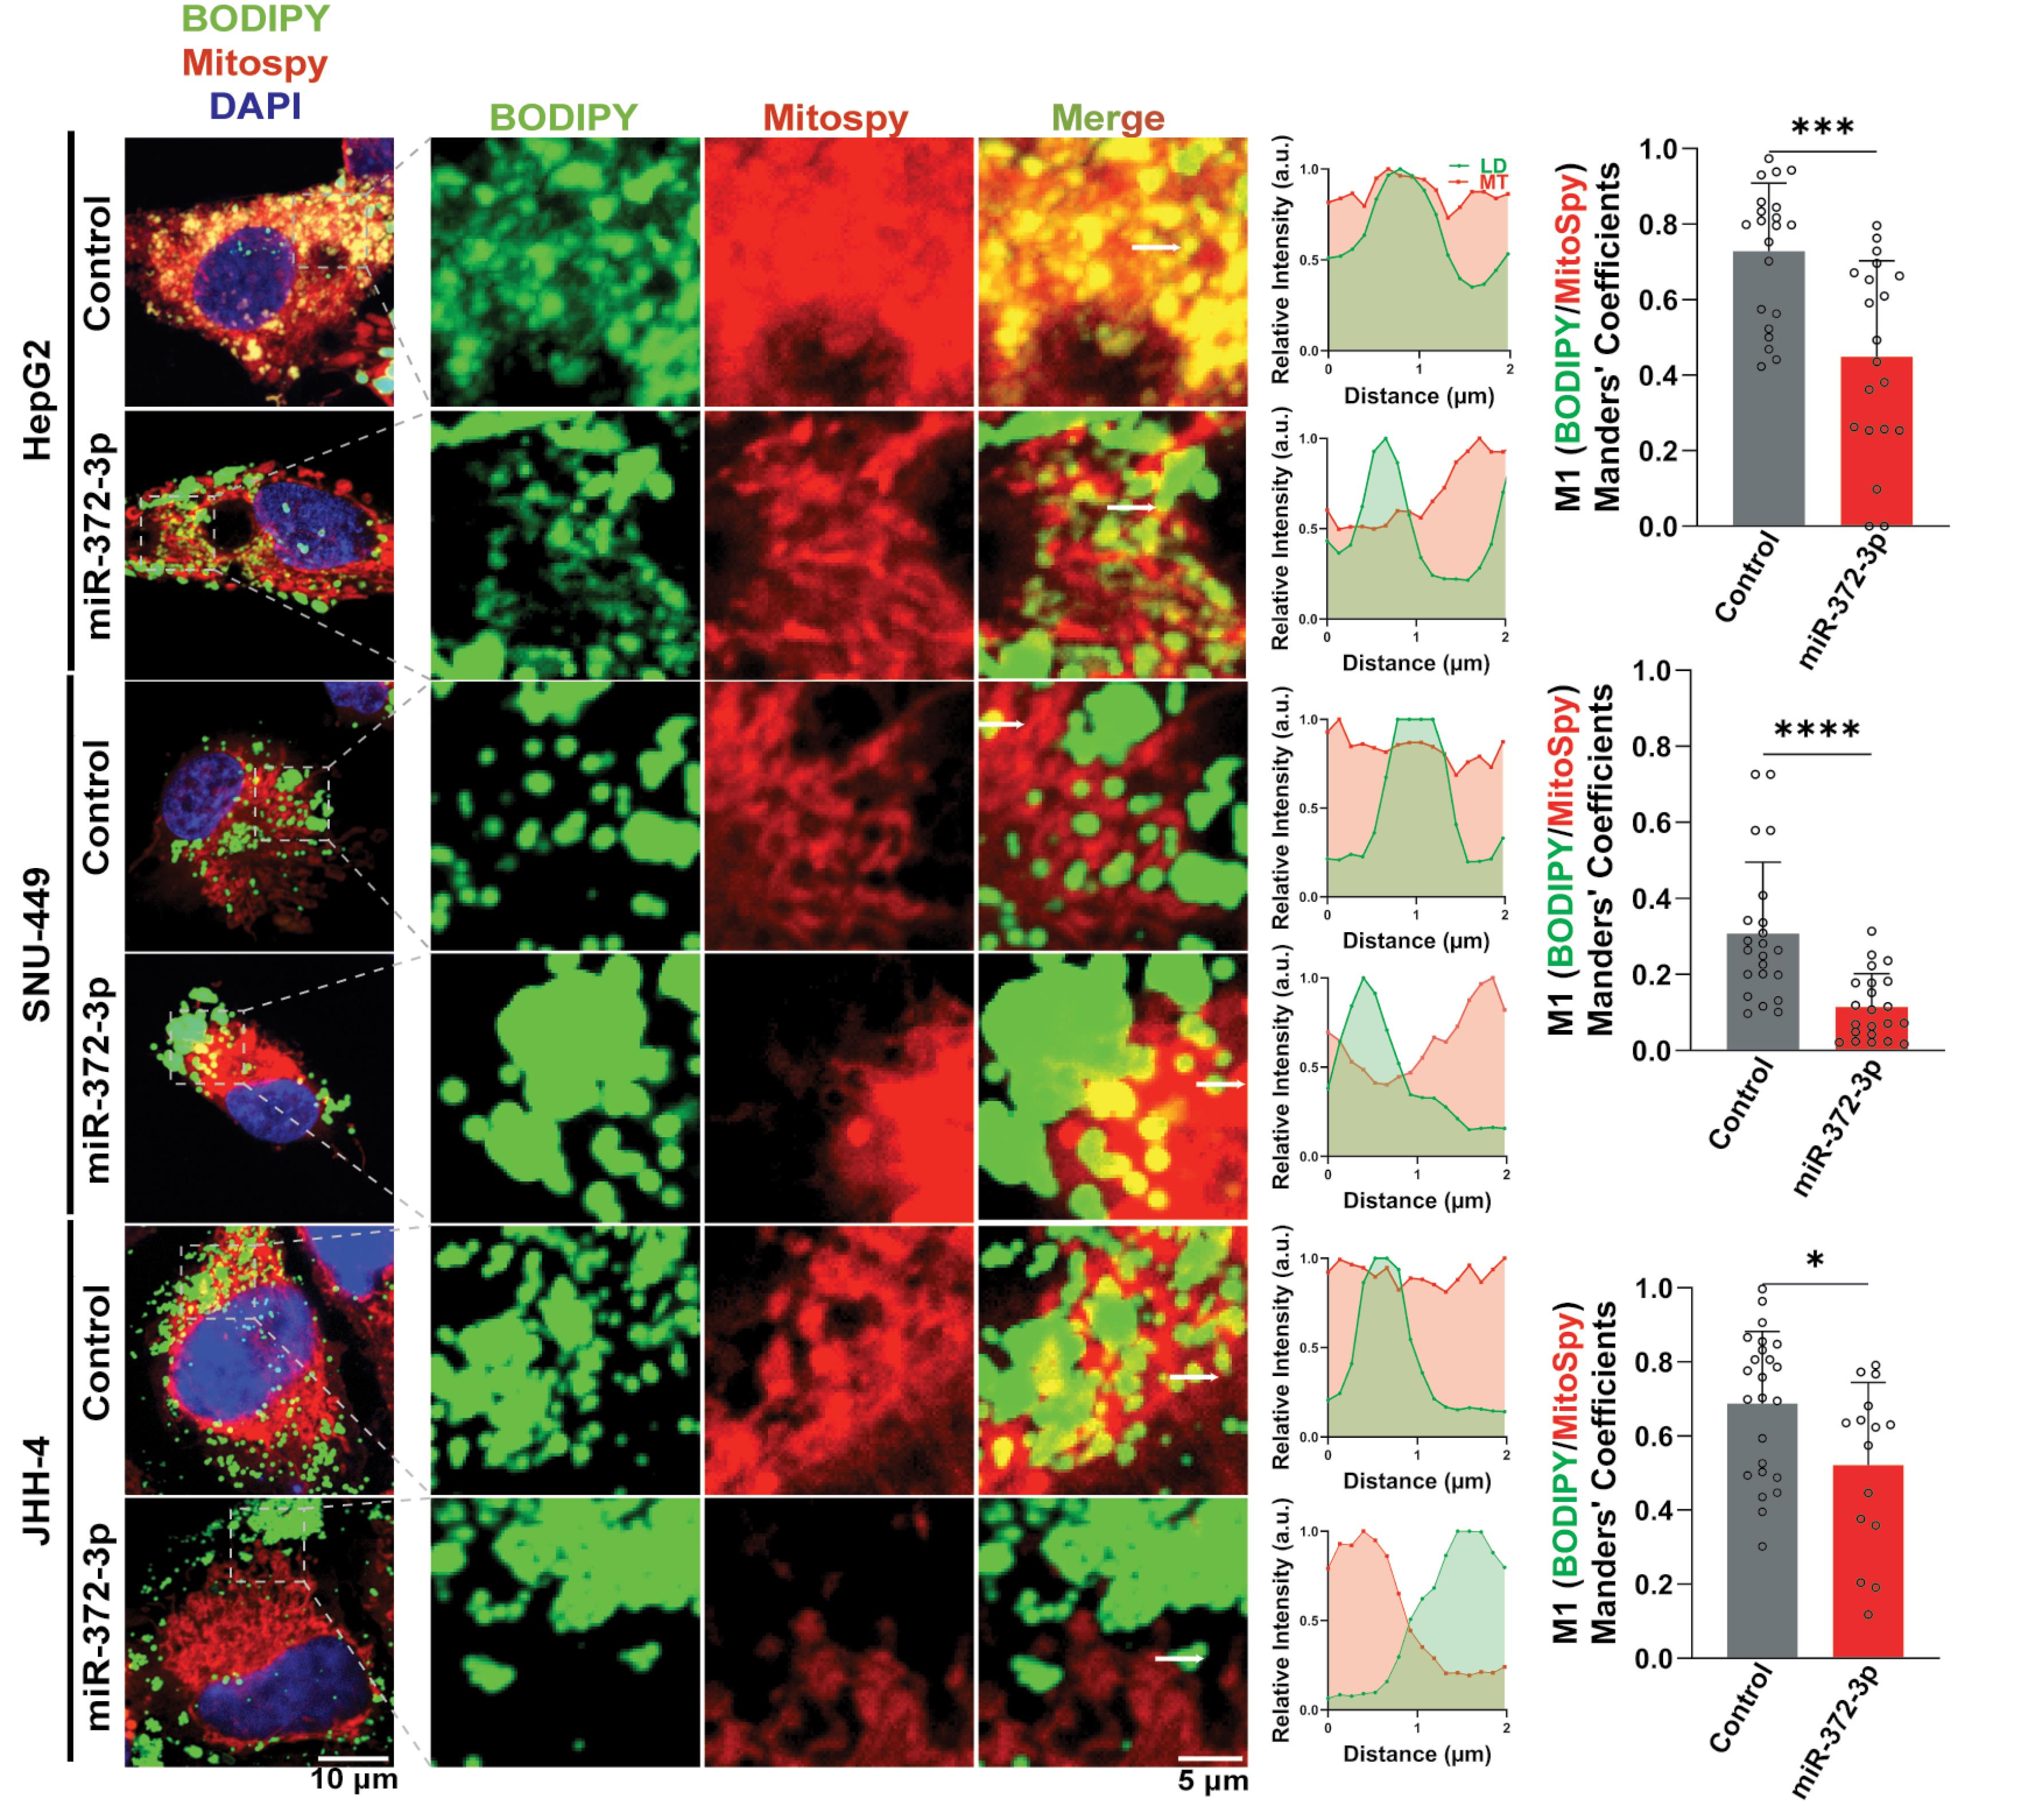
Fig. 5.
Colocalization between lipid droplets (LDs) and mitochondria (MT) was assessed in control and miR-372-3p overexpressing (372-OE) HCC cells. Representative maximum intensity projection (MIP) images are shown (left panel). Distance and relative intensity profiles within the indicated regions were measured and plotted in arbitrary units (a.u., middle panel). The extent of colocalization was quantified using Manders’ colocalization coefficient (M1, right panel; n = 15–33). Quantification was performed using ZEN 2.3 Lite and Fiji software, normalized to the control group, and analyzed using Student’s t-test. Data are presented as mean ± SD. Statistical significance is indicated as *P < 0.05, ***P < 0.001, ****P < 0.0001.
.
Colocalization between lipid droplets (LDs) and mitochondria (MT) was assessed in control and miR-372-3p overexpressing (372-OE) HCC cells. Representative maximum intensity projection (MIP) images are shown (left panel). Distance and relative intensity profiles within the indicated regions were measured and plotted in arbitrary units (a.u., middle panel). The extent of colocalization was quantified using Manders’ colocalization coefficient (M1, right panel; n = 15–33). Quantification was performed using ZEN 2.3 Lite and Fiji software, normalized to the control group, and analyzed using Student’s t-test. Data are presented as mean ± SD. Statistical significance is indicated as *P < 0.05, ***P < 0.001, ****P < 0.0001.
We also examined the interaction between LDs and lysosomes (LS), as lipophagy, the autophagic degradation of LDs, involves fusion with lysosomes.43 Similar to our findings with mitochondria, we observed a significant increase in the distance between LDs and LS in 372-OE cells, as indicated by BODIPY and LysoView staining. The reduced M1 value further suggests decreased colocalization and impaired lipophagy (Fig. 6). Consistent with these observations, Pathview analysis of the lysosome pathway in the KEGG database revealed downregulation of LIPA (Fig. S4), which encodes a lysosomal lipase involved in triglyceride breakdown.44 Downregulation of LIPA may hinder the degradation of triglycerides into free fatty acids contributes to the noted decrease of FAO.
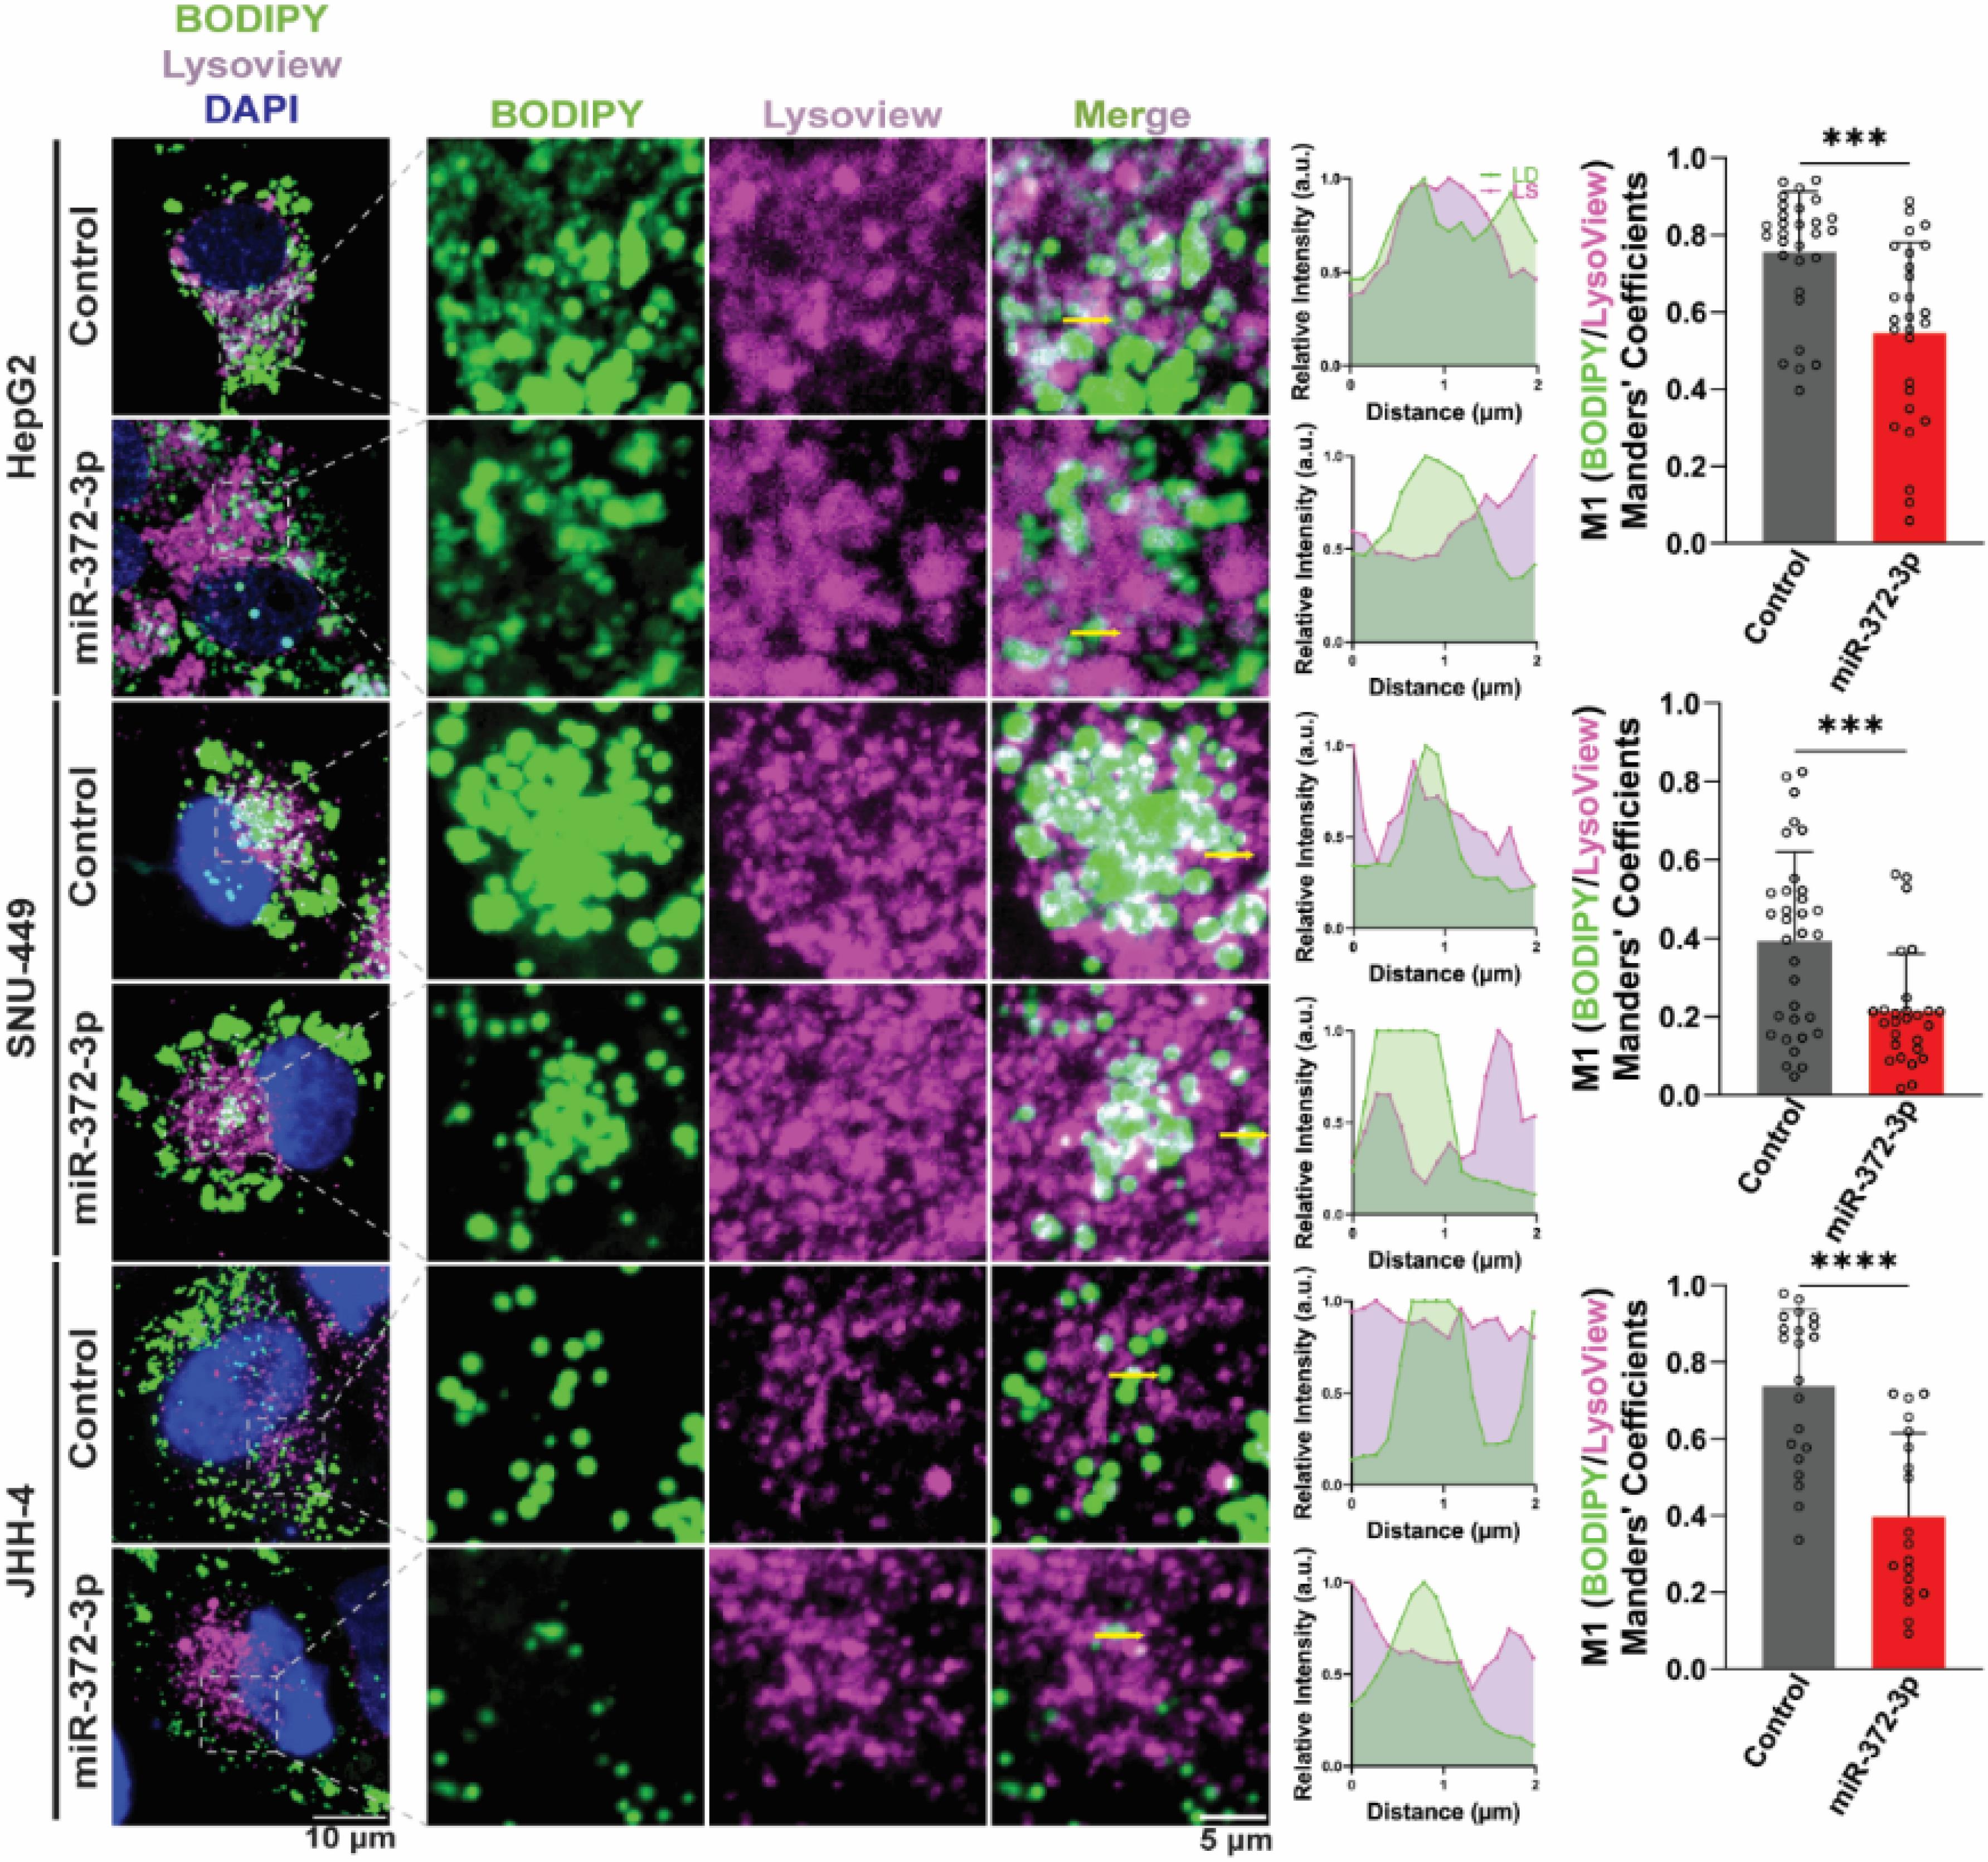
Fig. 6.
Colocalization between lipid droplets (LDs) and lysosomes (LS) was evaluated in control and miR-372-3p overexpressing (372-OE) HCC cells. Representative MIP images are shown (left panel). Distance and relative intensity profiles were plotted in arbitrary units (a.u., middle panel). Colocalization was quantified using Manders’ colocalization coefficient (M1, right panel; n = 15–33). All data were analyzed using ZEN 2.3 Lite and Fiji software, normalized to the control condition, and evaluated using Student’s t-test. Results are expressed as mean ± SD. Statistical significance is denoted ***P < 0.001, ****P < 0.0001.
.
Colocalization between lipid droplets (LDs) and lysosomes (LS) was evaluated in control and miR-372-3p overexpressing (372-OE) HCC cells. Representative MIP images are shown (left panel). Distance and relative intensity profiles were plotted in arbitrary units (a.u., middle panel). Colocalization was quantified using Manders’ colocalization coefficient (M1, right panel; n = 15–33). All data were analyzed using ZEN 2.3 Lite and Fiji software, normalized to the control condition, and evaluated using Student’s t-test. Results are expressed as mean ± SD. Statistical significance is denoted ***P < 0.001, ****P < 0.0001.
Transmission electron microscopy (TEM) analysis of 372-OE cells corroborated the fluorescence microscopy findings, revealing a dramatic decrease in LDs contact with MT (Fig. S5A). Given that mitochondrial dynamics play a crucial role in regulating fatty acid metabolism, especially when CPT1 expression is altered,45 we investigated the impact of miR-372-3p overexpression on mitochondrial morphology and network. 372-OE cells exhibited significant alterations in mitochondrial dynamics, including a reduction in mitochondrial number, area, branching, and branch length (Fig. S5B), coupled with an increase in mitochondrial fragmentation (Fig. S5C).
These findings, along with a reduction in mitochondrial area and Feret's diameter, suggest that miR-372-3p induces mitochondrial fission, leading to fragmentation and a decrease in both mitochondrial number and size. These findings collectively suggest that miR-372-3p disrupts FAO, prompting HCC cells to adapt by undergoing mitochondrial fragmentation in response to lipid excess. The impaired FAO caused by miR-372-3p contributes to this mitochondrial adaptation, further altering cellular energy metabolism.
miR-372-3p Directly Targets CPT1A and ACSL4
To determine whether miR-372-3p directly regulates fatty acid metabolism genes, we analyzed potential miR-372-3p targets within the 3' UTRs of the ten core genes identified from our RNA-seq data. Using the multiMiR tool, five genes were predicted as potential direct targets (Fig. 7A). We selected CPT1A, ACSL4, and CPT2, which exhibited the lowest minimum free energy binding sites predicted by RNAhybrid, for further validation using luciferase reporter assays (Fig. 7A). Wild-type (WT) and mutant (MUT) constructs of the 3' UTRs were generated (Fig. 7B). Co-transfection of miR-372-3p plasmids with the WT 3' UTR constructs significantly reduced luciferase activity for CPT1A and ACSL4, but not CPT2, confirming direct interaction and target repression (Fig. 7C). Importantly, mutations within the miR-372-3p binding sites in the MUT constructs abolished this repressive effect, demonstrating target specificity (Fig. 7C). These findings indicate that miR-372-3p directly modulates the expression of CPT1A and ACSL4., thereby controlling FAO in HCC cells.
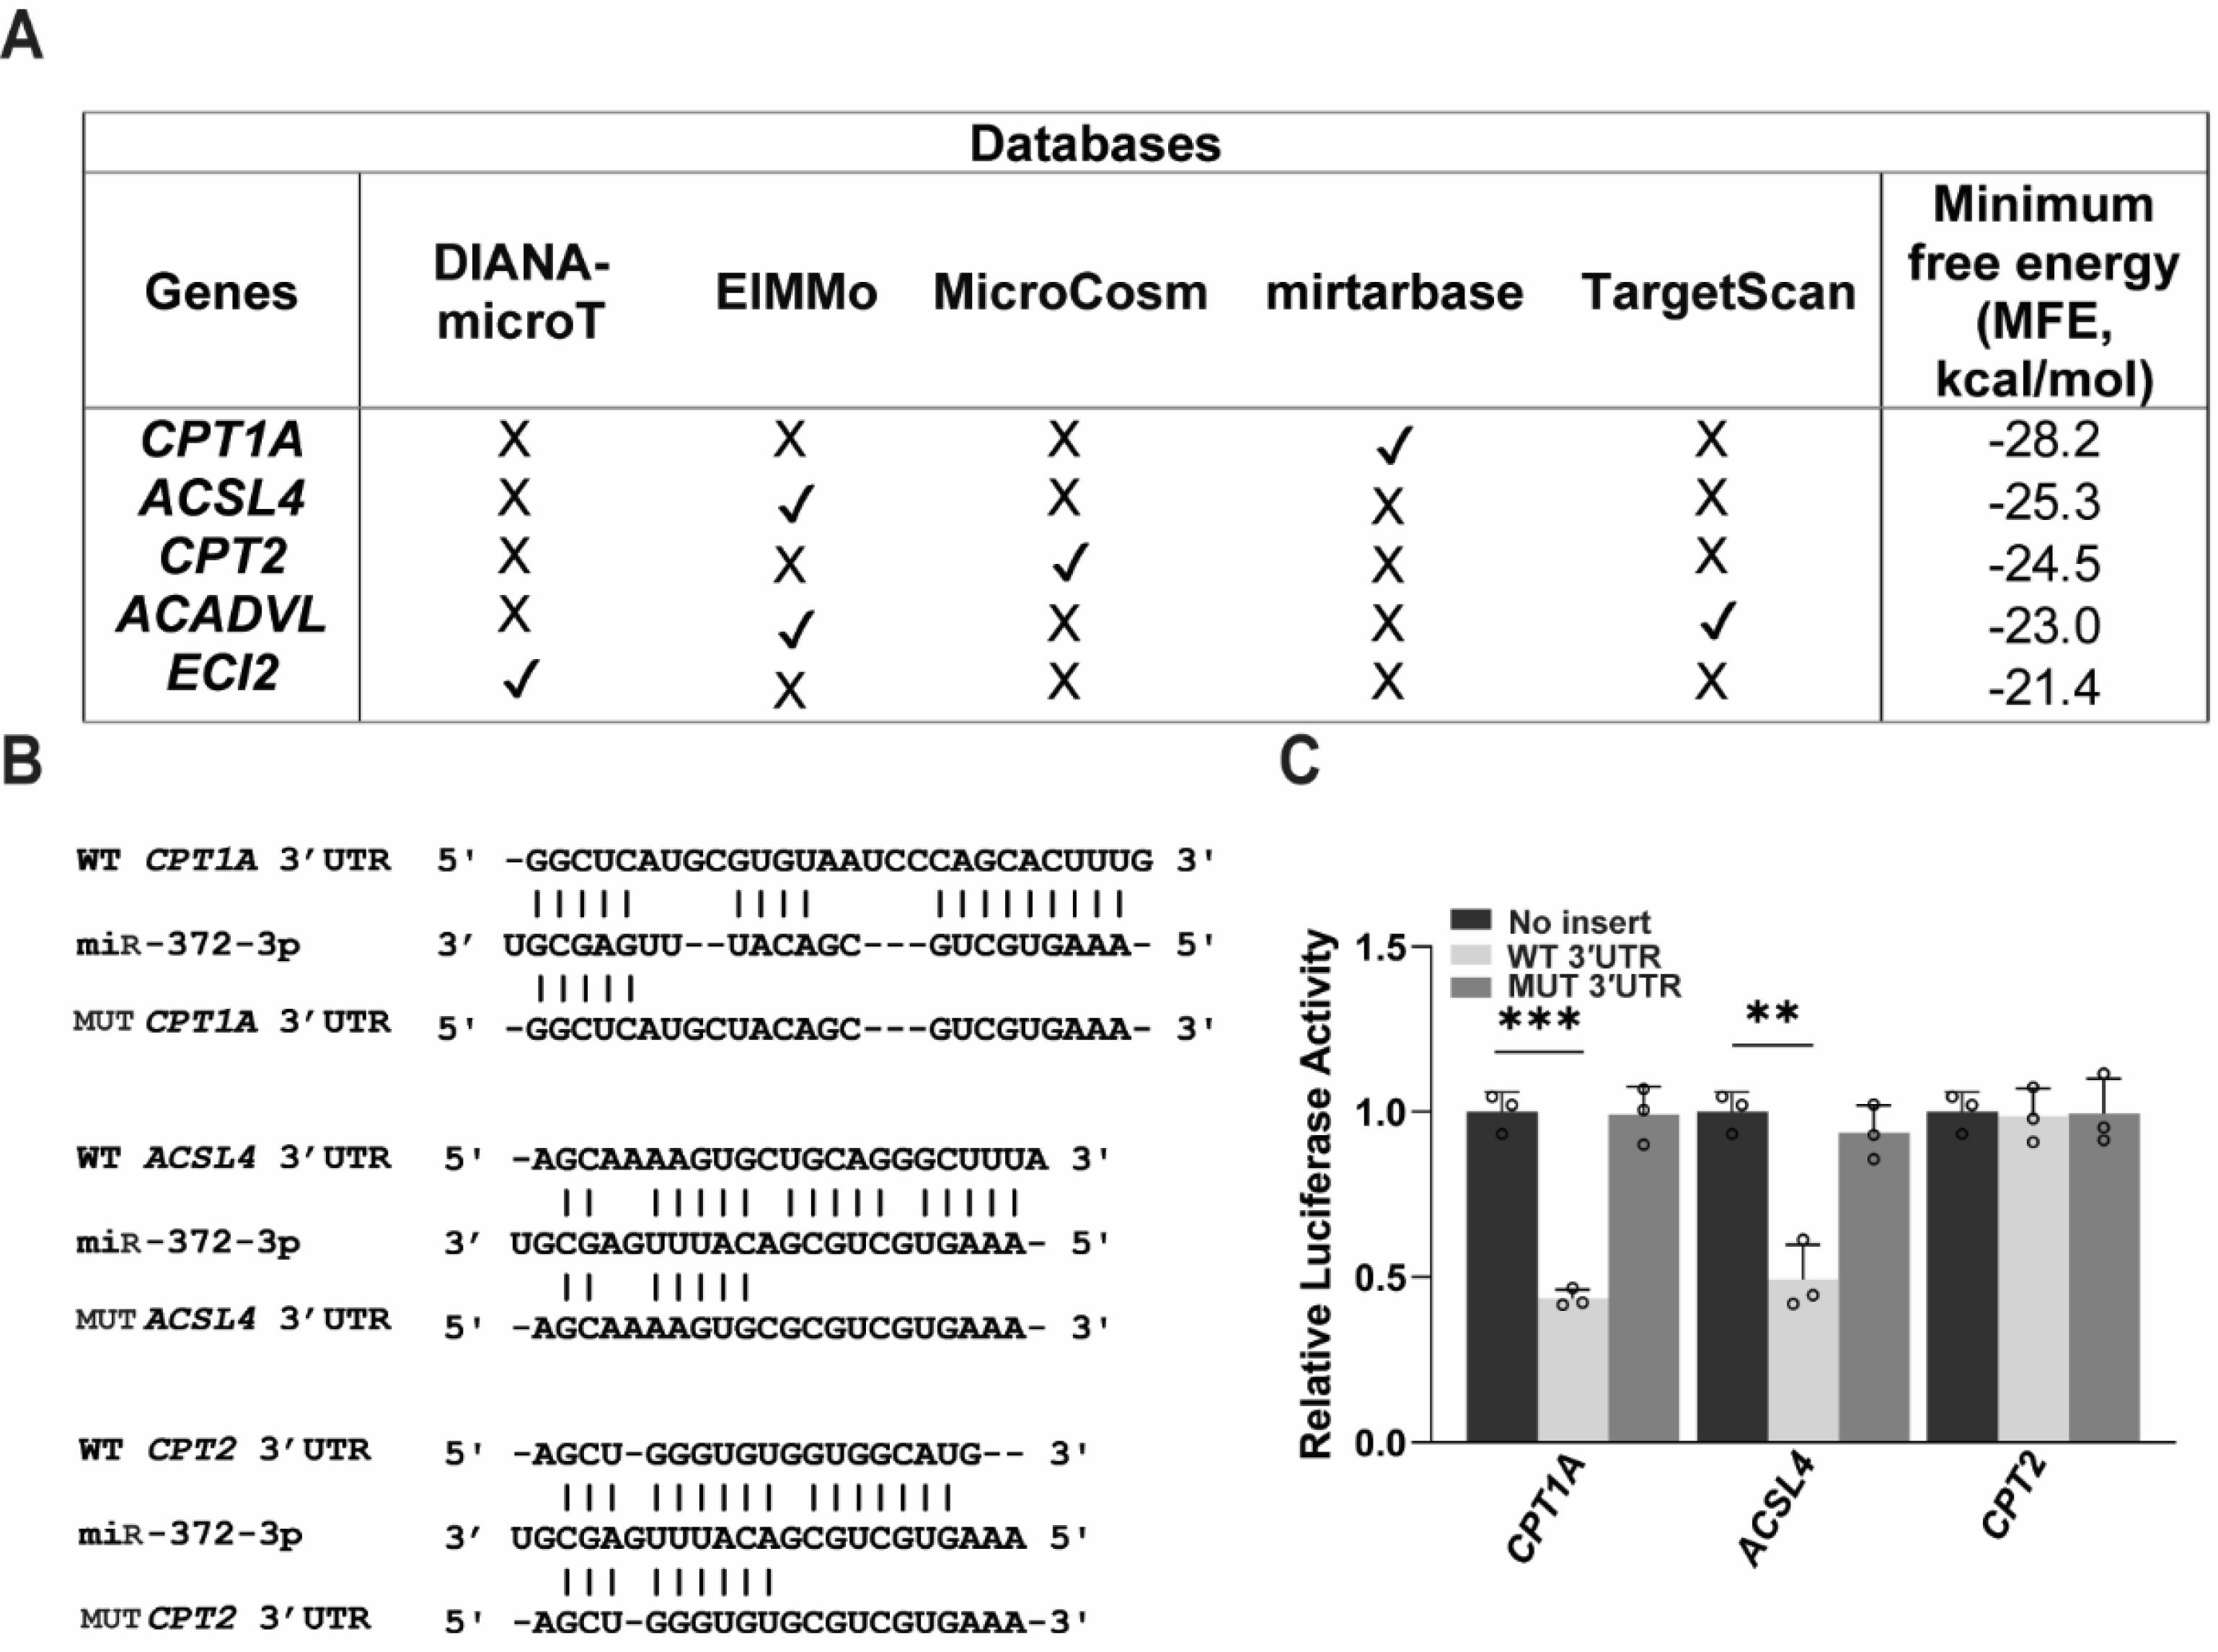
Fig. 7.
miR-372-3p directly regulates genes in fatty acid metabolism. (A) MultiMiR analysis for putative miR-372-3p target genes involved in fatty acid oxidation (FAO), with predicted minimum free energy (MFE) values (kcal/mol) calculated using RNAhybrid. (B) Hybridization patterns showing predicted binding sites of miR-372-3p with wild-type (WT) and mutant (MUT) 3′ UTRs of CPT1A, CPT2, and ACSL4. (C) Dual luciferase reporter assay for miR-372-3p and the 3′ UTRs of FAO genes. Relative luciferase activity was normalized to the no-insert group and analyzed using Student’s t-test (n = 3). Data are presented as mean ± SD, with significance levels indicated as **P < 0.01 and ***P < 0.001. 3’ UTR; 3’ untranslated region.
.
miR-372-3p directly regulates genes in fatty acid metabolism. (A) MultiMiR analysis for putative miR-372-3p target genes involved in fatty acid oxidation (FAO), with predicted minimum free energy (MFE) values (kcal/mol) calculated using RNAhybrid. (B) Hybridization patterns showing predicted binding sites of miR-372-3p with wild-type (WT) and mutant (MUT) 3′ UTRs of CPT1A, CPT2, and ACSL4. (C) Dual luciferase reporter assay for miR-372-3p and the 3′ UTRs of FAO genes. Relative luciferase activity was normalized to the no-insert group and analyzed using Student’s t-test (n = 3). Data are presented as mean ± SD, with significance levels indicated as **P < 0.01 and ***P < 0.001. 3’ UTR; 3’ untranslated region.
Discussion
This study reveals that miR-372-3p functions as a tumor suppressor in HCC by directly targeting and repressing two key fatty acid metabolism genes, CPT1A and ACSL4. Consequently, miR-372-3p overexpression inhibits FAO, disrupting the utilization of lipid droplets (LDs) as an energy source and impairing LD trafficking to mitochondria and lysosome. This disruption is accompanied by increased mitochondrial fission and decreased lipophagy, ultimately leading to excessive LD accumulation. Based on these findings, we propose a model depicting how miR-372-3p disrupts lipid metabolism in HCC cells by inhibiting FAO (Fig. 8). Importantly, the observed LD accumulation and FAO impairment suggest a potential therapeutic vulnerability in HCC, highlighting miR-372-3p as a promising target for modulating FAO and suppressing tumor progression.
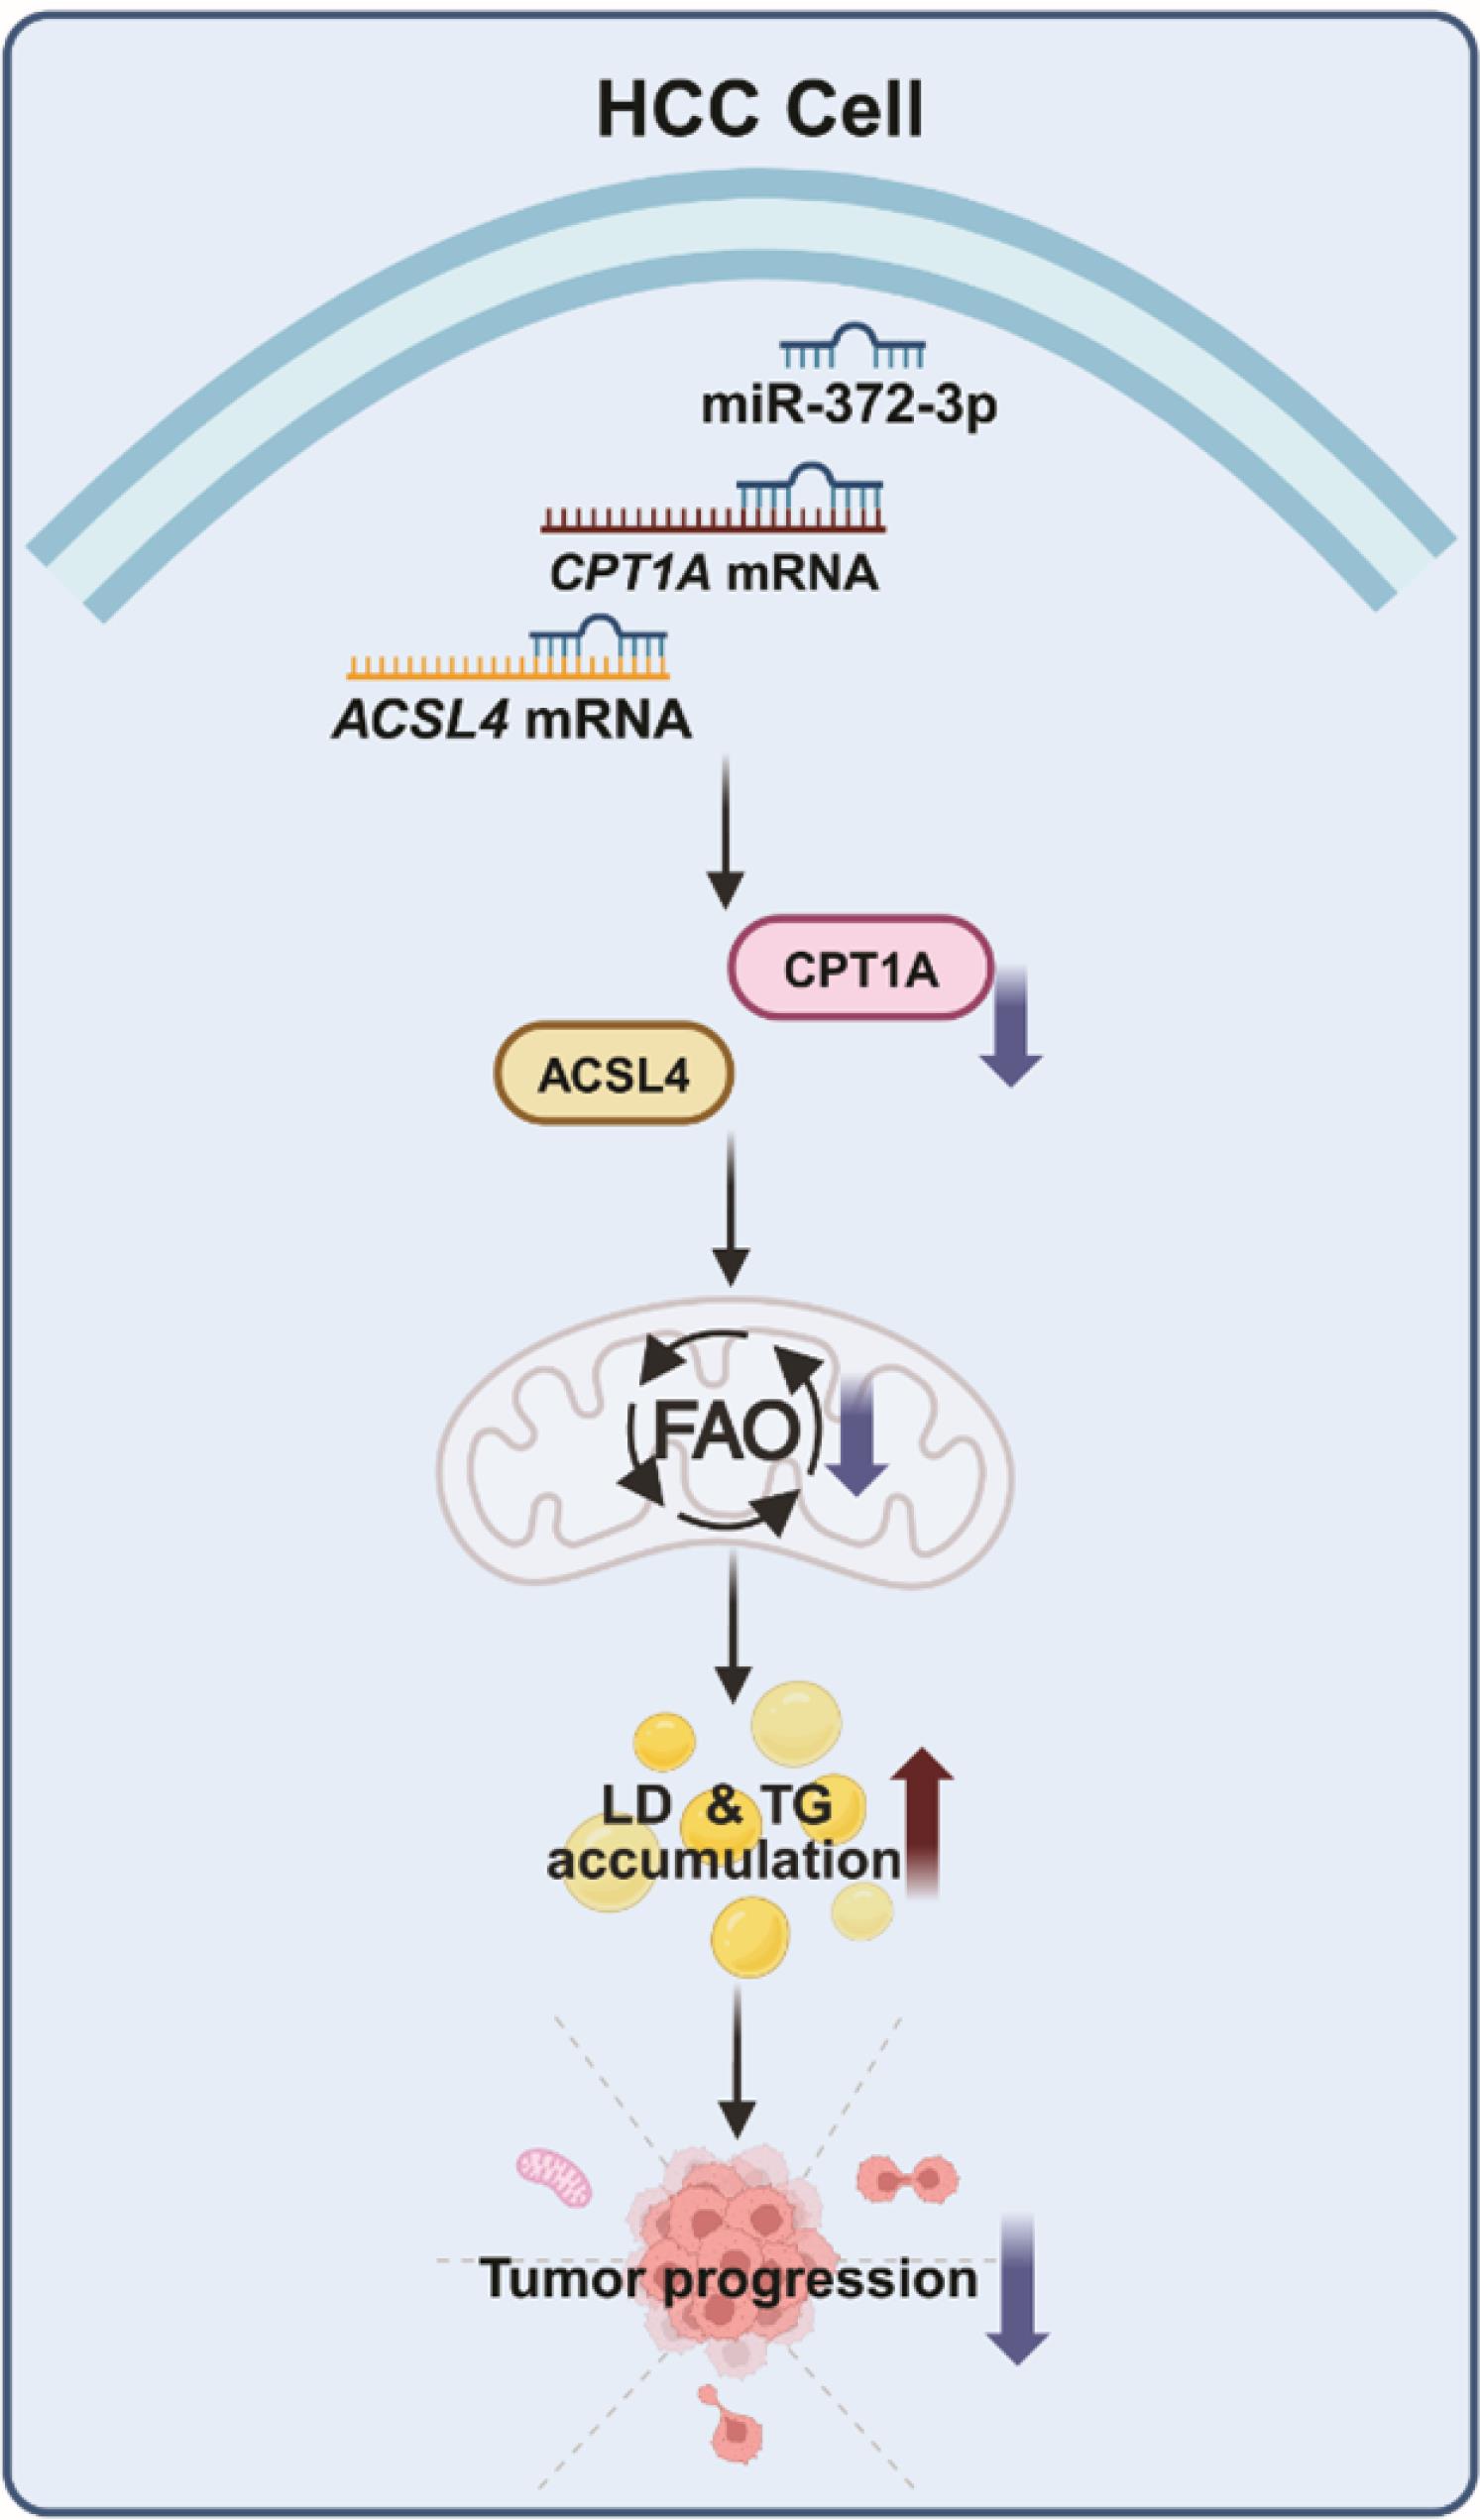
Fig. 8.
miR-372-3p suppresses hepatocellular carcinoma (HCC) progression by targeting fatty acid oxidation (FAO). miR-372-3p overexpression in HCC cell lines impairs FAO by directly targeting the 3' untranslated regions (3' UTRs) of carnitine palmitoyltransferase 1A (CPT1A) and acyl-CoA synthetase long-chain family member 4 (ACSL4) transcripts, leading to their downregulation. This suppression of FAO results in increased lipid droplet (LD) accumulation and triglyceride (TG) levels, disrupting LD contact with mitochondria and lysosomes, and impairing lipid utilization, particularly under glucose deprivation. Collectively, these metabolic changes contribute to the observed tumor-suppressive effects of miR-372-3p, including impaired proliferation, migration, invasion, and colony formation.
.
miR-372-3p suppresses hepatocellular carcinoma (HCC) progression by targeting fatty acid oxidation (FAO). miR-372-3p overexpression in HCC cell lines impairs FAO by directly targeting the 3' untranslated regions (3' UTRs) of carnitine palmitoyltransferase 1A (CPT1A) and acyl-CoA synthetase long-chain family member 4 (ACSL4) transcripts, leading to their downregulation. This suppression of FAO results in increased lipid droplet (LD) accumulation and triglyceride (TG) levels, disrupting LD contact with mitochondria and lysosomes, and impairing lipid utilization, particularly under glucose deprivation. Collectively, these metabolic changes contribute to the observed tumor-suppressive effects of miR-372-3p, including impaired proliferation, migration, invasion, and colony formation.
In agreement with previous reports, we discovered a notable downregulation of miR-372-3p expression in HCC cell lines in comparison to the non-tumorigenic human hepatocyte cell line, corroborating findings in normal and HCC tissues and in situ hybridization analyses.46 Our finding that miR-372-3p inhibits HCC cell migration and invasion aligns with prior work in Huh7 and HCCLM3 cells, which reported reduced proliferation and suppressed invasion upon miR-372-3p overexpression.15,46 Moreover, miR-372-3p overexpression also reduced colony formation in Huh7 and HCCLM3 cell lines, further supporting its tumor-suppressive function.
Although miR-372-3p has been implicated in HCC, its role remains controversial. Some studies report tumor-suppressive effects, while others suggest oncogenic functions.15-17,46 For example, it was reported that miR-372-3p impaired triglyceride accumulation by suppressing AGPS, an enzyme involved in either lipid synthesis.16 Conversely, our transcriptomic analysis identified miR-372-3p as a negative regulator of FAO, with its overexpression leading to increased lipid accumulation. Although both findings relate to miR-372-3p's influence on triglyceride metabolism, the discrepancy in the observed effects may stem from differences in the experimental models employed. Further investigation is warranted to reconcile these contrasting observations.
Our study demonstrates that miR-372-3p regulates FAO by directly targeting CPT1A and ACSL4. While CPT2, another key enzyme in the carnitine shuttle system essential for FAO, was not a direct target of miR-372-3p, we observed its downregulation in 372-OE cells from both RNA-seq and qRT-PCR analyses. Both CPT1A and CPT2 play critical roles in lipid homeostasis, and their reduced expression has been consistently linked to LD accumulation and increased triglyceride levels.47-49 Given their importance in lipid metabolism, CPT1A and CPT2 have emerged as potential therapeutic targets in HCC.50-58 CPT2 has been reported to demonstrate both tumor-suppressive and carcinogenic functions in various cancer settings, highlighting the complexity of its function.57-60
In addition to CPT1A, our study identified ACSL4 as a direct target of miR-372-3p. ACSL4, one of five ACSL isoforms, is localized to peroxisomes and mitochondria-associated membranes, where it catalyzes the formation of fatty acyl-CoA, a crucial step in fatty acid metabolism.61,62 Inhibition of ACSL4 has been shown to align with FAO suppression and contribute to tumor progression inhibition.63-65 Intriguingly, previous studies have also suggested that ACSL4 suppression can induce lipotoxicity and ferroptosis,66-71 indicating a complex interplay between ACSL4 and cellular metabolism. Collectively, our findings, along with these previous reports, suggest that miR-372-3p-mediated FAO suppression could represent a potential metabolic-targeted therapy for cancer and metabolic diseases such as MASLD, warranting further investigation.
Our research offers new perspectives on the regulation of fatty acid metabolism. under stress conditions, particularly during glucose deprivation, and highlights the crucial role of organelle dynamics in modulating lipolysis and FAO. We demonstrate, for the first time, that miR-372-3p disrupts FAO while impacting LD trafficking. Specifically, miR-372-3p impairs LD transport to mitochondria by modulating CPT1A, leading to alterations in mitochondrial dynamics characterized by increased fission. This observation is consistent with a study in glioblastoma stem cells linking CPT1A suppression to increased mitochondrial fission.72 Mechanistically, CPT1A silencing has been shown to enhance DRP1 phosphorylation, a modification that facilitates mitochondrial fission72 However, the precise role of CPT1A in regulating mitochondrial dynamics remains complex, as conflicting evidence suggests that CPT1A silencing can also promote mitochondrial fusion in ovarian cancer.73 Mitochondrial fission promotes lipid droplet accumulation by enhancing lipogenesis. It also suppresses FAO via CPT1A inhibition.74 Furthermore, a previous study has shown that palmitic acid, under lipid-excess conditions, enhances DRP1 expression, triggering mitochondrial fission and increased LD accumulation, and impairs lipophagy through lysosomal dysfunction.75 Additionally, CPT1A has been implicated in promoting autophagy by activating the ATG12-ATG5-ATG16L1 complex, suggesting that CPT1A inhibition may also suppress lipophagy.76 While our study highlights the tumor-suppressive role of miR-372-3p through direct targeting of CPT1A and ACSL4, several limitations remain. Most notably, the broader regulatory impact of miR-372-3p on lipid metabolism and its downstream effects on organelle dynamics and cellular adaptation are not fully understood. As our findings are primarily based on in vitro models, further in vivo validation is necessary to confirm the clinical relevance of targeting the miR-372-3p–FAO axis. Future studies should investigate how disrupted FAO affects mitochondrial function, autophagy, and tumor metabolism under physiological and pathological conditions, which will enhance our understanding of HCC pathogenesis and guide the development of novel miRNA-based therapies.
Conclusion
In conclusion, our study establishes miR-372-3p as a tumor suppressor in HCC, revealing a critical link between this microRNA and fatty acid metabolism. We demonstrate that miR-372-3p directly targets and represses CPT1A and ACSL4, two key regulators of FAO. This repression triggers a cascade of metabolic reprogramming events, including increased lipid accumulation, impaired lipid droplet interaction with mitochondria, altered mitochondrial dynamics, and decreased lipophagy. Consequently, miR-372-3p overexpression disrupts cellular adaptation to metabolic stress, ultimately contributing to tumor suppression. These findings highlight the potential of miR-372-3p as a therapeutic target for metabolic intervention in HCC, offering a promising avenue for future research and treatment strategies.
Research Highlights
What is the current knowledge?
-
HCC progression relies on dysregulated lipid metabolism, especially heightened fatty-acid oxidation.
-
The role of miR-372-3p in HCC remains controversial, with published studies reporting both tumor-suppressive and oncogenic functions.
-
CPT1A and ACSL4, key FAO enzymes, are overexpressed in aggressive HCC and drive tumor metabolism.
What is new here?
-
Transcriptome analysis shows that miR-372-3p suppresses ten genes central to fatty-acid oxidation in HCC cells.
-
Dual-luciferase assays verify that CPT1A and ACSL4 are direct targets of miR-372-3p.
-
miR-372-3p overexpression blocks FAO, enlarges lipid-droplet stores, and curtails proliferation, migration, and invasion.
-
miR-372-3p reduces lipid-droplet contacts with mitochondria and lysosomes, unveiling an organelle-level FAO mechanism.
-
The miR-372-3p/CPT1A/ACSL4 axis emerges as a promising metabolic therapeutic target for HCC.
Competing Interests
All authors declare no competing interests.
Data Availability Statement
Raw data from all quantitatively analyzed experiments are available from the corresponding authors on reasonable request. The RNA-seq data sets generated in the current study are available in the National Center for Biotechnology Information Gene Expression Omnibus repository under the accession code GSE290065.
Ethical Approval
This study does not require ethical approval.
Supplementary files
Supplementary file 1 contains Table S1 and Figs. S1-S5.
(pdf)
Acknowledgements
We would like to thank all members of the Center of Excellence in Hepatitis and Liver Cancer, Faculty of Medicine, Chulalongkorn University, for their technical assistance in experiments.
References
- Yang JD, Roberts LR. Hepatocellular carcinoma: a global view. Nat Rev Gastroenterol Hepatol 2010; 7:448-58. doi: 10.1038/nrgastro.2010.100 [Crossref] [ Google Scholar]
- Rumgay H, Arnold M, Ferlay J, Lesi O, Cabasag CJ, Vignat J. Global burden of primary liver cancer in 2020 and predictions to 2040. J Hepatol 2022; 77:1598-606. doi: 10.1016/j.jhep.2022.08.021 [Crossref] [ Google Scholar]
- Konyn P, Ahmed A, Kim D. The current trends in the health burden of primary liver cancer across the globe. Clin Mol Hepatol 2023; 29:358-62. doi: 10.3350/cmh.2023.0092 [Crossref] [ Google Scholar]
- Estes C, Razavi H, Loomba R, Younossi Z, Sanyal AJ. Modeling the epidemic of nonalcoholic fatty liver disease demonstrates an exponential increase in burden of disease. Hepatology 2018; 67:123-33. doi: 10.1002/hep.29466 [Crossref] [ Google Scholar]
- Foerster F, Gairing SJ, Müller L, Galle PR. NAFLD-driven HCC: safety and efficacy of current and emerging treatment options. J Hepatol 2022; 76:446-57. doi: 10.1016/j.jhep.2021.09.007 [Crossref] [ Google Scholar]
- Sangineto M, Villani R, Cavallone F, Romano A, Loizzi D, Serviddio G. Lipid metabolism in development and progression of hepatocellular carcinoma. Cancers (Basel) 2020; 12:1419. doi: 10.3390/cancers12061419 [Crossref] [ Google Scholar]
- Ratti M, Lampis A, Ghidini M, Salati M, Mirchev MB, Valeri N. MicroRNAs (miRNAs) and long non-coding RNAs (lncRNAs) as new tools for cancer therapy: first steps from bench to bedside. Target Oncol 2020; 15:261-78. doi: 10.1007/s11523-020-00717-x [Crossref] [ Google Scholar]
- Peng Y, Croce CM. The role of microRNAs in human cancer. Signal Transduct Target Ther 2016; 1:15004. doi: 10.1038/sigtrans.2015.4 [Crossref] [ Google Scholar]
- Doghish AS, Elballal MS, Elazazy O, Elesawy AE, Elrebehy MA, Shahin RK. The role of miRNAs in liver diseases: potential therapeutic and clinical applications. Pathol Res Pract 2023; 243:154375. doi: 10.1016/j.prp.2023.154375 [Crossref] [ Google Scholar]
- Rupaimoole R, Slack FJ. MicroRNA therapeutics: towards a new era for the management of cancer and other diseases. Nat Rev Drug Discov 2017; 16:203-22. doi: 10.1038/nrd.2016.246 [Crossref] [ Google Scholar]
- Menon A, Abd-Aziz N, Khalid K, Poh CL, Naidu R. miRNA: a promising therapeutic target in cancer. Int J Mol Sci 2022; 23:11502. doi: 10.3390/ijms231911502 [Crossref] [ Google Scholar]
- Morishita A, Oura K, Tadokoro T, Fujita K, Tani J, Masaki T. MicroRNAs in the pathogenesis of hepatocellular carcinoma: a review. Cancers (Basel) 2021; 13:514. doi: 10.3390/cancers13030514 [Crossref] [ Google Scholar]
- Pfister S, Remke M, Castoldi M, Bai AH, Muckenthaler MU, Kulozik A. Novel genomic amplification targeting the microRNA cluster at 19q1342 in a pediatric embryonal tumor with abundant neuropil and true rosettes. Acta Neuropathol 2009; 117:457-64. doi: 10.1007/s00401-008-0467-y [Crossref] [ Google Scholar]
- Fan J, Zhang J, Huang S, Li P. lncRNA OSER1-AS1 acts as a ceRNA to promote tumorigenesis in hepatocellular carcinoma by regulating miR-372-3p/Rab23 axis. Biochem Biophys Res Commun 2020; 521:196-203. doi: 10.1016/j.bbrc.2019.10.105 [Crossref] [ Google Scholar]
- Soliman MH, Ragheb MA, Elzayat EM, Mohamed MS, El-Ekiaby N, Abdelaziz AI. MicroRNA-372-3p predicts response of TACE patients treated with doxorubicin and enhances chemosensitivity in hepatocellular carcinoma. Anticancer Agents Med Chem 2021; 21:246-53. doi: 10.2174/1871520620666200516145830 [Crossref] [ Google Scholar]
- Fan G, Zhang C, Wei X, Wei R, Qi Z, Chen K. NEAT1/hsa-miR-372-3p axis participates in rapamycin-induced lipid metabolic disorder. Free Radic Biol Med 2021; 167:1-11. doi: 10.1016/j.freeradbiomed.2021.02.033 [Crossref] [ Google Scholar]
- Tajik F, Alian F, Yousefi M, Azadfallah A, Hoseini A, Mohammadi F. MicroRNA-372 acts as a double-edged sword in human cancers. Heliyon 2023; 9:e15991. doi: 10.1016/j.heliyon.2023.e15991 [Crossref] [ Google Scholar]
- Ariyachet C, Chuaypen N, Kaewsapsak P, Chantaravisoot N, Jindatip D, Potikanond S. MicroRNA-223 suppresses human hepatic stellate cell activation partly via regulating the actin cytoskeleton and alleviates fibrosis in organoid models of liver injury. Int J Mol Sci 2022; 23:9380. doi: 10.3390/ijms23169380 [Crossref] [ Google Scholar]
- Li X, Yang H, Huang H, Zhu T. CELLCOUNTER: novel open-source software for counting cell migration and invasion in vitro. Biomed Res Int 2014; 2014:863564. doi: 10.1155/2014/863564 [Crossref] [ Google Scholar]
- Ge SX, Jung D, Yao R. ShinyGO: a graphical gene-set enrichment tool for animals and plants. Bioinformatics 2020; 36:2628-9. doi: 10.1093/bioinformatics/btz931 [Crossref] [ Google Scholar]
- Subramanian A, Tamayo P, Mootha VK, Mukherjee S, Ebert BL, Gillette MA. Gene set enrichment analysis: a knowledge-based approach for interpreting genome-wide expression profiles. Proc Natl Acad Sci U S A 2005; 102:15545-50. doi: 10.1073/pnas.0506580102 [Crossref] [ Google Scholar]
- Mootha VK, Lindgren CM, Eriksson KF, Subramanian A, Sihag S, Lehar J. PGC-1alpha-responsive genes involved in oxidative phosphorylation are coordinately downregulated in human diabetes. Nat Genet 2003; 34:267-73. doi: 10.1038/ng1180 [Crossref] [ Google Scholar]
- Luo W, Pant G, Bhavnasi YK, Blanchard SG Jr, Brouwer C. Pathview Web: user friendly pathway visualization and data integration. Nucleic Acids Res 2017; 45:W501-8. doi: 10.1093/nar/gkx372 [Crossref] [ Google Scholar]
- Luo W, Brouwer C. Pathview: an R/Bioconductor package for pathway-based data integration and visualization. Bioinformatics 2013; 29:1830-1. doi: 10.1093/bioinformatics/btt285 [Crossref] [ Google Scholar]
- Luo W, Friedman MS, Shedden K, Hankenson KD, Woolf PJ. GAGE: generally applicable gene set enrichment for pathway analysis. BMC Bioinformatics 2009; 10:161. doi: 10.1186/1471-2105-10-161 [Crossref] [ Google Scholar]
- Szklarczyk D, Kirsch R, Koutrouli M, Nastou K, Mehryary F, Hachilif R. The STRING database in 2023: protein-protein association networks and functional enrichment analyses for any sequenced genome of interest. Nucleic Acids Res 2023; 51:D638-46. doi: 10.1093/nar/gkac1000 [Crossref] [ Google Scholar]
- Gómez-Lechón MJ, Donato MT, Martínez-Romero A, Jiménez N, Castell JV, O'Connor JE. A human hepatocellular in vitro model to investigate steatosis. Chem Biol Interact 2007; 165:106-16. doi: 10.1016/j.cbi.2006.11.004 [Crossref] [ Google Scholar]
- Adomshick V, Pu Y, Veiga-Lopez A. Automated lipid droplet quantification system for phenotypic analysis of adipocytes using CellProfiler. Toxicol Mech Methods 2020; 30:378-87. doi: 10.1080/15376516.2020.1747124 [Crossref] [ Google Scholar]
- Kaczmarek I, Suchý T, Strnadová M, Thor D. Qualitative and quantitative analysis of lipid droplets in mature 3T3-L1 adipocytes using oil red O. STAR Protoc 2024. 5: 102977. doi: 10.1016/j.xpro.2024.102977.
- Meng Y, Guo D, Lin L, Zhao H, Xu W, Luo S. Glycolytic enzyme PFKL governs lipolysis by promoting lipid droplet-mitochondria tethering to enhance β-oxidation and tumor cell proliferation. Nat Metab 2024; 6:1092-107. doi: 10.1038/s42255-024-01047-2 [Crossref] [ Google Scholar]
- Chaudhry A, Shi R, Luciani DS. A pipeline for multidimensional confocal analysis of mitochondrial morphology, function, and dynamics in pancreatic β-cells. Am J Physiol Endocrinol Metab 2020; 318:E87-101. doi: 10.1152/ajpendo.00457.2019 [Crossref] [ Google Scholar]
- Wang J, Fang N, Xiong J, Du Y, Cao Y, Ji WK. An ESCRT-dependent step in fatty acid transfer from lipid droplets to mitochondria through VPS13D-TSG101 interactions. Nat Commun 2021; 12:1252. doi: 10.1038/s41467-021-21525-5 [Crossref] [ Google Scholar]
- Kim JJ, Yang EJ, Molina David J, Cho S, Ficarella M, Pape N. Ezetimibe enhances lipid droplet and mitochondria contact formation, improving fatty acid transfer and reducing lipotoxicity in Alport syndrome podocytes. Int J Mol Sci 2024; 25:13134. doi: 10.3390/ijms252313134 [Crossref] [ Google Scholar]
- Lam J, Katti P, Biete M, Mungai M, AshShareef S, Neikirk K. A universal approach to analyzing transmission electron microscopy with ImageJ. Cells 2021; 10:2177. doi: 10.3390/cells10092177 [Crossref] [ Google Scholar]
- Ru Y, Kechris KJ, Tabakoff B, Hoffman P, Radcliffe RA, Bowler R. The multiMiR R package and database: integration of microRNA-target interactions along with their disease and drug associations. Nucleic Acids Res 2014; 42:e133. doi: 10.1093/nar/gku631 [Crossref] [ Google Scholar]
- Krüger J, Rehmsmeier M. RNAhybrid: microRNA target prediction easy, fast and flexible. Nucleic Acids Res 2006; 34:W451-4. doi: 10.1093/nar/gkl243 [Crossref] [ Google Scholar]
- Zhang T, Zhang Y, Liu J, Ma Y, Ye Q, Yan X. MicroRNA-377-3p inhibits hepatocellular carcinoma growth and metastasis through negative regulation of CPT1C-mediated fatty acid oxidation. Cancer Metab 2022; 10:2. doi: 10.1186/s40170-021-00276-3 [Crossref] [ Google Scholar]
- Wang S, Wang K, Yue D, Yang X, Pan X, Kong F. MT1G induces lipid droplet accumulation through modulation of H3K14 trimethylation accelerating clear cell renal cell carcinoma progression. Br J Cancer 2024; 131:641-54. doi: 10.1038/s41416-024-02747-y [Crossref] [ Google Scholar]
- Wang R, Zhao J, Jin J, Tian Y, Lan L, Wang X. WY-14643 attenuates lipid deposition via activation of the PPARα/CPT1A axis by targeting Gly335 to inhibit cell proliferation and migration in ccRCC. Lipids Health Dis 2022; 21:121. doi: 10.1186/s12944-022-01726-7 [Crossref] [ Google Scholar]
- Wang M, Han J, Xing H, Zhang H, Li Z, Liang L. Dysregulated fatty acid metabolism in hepatocellular carcinoma. Hepat Oncol 2016; 3:241-51. doi: 10.2217/hep-2016-0012 [Crossref] [ Google Scholar]
- Ma X, Qian H, Chen A, Ni HM, Ding WX. Perspectives on mitochondria-ER and mitochondria-lipid droplet contact in hepatocytes and hepatic lipid metabolism. Cells 2021; 10:2273. doi: 10.3390/cells10092273 [Crossref] [ Google Scholar]
- Benador IY, Veliova M, Liesa M, Shirihai OS. Mitochondria bound to lipid droplets: where mitochondrial dynamics regulate lipid storage and utilization. Cell Metab 2019; 29:827-35. doi: 10.1016/j.cmet.2019.02.011 [Crossref] [ Google Scholar]
- Kloska A, Węsierska M, Malinowska M, Gabig-Cimińska M, Jakóbkiewicz-Banecka J. Lipophagy and lipolysis status in lipid storage and lipid metabolism diseases. Int J Mol Sci 2020; 21:6113. doi: 10.3390/ijms21176113 [Crossref] [ Google Scholar]
- Zhang H. Lysosomal acid lipase and lipid metabolism: new mechanisms, new questions, and new therapies. Curr Opin Lipidol 2018; 29:218-23. doi: 10.1097/mol.0000000000000507 [Crossref] [ Google Scholar]
- Ngo J, Choi DW, Stanley IA, Stiles L, Molina AJA, Chen PH. Mitochondrial morphology controls fatty acid utilization by changing CPT1 sensitivity to malonyl-CoA. EMBO J 2023; 42:e111901. doi: 10.15252/embj.2022111901 [Crossref] [ Google Scholar]
- Wu G, Wang Y, Lu X, He H, Liu H, Meng X. Low mir-372 expression correlates with poor prognosis and tumor metastasis in hepatocellular carcinoma. BMC Cancer 2015; 15:182. doi: 10.1186/s12885-015-1214-0 [Crossref] [ Google Scholar]
- Houten SM, Violante S, Ventura FV, Wanders RJ. The biochemistry and physiology of mitochondrial fatty acid β-oxidation and its genetic disorders. Annu Rev Physiol 2016; 78:23-44. doi: 10.1146/annurev-physiol-021115-105045 [Crossref] [ Google Scholar]
- Qu Q, Zeng F, Liu X, Wang QJ, Deng F. Fatty acid oxidation and carnitine palmitoyltransferase I: emerging therapeutic targets in cancer. Cell Death Dis 2016; 7:e2226. doi: 10.1038/cddis.2016.132 [Crossref] [ Google Scholar]
- Yao M, Zhou P, Qin YY, Wang L, Yao DF. Mitochondrial carnitine palmitoyltransferase-II dysfunction: a possible novel mechanism for nonalcoholic fatty liver disease in hepatocarcinogenesis. World J Gastroenterol 2023; 29:1765-78. doi: 10.3748/wjg.v29.i12.1765 [Crossref] [ Google Scholar]
- Kim S, Lee I, Piao S, Nagar H, Choi SJ, Kim YR. miR204 potentially promotes non-alcoholic fatty liver disease by inhibition of cpt1a in mouse hepatocytes. Commun Biol 2022; 5:1002. doi: 10.1038/s42003-022-03945-1 [Crossref] [ Google Scholar]
- Han S, Wei R, Zhang X, Jiang N, Fan M, Huang JH. CPT1A/2-mediated FAO enhancement-a metabolic target in radioresistant breast cancer. Front Oncol 2019; 9:1201. doi: 10.3389/fonc.2019.01201 [Crossref] [ Google Scholar]
- Shaw TA, Singaravelu R, Powdrill MH, Nhan J, Ahmed N, Özcelik D. MicroRNA-124 regulates fatty acid and triglyceride homeostasis. iScience 2018; 10:149-57. doi: 10.1016/j.isci.2018.11.028 [Crossref] [ Google Scholar]
- Liu Y, Wang F, Yan G, Tong Y, Guo W, Li S. CPT1A loss disrupts BCAA metabolism to confer therapeutic vulnerability in TP53-mutated liver cancer. Cancer Lett 2024; 595:217006. doi: 10.1016/j.canlet.2024.217006 [Crossref] [ Google Scholar]
- Iliopoulos D, Drosatos K, Hiyama Y, Goldberg IJ, Zannis VI. MicroRNA-370 controls the expression of microRNA-122 and Cpt1alpha and affects lipid metabolism. J Lipid Res 2010; 51:1513-23. doi: 10.1194/jlr.M004812 [Crossref] [ Google Scholar]
- Valentino A, Calarco A, Di Salle A, Finicelli M, Crispi S, Calogero RA. Deregulation of microRNAs mediated control of carnitine cycle in prostate cancer: molecular basis and pathophysiological consequences. Oncogene 2017; 36:6030-40. doi: 10.1038/onc.2017.216 [Crossref] [ Google Scholar]
- Li H, Chen J, Liu J, Lai Y, Huang S, Zheng L. CPT2 downregulation triggers stemness and oxaliplatin resistance in colorectal cancer via activating the ROS/Wnt/β-catenin-induced glycolytic metabolism. Exp Cell Res 2021; 409:112892. doi: 10.1016/j.yexcr.2021.112892 [Crossref] [ Google Scholar]
- Fujiwara N, Nakagawa H, Enooku K, Kudo Y, Hayata Y, Nakatsuka T. CPT2 downregulation adapts HCC to lipid-rich environment and promotes carcinogenesis via acylcarnitine accumulation in obesity. Gut 2018; 67:1493-504. doi: 10.1136/gutjnl-2017-315193 [Crossref] [ Google Scholar]
- Zeng K, Li Q, Song G, Chen B, Luo M, Miao J. CPT2-mediated fatty acid oxidation inhibits tumorigenesis and enhances sorafenib sensitivity via the ROS/PPARγ/NF-κB pathway in clear cell renal cell carcinoma. Cell Signal 2023; 110:110838. doi: 10.1016/j.cellsig.2023.110838 [Crossref] [ Google Scholar]
- Liu F, Li X, Yan H, Wu J, Yang Y, He J. Downregulation of CPT2 promotes proliferation and inhibits apoptosis through p53 pathway in colorectal cancer. Cell Signal 2022; 92:110267. doi: 10.1016/j.cellsig.2022.110267 [Crossref] [ Google Scholar]
- Duan Y, Liu J, Li A, Liu C, Shu G, Yin G. The role of the CPT family in cancer: searching for new therapeutic strategies. Biology (Basel) 2024; 13:892. doi: 10.3390/biology13110892 [Crossref] [ Google Scholar]
- Watkins PA, Ellis JM. Peroxisomal acyl-CoA synthetases. Biochim Biophys Acta 2012; 1822:1411-20. doi: 10.1016/j.bbadis.2012.02.010 [Crossref] [ Google Scholar]
- Liu J, Waugh MG. The regulation and functions of ACSL3 and ACSL4 in the liver and hepatocellular carcinoma. Liver Cancer Int 2023; 4:28-41. doi: 10.1002/lci2.68 [Crossref] [ Google Scholar]
- Yuan M, Mahmud I, Katsushima K, Joshi K, Saulnier O, Pokhrel R. miRNA-211 maintains metabolic homeostasis in medulloblastoma through its target gene long-chain acyl-CoA synthetase 4. Acta Neuropathol Commun 2023; 11:203. doi: 10.1186/s40478-023-01684-w [Crossref] [ Google Scholar]
- Qin X, Zhang J, Lin Y, Sun XM, Zhang JN, Cheng ZQ. Identification of miR-211-5p as a tumor suppressor by targeting ACSL4 in hepatocellular carcinoma. J Transl Med 2020; 18:326. doi: 10.1186/s12967-020-02494-7 [Crossref] [ Google Scholar]
- Cheng J, Fan YQ, Liu BH, Zhou H, Wang JM, Chen QX. ACSL4 suppresses glioma cells proliferation via activating ferroptosis. Oncol Rep 2020; 43:147-58. doi: 10.3892/or.2019.7419 [Crossref] [ Google Scholar]
- Lu Y, Chan YT, Tan HY, Zhang C, Guo W, Xu Y. Epigenetic regulation of ferroptosis via ETS1/miR-23a-3p/ACSL4 axis mediates sorafenib resistance in human hepatocellular carcinoma. J Exp Clin Cancer Res 2022; 41:3. doi: 10.1186/s13046-021-02208-x [Crossref] [ Google Scholar]
- Fang X, Song J, Chen Y, Zhu S, Tu W, Ke B. LncRNA SNHG1 knockdown inhibits hyperglycemia induced ferroptosis via miR-16-5p/ACSL4 axis to alleviate diabetic nephropathy. J Diabetes Investig 2023; 14:1056-69. doi: 10.1111/jdi.14036 [Crossref] [ Google Scholar]
- Bao C, Zhang J, Xian SY, Chen F. MicroRNA-670-3p suppresses ferroptosis of human glioblastoma cells through targeting ACSL4. Free Radic Res 2021; 55:853-64. doi: 10.1080/10715762.2021.1962009 [Crossref] [ Google Scholar]
- Dai Y, Chen Y, Mo D, Jin R, Huang Y, Zhang L. Inhibition of ACSL4 ameliorates tubular ferroptotic cell death and protects against fibrotic kidney disease. Commun Biol 2023; 6:907. doi: 10.1038/s42003-023-05272-5 [Crossref] [ Google Scholar]
- Huang Q, Ru Y, Luo Y, Luo X, Liu D, Ma Y. Identification of a targeted ACSL4 inhibitor to treat ferroptosis-related diseases. Sci Adv 2024; 10:eadk1200. doi: 10.1126/sciadv.adk1200 [Crossref] [ Google Scholar]
- Cao D, Zheng J, Li Z, Yu Y, Chen Z, Wang Q. ACSL4 inhibition prevents macrophage ferroptosis and alleviates fibrosis in bleomycin-induced systemic sclerosis model. Arthritis Res Ther 2023; 25:212. doi: 10.1186/s13075-023-03190-9 [Crossref] [ Google Scholar]
- Luo M, Liu YQ, Zhang H, Luo CH, Liu Q, Wang WY. Overexpression of carnitine palmitoyltransferase 1A promotes mitochondrial fusion and differentiation of glioblastoma stem cells. Lab Invest 2022; 102:722-30. doi: 10.1038/s41374-021-00724-0 [Crossref] [ Google Scholar]
- Zhu Y, Wang Y, Li Y, Li Z, Kong W, Zhao X. Carnitine palmitoyltransferase 1A promotes mitochondrial fission by enhancing MFF succinylation in ovarian cancer. Commun Biol 2023; 6:618. doi: 10.1038/s42003-023-04993-x [Crossref] [ Google Scholar]
- Wu D, Yang Y, Hou Y, Zhao Z, Liang N, Yuan P. Increased mitochondrial fission drives the reprogramming of fatty acid metabolism in hepatocellular carcinoma cells through suppression of sirtuin 1. Cancer Commun (Lond) 2022; 42:37-55. doi: 10.1002/cac2.12247 [Crossref] [ Google Scholar]
- Song JE, Alves TC, Stutz B, Šestan-Peša M, Kilian N, Jin S. Mitochondrial fission governed by Drp1 regulates exogenous fatty acid usage and storage in Hela cells. Metabolites 2021; 11:322. doi: 10.3390/metabo11050322 [Crossref] [ Google Scholar]
- Sun L, Wang X, Chen L, Gao Z, Xu S, Hu C. CPT1A mediates chemoresistance in human hypopharyngeal squamous cell carcinoma via ATG16L1-dependent cellular autophagy. Cell Insight 2023; 2:100127. doi: 10.1016/j.cellin.2023.100127 [Crossref] [ Google Scholar]