BioImpacts. 7(1):5-12.
doi: 10.15171/bi.2017.02
Original Research
Liquigroud technique: a new concept for enhancing dissolution rate of glibenclamide by combination of liquisolid and co-grinding technologies
Leila Azharshekoufeh 1, Javad Shokri 1, Mohammad Barzegar-Jalali 1, 2, Yousef Javadzadeh 1, 3, *
Author information:
1Drug Applied Research Center, Faculty of Pharmacy, Tabriz University of Medical Sciences, Tabriz, Iran
2Research Center for Pharmaceutical Nanotechnology, Faculty of Pharmacy, Tabriz University of Medical Sciences, Tabriz, Iran
3Biotechnology Research Center, Faculty of Pharmacy, Tabriz University of Medical Sciences, Tabriz, Iran
Abstract
Introduction:
The potential of combining liquisolid and co-grinding technologies (liquiground technique) was investigated to improve the dissolution rate of a water-insoluble agent (glibenclamide) with formulation-dependent bioavailability.
Methods:
To this end, different formulations of liquisolid tablets with a wide variety of non-volatile solvents contained varied ratios of drug: solvent and dissimilar carriers were prepared, and then their release profiles were evaluated. Furthermore, the effect of size reduction by ball milling on the dissolution behavior of glibenclamide from liquisolid tablets was investigated. Any interaction between the drug and the excipient or crystallinity changes during formulation procedure was also examined using X-ray diffraction (XRD) and differential scanning calorimetry (DSC).
Results:
The present study revealed that classic liquisolid technique did not significantly affect the drug dissolution profile as compared to the conventional tablets. Size reduction obtained by co-grinding of liquid medication was more effective than the implementation of liquisolid technique in enhancing the dissolution rate of glibenclamide. The XRD and DSC data displayed no formation of complex or any crystallinity changes in both formulations.
Conclusion:
An enhanced dissolution rate of glibenclamide is achievable through the combination of liquisolid and co-grinding technologies.
Keywords: Co-grinding, Dissolution rate, Glibenclamide, Liquiground, Liquisolid
Copyright and License Information
© 2017 The Author(s)
This work is published by BioImpacts as an open access article distributed under the terms of the Creative Commons Attribution License (
http://creativecommons.org/licenses/by-nc/4.0/). Non-commercial uses of the work are permitted, provided the original work is properly cited.
Introduction
Marketed as glyburide in the United States and Canada, glibenclamide is categorized as the second generation sulfonylurea employed in the treatment of type II non-insulin-dependent diabetes.
1,2
Although glibenclamide has side effects similar to the first generation of oral drugs,
3
the second generation sulfonylurea agents have extra side chains with lipophilic nature which result in an increased hypoglycemic potency. Glibenclamide is one of the most prescribed antidiabetic medications
4
categorized as class II according to the biopharmaceutical classification system (BCS).
5
However, its poor solubility in gastrointestinal fluid results in variable dissolution profile and formulation-dependent bioavailability when it is administered via oral route.
6
Since solubility is an essential factor to obtain the pharmacological and therapeutic response, various approaches are engaged to promote the dissolution behavior of poorly soluble medications. Numerous techniques have been suggested to optimize the dissolution feature of poorly water-soluble drugs divided into chemical and physical modifications.
7
Chemical modifications consist of pH change,
8
use of buffer,
9
derivatization, and salt formation.
10
Physical modifications include particle size reduction,
11
crystal engineering,
12
cryogenic techniques,
13
complex formation-based techniques,
14
drug dispersion in carriers,
15
and liquisolid techniques.
16-18
Regarding the dissolution enhancement of glibenclamide, some methods such as solid dispersion method,
6
co-administration of water-soluble polymers like HPMC
19
using self-microemulsifying drug delivery system,
20
and complexation with cyclodextrins
21
have been employed in recent years. Some of the aforementioned methods have a number of drawbacks which render them uneconomical and unscalable. On the other hand, liquisolid technique has been suggested to be an efficient method in enhancing the dissolution profile of such insoluble drugs. This technique has gained particular interest owing to its simplicity, potential for industrial production, and low cost.
22
Recently, a number of studies have probed into the efficiency and effects of different factors on liquisolid formulations.
17,23
The present study aimed to evaluate the glibenclamide dissolution profile by applying classic liquisolid technology and also in combination with co-grinding method, so-called liquiground technique. The impacts of various factors including carrier type, drug concentration in liquid medication, and solvent type on the drug release were also investigated.
Materials and Methods
Materials
Glibenclamide was obtained from Mahban Chemi Co. (Tehran, Iran). Coarse granular microcrystalline cellulose (Avicel) (Mingtai Chemical, Bah-Dern City, Taiwan), sodium starch glycolate (Yung Zip Chemical, Taichung City, Taiwan), nm-sized amorphous silicon dioxide (Mingtai Chemical, Bah-Der City, Taiwan), Polyoxyethylene (40) Stearate (MYRJ™ 52) (Croda, Trappes, France), polyvinylpyrrolidone (PVP) and Cremophor® RH 40 (BASF, Germany), polyethylene glycol (PEG 200 and 400), glycerine, propylene glycol (PG), polyoxyethylenlaurylether (Brij35), lactose monohydrate (Pharmaceutical grade), sodium hydroxide and potassium dihydrogen phosphate were obtained from Merck, (Darmstadt, Germany). Diethylene glycol monoethyl ether (transcutol P) was supplied by Gattefosse (Lyon, France).
Solubility studies
Nonvolatile solvents including PEG 200, PEG 400, glycerin, polysorbate 20, polysorbate 80, PG along with transcutol P and 10 and 20% (w/v) aqueous solution of Brij, Myrj, and cremophore were used to measure the solubility of glibenclamide. We obtained saturated solutions of glibenclamide through shaking glibenclamide solutions on the shaker (Velp, Italy) for a duration of 48 hours at 25°C. Then, the prepared solutions were filtered in order to separate excess and unsolved drug, and they were analyzed by UV-spectrophotometer (Shimadzu 160A, Japan) at a wavelength of 299 nm after dilution with distilled water.
Preparation of conventional tablets and liquisolid compacts
Glibenclamide conventional tablets (CT) were prepared by supplementing the drug powder to microcrystalline cellulose (Avicel™) or lactose–silica (R = ratio of carrier: silica was 20:1) for 10 minutes in a mortar. Afterward, sodium starch glycolate, which acted as a disintegrating agent, was added and mixed for 10 minutes. Then, 1% w/w magnesium stearate was added to the final formulations as lubricant. The mixture was compressed on a 10-mm punch and die using a manual-tableting machine (Riken, Saitama, Japan). Sufficient compression load was applied in order to produce tablets with the hardness of 6–7 kg. This formulation was denoted as conventional tablets (CTa and CTl) and each tablet contained 10 mg glibenclamide. Content uniformity of all prepared tablets was found to be in an acceptable range (±15%).
To formulate liquisolid compacts, glibenclamide liquid medications were prepared by dispersing the drug in the liquid vehicle (PEG200 or PG), with two different ratios: 1:19 (5%) and 1:9 (10%) of drug to solvent. Then, microcrystalline cellulose or lactose as the carrier powder was added to the liquid medication, and silica as the coating material (with a ratio of 20) was added to the mixture under continuous mixing in a mortar. In this study, depending on the ratios of the drug:solvent in formulation, different liquid load factors (LFs) - the liquid Lf that is the weight ratio of the liquid medication and carrier powder in the liquid solid formulations - were employed in the liquisolid formulations.
These amounts of carrier and coating materials were adequate for obtaining an optimum flow.
Then, 5% w/w of sodium starch glycolate as a disintegrating agent was added to the mixture. Following 10 minutes mixing process, the mixture was supplemented with 1 %w/w magnesium stearate. The new mixture was kept under compression in order to produce tablets with 6-7 kg hardness.
In preparing granules, PVP solution (6% w/v) that functioned as a binder was sprayed into the mixture to get a humid mixture. The mixture was granulated using a 12-mesh sieve. After a lapse of 24 hours, the dried mixture, which was kept at room temperature (25 ± 1°C), was sieved with a 20-mesh sieve. Later, the granules were subjected to compression.
Liquid medication of formulations F8 and F9 were prepared by adding glibenclamid to PEG200 (1:9) and grinding them in a ball mill (Retsch® PM100, Germany) in 12.5 mL chamber containing 5 balls with 10 mm diameter. The grinding condition was as follows: Total rotating duration: 3 hours, 350 rpm, diverse rotation, and 10 minutes intervals.
The same conditions were set to prepare glibenclamide and lactose (i.e., the same amount as CT formulation) co-grinding. The details of the prepared formulations are illustrated in Table 1.
Table 1.
Key formulation characteristics of the prepared glibenclamide tablets
|
Formulations
|
Types of solvents
|
Carriers
|
Drug concentrations
(in liquid medication (%w/w))
|
Methods of preparation
|
|
F1 (CTa)
|
- |
Avicel |
- |
Direct Compression |
|
F2 (LSa1)
|
PEG200 |
Avicel |
5 |
Liquisolid |
|
F3 (LSa2)
|
PEG200 |
Avicel |
10 |
Liquisolid |
|
F4 (LSa3)
|
PEG200 |
Avicel |
10 |
Granulation+Liquisolid |
|
F5 (LSa4)
|
PG |
Avicel |
10 |
Liquisolid |
|
F6 (CTl)
|
- |
Lactose |
- |
Direct Compression |
|
F7 (LSl1)
|
PEG200 |
Lactose |
10 |
Liquisolid |
|
F8 (LSl2)
|
PEG200 |
Lactose |
5 |
Liquisolid |
|
F9 (LSa5)
|
PEG200 |
Avicel |
10 |
Liquisolid+Ballmill |
|
F10 (LSl3)
|
PEG200 |
Lactose |
10 |
Liquisolid+Ballmill |
|
F11 (CGl)
|
- |
Lactose |
- |
Ballmill (co-grinding) |
Calculation of the loading factor
To this end, PEG200 was added to 30 g of carrier–silica mixture (ratio of carrier: silica was 20:1) and blended for 10 minutes. Based on previous studies, this ratio was optimum to obtain acceptable tablet properties. By using flowmeter (Erweka, Germany), the flowability of these systems was measured. Flow rates higher than 10 cm3/s were considered as being acceptable. This procedure was repeated using different amounts of PEG200 until a powder with an acceptable flow was reached. According to Lf= W/Q formula (W: amount of liquid medication and Q: amount of carrier material), the Lf values were calculated and satisfactory amounts of coating material and carrier for each formulation were attained.
Dissolution studies
All the in vitro dissolution studies were carried out using the USP paddle method (apparatus II) (Erweka, DPT6R, Heusenstamm, Germany). In this method, 0.05 M phosphate buffer with pH 8.5 (6.8 g of monobasic potassium phosphate and 1.99 g of sodium hydroxide in 1 L of water, and adjusted with diluted phosphoric acid or sodium hydroxide to a PH of 8.5 ± 0.05) based on the USP for micronized glibenclamide (16.467 µm) was used as the dissolution medium. The rate of stirring was 50 ± 2 rpm. All the formulations contained 10 mg glibenclamide. The tablets were placed in 900 mL of 0.05 M phosphate buffer and temperature of the buffers was kept at 37 ± 0.1C. At appropriate intervals (5, 10, 15, 30, 60, 120, 240 and 360 minutes), the same amount of the samples were removed and filtered through a 0.45-mm Millipore filter. The dissolution medium was then replaced with the same volume of fresh dissolution fluid to maintain a constant volume. The samples were analyzed at 299 nm using UV/visible spectrophotometer. The mean value of 3 determinations was used to calculate the drug release from each formulation. To assess and compare dissolution profiles, the similarity factor (f2)
24
was calculated. We found a significant result (f2<50). The obtained release profiles of conventional tablets and liquisolid formulations were compared using similarity factors, f2, as defined by equation (Eq.) 1:
(Eq. 1)
where, n is the number of time points at which % dissolved was determined, Rt is the dissolved percentage of one formulation at a given time point, and Tt is the dissolved percentage of the formulation to be compared at the same time point.
The similarity factor fits the result between 0 and 100. When the test and reference profiles are identical, it would be 100 and approaches 0 as the dissimilarity increases. An f2 above 50 indicates that two profiles are similar. The obtained release data were analyzed using several kinetic models according to the method described by Barzegar Jalali and coworkers.
25
Particle size analysis
Shimadzu (SALD-2120) (Kyoto, Japan) was used to determine the particle size of glibenclamide powder and glibenclamide containing co-grinding formulations.
X-ray powder diffraction
X-ray diffractometry of glibenclamide powder and formulations was carried out using Siemens diffractometer (Siemens, D5000, Konstanz, Germany) with a rate of scanning equal to 0.6°/min. The cross-section of the samples was exposed to X-ray radiation (Cu Kα) at the wavelength of 1.5406 °A.
Differential scanning calorimetry (DSC)
Thermograms of glibenclamide powder and formulations were recorded on a DSC-60 (Shimadzu, Konstanz, Japan) with a scanning rate of 10°C/min. About 5 mg of the samples were put in aluminum pans. Their thermal behavior ranged from 30 to 300°C.
Results
Solubility findings
In order to increase the molecular fraction of drug in the applied solvent, the saturated solubility of glibenclamide in different kinds of the solvents were determined. As shown in Table 2, the highest saturated solubility of glibenclamide in solvents is attributed to PEG200. Then, PEG200 was selected as a non-volatile solvent to generate liquisolid formulations.
Table 2.
Solubility data of glibenclamide in various solvents
|
Solvents
|
Solubilities (mg/mL)
|
|
PEG 200
|
11.418 |
|
PEG 400
|
8.533 |
|
PG
|
1.737 |
|
Polysorbate 80
|
2.014 |
|
Polysorbate 20
|
8.172 |
|
Glycerin
|
0.071 |
|
10% BRIJ
|
0.168 |
|
20% BRIJ
|
0.358 |
|
10% MYRJ
|
0.158 |
|
20% MYRJ
|
0.577 |
|
10% Cremophore
|
0.114 |
|
20% Cremophore
|
0.809 |
|
Transcutol P
|
0.019 |
|
Phosphate buffer (pH=8.5)
|
0.053 |
Dissolution analysis
The dissolution profiles of different liquisolid compacts were prepared using Avicel and PEG 200. The related conventional tablets are illustrated in Fig. 1A. As shown in Fig. 1, the lowest release rate was obtained from the granulated liquisolid tablets (F4). The data also revealed that there was no significant difference between the dissolution behaviors of the formulations with PEG10% or PEG5% and conventional tablets (f2= 50.21 and 62.91, respectively). Although PEG5% containing formulation (F2) showed a superior dissolution rate than that of PEG10% (F3) during the first one hour, there was no statistically significant difference between their dissolution profiles (f2= 63.85).
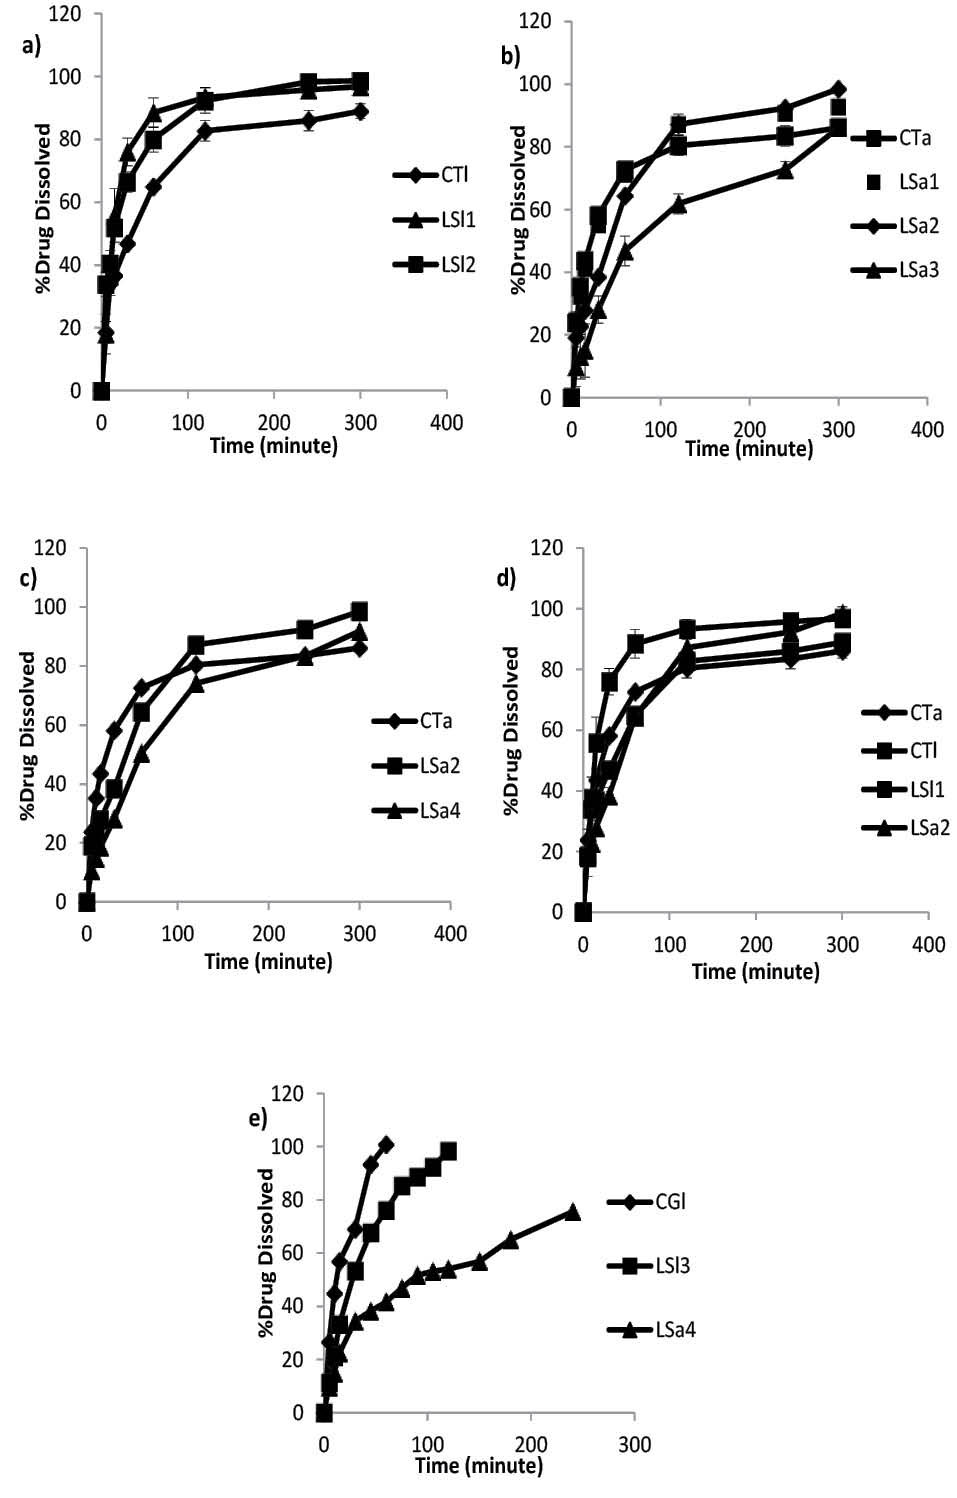
Fig. 1.
Dissolution profiles of Avicel conventional tablet (CTa), Avicel liquisolid compacts prepared by PEG 200 with 10% (LS1) and 5% (LS2) drug concentration in liquid medication (a), lactose conventional tablet (CTl), lactose liquisolid compacts prepared by PEG200 with 5% (LSl1), 10% (LS12) and granulated liquisolid compact (LSl3) (b), Avicel liquisolid compacts prepared by different solvents: PEG200 (LSa2) and PG (LSa4) with 10% drug concentration (c), Avicel and lactose liquisolid formulations with 10% drug concentration (LSa2 and LSl1) and their related conventional tablets (CTa and CTl) (d), Ball milled Avicel and lactose liquisolid compacts (LSa5 and LSl3) along with compressed tablet prepared by drug-lactose co-ground (CGl) (e).
.
Dissolution profiles of Avicel conventional tablet (CTa), Avicel liquisolid compacts prepared by PEG 200 with 10% (LS1) and 5% (LS2) drug concentration in liquid medication (a), lactose conventional tablet (CTl), lactose liquisolid compacts prepared by PEG200 with 5% (LSl1), 10% (LS12) and granulated liquisolid compact (LSl3) (b), Avicel liquisolid compacts prepared by different solvents: PEG200 (LSa2) and PG (LSa4) with 10% drug concentration (c), Avicel and lactose liquisolid formulations with 10% drug concentration (LSa2 and LSl1) and their related conventional tablets (CTa and CTl) (d), Ball milled Avicel and lactose liquisolid compacts (LSa5 and LSl3) along with compressed tablet prepared by drug-lactose co-ground (CGl) (e).
With respect to the use of lactose as a carrier in liquisolid formulations as demonstrated in Fig. 1B, although the greatest release is devoted to PEG5% containing formulation (F8) in 300 minutes, there were no significant differences between the release profiles of PEG 10%, 5% containing formulations and conventional tablet (f2= 51.17 and 57.60, respectively).
The effect of different solvents on release profile is depicted in Fig. 1C. The total amount of the drug released from PEG 10% was greater than that of the PG containing formulation, and the amount released by PG was greater than that of the CT (98.49, 91.80 and 86.14%, respectively). Moreover, there were no significant differences between the release profiles of PEG10% and PG containing formulations (f2=54.08).
To assess the impact of carrier type on the dissolution of glibenclamide from liquisolid formulations, two formulations were prepared with lactose instead of Avicel containing 5 and 10% (w/w) of drug in liquid medication. It is also believed that this carrier has the ability to absorb the solvent. However, additional quantities of lactose is required to change the liquid medication to powder in comparison to Avicel which, in turn, results in less LF in lactose containing liquisolid formulations. This could be attributed to the low specific surface area of lactose (0.35 m2/g) compared to Avicel (1.18 m2/g) since the liquid adsorption ability is influenced by the specific surface area of the carrier.
26
As expected, compacts containing lactose and PEG5% had the highest drug release in comparison to PEG 10% and CT. In this regard, liquisolid formulations had significantly different release data in comparison to CT. Although, drug concentration had no significant effect on the dissolution pattern of F7 and F8, those f2 values revealed the same dissolution profiles for both of them (f2=60.37). Release profiles of glibenclamide from Avicel and lactose contained liquisolid formulation and their related conventional tablets are shown in Fig. 1D.
Given that stomach is the first place where a tablet is settled after being swallowed, dissolution profile tests were performed in SGF. The results indicated that only a very small amount of the drug was released (7% of F7 and 6.3% of CT within 300 minutes). This finding could be attributed to the very low solubility of the drug, especially at low pH values. Therefore, glibenclamid dissolution tests are recommended in order to attain a better result at higher pH range along with surfactant based on pharmacopeia.
In spite of the implementation of all possible changes in liquisolid formulation including drug concentration, solvent and carrier type, the obtained dissolution results did not show better dissolution profiles. In an innovative study, the preparation of liquid medication was carried out in a ball mill instead of mortar in order to achieve more size reduction. Based on the findings of the drug size analysis, co-grinding of drug dispersed in PEG200 by ball mill produced nano-suspension. The obtained nano-suspention contained nano-sized drug particles (637 nm) compared to micro dispersed glibenclamide particles (10.57 µm) prepared in mortar. As shown in Fig. 1E, the release rate of liquisolid formulation with 10% nano-sized glibenclamide in the solvents of both lactose and Avicel is faster than those in formulations prepared via classic liquisolid technique.
Release kinetics analysis
The R2 values of different kinetic models were demonstrated in Table 3 for classic liquisolid, liquiground and their related conventional tablets. As shown in Table 3, the glibenclamide release patterns were overall best fit with Pepas kinetic model in which optimized values (best correlations) belonged to LSa5 and LSl3 (liquiground formulation) with 0.9943 and 0.9909, respectively. The closest correlation (0.9943) was obtained for LSl3 in Hixon kinetic model.
Table 3.
Obtained results for different kinetic models
|
Kinetic models
|
Formulations coefficient of determination (R2)
|
|
CTa
|
LSa1
|
LSa2
|
LSa3
|
LSa4
|
LSa5
|
CTl
|
LSL1
|
LSI2
|
LSL3
|
|
Zero
|
0.637839 |
0.637839 |
0.805459 |
0.779469 |
0.843056 |
0.909996 |
0.737994 |
0.479254 |
0.70224 |
0.918187 |
|
First
|
0.806806 |
0.806806 |
0.9541 |
0.947344 |
0.967717 |
0.988022 |
0.883257 |
0.811758 |
0.974422 |
0.933603 |
|
Higuchi
|
0.805583 |
0.805583 |
0.924355 |
0.912834 |
0.951963 |
0.993582 |
0.885609 |
0.655736 |
0.85972 |
0.986262 |
|
pepas
|
0.898444 |
0.898444 |
0.968397 |
0.966401 |
0.97567 |
0.994363 |
0.943692 |
0.751515 |
0.945974 |
0.99098 |
|
Hixon
|
0.752648 |
0.752648 |
0.93674 |
0.929352 |
0.942107 |
0.971572 |
0.840016 |
0.69734 |
0.907745 |
0.994633 |
|
Second root of mass
|
0.724277 |
0.724277 |
0.908651 |
0.898043 |
0.921598 |
0.959454 |
0.816037 |
0.638177
|
0.860303 |
0.991692 |
|
3/2 root of mass
|
0.695474 |
0.695474 |
0.874965 |
0.859762 |
0.897496 |
0.944965 |
0.790839 |
0.581006 |
0.808008 |
0.973316 |
|
Linear Wagner
|
0.685344 |
0.685344 |
0.910699 |
0.899304 |
0.965181 |
0.866479 |
0.776944 |
0.636265 |
0.898488 |
0.985125 |
|
Non conventional order 1
|
0.788031 |
0.788031 |
0.955754 |
0.949652 |
0.961321 |
0.983389 |
0.868667 |
0.772558 |
0.955901 |
0.965902 |
|
Non conventional order 2
|
0.806807 |
0.806807 |
0.954099 |
0.947343 |
0.967717 |
0.988022 |
0.883259 |
0.811761 |
0.974424 |
0.9336
|
X-ray diffraction findings
Investigation of polymorphic variations in drug structure during formulation process is of paramount importance because such variations can affect solubility properties and consequently bioavailability of the drug. Fig. 2 demonstrates the X-ray diffractograms of glibenclamide powder, liquisolid formulations containing Avicel and lactose and their relative conventional formulation. As shown in Fig. 2, in both liquisolid and the respective conventional formulations, almost all of the peaks were similar. These findings did not reveal any changes in crystallinity or any other complex formations between the drug and the carrier in both formulations. The presence of similar peaks with respect to liquisolid formulation indicates that formulations did not undergo amorphous state.
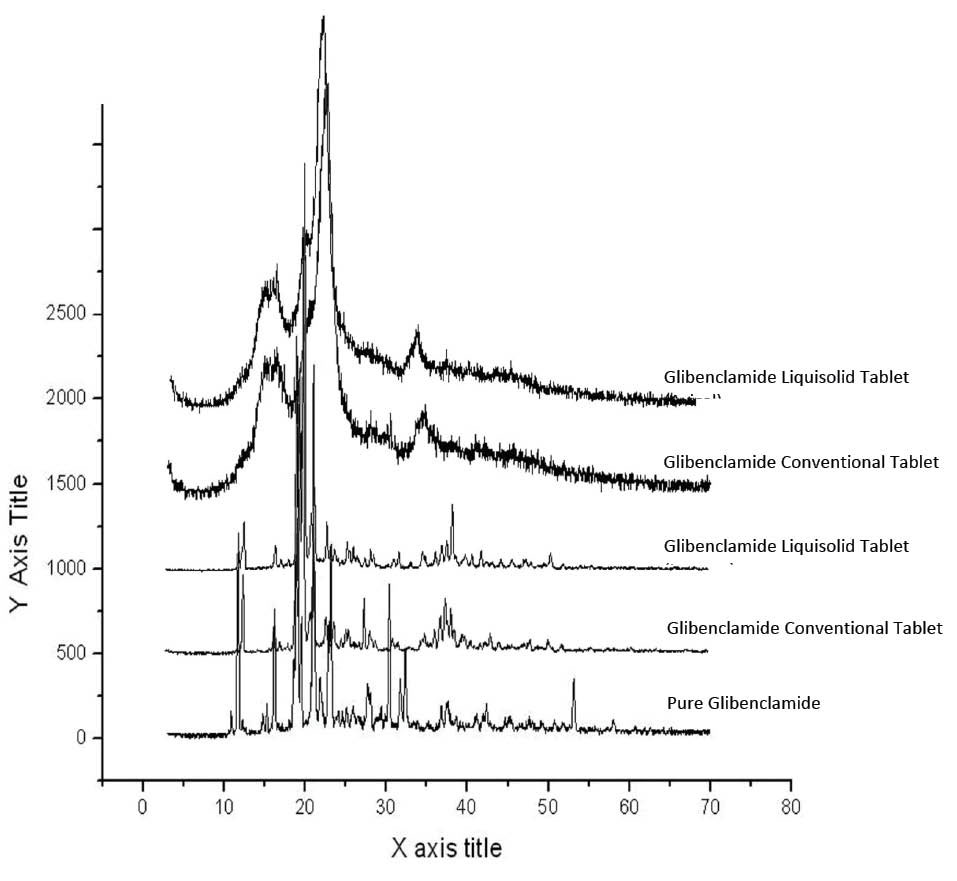
Fig. 2.
Diffractograms of the pure glibenclamide, liquisolid formulations containing Avicel and lactose and their relative conventional formulations.
.
Diffractograms of the pure glibenclamide, liquisolid formulations containing Avicel and lactose and their relative conventional formulations.
Differential scanning calorimetry thermograms
The DSC thermograms are illustrated in Fig. 3. The thermogram of glibenclamide showed fairly sharp fusion endotherms around its melting point at 174˚C. The same peak in this area was found in the liquisolid and conventional formulations, indicating no interaction between glibenclamide and excipients. Furthermore, a significant decrease in the height of peaks may be due to the lower drug concentration in the named formulations compared to the pure glibenclamide or dissolution of some fraction of glibenclamide in solvent. The same results were found in the ball milled formulations, where the peaks almost disappeared.
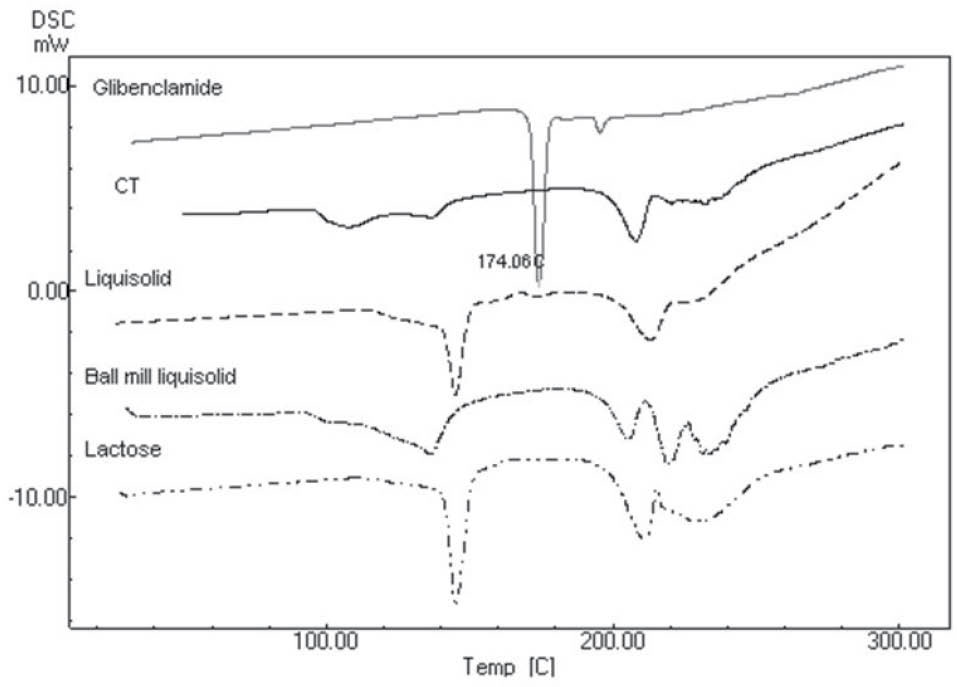
Fig. 3.
Differential scanning calorimetery of lactose, glibenclamid liquisolid formulation containing lactose (Liquisolid), ball milled glibenclamide liquisolid formulation containing lactose (Ball mill liquisolid), conventional tablet containing physical mixture of glibenclamide and lactose (CT), and pure glibenclamide.
.
Differential scanning calorimetery of lactose, glibenclamid liquisolid formulation containing lactose (Liquisolid), ball milled glibenclamide liquisolid formulation containing lactose (Ball mill liquisolid), conventional tablet containing physical mixture of glibenclamide and lactose (CT), and pure glibenclamide.
Discussion
Changing solvents in liquisolid formulation had not significant impact on glibenclamid release profile. Due to the higher solubility of glibenclamide in PEG, as compared to PG, an improved release profile from PEG containing liquisolid was expected. Furthermore, the f2 value calculated from CT and PG dissolution profiles was 41.24, indicating a different dissolution profile pattern. In spite of the use of PG and the increasing molecular fraction of glibenclamide in liquisolid formulation, no enhanced dissolution profile was observed.
In addition to solvent type, changing drug concentration in liquid medication had no significant effect on glibenclamide release profile. Based on the theory of Noyes-Withny, a higher release was expected following a decrease in drug concentration in liquid medication. This, in turn, resulted in an increase in FM value (9.1% and 19.4% in F3 and F2, respectively). This, also, led to a higher surface exposure to the dissolution medium. The low solubility amount in solvent (11.418 mg/mL) may be the reason behind the non-significant differences between the release patterns of liquisolid formulations with different drug concentrations.
Based on the aforementioned results, it can be concluded that although CT tablets prepared using Avicel and lactose had statistically similar dissolution profile, in the presence of liquid medication, and lactose as carrier is able to increase the release profile of glibenclamide better than Avicel in both concentrations of PEG (f2= 44.12 and 47.80 for PEG 10 and 5%, respectively). Such improved drug dissolution profile can be attributed to improved solubility and more hydrophilicity of lactose, which consequently results in an enhanced solubility rate of glibenclamide due to better wettability of drug particles.
27
Given that the drug was already carried by the solvent, it was further attached on the surface of the carrier. Thus, its release was accelerated as a result of both solvent and carrier effects. This can be the reason for the enhanced release profile of lactose containing liquisolid formulations.
Singh et al reported the enhanced dissolution behavior of Avicel liquisolid compared to lactose liquisolid. The presence of polymers such as PVP, HPMC and PEG 35000 in liquid medication containing glibenclamide dispersed in PEG400 may explain this dissimilar finding.
28
The negative effect of granulation process can be explained by covering the drug particles by PVP. The Lower release profile in granulated liquisolid tablets was reported previously by Javadzadeh et al.
29
This finding is in contrast to the one reported in Javaheri et al,
30
who reported wet granulation as a method for enhancing the release rate of glibenclamide liquisolids.
30
This dissimilarity may be attributed to different study conditions as they performed their study in a non-sink condition (water instead of buffer as medium).
Improvements in the dissolution rate of co-grinded particles can be explained by the reduction in particle size. This leads to solubility enhancement of drugs in dissolution media released from nanosuspension. This phenomenon is not substantial for larger particles, but it would be obvious for the substances smaller than 1-2 μm. In fact, this phenomenon happens just when a drug particle size falls below a size of almost 1-2 µm to the submicron level and causes simultaneous enhancement of both the saturation solubility Cs and the dissolution rate dC/dt. For this reason, the dissolution enhancement is not a determining factor in liquisolid formulation prepared in mortar containing drug particles in micron range around 10.5 µm compared to that of CT tablet with drug size equal to 16.4 µm.
The solubility enhancement by the size reduction can be explained according to the Ostwald-Freundlich equation:
logCs/C= 2sV/2.303RT ρ r (Eq. 2)
where, Cs: solubility, C: solubility of the solid consisting of large particles, s: interfacial tension substance, V: molar volume of the particle material, R: gas constant, T: absolute temperature, ρ: density of the solid and, r: radius.
The increase in specific surface area contributes to an enhancement in wettability prompting dissolution enhancement based on Noyes–Whitney equation. Based on this equation, drug saturation solubility (Cs) rises as particle size (r) goes down. The impact of this phenomenon may not be considerable in the case of larger particles, but it will have noticeable impacts in the case of substances with particle sizes smaller than 1–2 μm.
31
Since the effect of lactose on dissolution enhancement as a carrier was superior to that of Avicel™, a dissolution test of another formulation containing just co-grinding of glibenclamide and lactose was administered. Surprisingly, the entire amount of glibenclamide was released during the first one hour.
Based on the DSC and X-ray findings, it can be concluded that the enhanced release profile of glibenclamid liquiground compacts does not result from the drug crystallinity changes or complex formations between glibenclamide and other components of formulation.
Conclusion
Although glibenclamide possesses a high log P (4.2), it acts as a poorly soluble agent in both lipid and water. Therefore, classic liquisolid technique fails to increase release profile of glibenclamide. The results of the present study demonstrated that among the carriers currently used, lactose is preferred as a selected carrier thanks to its higher hydrophilicity. The amount of lactose in prepared formulations is negligible for diabetic patients. Moreover, a novel method known as liquigroud technique could be used to achieve an improved release profile. The limitation of powder size reduction is its agglomeration. Through the implementation of combination techniques by dispersing drugs in solvents and size reduction by ball milling, an enhanced release rate could be obtained. In this concern, liquiground has the potential to scale up.
Ethical approval
There is none to be declared.
Competing interests
There is no conflict of interests to be reported.
Acknowledgments
The authors would like to express their gratitude to the Drug Applied Research Center at Tabriz University of Medical Sciences for their financial support of this study which is part of the Ph.D. dissertation No. 92/1117.
Research Highlights
What is current knowledge?
simple
-
√ Liquisolid technology is considered to be an efficient
method in enhancing the dissolution profile of waterinsoluble
drugs.
What is new here?
simple
-
√ Release profile of glibenclamide as an insoluble agent is not
enhanced by classic liquisolid technology in this study.
-
√ Nano-suspended liquid medication through the
implementation of ball-mill equipment was effective in
enhancing glibenclamide release profile.
-
√ Combining liquisolid and co-grinding technologies seems to
be a promising technique.
References
- Nathan DM, Buse JB, Davidson MB, Ferrannini E, Holman RR, Sherwin R. Medical management of hyperglycemia in type 2 diabetes: a consensus algorithm for the initiation and adjustment of therapy a consensus statement of the American Diabetes Association and the European Association for the Study of Diabetes. Diabetes Care 2009; 32:193-203. doi: 10.2337/dc08-9025 [Crossref] [ Google Scholar]
- Joy NG, Tate DB, Davis SN. Counterregulatory Responses to Hypoglycemia Differ Between Glimepiride and Glyburide in Non Diabetic Individuals. Metabolism 2015; 64:729-37. doi: 10.1016/j.metabol.2015.02.006 [Crossref] [ Google Scholar]
- Prendergast B. Glyburide and glipizide, second-generation oral sulfonylurea hypoglycemic agents. Clin Pharm 1983; 3:473-85. doi: 10.1016/s0160-3450(16)33474-2 [Crossref] [ Google Scholar]
- Skillman TG, Feldman JM. The pharmacology of sulfonylureas. Am J Med 1981; 70:361-72. doi: 10.1016/0002-9343(81)90773-7 [Crossref] [ Google Scholar]
- Wei H, Löbenberg R. Biorelevant dissolution media as a predictive tool for glyburide a class II drug. EJPS 2006; 29:45-52. doi: 10.1016/j.ejps.2006.05.004 [Crossref] [ Google Scholar]
- Tabbakhian M, Hasanzadeh F, Tavakoli N, Jamshidian Z. Dissolution enhancement of glibenclamide by solid dispersion: solvent evaporation versus a supercritical fluid-based solvent-antisolvent technique. RPS 2014; 9:337. doi: 10.1016/j.supflu.2013.12.020 [Crossref] [ Google Scholar]
-
Savjani KT, Gajjar AK, Savjani JK. Drug solubility: importance and enhancement techniques. ISRN Pharm 2012; 2012.
- Taniguchi C, Kawabata Y, Wada K, Yamada S, Onoue S. Microenvironmental pH-modification to improve dissolution behavior and oral absorption for drugs with pH-dependent solubility. Expert Opin Drug Deliv 2014; 11:505-16. doi: 10.1517/17425247.2014.881798 [Crossref] [ Google Scholar]
- Preechagoon D, Udomprateep A, Manwiwattanagul G. Improved dissolution rate of poorly soluble drug by incorporation of buffers. Drug Dev Ind Pharm 2000; 26:891-4. doi: 10.1081/ddc-100101314 [Crossref] [ Google Scholar]
- Mittapalli S, Mannava MC, Khandavilli UR, Allu S, Nangia A. Soluble Salts and cocrystals of clotrimazole. Crys Growth Des 2015; 15:2493-504. doi: 10.1021/acs.cgd.5b00268 [Crossref] [ Google Scholar]
- Tran TT, Tran KA, Tran PH. Modulation of particle size and molecular interactions by sonoprecipitation method for enhancing dissolution rate of poorly water-soluble drug. Ultrason Sonochem 2015; 24:256-63. doi: 10.1016/j.ultsonch.2014.11.020 [Crossref] [ Google Scholar]
- Grifasi F, Chierotti MR, Gaglioti K, Gobetto R, Maini L, Braga D. Using Salt cocrystals to improve the solubility of niclosamide. Crys Growth Des 2015; 15:1939-48. doi: 10.1021/acs.cgd.5b00106 [Crossref] [ Google Scholar]
- Penkina A, Semjonov K, Hakola M, Vuorinen S, Repo T, Yliruusi J. Towards improved solubility of poorly water-soluble drugs: cryogenic co-grinding of piroxicam with carrier polymers. Drug Dev Ind Pharm 2015:1-11. doi: 10.3109/03639045.2015.1054400 [Crossref]
- Cheow WS, Kiew TY, Hadinoto K. Amorphous nanodrugs prepared by complexation with polysaccharides: carrageenan versus dextran sulfate. Carbohydr Polym 2015; 117:549-58. doi: 10.1016/j.carbpol.2014.10.015 [Crossref] [ Google Scholar]
- Borba PAA, Pinotti M, de Campos CEM, Pezzini BR, Stulzer HK. Sodium alginate as a potential carrier in solid dispersion formulations to enhance dissolution rate and apparent water solubility of BCS II drugs. Carbohydr Polym 2016; 137:350-9. doi: 10.1016/j.carbpol.2015.10.070 [Crossref] [ Google Scholar]
- Javadzadeh Y, Siahi-Shadbad M, Barzegar-Jalali M, Nokhodchi A. Enhancement of dissolution rate of piroxicam using liquisolid compacts. Farmaco 2005; 60:361-5. doi: 10.1016/j.farmac.2004.09.005 [Crossref] [ Google Scholar]
-
Spireas S, Bolton SM. Liquisolid systems and methods of preparing same. Google Patents; 1998.
- Khanfar M, Sheikh Salem M, Hawari R. Formulation factors affecting the release of ezetimibe from different liquisolid compacts. Pharm Dev Tech 2013; 18:417-27. doi: 10.3109/10837450.2012.680594 [Crossref] [ Google Scholar]
- Cirri M, Righi MF, Maestrelli F, Mura P, Valleri M. Development of glyburide fast-dissolving tablets based on the combined use of cyclodextrins and polymers. Drug Dev Ind Pharm 2009; 35:73-82. doi: 10.1080/03639040802192798 [Crossref] [ Google Scholar]
- Bachhav YG, Patravale VB. SMEDDS of glyburide: formulation, in vitro evaluation, and stability studies. AAPS Pharm Sci Tech 2009; 10:482-7. doi: 10.1208/s12249-009-9234-1 [Crossref] [ Google Scholar]
- Klein S, Wempe MF, Zoeller T, Buchanan NL, Lambert JL, Ramsey MG. Improving glyburide solubility and dissolution by complexation with hydroxybutenyl‐β‐cyclodextrin. J Pharm Pharmacol 2009; 61:23-30. doi: 10.1211/jpp/61.01.0004 [Crossref] [ Google Scholar]
- Shokri J, Adibkia K, Javadzadeh Y. Liquisolid technology: What it can do for NSAIDs delivery?. Colloids Surf B 2015; 136:185-91. doi: 10.1016/j.colsurfb.2015.09.014 [Crossref] [ Google Scholar]
- Javadzadeh Y, Shariati H, Movahhed-Danesh E, Nokhodchi A. Effect of some commercial grades of microcrystalline cellulose on flowability, compressibility, and dissolution profile of piroxicam liquisolid compacts. Drug Dev Ind Pharm 2009; 35:243-51. doi: 10.1080/03639040802277672 [Crossref] [ Google Scholar]
- Costa P. An alternative method to the evaluation of similarity factor in dissolution testing. Int J Pharm 2001; 220:77-83. doi: 10.1016/s0378-5173(01)00651-2 [Crossref] [ Google Scholar]
- Barzegar-Jalali M, Adibkia K, Valizadeh H. Kinetic analysis of drug release from nanoparticles. J Pharm Pharm Sci 2008; 11(1):167-177. doi: 10.18433/J3D59T [Crossref] [ Google Scholar]
- Hentzschel CM, Sakmann A, Leopold CS. Suitability of various excipients as carrier and coating materials for liquisolid compacts. Drug Dev Ind Pharm 2011; 37:1200-7. doi: 10.3109/03639045.2011.564184 [Crossref] [ Google Scholar]
- Spireas S, Wang T, Grover R. Effect of powder substrate on the dissolution properties of methyclothiazide liquisolid compacts. Drug Dev Ind Pharm 1999; 25:163-8. doi: 10.1081/ddc-100102156 [Crossref] [ Google Scholar]
- Singh SK, Srinivasan K, Gowthamarajan K, Prakash D, Gaikwad NB, Singare DS. Influence of formulation parameters on dissolution rate enhancement of glyburide using liquisolid technique. Drug Dev Ind Pharm 2012; 38:961-70. doi: 10.3109/03639045.2011.634810 [Crossref] [ Google Scholar]
- Javadzadeh Y, Musaalrezaei L, Nokhodchi A. Liquisolid technique as a new approach to sustain propranolol hydrochloride release from tablet matrices. Int J Pharm 2008; 362:102-8. doi: 10.1016/j.ijpharm.2008.06.022 [Crossref] [ Google Scholar]
- Javaheri H, Carter P, Elkordy A. Wet granulation to overcome liquisolid technique issues of poor flowability and compactibility: a study to enhance glibenclamide dissolution. J Pharm Drug Dev 2014; 1:1. doi: 10.15744/2348-9782.1.501 [Crossref] [ Google Scholar]
- Junyaprasert VB, Morakul B. Nanocrystals for enhancement of oral bioavailability of poorly water-soluble drugs. Asian Journal of Pharmaceutical Sciences 2015; 10:13-23. doi: 10.1016/j.ajps.2014.08.005 [Crossref] [ Google Scholar]