Bioimpacts. 9(2):105-113.
doi: 10.15171/bi.2019.14
Original Research
Determination of valproic acid and 3-heptanone in plasma using air-assisted liquid-liquid microextraction with the assistance of vortex: Application in the real samples
Behruz Feriduni 1, Mohammad Barzegar 2, Shahram Sadeghvand 3, Shadi Shiva 4, Maryam Khoubnasabjafari 5  , Abolghasem Jouyban 1, 6, *
Author information:
1Pharmaceutical Analysis Research Center, Faculty of Pharmacy, Tabriz University of Medical Sciences, Tabriz, Iran
2Pediatric Health Research Center, Tabriz University of Medical Sciences, Tabriz, Iran
3Student Research Committee, Faculty of Medicine, Tabriz University of Medical Sciences, Tabriz, Iran
4Liver and Gastrointestinal Diseases Research Center, Tabriz University of Medical Sciences, Tabriz, Iran
5Lung and Tuberculosis Diseases Research Center, Tabriz University of Medical Science, Tabriz, Iran
6Kimia Idea Pardaz Azarbayjan (KIPA) Science Based Company, Tabriz University of Medical Sciences, Tabriz, Iran
Abstract
Introduction:
Valproic acid (VPA) is an antiepileptic drug used to treat epilepsy and bipolar disorder. Adverse effects of VPA were studied in many reports, however, a dose-response relationship between VPA and its metabolites in epilepsy patients are extremely limited. In this paper, a high efficient method was developed for the preconcentration and determination of VPA and its main metabolite in plasma.
Methods:
For the extraction and preconcentration of the selected analytes, a volume of an extractant was placed at the bottom of the microtube containing pretreated plasma. The mixture was repeatedly withdrawn from the microtube and pushed-out into it using a 1.0-mL glass syringe and resulted in a cloudy mixture. For further turbidity, the mixture was shaken on a vortex agitator. This procedure was used to analyze the plasma samples of patients with epilepsy (n = 70).
Results:
The results revealed that in most patients with a low level of VPA relative to its expected level, 3-heptanone concentrations were high. The limits of quantification of 3-heptanone and VPA were 0.04 mg L–1 and 0.2 mg L–1, respectively. A suitable precision at a concentration of 2 mg L-1 for each analyte was obtained (relative standard deviation ≤ 9%).
Conclusion:
The obtained results indicated that this procedure is easy, sensitive, and reliable, and can be used for the analysis of the selected analytes in the plasma samples of patients with epilepsy.
Keywords: 3-Heptanone, Gas chromatography, Microextraction method, Plasma, Valproic acid
Copyright and License Information
© 2019 The Author(s)
This work is published by BioImpacts as an open access article distributed under the terms of the Creative Commons Attribution License (
http://creativecommons.org/licenses/by-nc/4.0/). Non-commercial uses of the work are permitted, provided the original work is properly cited.
Introduction
Pharmacotherapy with anti-epileptic drugs (AEDs) is the most common method for the treatment of epilepsy. However, in 10%-20% of epileptic children, drug-resistant epilepsy (DRE) is observed
1
and therefore, “pseudo” refractiveness should be considered in the diagnosis of DRE. Adequate dosage
2,3
and appropriate combination of AEDs are important issues. Refractory epilepsy is defined as uncontrolled epilepsy despite the administration of an appropriate AED with adjusted dosage and duration.
4
The failure in treatment could be due to choosing the AED, its administered dose, any variations in its absorption following oral administration, any change in its metabolism, and drug resistance. Monitoring plasma levels of AEDs could provide some evidence for better management of epileptic patients.
2-Propylpentanoic acid or valproic acid (VPA) is the most well-known AED that was used to treat epilepsy and bipolar disorder.
5
The therapeutic dosage of VPA was in the range of 50 to 100 µg mL-1.
6,7
Most amount of VPA is eliminated by metabolism and a small amount of an administered dosage appears unchanged in urine (less than 4%).
8
Some of the metabolites possess the anticonvulsant activity and some have been suspected to be associated with serious hepatotoxicity.
9
VPA is metabolized to unsaturated compounds by hydrogenation, to hydroxyl metabolites by oxidation, and to carbonyl metabolites by their further oxidation.
10
One of the main carbonyl metabolites of VPA is 3-heptanone. β-oxidation leads to 3-oxo-VPA and after spontaneous decarboxylation leads to 3-heptanone.
11
Study of concentrations of VPA and its main metabolite in plasma and their relationship can be used for dosage adjustment of VPA especially in children with refractory epilepsy. Consequently, there has been considerable interest to develop a sensitive method to determine VPA and 3-heptanone dosages in biological samples and study their relationship in patients with epilepsy.
The available analytical methods for monitoring various AEDs have been reviewed in previous work.
12
Different bioanalytical procedures have been developed to analyze VPA in biological samples such as a gas chromatography (GC) with flame ionization detector (FID)
13-16
and mass spectrometry (MS),
17,18
high performance liquid chromatography with ultraviolet detector,
19
fluorescence detector,
20
MS,
21
and capillary electrophoresis (CE).
22
However, among the applied procedures to determine VPA, GC–FID is a simple and fast procedure.
Although the above-mentioned techniques are sensitive, direct analysis of trace levels of analytes is almost impossible. Therefore, prior to detection of the analytes with the instrument, sample pretreatment methods are needed. Conventional sample pretreatment methods such as solid phase extraction and liquid-liquid extraction are typically time-consuming and boring, as well as using large volumes of toxic solvent.
23-27
Hence, microextraction procedures like solid-phase microextraction (SPME)
14,17
and liquid phase microextraction (LPME)
13,28
were very much considered as alternatives. But, SPME fibers are relatively costly, and commonly fragile, as well as suffering from sample carryover problems. In order to solve abovementioned problems, dispersive liquid-liquid microextraction (DLLME) has been developed as an effective extraction and enrichment procedure.
29
It has been widely used to analyze drugs in urine and serum samples.
16,30,31
In DLLME, a mixture of extraction solvent (low soluble in aqueous phase) and disperser solvent (soluble in both extraction solvent and aqueous phase) was rapidly injected into an aqueous solution containing analytes using a syringe. By this action, extractant was dispersed into aqueous solution as tiny droplets by disperser solvent. After centrifugation, extractant containing the enriched analytes was collected. The use of a disperser solvent in DLLME decreases the sample polarity which leads to the increase of analyte solubility in the sample solution and the decrease of extraction performance especially in a low volume of biological samples. To improve extraction performance of DLLME, disperser solvent-free procedures were developed for extraction and enrichment of target analytes.
32-34
Free fraction of drugs is responsible for their biological (either pharmacological or toxicological) activities. The free fraction of VPA could be affected by albumin levels
35
and some co-administered drugs. 3-Heptanone concentrations in exhaled breath of patients receiving VPA was proposed as a biomarker for its monitoring and pharmacokinetics.
11,35
There was a positive correlation between 3-heptanone concentration in exhaled breath and VPA dose administrated to the patients.
11
However, no significant correlation was observed between serum concentration of VPA and exhaled breath concentration of 3-heptanone.
11
A number of technical points should be considered in practical applications of analyte determinations in exhaled breath as described in our recent report.
36
These points could be a possible reason for such non-significant correlations. In addition to these efforts to improve the outcomes of pharmacotherapy, new approaches including optogenetics, transcranial magnetic stimulation, responsive neurostimulation, cerebral cooling, local AED perfusion to epileptic foci, gene therapy and stem cell therapy
37,38
are under investigation to provide better management for refractory epilepsy.
The aims of this work were, a) to develop a simple, fast, and efficient microextraction method in small scale for the extraction and quantification of VPA and 3-heptanone in human plasma using GC-FID, b) to evaluate the correlations of the plasma VPA and 3-heptanone concentrations in children with epilepsy.
Materials and Methods
Reagents and solutions
3–Heptanone was provided from Sigma–Aldrich (St. Louis, USA). Sodium valproate powder was a gift from Rouz Darou Pharmaceutical Co. (Tehran, Iran). Methanol was also supplied from Sigma–Aldrich. Carbon tetrachloride, trifluoroacetic acid, 1,1,2,2–tetrachloroethane (1,1,2,2–TCE), 1,2–dichloroethane (1,2–DCE), and chloroform were provided from Merck (Darmstadt, Germany). Deionized water was provided from Ghazi Pharmaceutical Company (Tabriz, Iran). Appropriate amounts of the target analytes were dissolved in methanol and stock solutions (C=1000 mg L–1, each analyte) were obtained. For the preparation of working standard solution, the appropriate volume of stock solution was spiked into drug-free plasma.
Apparatus
Agilent 7890A gas chromatograph equipped with FID (Agilent Technologies, CA, USA) was used to analyze the target analytes. The temperature of the inlet was set at 300°C. Splitless mode with a sampling time of 1 minute and a split ratio of 1:10 was applied. Nitrogen was used as the make-up gas and carrier gas with flow rates of 25 mL min-1 and 1 mL min-1 , respectively. The target analytes were separated on an HP-5 capillary column (30 m × 0.32 mm i.d. with a 0.25 µm stationary film thickness) (Hewlett–Packard, Santa Clara, USA). The temperature of the oven was set at 70 °C for 2 minutes increased at a rate of 15°C min−1 to 200°C, and then increased at a ratio of 20°C min−1 to 300°C to clean up the column. A 1 μL microsyringe (zero dead volume, Hamilton, Switzerland) was applied to introduce samples into GC. Injection volume was 1 μL. The temperature of FID was 300°C. Hydrogen for FID was produced by the hydrogen generator (GLAIND–2200, Dani, Italy). Air with a flow rate of 400 mL min–1was used for FID. A vortex from Labtron Company (Tehran, Iran) was applied in extraction steps and sample preparation. To measure pH, a pH meter model 744 (Herisau, Switzerland) was applied. Sigma centrifuge (Osterode, Germany) was applied for extraction steps and protein precipitation.
Real samples
Seventy epileptic patients were studied (50 females and 20 males) with the mean (ranges) age of 7.9 years (1–18 years old) and mean body weight of 26.4 kg (5–91), respectively. The collected blood samples were centrifuged (8000 rpm for 5 minutes), and the supernatant was removed and kept at -20°C. All sample donors’ parents were informed on the details of the sample collection and a written consent form was signed. Drug-free (blank) human plasma samples to optimize the presented procedure were obtained from healthy donors (Iranian Blood Transfusion Research Center, Tabriz, Iran) and kept at –20 °C.
Procedure
Frozen human plasma samples were placed into the water –bath (temperature = 25 °C) to melt and then homogenized using a vortex. An aliquot of plasma (500 µL) was transferred into a microtube (1.5 mL) and fortified with 3-heptanone and sodium valproate (C = 8 mg L-1). To precipitate proteins of plasma, 50 µL trifluoroacetic acid was added into the mentioned solution and shaken by hand. After centrifugation at 10 000 rpm for 5 minutes, the upper phase was removed and transferred into another microtube with conical bottom. For the isolation and enrichment of the target analytes, 20 µL chloroform was placed at the bottom of the microtube containing the pretreated plasma. The mixture was repeatedly (5 times) withdrawn from the microtube and pushed-out into it using 1.0-mL glass syringe, resulting in a cloudy mixture. For the further turbidity, the mixture was shaken on a vortex agitator at 6000 rpm for 1 minute. The cloudy mixture was formed, and the selected analytes were extracted into the tiny droplets of chloroform. The tube was then centrifuged at 6000 rpm for 2 minutes. After centrifugation, 15 ± 0.5 µL chloroform was collected at the bottom of the microtube. For quantitative analysis, 1 µL of the sediment phase was withdrawn by a 1 μL microsyringe and then introduced into GC-FID system. The presented method is schematically shown in Scheme 1.
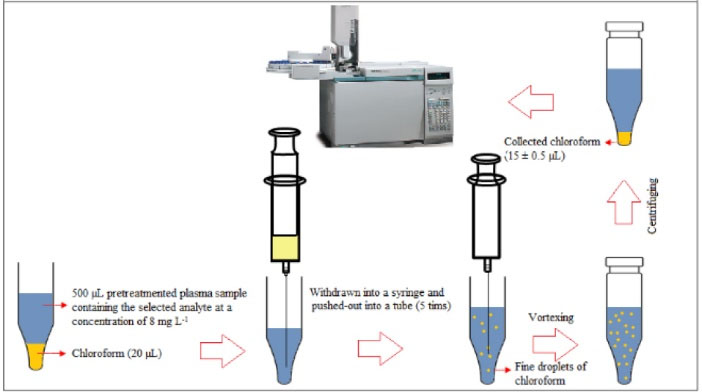
Scheme 1.
Microextraction and preconcentration procedure.
.
Microextraction and preconcentration procedure.
Calculation of extraction recovery and enrichment factor
To evaluate the extraction efficiency, extraction recovery (ER) and enrichment factor (EF) were used and calculated using equations 1 and 2:
(2)
Where CSed, VSed, C0, and V0 are the analyte concentration in the settled phase, the settled phase volume, the initial analyte concentration in the human plasma sample, and the plasma sample volume, respectively. n0 and nSed are the initial and the extracted analyte amounts, respectively.
Results
To achieve high extraction performance, several parameters affecting the efficiency of the presented procedure including type and volume of extractant, extraction number, pH, and vortex time were investigated.
Type of extractant
Selecting a suitable extractant is the crucial step in this procedure since the quality of an extractant determines its efficiency to extract the analytes. The requirements for the extractant in this method are higher density than water, high extraction performance to extract the selected analytes, immiscible with the aqueous phase, and good chromatographic behavior. Based on mentioned requirements, 1,2–DCE, 1,1,2,2–TCE, chloroform, and carbon tetrachloride were evaluated. Comparison of analytical signals obtained with the use of the selected extractants is given in Fig. 1. Chloroform, providing the best performance for the selected analytes, was used for the next experiments.
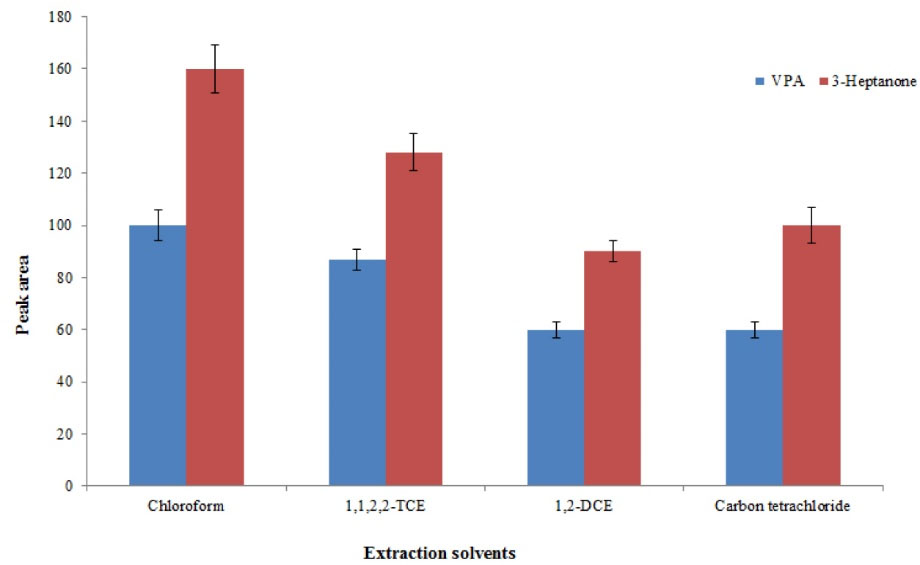
Fig. 1.
Selection of extraction solvent. Conditions: Sample volume, 500 µL human plasma spiked with 8 mg L–1 of each analyte; protein precipitation agent, 50 µL trifluoroacetic acid; extraction number, 5; pH, 3; vortex time, 5 min. The error bars indicate the minimum and maximum of three determinations.
.
Selection of extraction solvent. Conditions: Sample volume, 500 µL human plasma spiked with 8 mg L–1 of each analyte; protein precipitation agent, 50 µL trifluoroacetic acid; extraction number, 5; pH, 3; vortex time, 5 min. The error bars indicate the minimum and maximum of three determinations.
Selection of extractant volume
Extractant volume is a very crucial parameter that affects extraction performance in the proposed method. The high volume of extraction solvent leads to an increase in extraction recovery and a decrease in EFs due to the dilution effect. For this reason, the volume of chloroform should be optimized. To optimize extractant volume, this method was performed using different chloroform volumes (10, 20, 25, and 30 µL). The graphs of ERs and EFs of analytes versus volume of chloroform (Fig. 2) showed that by increasing the volume of chloroform, the concentration of analyte in the sedimentary chloroform was reduced, resulting in a decreased EF. When the volume of sedimentary phase is increased, ER is enhanced by increasing the volume of chloroform. A suitable ER and best EF could be achieved at a volume of 20 µL of chloroform. Therefore, 20 µL of chloroform was applied in the following experiment.
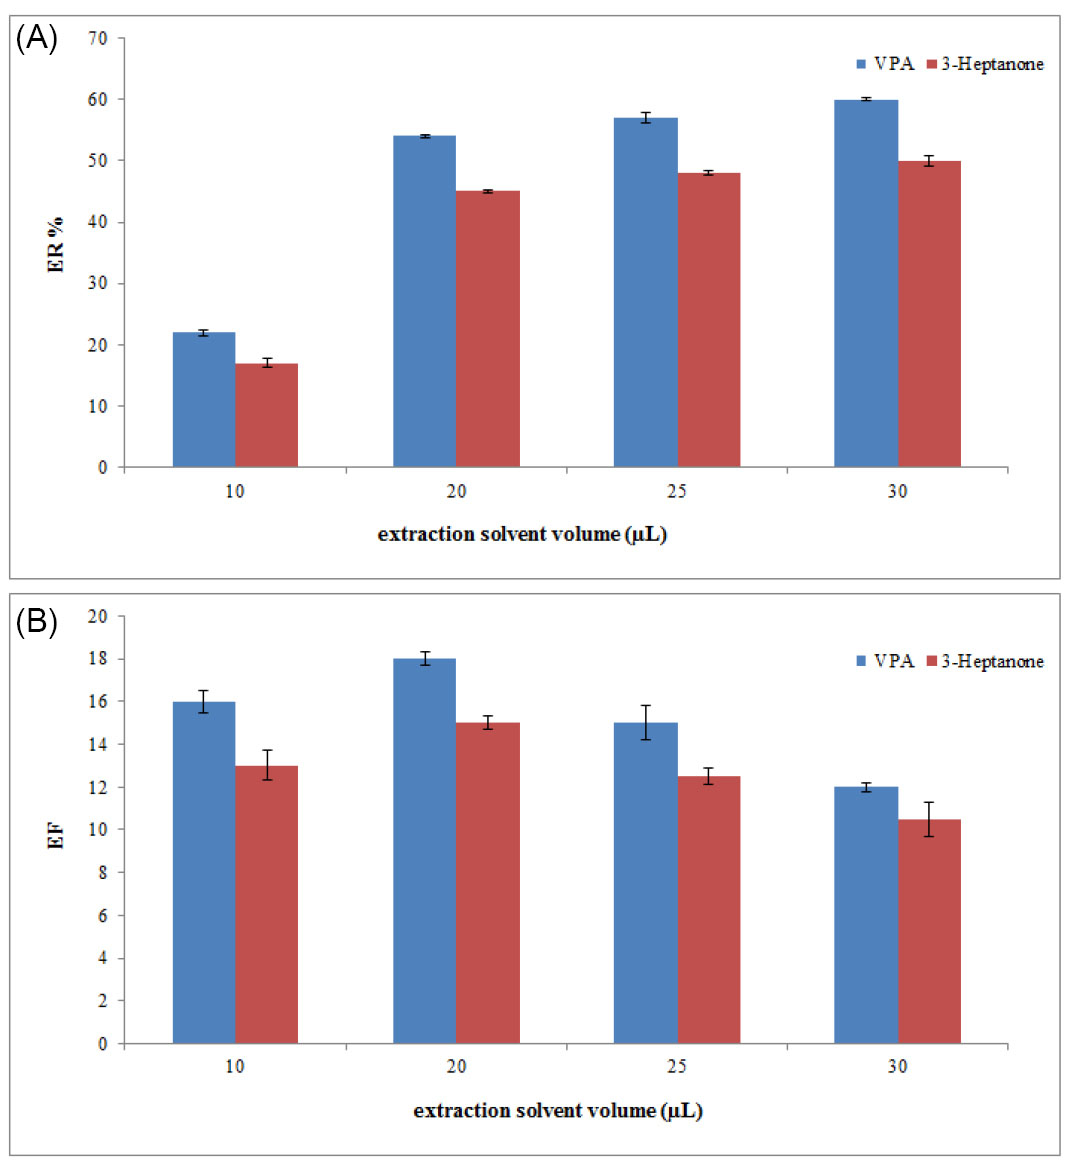
Fig. 2.
Selection of extraction solvent volume. (A) The extraction recovery (ER). (B) The enrichment factor (EF). Conditions: The same as used in Fig. 1, except that chloroform was used as the extraction solvent.
.
Selection of extraction solvent volume. (A) The extraction recovery (ER). (B) The enrichment factor (EF). Conditions: The same as used in Fig. 1, except that chloroform was used as the extraction solvent.
Study of the sample pH
Sample solution is a main factor affecting the extraction performance of the presented procedure. Therefore, the procedure was performed in the plasma sample with different pH values over the range of 2–10, adjusted by adding 0.1 M sodium hydroxide or hydrochloric acid solution. The results showed that in alkaline condition, the analytical signal of VPA decreased, whereas the analytical signal of 3–heptanone was not changed significantly. This can be attributed to the acidic properties of VPA. Indeed, in acidic condition, VPA is changed to ionic form, whereas 3-heptanone is not influenced by changing pH. Hence, the pH ranges of 2 to 4 are suitable. It is noted that in this method pH values of samples were approximately 3 due to the usage of trifluoroacetic acid as a protein precipitation agent. Therefore, for the following studies, the pH of samples was not changed (Fig. 3).
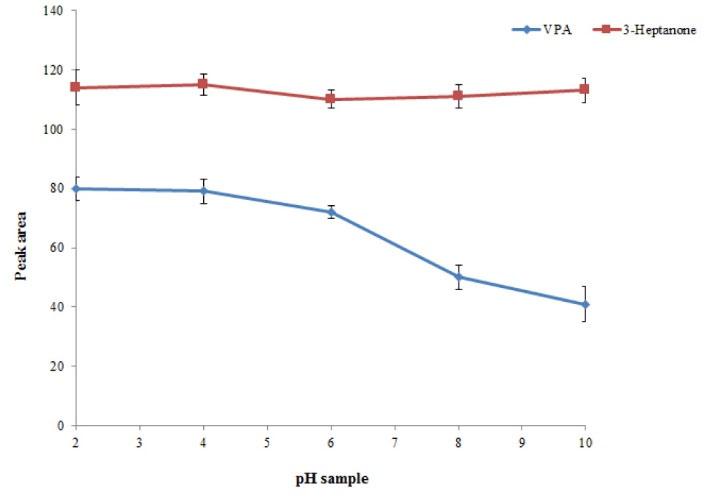
Fig. 3.
Study of pH values. Conditions: The same as used in Fig. 2, except that 20 µL chloroform was used as the extraction solvent volume.
.
Study of pH values. Conditions: The same as used in Fig. 2, except that 20 µL chloroform was used as the extraction solvent volume.
Extraction number
In this procedure, number of times that mixture of chloroform and plasma sample was withdrawn from a microtube into a 1-mL syringe and pushed-out into microtube was defined as the extraction number. It is predicted that the extraction efficiency of the presented method increases by increasing the extraction number. For this purpose, the extraction number was evaluated in the range of 1-5 times. As illustrated in Fig. 4, by increasing the extraction numbers till 4, the EF of the presented method increased and then stayed constant. Hence, 5 was selected as an extraction number for further experiments.
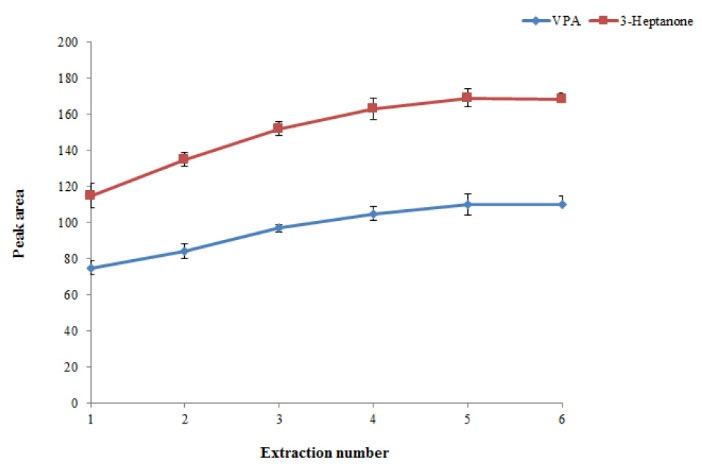
Fig. 4.
Effect of extraction number on the extraction efficiency of the method. Conditions: The same as used in Fig. 3, except that the pH of the sample was adjusted to 3.
.
Effect of extraction number on the extraction efficiency of the method. Conditions: The same as used in Fig. 3, except that the pH of the sample was adjusted to 3.
Effect of vortex time
Vortex time is defined as the minimum time necessary to obtain equilibrium condition between chloroform and plasma sample. By increasing vortex time, degree of solution turbidity increases resulting in higher extraction efficiency. Hence, to achieve equilibrium condition, evaluation of vortex time was essential. The obtained results showed that the equilibrium condition could be obtained only after 2 minutes of vortexing at a rate of 6000 rpm (Fig. 5).
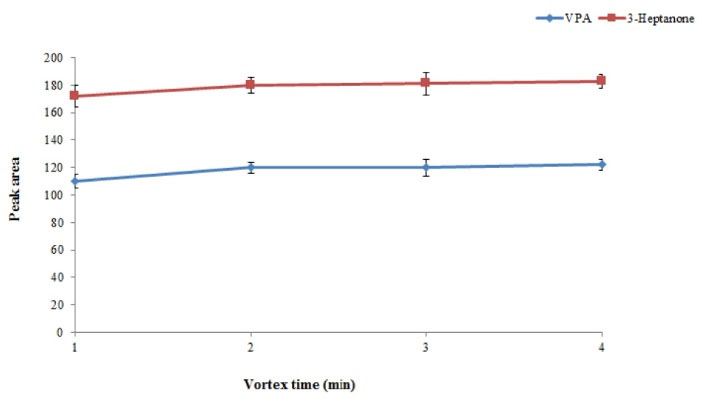
Fig. 5.
Effect of vortex time on the extraction efficiency of the method. Conditions: The same as used in Fig. 4, except that extraction number was 5. .
.
Effect of vortex time on the extraction efficiency of the method. Conditions: The same as used in Fig. 4, except that extraction number was 5. .
Analytical characteristics of the procedure
To investigate the performance of the presented procedure, some parameters, including detection limits (LODs), quantification limits (LOQs), linear range (LR), and relative standard deviation (RSD) of repeatability were determined under the optimized conditions. The obtained results are shown in Table 1. Acceptable linearity was achieved for the selected analytes with correlation coefficients (r) higher than 0.997. The LODs and LOQs based on a signal-to-noise (S/N) of 3 and 10, respectively, were determined to be 0.010 and 0.057 mg L–1 for 3-heptanone and 0.04 and 0.2 mg L–1 for VPA, respectively. The EFs of 56 ± 3 and 51 ± 2 and the ERs of 19 ± 1% and 17 ± 0.5% were obtained for VPA and 3-heptanone, respectively. The inter-day and intra-day precisions were obtained from four consecutive days and six replicates, respectively (C= 2 mg L–1). The inter-day and intra-day RSDs were less than 9%.
Table 1.
Quantitative features of the proposed method for the selected analytes
|
Analyte
|
LOD
a
|
LOQ
b
|
LR
c
|
r
2 d
|
RSD %
e
|
|
Intra-day
|
Inter-day
|
| VPA |
0.057 |
0.20 |
0.20 – 100 |
0.998 |
8 |
9 |
| 3-Heptanone |
0.010 |
0.040 |
0.04 – 100 |
0.997 |
5 |
5 |
aLimit of detection (S/N=3) (mg L–1).
bLimit of quantification (S/N=10) (mg L–1).
cLinear range (mg L–1).
dCoefficient of determination
eRelative standard deviation (n=6, C= 2 mg L–1 of each analyte) for intra–day and (n=4, C= 2 mg L–1of each analyte) for inter-day precisions.
Analysis of epileptic patients’ samples
The established procedure was used to analyze 3-heptanone and VPA in plasma samples of 70 children with epilepsy after receiving valproate and for some cases a number of co-administered AEDs. The summary of the results of analyses is listed in Table 2. More details are presented as supplementary information (Table 1S). The levels of VPA and 3-heptanone for patients #18 and #57 were lower than LOQ values of the analytes, i.e. < 0.2 mg L–1for VPA and < 0.04 mg L–1 for 3-heptanone, respectively. Therefore, we did not report the data and listed them as not determined (ND). No intake of the drug by these patients could be a possible reason for this observation. For patients #4, #11, #23, and #29, VPA levels were 28, 15, 27, and 38 mg L–1, respectively, whereas 3-heptanone levels were not determined to reveal the levels of < 0.04 mg L–1 possibly due to a very low metabolism of VPA to 3-heptanone in these patients. Level of VPA in plasma samples of patients #37, #54, and #60 were less than 2.0 mg L–1, whereas relatively high levels of 3-heptanone were found for these samples, i.e. 3.0, 1.1, and 1.8 mg L–1, revealing fast metabolism of VPA in these patients. As further evidence for this hypothesis, VPA levels for all samples with 3-heptanone > 2.0 mg L–1 were very low. There was a poor correlation (R = 0.29) between VPA and 3-heptanone plasma concentrations of the investigated cases as illustrated in Fig. 6.
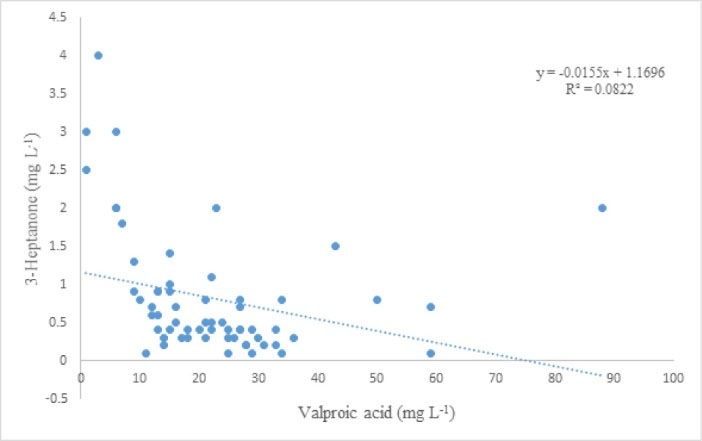
Fig. 6.
Relationship of plasma concentration of VPA and 3-heptanone.
.
Relationship of plasma concentration of VPA and 3-heptanone.
Table 2.
Descriptive data and characteristics of the studied population (N=70)
|
Variable
|
Mean (±SD) or number
|
| Age (year) |
7.95 ± 4.21 |
| ≥15 |
2 |
| 10-15 |
22 |
| 5-10 |
20 |
| 0-5 |
17 |
| NR |
9 |
| Weight (kg) |
26.55 ± 13.78 |
| ≤15 |
13 |
| 15-20 |
12 |
| 20-25 |
7 |
| 25-30 |
6 |
| ≥30 |
23 |
| NR |
9 |
| VPA concentration (mg/L) |
22.69 ± 14.61 |
| ≤10 |
10 |
| 10-15 |
14 |
| 15-20 |
6 |
| 20-25 |
11 |
| 25-30 |
11 |
| ≥30 |
13 |
| ND |
5 |
| 3-Heptanone concentration (mg/L) |
0.87 ± 0.84 |
| 0.1-0.4 |
18 |
| 0.4-0.8 |
20 |
| 0.8-1.2 |
12 |
| ≥1.2 |
14 |
| ND |
6 |
| Co-administrated AEDs |
- |
| Pb |
50 |
| Ph |
15 |
| CBZ |
17 |
NR: not recorded; ND: not detected; Pb: Phenobarbital; Ph: Phenytoin; CBZ: Carbamazepine.
Fig. 7 presents typical chromatograms obtained by GC-FID for a standard solution (C= 250 mg L–1, each analyte), a free-drug plasma sample fortified with the target analytes (C=8.0 mg L–1, each analyte), and the patient plasma after taking valproate. Considering the obtained results, there is no interfering peak in retention times of VPA and 3-heptanone, proving that the proposed procedure is suitable for clinical studies.
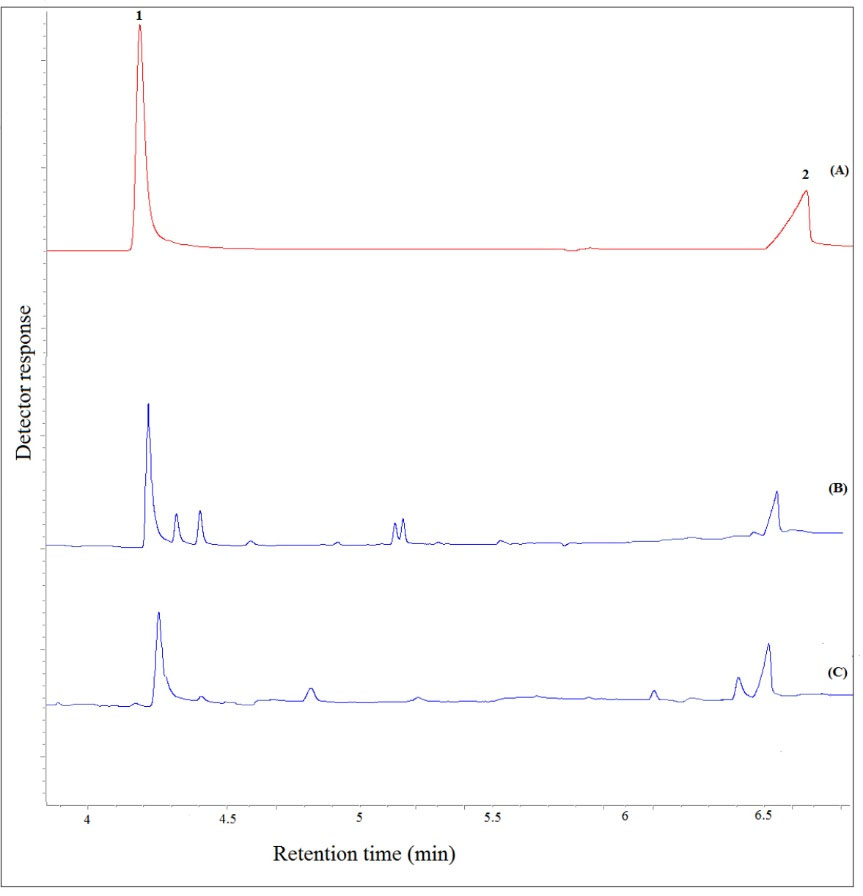
Fig. 7.
Typical GC–FID chromatograms of: (A) a standard solution prepared in chloroform (250 mg L−1, each analyte), (B) plasma sample spiked with the analytes at a concentration of 8 mg L-1 (each analyte), and (C) patient plasma after performing the proposed method, except for chromatogram (A) in which direct injection was used. Peaks identification: 1, 3-Heptanone; and 2, VPA.
.
Typical GC–FID chromatograms of: (A) a standard solution prepared in chloroform (250 mg L−1, each analyte), (B) plasma sample spiked with the analytes at a concentration of 8 mg L-1 (each analyte), and (C) patient plasma after performing the proposed method, except for chromatogram (A) in which direct injection was used. Peaks identification: 1, 3-Heptanone; and 2, VPA.
Discussion
A comparative study of the analytical properties of the proposed method and some published methods in terms of LOD, RSD, extraction time (ER), and LR for the extraction and determination of the selected analytes was carried out, and the results obtained were tabulated in Table 3. The difference of the presented method with our previous method is in the first step of the procedure. In this method, a disperser less method was applied for the extraction and preconcentration of the selected analytes which is more efficient than DLLME (our previous method) due to the elimination of disperser solvent, hence this method provides lower LOD, LOQ, and higher ER. As listed in Table 2, the LR and LOD of the presented procedure are suitable compared to other procedures. The RSD values are comparable with the RSDs reported by other studies. The ER of the presented procedure is shorter than that of other published procedures. Considering the analytical performance of the proposed method compared to other methods, it is a more simple, sensitive, and reliable method for analyzing the selected analytes in plasma samples.
Table 3.
Comparison of the presented method with other methods used in preconcentration and determination of the VPA
|
Sample
|
RSD%
a
|
Extraction time (min)
|
LR
b
(µg mL-1)
|
LOD
c
|
Method
|
Ref.
|
| Human serum |
8.8 |
20 |
0.5-100 |
NR f)
|
HS-SPME-GC-MS d
|
39
|
| Human serum |
13.2 |
20 |
2-20 |
0.8 |
HS-LPME-GC-FID e
|
13
|
| Human serum |
7 |
10 |
2-100 |
1.7 |
HS-SPME-GC-FID f
|
14
|
| Human serum |
7 |
15 |
0.25-100 |
0.065 |
DLLME-VADLLME- GC-FID g
|
40
|
| Human plasma |
9 |
< 15 |
0.2-100 |
0.057 |
Presented method |
- |
a Relative standard deviation
b Linear range.
cLimit of detection (mg L-1).
d Headspace -solid-phase microextraction-gas chromatography-mass spectrometry.
e Headspace-liquid phase microextraction-gas chromatography-flame ionization detector.
fHeadspace-solid phase microextraction- gas chromatography-flame ionization detector.
g Dispersive liquid-liquid microextraction- vortex assisted dispersive liquid-liquid microextraction- gas chromatography-flame ionization detector.
Conclusion
Our study reported a new, simple, and efficient disperser-less microextraction procedure combined with GC-FID for isolation, enrichment, and determination of 3-heptanone and VPA in plasma samples. The obtained acceptable results proved that this procedure is sensitive, reliable, and cost-effective and could be used as a suitable alternative to previously reported procedures. Finally, this procedure has been successfully applied to analyze VPA and 3-heptanone in 70 patients with epilepsy.
Acknowledgments
The authors would like to thank Pediatric Health Research Center, Tabriz University of Medical Sciences for the partial financial support.
Funding sources
Tabriz University of Medical Sciences supported the study ((grant No. 5/96906).
Ethical statement
Volunteers signed a consent form which was approved by the Ethics Committee of Tabriz University of Medical Sciences (approval No. of IR.TBZMED.REC.13953836).
Competing interests
The authors declare no conflict of interests.
Authors contribution
BF: Developing the analytical method, data analysis, drafting the manuscript. MB: Supervision of the thesis project. ShSa: Plasma sample collection. ShSh: Physical examination of the sample donors. MK: Conceptualization, data analysis, and interpretation. AJ: Team leading, reviewing, and finalizing the manuscript.
Supplementary Materials
Supplementary file 1 contains Table S1.
(pdf)
Research Highlights
What is the current knowledge?
simple
-
√ Valproic acid and 3-heptanone were analyzed in plasma
samples of patients.
-
√ This method can be used in clinical studies.
What is new here?
simple
-
√ In this paper, a new, simple, and highly efficient disperserless
microextraction procedure was established for the
extraction and preconcentration of VPA and 3-heptanone in
patient plasma samples.
References
- Aneja S, Jain P. Refractory Epilepsy In Children Indian J. Pediatr 2014; 81:1063-72. [ Google Scholar]
- Kossoff Eh, Editor Editor. Intractable Childhood Epilepsy: Choosing Between The Treatments. Semin Pediatr Neurol 2011; 18:145-149. doi: 10.1016/J.spen.2011.06.001 [Crossref] [ Google Scholar]
- Sisodiya S. Etiology And Management Of Refractory Epilepsies. Nat Rev Neurol 2007; 3:320. doi: 10.1038/Ncpneuroa0521 [Crossref] [ Google Scholar]
- Kwan P, Arzimanoglou A, Berg At, Brodie Mj, Allen Hauser W, Mathern G, Et Al. Definition Of Drug Resistant Epilepsy: Consensus Proposal By The Ad Hoc Task Force Of The Ilae Commission On Therapeutic Strategies. Epilepsia 2010; 51:1069-77. doi: 10.1111/J.15281167.2009.02397.X [Crossref] [ Google Scholar]
- Gerstner T, Bell N, König S. Oral Valproic Acid For Epilepsy-Long-Term Experience In Therapy And Side Effects. Expert Opin Pharmacother 2008; 9:285-92. doi: 10.1517/14656566.9.2.285 [Crossref] [ Google Scholar]
- Vajda F, Drummer O, Morris P, Mcneil J, Bladin P. Gas Chromatographic Measurement Of Plasma Levels Of Sodium Valproate: Tentative Therapeutic Range Of A New Anticonvulsant In The Treatment Of Refractory Epileptics. Clin Exp Pharmacol Physiol 1978; 5:67-73. doi: 10.1111/J.1440-1681.1978.Tb00653.X [Crossref] [ Google Scholar]
- Covanis A, Gupta A, Jeavons P. Sodium Valproate: Monotherapy And Polytherapy. Epilepsia 1982; 23:693-720. doi: 10.1111/J.1528-1157.1982.Tb05085.X [Crossref] [ Google Scholar]
- Gao S, Miao H, Tao X, Jiang B, Xiao Y, Cai F, Et Al. Lc–Ms/Ms Method For Simultaneous Determination Of Valproic Acid And Major Metabolites In Human Plasma. J Chromatogr B 2011; 879:1939-44. doi: 10.1016/J.jchromb.2011.05.022 [Crossref] [ Google Scholar]
- Lheureux Pe, Penaloza A, Zahir S, Gris M. Science Review: Carnitine In The Treatment Of Valproic Acid-Induced Toxicity–What Is The Evidence?. Crit Care 2005; 9:431. doi: 10.1186/Cc3742 [Crossref] [ Google Scholar]
-
Dickinson Rg, Hooper Wd, Dunstan Pr, Eadie Mj. Urinary Excretion Of Valproate And Some Metabolites In Chronically Treated Patients. Ther Drug Monit 1989; 11: 127-33. Pmid:2497561.
- Erhart S, Amann A, Haberlandt E, Edlinger G, Schmid A, Filipiak W, Et Al. 3-Heptanone As A Potential New Marker For Valproic Acid Therapy. J Breath Res 2009; 3:016004. doi: 10.1088/1752-7155/3/1/016004 [Crossref] [ Google Scholar]
- Jabbaribar F, Mortazavi Sa, Jouyban A. Analytical Methods For Determination Of Antiepileptic Drugs. Curr Pharm Anal 2009; 5:277-345. doi: 10.2174/157341209788922048 [Crossref] [ Google Scholar]
- Shahdousti P, Mohammadi A, Alizadeh N. Determination Of Valproic Acid In Human Serum And Pharmaceutical Preparations By Headspace Liquid-Phase Microextraction Gas Chromatography-Flame Ionization Detection Without Prior Derivatization. J Chromatogr B 2007; 850:128-33. doi: 10.1016/J.jchromb.2006.11.013 [Crossref] [ Google Scholar]
- Farajzadeh Ma, Farhadi K, Matin Aa, Hashemi P, Jouyban A. Headspace Solid-Phase Microextraction-Gas Chromatography Method For The Determination Of Valproic Acid In Human Serum, And Formulations Using Hollow-Fiber Coated Wire. Anal Sci 2009; 25:875-9. doi: 10.2116/Analsci.25.875 [Crossref] [ Google Scholar]
- Jahangiri S, Hatami M, Farhadi K, Bahram M. Hollow-Fiber-Based Lpme As A Reliable Sampling Method For Gas-Chromatographic Determination Of Pharmacokinetic Parameters Of Valproic Acid In Rat Plasma. Chromatographia 2013; 76:663-9. doi: 10.1007/S10337-013-2432-8 [Crossref] [ Google Scholar]
- Fazeli-Bakhtiyari R, Panahi-Azar V, Sorouraddin Mh, Jouyban A. Determination Of Valproic Acid In Human Plasma Using Dispersive Liquid-Liquid Microextraction Followed By Gas Chromatography-Flame Ionization Detection. Iran J Biomed Sci 2015; 18:979. [ Google Scholar]
- Deng C, Li N, Ji J, Yang B, Duan G, Zhang X. Development Of Water‐Phase Derivatization Followed By Solid‐Phase Microextraction And Gas Chromatography/Mass Spectrometry For Fast Determination Of Valproic Acid In Human Plasma. Rapid Commun Mass Spectrom 2006; 20:1281-7. doi: 10.1002/Rcm.2451 [Crossref] [ Google Scholar]
- Rhoden L, Antunes Mv, Hidalgo P, Da Silva Cá, Linden R. Simple Procedure For Determination Of Valproic Acid In Dried Blood Spots By Gas Chromatography–Mass Spectrometry. J Pharm Biomed Anal 2014; 96:207-12. doi: 10.1016/J.jpba.2014.03.044 [Crossref] [ Google Scholar]
- Amini H, Javan M, Ahmadiani A. Development And Validation Of A Sensitive Assay Of Valproic Acid In Human Plasma By High-Performance Liquid Chromatography Without Prior Derivatization. J Chromatogr B 2006; 830:368-71. doi: 10.1016/J.jchromb.2005.11.028 [Crossref] [ Google Scholar]
- Lin M-C, Kou H-S, Chen C-C, Wu S-M, Wu H-L. Simple And Sensitive Fluorimetric Liquid Chromatography Method For The Determination Of Valproic Acid In Plasma. J Chromatogr B 2004; 810:169-72. doi: 10.1016/J.jchromb.2004.07.025 [Crossref] [ Google Scholar]
- Ramakrishna N, Vishwottam K, Manoj S, Koteshwara M, Santosh M, Chidambara J, Et Al. Liquid Chromatography/Electrospray Ionization Mass Spectrometry Method For The Quantification Of Valproic Acid In Human Plasma. Rapid Commun Mass Spectrom 2005; 19:1970-8. doi: 10.1002/Rcm.2012 [Crossref] [ Google Scholar]
- Pucci V, Mandrioli R, Raggi Ma. Determination Of Valproic Acid (2‐Propylpentanoic Acid) In Human Plasma By Capillary Electrophoresis With Indirect Uv Detection. Electrophoresis 2003; 24:2076-83. doi: 10.1002/Elps.200305405 [Crossref] [ Google Scholar]
- Wu H, Zhang J, Norem K, El-Shourbagy Ta. Simultaneous Determination Of A Hydrophobic Drug Candidate And Its Metabolite In Human Plasma With Salting-Out Assisted Liquid/Liquid Extraction Using A Mass Spectrometry Friendly Salt. J Pharm Biomed Anal 2008; 48:1243-8. doi: 10.1016/J.jpba.2008.09.002 [Crossref] [ Google Scholar]
- Bahrami G, Mirzaeei S, Kiani A. Determination Of Acyclovir In Human Serum By High-Performance Liquid Chromatography Using Liquid–Liquid Extraction And Its Application In Pharmacokinetic Studies. J Chromatogr B 2005; 816:327-31. doi: 10.1016/J.jchromb.2004.11.038 [Crossref] [ Google Scholar]
- Postigo C, Lopez De Alda Mj, Barceló D. Fully Automated Determination In The Low Nanogram Per Liter Level Of Different Classes Of Drugs Of Abuse In Sewage Water By On-Line Solid-Phase Extraction-Liquid Chromatography− Electrospray-Tandem Mass Spectrometry. Anal Chem 2008; 80:3123-34. doi: 10.1021/Ac702060j [Crossref] [ Google Scholar]
- Lee H-B, Peart Te, Svoboda Ml. Determination Of Endocrine-Disrupting Phenols, Acidic Pharmaceuticals, And Personal-Care Products In Sewage By Solid-Phase Extraction And Gas Chromatography–Mass Spectrometry. J Chromatogr A 2005; 1094:122-9. doi: 10.1016/J.chroma.2005.07.070 [Crossref] [ Google Scholar]
- Kristoffersen L, Øiestad El, Opdal Ms, Krogh M, Lundanes E, Christophersen As. Simultaneous Determination Of 6 Beta-Blockers, 3 Calcium-Channel Antagonists, 4 Angiotensin-Ii Antagonists And 1 Antiarrhytmic Drug In Post-Mortem Whole Blood By Automated Solid Phase Extraction And Liquid Chromatography Mass Spectrometry: Method Development And Robustness Testing By Experimental Design. J Chromatogr B 2007; 850:147-60. doi: 10.1016/J.jchromb.2006.11.030 [Crossref] [ Google Scholar]
- Lucena R, Cruz-Vera M, Cárdenas S, Valcárcel M. Liquid-Phase Microextraction In Bioanalytical Sample Preparation. Bioanalysis 2009; 1:135-149. doi: 10.4155/Bio.09.16 [Crossref] [ Google Scholar]
- Rezaee M, Assadi Y, Hosseini M-Rm, Aghaee E, Ahmadi F, Berijani S. Determination Of Organic Compounds In Water Using Dispersive Liquid–Liquid Microextraction. J Chromatogr A 2006; 1116:1-9. doi: 10.1016/J.chroma.2006.03.007 [Crossref] [ Google Scholar]
- Sobhi Hr, Kashtiaray A, Farahani H, Abrahimpour F, Esrafili A. Quantitation Of Valproic Acid In Pharmaceutical Preparations Using Dispersive Liquid‐Liquid Microextraction Followed By Gas Chromatography‐Flame Ionization Detection Without Prior Derivatization. Drug Test Anal 2010; 2:362-6. doi: 10.1002/Dta.131 [Crossref] [ Google Scholar]
- Zuloaga O, Olivares M, Navarro P, Vallejo A, Prieto A. Dispersive Liquid–Liquid Microextraction: Trends In The Analysis Of Biological Samples. Bioanalysis 2015; 7:2211-25. doi: 10.4155/Bio.15.141 [Crossref] [ Google Scholar]
- Yebra-Pimentel I, Martínez-Carballo E, Regueiro J, Simal-Gándara J. The Potential Of Solvent-Minimized Extraction Methods In The Determination Of Polycyclic Aromatic Hydrocarbons In Fish Oils. Food Chem 2013; 139:1036-43. doi: 10.1016/J.foodchem.2013.02.012 [Crossref] [ Google Scholar]
- Jia C, Zhu X, Wang J, Zhao E, He M, Chen L, Et Al. Extraction Of Pesticides In Water Samples Using Vortex-Assisted Liquid–Liquid Microextraction. J Chromatogr A 2010; 1217:5868-71. doi: 10.1016/J.chroma.2010.07.055 [Crossref] [ Google Scholar]
- Farajzadeh Ma, Mogaddam Mra. Air-Assisted Liquid–Liquid Microextraction Method As A Novel Microextraction Technique; Application In Extraction And Preconcentration Of Phthalate Esters In Aqueous Sample Followed By Gas Chromatography–Flame Ionization Detection. Anal Chim Acta 2012; 728:31-8. doi: 10.1016/J.aca.2012.03.031 [Crossref] [ Google Scholar]
- Gamez G, Zhu L, Disko A, Chen H, Azov V, Chingin K, Et Al. Real-Time, In Vivo Monitoring And Pharmacokinetics Of Valproic Acid Via A Novel Biomarker In Exhaled Breath. Chem Comm 2011; 47:4884-6. doi: 10.1039/C1cc10343a [Crossref] [ Google Scholar]
- Khoubnasabjafari M, Rahimpour E, Jouyban A. Exhaled Breath Condensate As An Alternative Sample For Drug Monitoring. Bioanalysis 2018; 10:61-64. doi: 10.4155/Bio-2017-0205 [Crossref] [ Google Scholar]
- Fisher Rs. Therapeutic Devices For Epilepsy. Ann Neurol 2012; 71:157-68. doi: 10.1002/Ana.22621 [Crossref] [ Google Scholar]
- Sørensen At, Kokaia M. Novel Approaches To Epilepsy Treatment. Epilepsia 2013; 54:1-10. doi: 10.1111/Epi.12000 [Crossref] [ Google Scholar]
-
Peña Mia. Rapid Gas Chromatographic Determination Of Valproic
Acid In Serum. J Chromatogr 1981; 225: 459-62. Doi: Pmid:
6795216
-
Feriduni B, Farajzadeh Ma, Jouyban A. Determination Of Two Antiepileptic Drugs In Urine By Homogenous Liquid-Liquid Extraction Performed In A Narrow Tube Combined With Dispersive Liquid-Liquid Microextraction Followed By Gas Chromatography-Flame Ionization Detection. Iran J Pharm Res 2018; In Press.