BioImpacts. 9(3):145-159.
doi: 10.15171/bi.2019.19
Original Research
Functional expression and impact of testis-specific gene antigen 10 in breast cancer: a combined in vitro and in silico analysis
Mohammad Reza Asgharzadeh 1, 2, 3, †, Mohammad M. Pourseif 1, †, Jaleh Barar 1, 4  , Morteza Eskandani 1, Mojtaba Jafari Niya 2, 3, Mohammad Reza Mashayekhi 5, Yadollah Omidi 1, 4, *
Author information:
1 Research Center for Pharmaceutical Nanotechnology, Biomedicine Institute, Tabriz University of Medical Sciences, Tabriz, Iran
2 Department of Biology, Fars Science and Research Branch, Islamic Azad University, Marvdasht, Iran
3 Department of Biology, Marvdasht Branch, Islamic Azad University, Marvdasht, Iran
4 Department of Pharmaceutics, Faculty of Pharmacy, Tabriz University of Medical Sciences, Tabriz, Iran
5 Department of Genetics, Tabriz Branch, Islamic Azad University, Tabriz, Iran
† These authors contributed equally to this work
Abstract
Introduction:
Testis-specific gene antigen 10 (TSGA10) is a less-known gene, which is involved in the vague biological paths of different cancers. Here, we investigated the TSGA10 expression using different concentrations of glucose under hypoxia and also its interaction with the hypoxia-inducible factor 1 (HIF-1).
Methods:
The breast cancer MDA-MB-231 and MCF-7 cells were cultured with different concentrations of glucose (5.5, 11.0 and 25.0 mM) under normoxia/hypoxia for 24, 48, and 72 hours and examined for the HIF-1α expression and cell migration by Western blotting and scratch assays. The qPCR was employed to analyze the expression of TSGA10. Three-dimensional (3D) structure and the energy minimization of the interacting domain of TSGA10 were performed by MODELLER v9.17 and Swiss-PDB viewer v4.1.0/UCSF Chimera v1.11. The UCSF Chimera v1.13.1 and Hex 6.0 were used for the molecular docking simulation. The Cytoscape v3.7.1 and STRING v11.0 were used for protein-protein interaction (PPI) network analysis. The HIF-1a related hypoxia pathways were obtained from BioModels database and reconstructed in CellDesigner v4.4.2.
Results:
The increased expression of TSGA10 was found to be significantly associated with the reduced metastasis in the MDA-MB-231 cells, while an inverse relationship was seen between the TSGA10 mRNA level and cellular migration but not in the MCF-7 cells. The C-terminal domain of TSGA10 interacted with HIF-1α with high affinity, resulting in PPI network with 10 key nodes (HIF-1α, VEGFA, HSP90AA1, AKT1, ARNT, TP53, TSGA10, VHL, JUN, and EGFR).
Conclusions:
Collectively, TSGA10 functional expression alters under the hyper-/hypo-glycemia and hypoxia, which indicates its importance as a candidate bio-target for the cancer therapy.
Keywords: Hypoxia, TSGA10, Molecular docking, HIF-1α, Protein-protein interaction network, Breast cancer
Copyright and License Information
© 2019 The Author(s)
This work is published by BioImpacts as an open access article distributed under the terms of the Creative Commons Attribution License (
http://creativecommons.org/licenses/by-nc/4.0/). Non-commercial uses of the work are permitted, provided the original work is properly cited.
Introduction
Much attention has recently been paid to a new group of effective cancer genes, so-called cancer/testis genes. Cancer-testis antigens (CTAs) are a group of tumor-related antigens (Ags) (e.g., NY-ESO-1, SSX1, HOM-TES-85, TSGA10, AKAP4, ODF4, PIWIL2, and RHOXF2), which are profoundly overexpressed in the testis and different tumor sites, while they show limited expression in the normal cells/tissues.
1-4
It has been shown that the expression of these Ags is controlled epigenetically.
5
TSGA10 is a newly identified member of this gene family, which contributes to the cell division, differentiation, and migration.
6
It is expressed in the testis during the progressive stages of embryogenesis, spermatogenesis, and also in some solid tumors such as breast cancer.
7
It has been proposed that TSGA10 plays a key role in the proliferating and survival of the breast cancer cells. The TSGA10 gene encodes a soluble protein, which is not a membrane protein.
8,9
It is expressed in small amounts in the undifferentiated embryonic stem cells. On the other hand, during entering a cell into the mitosis phase, the TSGA10 level is increased up to 6-fold, indicating its role in the cell division process.
10
In a number of studies, the expression of TSGA10 gene was shown to be low in the normal cells,
11,12
while its expression appears to be high, therefore this molecular marker is considered as a candidate tumor suppressor gene. Tumor microenvironment (TME) is a heterogeneous milieu composed of several types of cancerous and non-cancerous cells,
13,14
and shows unique characteristics, including anomalous metabolism of energetic pathways (e.g., glucose) together with irregular metabolisms of amino acids (e.g., L-tryptophan), pH dysregulation, and hypoxia.
15,16
The main reason for the pH dysregulation in TME is the increased glycolysis rather than oxidative phosphorylation (the so-called Warburg effect).
15
According to this pathobiological phenomenon, the intracellular pH (pHi) is increased from ~ 7.2 to about 7.4, and extracellular pH (pHe) is reduced from approximately 7.4 to ~ 6.7-7.1.
17
Further, hypoxia-inducible factor 1-alpha (HIF-1α) is one of the important transcription factors (TFs) that intervene with several critical cellular functions during hypoxia, including cellular responses to the hypoxia, glycolytic cycle, angiogenesis, migration, invasion, and metastasis of malignant cells.
15,16,18
In this case, HIF-1α acts as an architecture in some cellular signaling pathways, including (i) PI3K/AKT and MAPK, (ii) reduction of the function of tumor-suppressor genes (e.g., VHL, PTEN, and CDKN2A), and in contrast, (iii) increasing the activity of some oncogenes (e.g., RAS, SRC, BCR-ABL, TWIST1, and MET).
19-21
Furthermore, recent researches have indicated that TSGA10 has a high affinity to interact with HIF-1α.
22
However, the precise role of TSGA10 in different normal and cancer cells is not still fully identified. Thus, this gene seems to be an interesting candidate biomarker for further investigations.
The use of in silico computational analysis and systems biology provides a robust simulation workspace for biologists on more accurate detection of the physical interactions between various bio-elements (e.g., TFs) and their regulatory relationships within different biological pathways.
23
Among these, protein-protein interaction (PPI) networks can serve to decrypt and predict the less-known biological paths and functions.
24,25
It should be noted that the PPI networks can grant attractive topological features relative to the specific physical contacts between TSGA10 and the other proteins involved in the breast cancer.
26
For this reason, we first investigated the potential effects of hyperglycemia/hypoglycemia/hypoxia on TSGA10 expression in the breast cancer MDA-MB-231 cells and also pursued the metastasis process in relation with this gene in vitro. Second, we studied the biochemical features, 3D structure, and subcellular localization of TSGA10 and HIF-1α using various bioinformatic tools. We also capitalized on the docking- and network-based analysis to assess the binding affinity and interactions between TSGA10 and HIF-1α and the other interactive oncoproteins in the related PPI network. We also introduced redesigned signaling pathways related to TSGA10 and HIF-1α for both normoxia and hypoxia conditions.
Materials and methods
Cell culture
Human breast cancer cell lines (MDA-MB-231and MCF-7) were purchased from the Iranian National Cell Bank (Pasteur Institute, Tehran, Iran). Cells were cultured in RPMI 1640 medium (Gibco, Thermo Fisher Scientific Corp., Waltham, MA, USA) containing 10% (v/v) fetal calf serum (Thermo Fisher Scientific Corp., Waltham, MA, USA) and 1% penicillin/streptomycin (Invitrogen, Thermo Fisher Scientific Corp., Waltham, MA, USA). Cells were maintained as monolayer cultures at 37ºC in a humidified 5% CO2 atmosphere, and cultivated using different concentrations of glucose (5.5, 11, and 25 mM) and under hypoxia (1% O2) to mimic the TME conditions. For the induction of hypoxia, the cultivated cells were incubated with CoCl2.
27
Protein extraction and western blotting
For the extraction of the total protein, the cultivated cells were lysed using the lysis buffer [50 mM Tris (pH 7.4), 1% Triton X-100, 1% sodium 125 deoxycholate, 0.1% SDS, 150 mM NaCl, 1.0 mM EDTA, 1.0 mM Na3VO4, and inhibitor cocktail tablets]. A designated equal amount of the total proteins extracted from different treatments was resolved on a sodium dodecyl sulfate-polyacrylamide gel (i.e., 7.5%, 12.5% polyacrylamide gels) electrophoresis (SDS-PAGE) and transferred onto the nitrocellulose membrane (Bio-Rad, Hercules, CA, USA). The membranes were incubated with the primary rabbit monoclonal anti-HIF-1α from Life Technology Invitrogen (Thermo Fisher Scientific Corp., Waltham, MA, USA). Then, they were overlaid with the secondary polyclonal goat anti-rabbit antibodies (Abcam, Cambridge, UK). The protein bands were visualized using a chemiluminescence system (Millipore, Burlington, MA, USA).
Scratch assay
MDA-MB-231 and MCF-7 cells were cultivated to reach the full confluency. Then, they were scratched by the tip of the crystal pipettes and washed twice with PBS to remove the cell debris and the floating cells. The cells were then treated with different concentrations of glucose (5.5, 11, and 25 mM) under hypoxic condition (1% and 20% O2) for 8 h (MDA-MB-231) and 24 h (MCF-7). Images were captured at different time points after the treatment to mark and assess the changes in the migration of phenotypically modified MDA-MB-231 and MCF-7 cells. The cell distance was measured by an open source image processing software, ImageJ (National Institutes of Health, Bethesda, MD, USA). Each independent experiment was performed in replicates.
Real time-PCR
Total RNA was extracted using Trizol reagent (Invitrogen, Thermo Fisher Scientific Corp., Waltham, MA, USA). Reverse transcription-PCR was performed with M-MLV (Promega, Madison, WI, USA) following a standard protocol [65°C for 5 minutes (oligonucleotide, random hexamers, 10 mM dnTPs)], followed by 25°C for 10 minutes, 42 °C for 60 minutes and 70°C for 10 minutes (RNase inhibitor, M-MLV, 5X buffer and H2O). The cDNA (1 μL) from each sample was used with SYBR Green in a thermo-cycler (Bio-Rad, Hercules, CA, USA) to perform the real-time PCR in a total volume of 20 μL. Thermal cycling condition was as follows: 1 cycle at 94°C for 10 minutes, 40 cycles at 95°C for 15 seconds, 58°C (depending on the gene) for 30 seconds, and 72°C for 25 seconds. The primers used were as follows: TSGA10 5'-CAACGGCACATGCTATTCTCC-3' (forward), 5'-CCACAGTGCTTATGGTTTCCTTC-3' (reverse); GAPDH 5'-AAGCTCATTTCCTGGTATGACAACG-3' (forward), 5'-TCTTCCTCTTGTGCTCTTGCTGG-3' (reverse). The relative fold change in mRNA expression was calculated using the 2-RΔΔCt method. Average of ΔCt values was normalized with Glyceraldehyde-3-phosphate dehydrogenase (GAPDH) as the control. The reactions were performed in triplicates.
Statistical analysis
In this study, at least three independent experiments were conducted. The data are presented as means ± SD. The data were evaluated by one-way analysis of variance (ANOVA) followed by a multiple comparison post hoc Tukey test (Graph Pad software, version 6.0, Inc., La Jolla, CA, USA). A P value less than 0.05 was considered statistically significant. Each point/column represents the mean value ± SD (n=3) (*P< 0.05, ** P<0.01).
Homology modeling, validation, and energy minimization
The possible physical interaction between TSGA10 and HIF-1α was evaluated based on the literature search.
22
The PPI was simulated computationally using the molecular docking methods. The 134-amino acid domain of TSGA10 (556-689) participated in this protein-protein interaction was modeled using MODELLER v4.0 software.
28
The 3D structure of HIF-1α was obtained from the Protein Data Bank (PDB ID: 1H2M). The quality of structure modeling was assessed based on the ProSA z-score, Verify3D and ERRAT web-servers.
29-31
The stereochemical accuracy of the models was also analyzed based on the psi/phi Torsion angles through the Ramachandran’s plot using RAMPAGE server.
32
The Swiss-PDB viewer v4.1.0 software was employed for the energy minimization of models.
33
Molecular docking
The C-terminal domain of TSGA10 was structurally minimized and prepared for the docking through the Dock Prep tool of UCSF Chimera v1.11 program.
34
In this step, four main tasks were done, including (i) deleting water molecules, (ii) repairing truncated side chains, (iii) adding hydrogen atoms, and (iv) assigning partial atomic charges.
35
The molecular docking process was performed using the Hex v8.0.0 software as described previously.
36
The docking result was analyzed and visualized using LigPlot+ v1.4.5,
37
and UCSF Chimera v1.11 programs.
Cellular localization
Intracellular and extracellular localization of TSGA10 and HIF-1α and the main domain of TSGA10, which participates in the physical interaction with HIF-1α, were retrieved from the UniProtKB database. The gene ontology tool of the DAVID database was also used for the analysis of the cellular component (CC) ontology.
38
Functional enrichment analysis
The functional annotation was performed using the “Database for Annotation, Visualization and Integrated Discovery” (DAVID) web-server.
38
The biological pathways and functional clustering annotation for the hub-related proteins in the PPI network was retrieved from the DAVID database. A corrected P-value less than 0.05 was set as the threshold for the functional classification enrichment analysis.
PPI network analysis
The proteins for possible physical interactions with TSGA10 and HIF-1α were downloaded from the STRING database v10.5,
39
and imported to the Cytoscape v3.6.0 for the visualization and analysis. The network statistical significance was measured using the Network Analyzer tool of the Cytoscape.
40
The PPI network was regenerated using 57 proteins that were related to the adjacent biological processes. Further, the PPI network was generated based on the medium confidence score of 0.40 and for exploring the network data, in which all the interaction source parameters were selected, including text-mining, experiments, databases, co-expression, neighborhood, gene fusion, and co-occurrence. The topological centralities of the PPI network such as betweenness centrality, connectivity degree of nodes, the network diameter (the maximum of the shortest path lengths), the shortest path lengths between two nodes and the mean path length (the average of the shortest path lengths) were analyzed using the Network Analyzer plugin of Cytoscape. The CytoHubba plugin in Cytoscape was used for the prediction of important nodes (or hub proteins), and jActiveModule tool was used for the module detection in the PPI network.
41
Highly interconnected sub-graphs (clusters) in the PPI network were identified using MCODE algorithm.
42
The MCODE, as a graph clustering tool, was used based on the finding parameters, including (i) degree cutoff of 2.0, (ii) node score cutoff of 0.2, (iii) K-core of 2.0, and (iv) maximum depth of 100.
Signaling pathways reconstruction
The signaling pathway in relation to TSGA10 and HIF-1α and under the normoxic and hypoxic conditions was manually reconstructed based on the PPI network analysis and also the BioModels and KEGG pathway database. The signaling pathway visualization in the form of a graphical environment was carried out via the CellDesigner v4.4 program.
43
Results
It seems that the profile of TSGA10 expression is an important factor in the initiation and development of breast cancer. Its expression in 17 cancer types is shown in Fig. S1 (see Supplementary file 1).
Hypoxia promotes migration in the MDA-MB-231 cells
Cell migration was an evaluation criterion for the metastatic potential of cancer cells. To further evaluate how hypoxia and glucose concentration might promote the MDA-MB-231 and MCF-7 cells migration in vitro, we capitalized on the scratch assay. The confluent monolayer of cultivated cells was scratched carefully. As shown in Figs. 1 and 2 , the cells were cultivated using two different conditions of glucose and oxygen concentrations, including the use of 5.5, 11, or 25 mM glucose either under normoxic 20% O2 condition (panel A) or hypoxic 1% O2 condition (panel B) for 8 hours (MDA-MB-231 cells) and 24 hours (MCF-7 cells). Hypoxia condition resulted in increased level of HIF-1 (Figs. 1 and 2C). The MDA-MB-231 cells under normoxic conditions showed significant increases in the migration with the increased concentration of glucose in a dose-dependent manner (5.5 mM<11 mM<25 mM). The hypoxic cells, however, showed decreased migration in presence of high concentrations of glucose (5.5 mM>11 mM>25 mM) (Fig. 1D). Scratch assay results for MCF-7 cells did not differ significantly in different concentrations of glucose, normoxia, and hypoxia after 24 hours (5.5 mM<11 mM<25 mM) (Fig. 2D). These results indicated that hypoxia and low glucose treatment of high-metastatic breast cancer MDA-MB-231 cells improved their proliferation and motility abilities, while in such situations, low-metastatic breast cancer MCF-7 cells exhibited reversible behavior. It seems that MCF-7 cells are not responsive to the hypoxia as much as MDA-MB-231 cells. These results highlight the importance of the hypoxia as an important factor in the breast cancer metastasis.
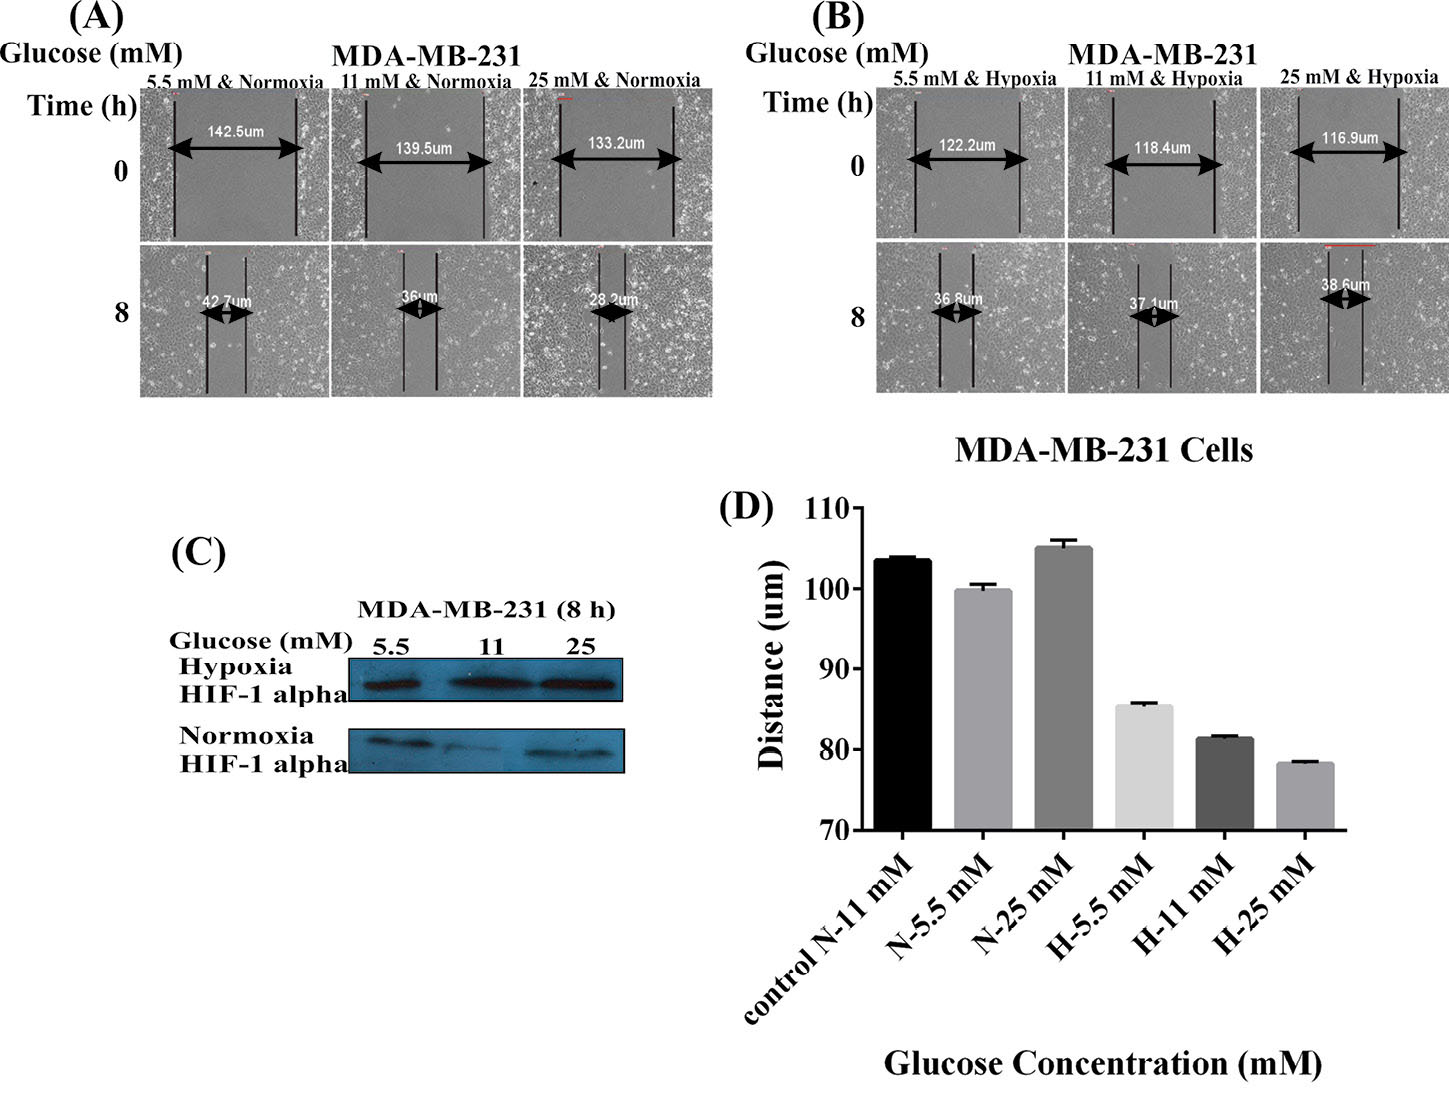
Fig. 1.
Effects of glucose concentrations and hypoxia on the MDA-MB-231 cell migration. Panels A and B represent the effects of different concentrations of glucose (5.5, 11, and 25 mM) under the normoxic (A) and hypoxic (B) conditions on the cell migration. (C) Western blot analysis of HIF-1 alpha in the MDA-MB-231 cells treated with different concentrations of glucose under the normoxia and hypoxia after 8 hours. Panel D shows the effects of the normoxia (A) and hypoxia (B) on the migration of MDA-MB-231 cells treated with different concentrations of glucose. N: Normoxia; H: Hypoxia.
.
Effects of glucose concentrations and hypoxia on the MDA-MB-231 cell migration. Panels A and B represent the effects of different concentrations of glucose (5.5, 11, and 25 mM) under the normoxic (A) and hypoxic (B) conditions on the cell migration. (C) Western blot analysis of HIF-1 alpha in the MDA-MB-231 cells treated with different concentrations of glucose under the normoxia and hypoxia after 8 hours. Panel D shows the effects of the normoxia (A) and hypoxia (B) on the migration of MDA-MB-231 cells treated with different concentrations of glucose. N: Normoxia; H: Hypoxia.
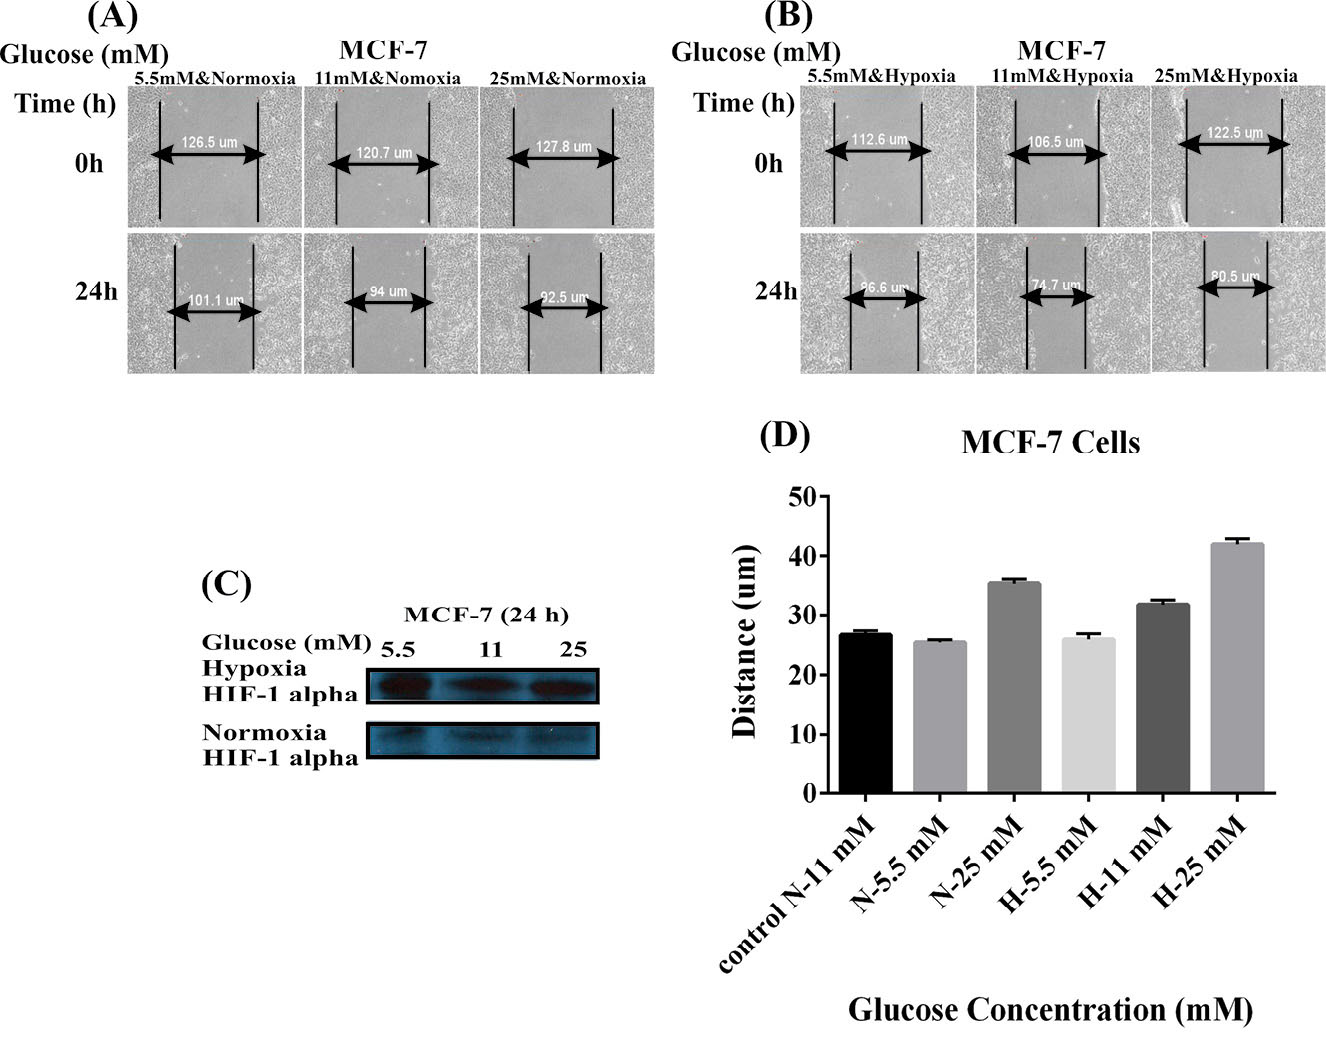
Fig. 2.
Effects of glucose concentrations and hypoxia on the MCF-7 cell migration. Panels A and B represent the effects of different concentrations of glucose (5.5, 11, and 25 mM) under the normoxic (A) and hypoxic (B) conditions on the cell migration. (C) Western blot analysis of HIF-1 alpha in the MCF-7 cells treated with different concentrations of glucose under the normoxia and hypoxia after 24 hours. Panel D shows the effects of the normoxia (A) and hypoxia (B) on the migration of MCF-7 cells treated with different concentrations of glucose. N: Normoxia; H: Hypoxia.
.
Effects of glucose concentrations and hypoxia on the MCF-7 cell migration. Panels A and B represent the effects of different concentrations of glucose (5.5, 11, and 25 mM) under the normoxic (A) and hypoxic (B) conditions on the cell migration. (C) Western blot analysis of HIF-1 alpha in the MCF-7 cells treated with different concentrations of glucose under the normoxia and hypoxia after 24 hours. Panel D shows the effects of the normoxia (A) and hypoxia (B) on the migration of MCF-7 cells treated with different concentrations of glucose. N: Normoxia; H: Hypoxia.
Migration conditions reduce TSGA10 gene expression in MDA-MB-231 cells
The cultured MDA-MB-231 and MCF-7 cells treated with different concentrations of glucose and under hypoxic conditions for 24, 48 and 72 hours were investigated for the expression of TSGA10 mRNA by real-time PCR. The over-expression of TSGA10 mRNA in comparison with the untreated control MDA-MB-231and MCF-7 cells was observed in the MDA-MB-231 and MCF-7 cells treated with different concentrations of glucose under normoxia or hypoxia (Fig. 3). In comparison with the untreated control cells, we witnessed that 24-hour hypoxia and high glucose (25 mM) increased the expression of TSGA10 mRNA in the MDA-MB-231 cells. However, after 48 and 72 hours, the expression of TSGA10 was increased with glucose under normoxia (Fig. 3). The cells treated with 25 mM glucose under the normoxic conditions showed the highest expression after 48 hours, which was significantly reduced after 72 hours. Similarly, the cells treated with 25 mM glucose under hypoxic condition showed markedly high expression of TSGA10 mRNA after 24 hours, which was reduced afterward indicating a radical change in the expression of the gene under high glucose level and hypoxia. To compare between the low- and high-metastatic tumor cells, we examined the expression of TSGA10 mRNA in MCF-7 cells. Despite showing similar trends, the MCF-7 cells showed a higher adaptation to the hypoxia and low glucose concentration over the time since the level of TSGA10 expression in such conditions showed a slight increase. Given the increased expression of TSGA10 mRNA in the MDA-MB-231 cells, it can be concluded that this gene might act as an inhibitor of the metastasis and migration of cancer cells.
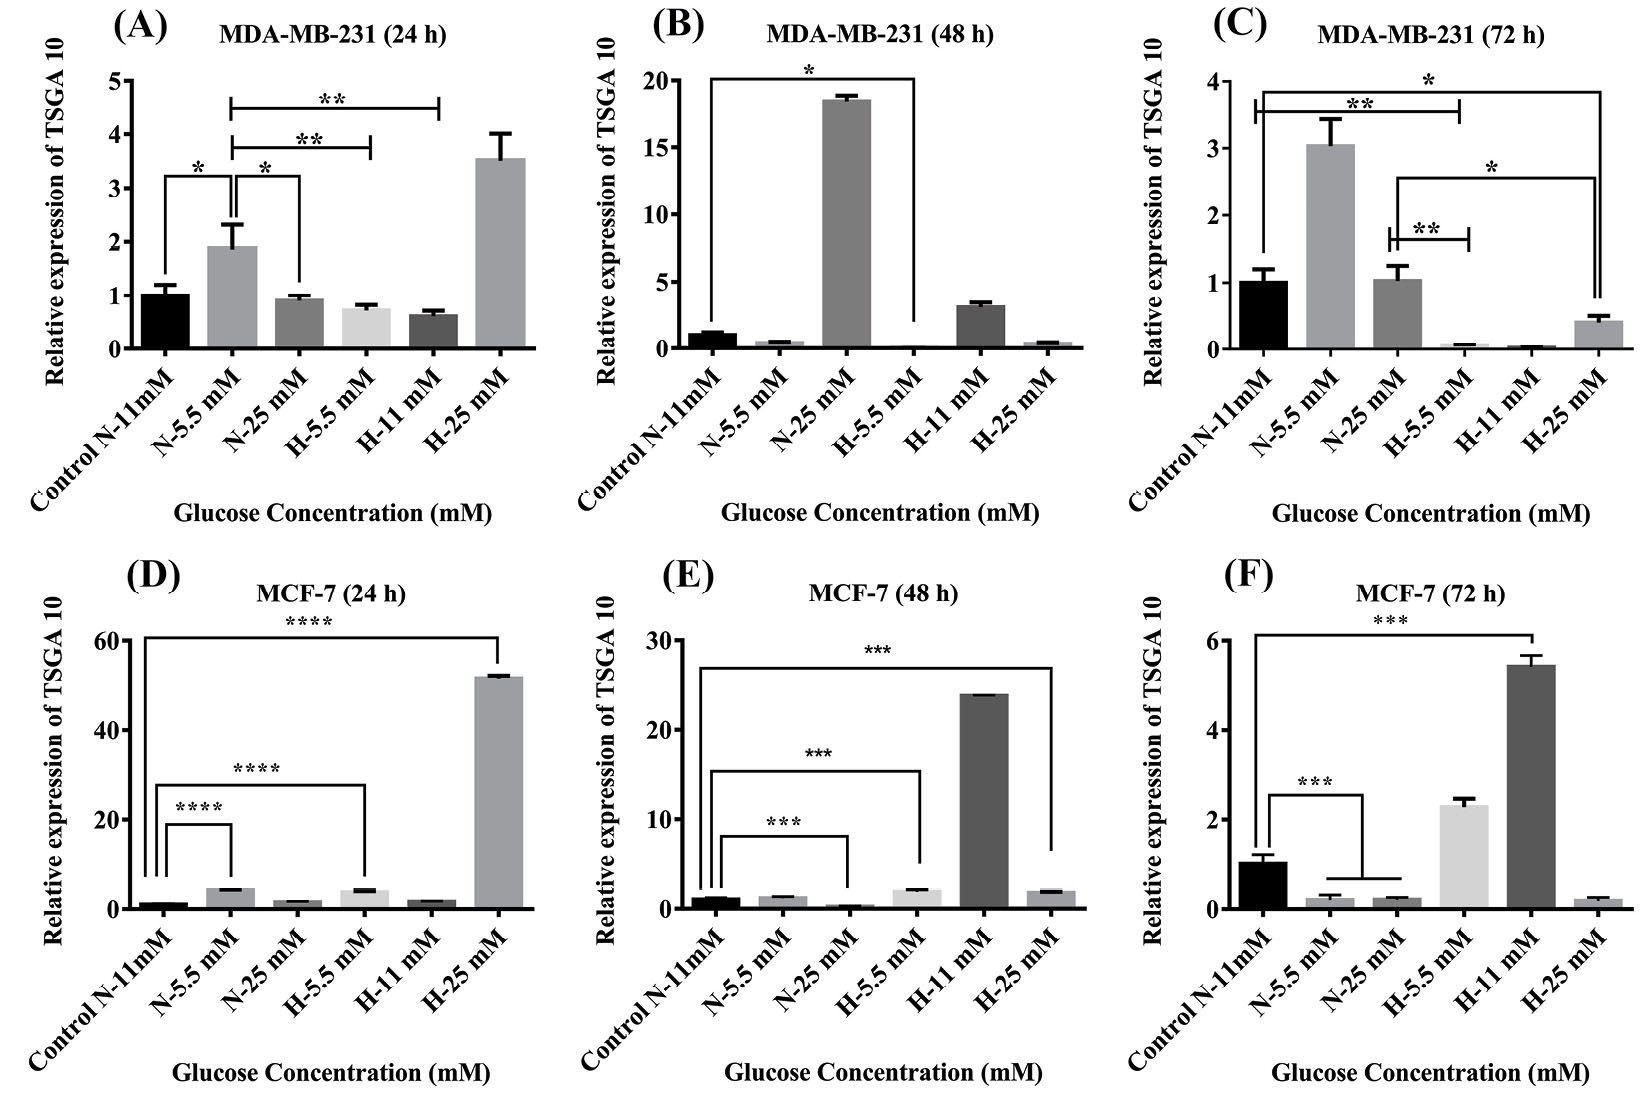
Fig. 3.
The TSGA10 mRNA expression in the MDA-MB-231 and MCF-7 cells. Baseline TSGA10 mRNA expression levels in breast cancer subtypes of MDA-MB-231 and MCF-7 were evaluated by real-time PCR. Extracting total RNA and normalized to GAPDH mRNA expression levels in (A) 24 hours, (B) 48 hours, and (C) 72 hours for MDA-MB-231 and (D) 24 hours, (E) 48 hours, and (F) 72 hours for MCF-7. The data show mean values ± SD. The one-way ANOVA was used for the statistical analysis. *P ≤ 0.05, **P ≤ 0.01, ***P ≤ 0.001, and **** P ≤ 0.0001.
.
The TSGA10 mRNA expression in the MDA-MB-231 and MCF-7 cells. Baseline TSGA10 mRNA expression levels in breast cancer subtypes of MDA-MB-231 and MCF-7 were evaluated by real-time PCR. Extracting total RNA and normalized to GAPDH mRNA expression levels in (A) 24 hours, (B) 48 hours, and (C) 72 hours for MDA-MB-231 and (D) 24 hours, (E) 48 hours, and (F) 72 hours for MCF-7. The data show mean values ± SD. The one-way ANOVA was used for the statistical analysis. *P ≤ 0.05, **P ≤ 0.01, ***P ≤ 0.001, and **** P ≤ 0.0001.
Three-dimensional structure modeling, validation, and energy minimization
Based on the UniProtKB database, the residue of TSGA10 (556-689) was identified as a key C-terminal domain that can closely interact with the alpha subunit of HIF-1 protein. Three-dimensional (3D) structure of this domain is shown in Fig. 3A. The energy minimization value of the modeled TSGA10 was about – 8972.120 kJ/mol. This numerical analysis decreased free energy of the modeled protein and improved its physical status.
44
The EasyModeller provided two modeling validation scores of GA431 and DOPE, in which the model with high accuracy shows a GA341 score of ~1.0 while the model with higher negative DOPE scores is considered as a stable structure.
44
The assessed values of GA341 and DOPE scores of the modeled TSGA10 were 1.0, and -14228.651 kcal/mole, respectively. Table 1 represents some other estimated validation values, including ProSA z-score, ERRAT, Verify3D, and Ramachandran plot.
Table 1.
The modeling validation assays using different online web-servers
|
Methods
|
Assay scheme
|
Score
|
Range
|
| ProSA-web |
Modeling verification by calculating an overall quality Z-score |
- 3.45 |
NPS*
|
| ERRAT (%) |
The overall quality for non-bounded atomic interactions |
91.65 |
>50% |
| VERIFY3D (%) |
The number of residues having an average 3D/1D score above 2.0 |
72.00 |
>80% |
| RAMPAGE (%) |
The residues within the allowed region in psi/phi Ramachandran plot |
98.60 |
>90% |
* Native protein size (NPS): This criterion checks the z-score of the target structure whether is within the range of scores typically identified for the native proteins of similar size.
Binding affinity between TSGA10 and HIF-1α
The docking energy value between the HIF-1α and TSGA10 domain was about -698.69 kcal/mol. The molecular interactions between the binding site of HIF-1α and TSGA10 domain are shown as 3D and 2D in Figs. 4C and 5 , respectively.
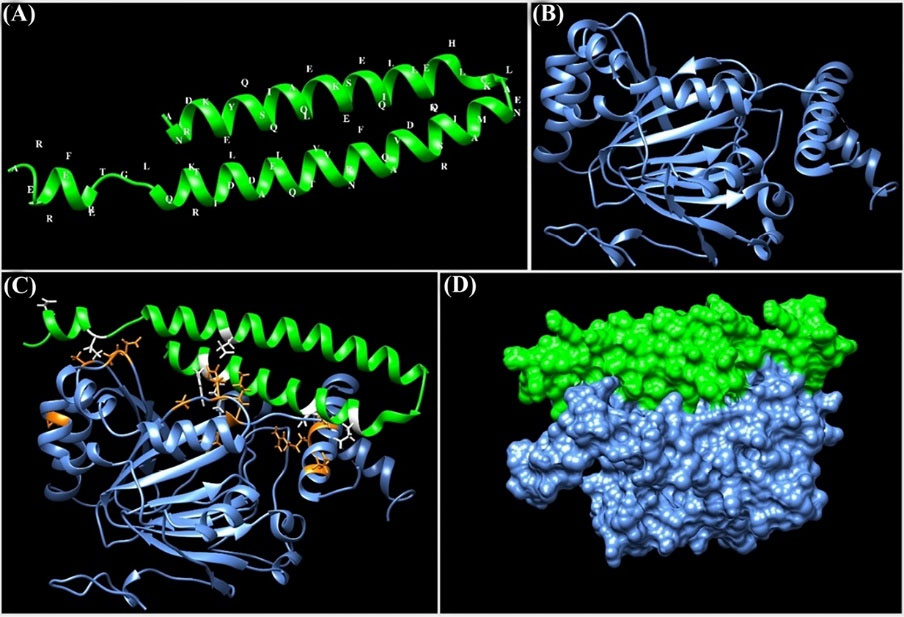
Fig. 4.
Molecular docking between the HIF-1α and the main domain of TSGA10 protein. (A) Three-dimensional (3D) structure of the C-terminal domain of TSGA10 protein. The structure was modeled using the EasyModeller software. (B) The 3D structure of HIF-1α (PDB ID: 1H2M). (C) The intramolecular docking between HIF-1α and the C-terminal domain of TSGA10. The molecular interactions (hydrogen and hydrophobic bonds) between the HIF-1α and TSGA10 domain are displayed as orange and white colors, respectively. (D) Docking between the HIF-1α and TSGA10 domain is shown as a surface representation. The protein structures were visualized using the UCSF Chimera program.
.
Molecular docking between the HIF-1α and the main domain of TSGA10 protein. (A) Three-dimensional (3D) structure of the C-terminal domain of TSGA10 protein. The structure was modeled using the EasyModeller software. (B) The 3D structure of HIF-1α (PDB ID: 1H2M). (C) The intramolecular docking between HIF-1α and the C-terminal domain of TSGA10. The molecular interactions (hydrogen and hydrophobic bonds) between the HIF-1α and TSGA10 domain are displayed as orange and white colors, respectively. (D) Docking between the HIF-1α and TSGA10 domain is shown as a surface representation. The protein structures were visualized using the UCSF Chimera program.
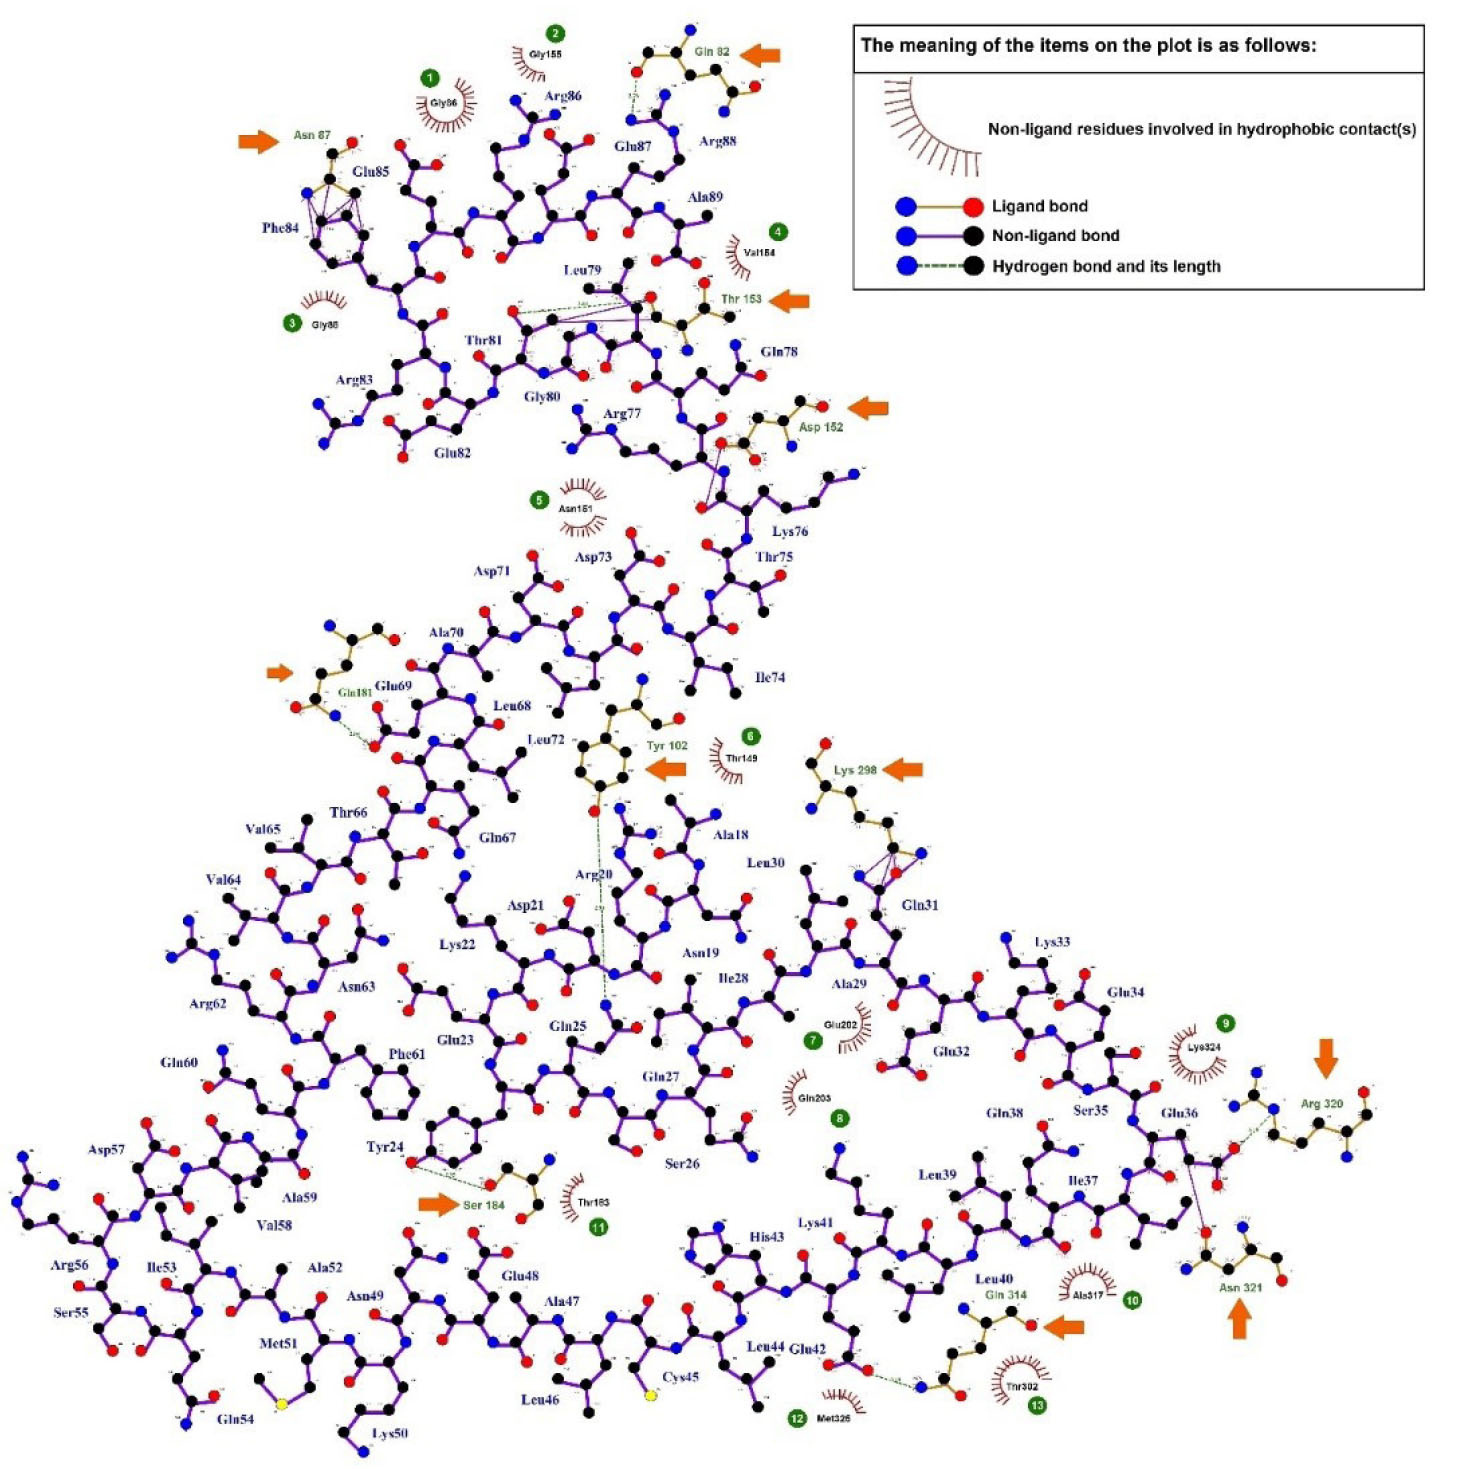
Fig. 5.
Two-dimensional plot of the intramolecular interactions between the TSGA10 domain (556 - 689) and HIF-1α. The hydrogen bonds (green dotted lines) and the hydrophobic contacts (red spline curves) are shown in the diagram. The legend is observable in the plot. The hydrophobic contacts are numbered in the plot and the hydrogen bonds are marked with the orange arrows.
.
Two-dimensional plot of the intramolecular interactions between the TSGA10 domain (556 - 689) and HIF-1α. The hydrogen bonds (green dotted lines) and the hydrophobic contacts (red spline curves) are shown in the diagram. The legend is observable in the plot. The hydrophobic contacts are numbered in the plot and the hydrogen bonds are marked with the orange arrows.
As shown in Fig. 5 , thirteen residues of HIF-1α (i.e., Gly155, Gly86, Gly88, Val154, Asn151, Thr149, Thr183, Met325, Thr302, Ala317, and Lys324) were involved in the hydrophobic interactions with the TSGA10 domain. Further, eleven residues of HIF-1α (i.e., Gln82, Asn87, Thr153, Asp152, Gln181, Tyr102, Lys298, Ser184, Gln314, Asn321, and Arg320) participated in the hydrogen bonding with the TSGA10 domain. The average length of hydrogen bonds between the docked proteins was about 2.91 Å.
Prediction of subcellular localization
Subcellular localization of the TSGA10 and HIF-1α proteins are reported based on the database annotation (UniProtKB, Ensembl, GOC, CAFA, BHF-UCL, MGI, and HPA). These proteins showed a wide variety of adjacent subcellular localizations (Fig. 6). In this regard, based on the predicted confidence scores (0-5), the TSGA10 protein is mainly localized in the cell nucleus, and the HIF-1α is mainly localized in the nucleus and cytoplasm.
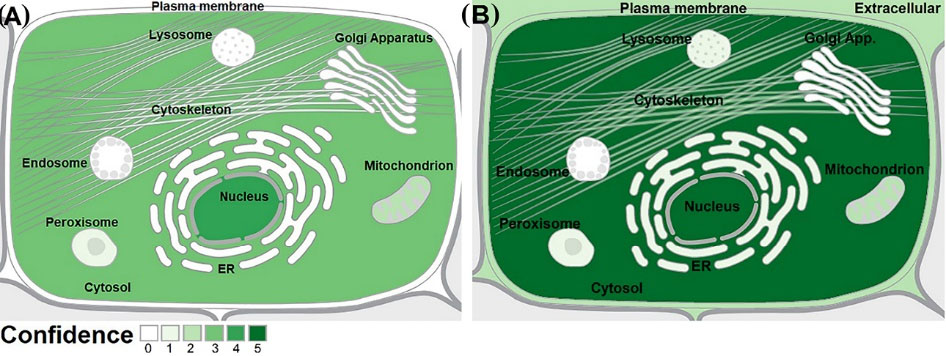
Fig. 6.
Subcellular localization of TSGA10 and HIF-1α proteins. (A) The TSGA10 protein is mainly localized in the nucleus. (B) The HIF-1α protein is localized in the cytoplasm. Data, with the confidence scores of 0 to 5, were obtained from the COMPARTMENTS web-source. ER: Endoplasmic reticulum.
.
Subcellular localization of TSGA10 and HIF-1α proteins. (A) The TSGA10 protein is mainly localized in the nucleus. (B) The HIF-1α protein is localized in the cytoplasm. Data, with the confidence scores of 0 to 5, were obtained from the COMPARTMENTS web-source. ER: Endoplasmic reticulum.
PPI network topological analysis
Topological and functional enrichment analysis of the generated PPI network was performed by means of the Network Analyzer plugin of Cytoscape that provided network radius and diameter (Table 2). In the PPI network, the average degree of each node and average of local clustering coefficient was calculated as 13.6 and 0.67, respectively. The degree distribution and clustering coefficient plots in the constructed PPI network were as a power law, therefore the network can be referred to as a scale-free network (Figs. S2 and S3).
Table 2.
The topological parameters of the constructed PPI network
|
Topology parameters
|
Amount
|
| Number of nodes |
57 |
| Network density |
0.242 |
| Network heterogeneity |
0.636 |
| Isolated nodes |
0 |
| Number of self-loops |
0 |
| Multi-edge node pairs |
0 |
| Clustering coefficient |
0.635 |
| Connected components |
1 |
| Network diameter |
4 |
| Network radius |
2 |
| Network centralization |
0.470 |
| Shortest paths |
3192 |
| Average number of neighbors |
13.579 |
| Characteristic path length |
2.053 |
In Table 3 , the top ten most connected nodes (hubs) are ranked based on different scoring algorithms of CytoHubba plugin. The consensus hubs into the PPI network are separately indicated. The MCC method provides a more accurate predicting performance than the other algorithms.
41
Integration of nine topological scoring approaches was used for the precise selection of the best hubs in this scale-free network.
Table 3.
The list of top 10 hubs obtained by employing the nine different types of scoring algorithms of CytoHubba plugin
|
Rank
|
Scoring method
|
Consensus
a
|
|
Betweenness
|
MNC
|
Bottleneck
|
Radiality
|
EcCentricity
|
MCC
|
Stress
|
Closeness
|
Degree
|
| 1 |
HIF-1α |
HIF1- α |
HIF-1α |
HIF-1α |
TSGA10 |
VEGFA |
HSP90AA1 |
HIF-1α |
HIF-1α |
HIF-1α |
| 2 |
HSP90AA1 |
VEGFA |
VEGFA |
VEGFA |
TEKT3 |
HIF-1α |
HIF-1α |
VEGFA |
VEGFA |
VEGFA |
| 3 |
TSGA10 |
ARNT |
HSP90AA1 |
ARNT |
LOC81691 |
TP53 |
AKT1 |
ARNT |
ARNT |
HSP90AA1 |
| 4 |
AKT1 |
AKT1 |
TSGA10 |
HSP90AA1 |
SPAG6 |
AKT1 |
VEGFA |
HSP90AA1 |
HSP90AA1 |
AKT1 |
| 5 |
ARNT |
HSP90AA1 |
APP |
AKT1 |
TUBA3C |
JUN |
ARNT |
AKT1 |
AKT1 |
ARNT |
| 6 |
VEGFA |
TP53 |
TP53 |
TP53 |
BACE1 |
EP300 |
TSGA10 |
TP53 |
TP53 |
TP53 |
| 7 |
TUPA3C |
VHL |
SPAG6 |
JUN |
HIF-1α |
EGFR |
APP |
VHL |
VHL |
TSGA10 |
| 8 |
SPAG6 |
JUN |
TUBB4B |
EGFR |
CXCR4 |
CDKN1A |
VHL |
JUN |
JUN |
VHL |
| 9 |
APP |
EGFR |
AKT1 |
VHL |
ADM |
MDM2 |
NOTCH1 |
EGFR |
EGFR |
JUN |
| 10 |
VHL |
EPO |
FLT1 |
EP300 |
BHLHE41 |
HSP90AA1 |
TP53 |
EP300 |
EPO |
EGFR |
MNC: maximum neighborhood component; MCC: maximal clique centrality.
a The final consensus protein hubs are ranked as 1 (as the highest) to 10 (the lowest).
The consensus hubs (CoHbs) can play a central role in the network clustering that reveals the active sub-networks (module) as they are involved in the crucial cellular functions into the PPI network. Moreover, deletion of the CoHbs may destroy the PPI network, leading to the basic disorders in the cellular homeostasis. In Fig. 7 , the topology of CoHbs is visible based on their score.
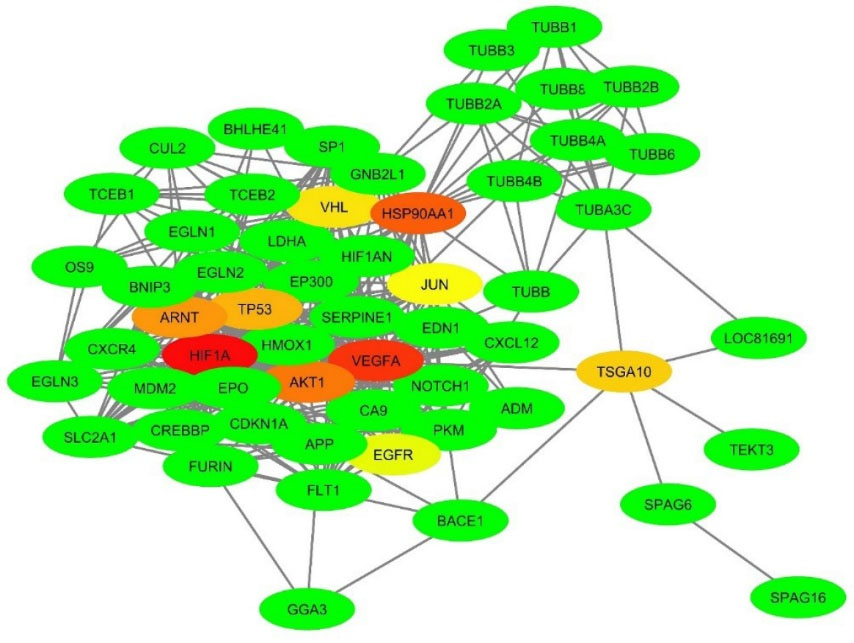
Fig. 7.
The PPI network of TSGA10 and HIF-1α proteins. About 57 proteins were found to be in the near relationship with the TSGA10 and HIF-1α proteins. The highly connected nodes (protein hubs) are identified using CytoHubba plugin, which are visible as a spectrum of colors from red (HIF-1α, as the highest rank hub) to lime (EGFR, as the lowest rank hub). The network was built based on the STRING database using the Cytoscape v3.6.0 software. PPI: Protein-protein interaction.
.
The PPI network of TSGA10 and HIF-1α proteins. About 57 proteins were found to be in the near relationship with the TSGA10 and HIF-1α proteins. The highly connected nodes (protein hubs) are identified using CytoHubba plugin, which are visible as a spectrum of colors from red (HIF-1α, as the highest rank hub) to lime (EGFR, as the lowest rank hub). The network was built based on the STRING database using the Cytoscape v3.6.0 software. PPI: Protein-protein interaction.
Network clustering analysis
For the detection of the network clusters, we used the MCODE plugin that is taken from the Cytoscape. The result of MCODE revealed three main network clusters (Fig. 8).
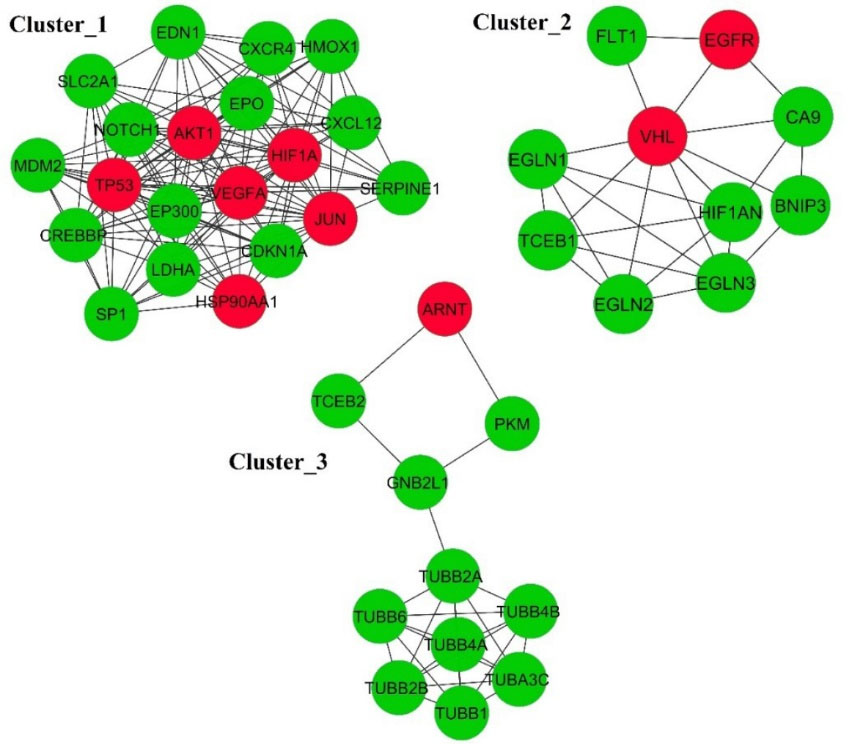
Fig. 8.
The significant clusters in the protein-protein interaction network. The red node represents the CoHbs with three clusters. The edge shows the interactions among the proteins.
.
The significant clusters in the protein-protein interaction network. The red node represents the CoHbs with three clusters. The edge shows the interactions among the proteins.
In addition, the CoHbs were imported to the functional annotation clustering tool of DAVID for the analysis of biological pathways, molecular function (MF), and biological process (BP) of TSGA10, HIF-1α. Table 4 represents the selected top three clusters with more enrichment score and a P-value less than 0.05. In the third cluster, TSGA10 and HIF-1α were located in the same cluster and showed the same keyword (nucleus and phosphoprotein).
Table 4.
List of functional clusters with a co-occurrence meaning the biological pathways common between the THCNs
|
Annotation cluster 1
|
|
Enrichment score 5.91
|
|
Category
|
Term
|
P-
value
|
Count
|
Genes
|
| KEGG_PATHWAY |
Renal cell carcinoma |
3.45E-09 |
6 |
ARNT, JUN, VHL, HIF-1α, VEGFA, AKT1,
|
| BIOCARTA |
Hypoxia-Inducible Factor in the cardiovascular system |
3.62E-09 |
6 |
ARNT, HSP90AA1, JUN, VHL, HIF-1α, VEGFA
|
| KEGG_PATHWAY |
HIF-1α signaling pathway |
2.80E-08 |
6 |
ARNT, VHL, HIF-1α, VEGFA, EGFR, AKT1
|
| GOTERM_BP_DIRECT |
Regulation of transcription from RNA polymerase II promoter in response to hypoxia (GO:0061418) |
3.46E-07 |
4 |
ARNT, VHL, HIF-1α, VEGFA
|
| GOTERM_BP_DIRECT |
Positive regulation of vascular endothelial growth factor receptor signaling pathway (GO:0030949) |
3.05E-05 |
3 |
ARNT, HIF-1α, VEGFA
|
| BIOCARTA |
VEGF, Hypoxia, and Angiogenesis |
3.30E-04 |
4 |
ARNT, VHL, HIF-1α, VEGFA
|
| GOTERM_BP_DIRECT |
Response to hypoxia (GO:0001666) |
0.004 |
3 |
ARNT, HIF-1α, VEGFA
|
|
Annotation cluster 2
|
|
Enrichment score: 4.43
|
|
Category
|
Term
|
P
-value
|
Count
|
Genes
|
| GOTERM_BP_DIRECT |
Positive regulation of endothelial cell proliferation (GO:0001938) |
3.24E-08 |
5 |
ARNT, JUN, HIF-1α, VEGFA, AKT1
|
| GOTERM_BP_DIRECT |
Outflow tract morphogenesis (GO:0003151) |
0.0003 |
3 |
JUN, HIF-1α, VEGFA
|
| GOTERM_BP_DIRECT |
Angiogenesis (GO:0001525) |
0.006 |
3 |
JUN, HIF-1α, VEGFA
|
|
Annotation cluster 3
|
|
Enrichment score: 3.16
|
|
Category
|
Term
|
P
-value
|
Count
|
Genes
|
| KEGG_PATHWAY |
Pathways in cancer (hsa05200) |
1.02E-10 |
9 |
TP53, ARNT, HSP90AA1, JUN, VHL, HIF-1α, VEGFA, EGFR, AKT1
|
| GOTERM_MF_DIRECT |
Enzyme binding (GO:0019899) |
3.42E-07 |
6 |
TP53, JUN, VHL, HIF-1α, EGFR, AKT1
|
| UP_KEYWORDS |
Ubl conjugation |
3.68E-04 |
6 |
TP53, HSP90AA1, JUN, HIF-1α, EGFR, AKT1
|
| GOTERM_CC_DIRECT |
Nucleoplasm (GO:0005654) |
6.99E-04 |
7 |
TP53, ARNT, HSP90AA1, JUN, VHL, HIF-1α, AKT1
|
| UP_KEYWORDS |
Nucleus |
0.0016 |
8 |
TP53, ARNT, JUN, VHL, HIF-1α, TSGA10, EGFR, AKT1
|
| GOTERM_CC_DIRECT |
Nucleus (GO:0005634) |
0.004 |
8 |
TP53, ARNT, HSP90AA1, JUN, VHL, HIF-1α, EGFR, AKT1
|
| UP_KEYWORDS |
Acetylation |
0.009 |
6 |
TP53, ARNT, HSP90AA1, JUN, HIF-1α, AKT1
|
| GOTERM_CC_DIRECT |
Cytosol (GO:0005829) |
0.013 |
6 |
TP53, HSP90AA1, JUN, VHL, HIF-1α, AKT1
|
| UP_KEYWORDS |
Phosphoprotein |
0.025 |
8 |
TP53, ARNT, HSP90AA1, JUN, HIF-1α, TSGA10, EGFR, AKT1
|
BP: biological process; MF: molecular function; CC: cellular component. GO: Gene ontology.
Annotation of the functional modules
In this part, the modularity feature of the constructed PPI network was applied for identifying the coordinated biological functions or processes of TSGA10 and HIF-1α. In the current work, the PPIs were analyzed by using the molecular docking (Fig. 4), and the network modularity analysis (Fig. 9). In the PPI network, we detected three large modules and two small modules by applying the network module finding algorithm jActiveModule. The interesting point in these functional modules is the simultaneous presence of both HIF-1α and TSGA10 in the extracted modules. These finding proposed an interpretable physical interaction between HIF-1α and TSGA10, and also manifested the key role of this protein pairs into the functional modules. The cellular component (CC), molecular function (MF), and biological process (BP) ontology of the topological large modules help us to understand the interactions between all the proteins into the functional modules. The data about the CC, MF, and BP ontology are provided in Tables S1, S2, and S3, respectively.
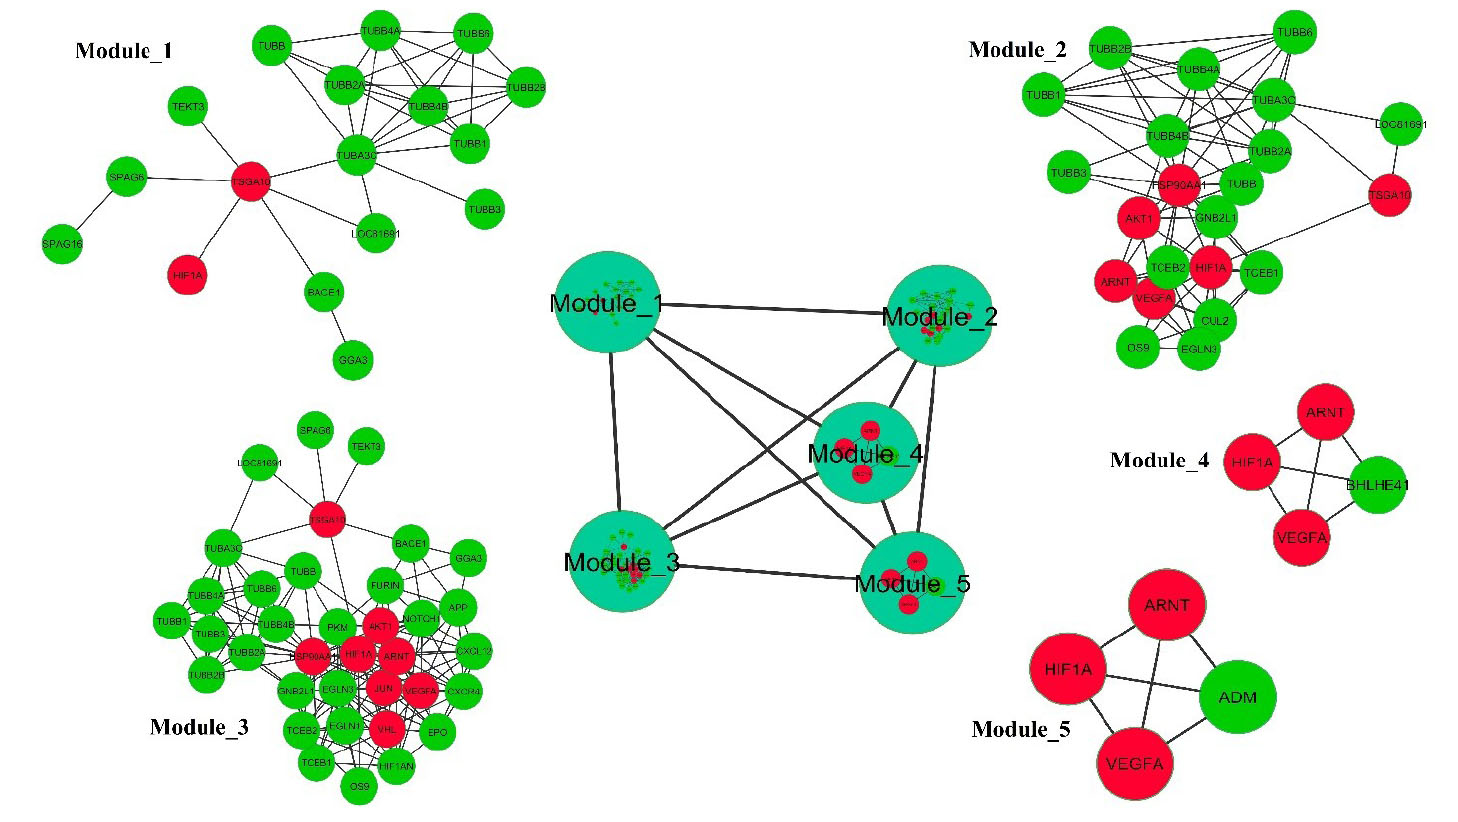
Fig. 9.
Highly interconnected proteins in the PPI network visible as functional modules. The PPI network comprised of three large modules and two small modules (contained four proteins). The large modules represent a significant direct physical interaction between TSGA10 and HIF-1α. The red nodes represent CoHbs.
.
Highly interconnected proteins in the PPI network visible as functional modules. The PPI network comprised of three large modules and two small modules (contained four proteins). The large modules represent a significant direct physical interaction between TSGA10 and HIF-1α. The red nodes represent CoHbs.
Moreover, the nodes of each large module were mapped based on the sequence feature and the use of the DAVID online tool to find the functional categories. The functional category of each node in the modules is listed in Table S4. In this functional enrichment analysis, it was annotated that there is a significant physical interaction between TSGA10 and HIF-1α (Table S4).
Rebuilding the signaling pathways
Based on our findings, there are several crucial paths, including PI3/AKT/mTOR as well as HIF-1α activation (in hypoxia) and inhibition (in normoxia). Based on the docking data, as well as the network and the functional enrichment analyses, we reconstructed the HIF-1α signaling pathway with adding the TSGA10 protein as an inhibitory factor in the formation of HIF-1α/P300/CBP transcription complex. Fig. 10 represents the main cellular events that occur subsequent to hypoxia and HIF-1α activation (e.g., angiogenesis, pH dysregulation, cell migration, and metastasis), normoxia (ubiquitin-mediated HIF-1α complex degradation) and TSGA10 activation (e.g., inhibition the HIF-1α/HIF-1β/P300-CBP complex activation).
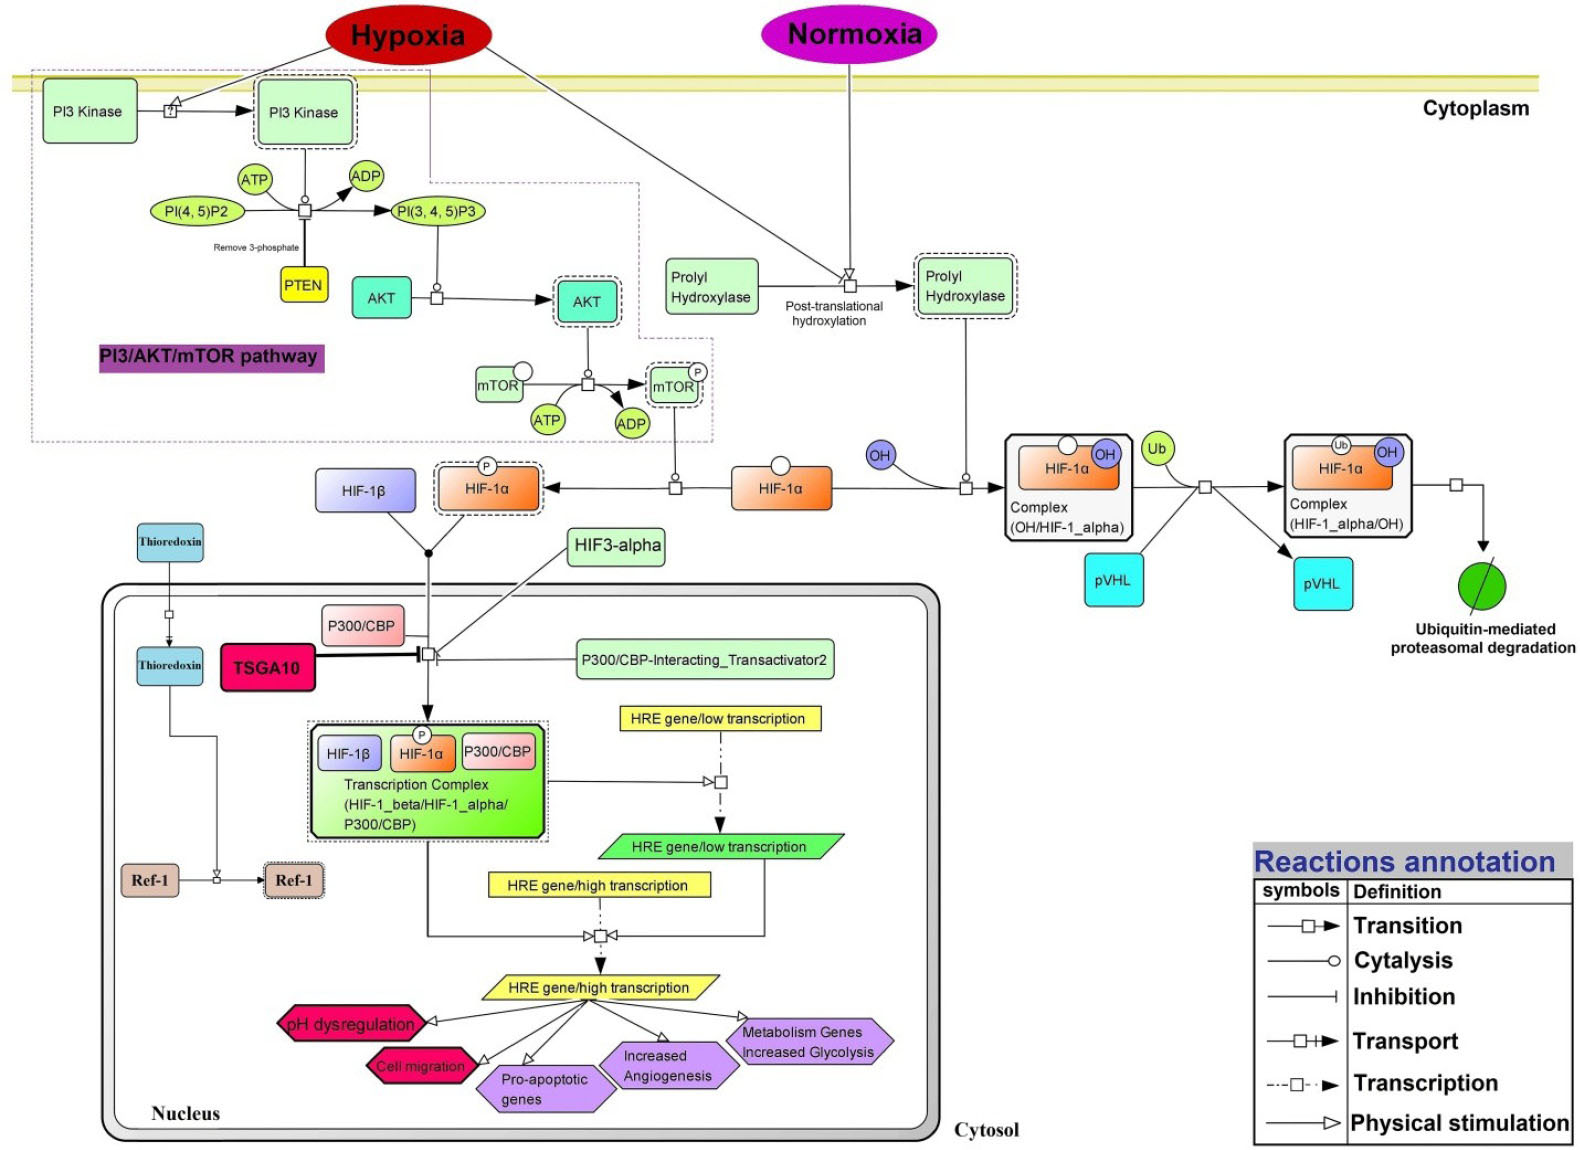
Fig. 10
.
The signaling pathway network of TSGA10 and HIF-1α proteins under the normoxia and hypoxia. In the cell under the normoxia, the prolyl hydroxylation pathway is activated and Von Hippel-Lindau tumor suppressor protein (pVHL) targets subunit α of HIF-1 protein that leads to the ubiquitin (Ub)-mediated HIF-1α degradation. PI3 kinase: Phosphoinositide 3-kinase; PI(4, 5)P2: Phosphatidylinositol 4,5-bisphosphate; PTEN: Phosphatase and tensin homolog; AKT (PKB): Protein kinase B; mTOR: mechanistic target of rapamycin; HIF-3α: hypoxia-inducible factor 3 alpha; CBP: CREB-binding protein; P300: histone acetyltransferase p300; HRE: hypoxia response element. The signaling pathway is reconstructed based on the BioModels and KEGG database and using the CellDesigner v4.4.0 in SBML format.
Discussion
To date, it has been recognized that malignancies, in particular, solid tumors, possess a unique energetic metabolism profile, upon which they are able to regulate their growth and progression, in large part based on the aberrant usage of glucose and oxygen.
45
In the nutrient starvation and oxygen constraints, the cancer cells compete with normal cells for the vital elements. Distribution of produced metabolites will be irregular due to the high number of cells in the tumor mass, while pH dysregulation will occur within the TME. In such circumstances, cancer cells release the primary factors that are involved in the angiogenesis, which in turn, guarantee the survival and uncontrolled proliferation of the cancerous cells. On the other hand, various bio-elements involved in the regulation of intracellular pH (pHi) are activated to modulate the pHi alterations. Phenotypically, such phenomena result in the alkalinization of cancer cells cytoplasm, extracellular acidification, and activation of extracellular matrix-degrading enzymes.
16,46
Here, for the first time, we evaluated the expression of TSGA10 at the level of mRNA and protein under the normoxic and hypoxic conditions in vitro, and then computationally analyzed its interaction with HIF-1α as its main functional partner.
Hypoxia (oxygen deficiency) is one of the main features of solid tumors, in which the HIF-1 as an important transcription factor plays a central role in the energetic pathways of cancer cells and hence the formation of TME. In fact, HIF-1 can bind to the hypoxic response elements (HREs), leading to the expression of the necessary genes to compromise with the hypoxia.
47
During the hypoxia in TME, the ubiquitin-mediated degradation of HIF-1 subunits are inhibited, the HIF-1 activation cascade is triggered, and then HIF-1 transcription complex is linked to the HREs. This transcription initiation complex is formed by the dimerization of HIF-1 subunits (HIF-1α/HIF-1β), and then it is stabilized by binding the CBP/P300/Ref-1 coactivators, leading to the formation of transcription initiation complex. As a result, several different pathophysiological phenotypes such as pH dysregulation, angiogenesis, and cell migration can emerge. These coactivators, along with some other factors, seem to facilitate the accessibility of RNA polymerase for high quality and quantity transcription activity of the cell.
48
The heterodimeric HIF-1 (HIF-1α/HIF-1β) has also three functional subunits, including (i) PER-ARNT-SIM (PAS), (ii) helix-loop-helix (HLH), and (iii) N- and C-terminal transactivation domains (C-TAD, N-TAD),
49,50
of these, the HLH subunit and PAS domains (A and B) contribute to the HIF-1 dimerization, while the transactivation domains are associated with the transcriptional activity of HIF-1, and the C-TAD is involved in the interaction with CBP/P300 molecules under the hypoxia.
19,51
Among different regulatory factors, TSGA10 seems to have a potential regulatory role in the activity of HIF-1α.
52
On the basis of the functional expression of TSGA10 in the adult human testis, some biological functions (e.g., cell division, differentiation, and migration of embryonic tissues) seem to be attributed to its functional expression.
9,53
Further, it was reported that TSGA10 is overexpressed in brain tumors (83%), breast cancers (66%), gastrointestinal tract tumors (58%), as well as skin (66%) and soft tissue tumors (53%).
54
TSGA10 interaction with HIF-1α was shown to prevent the nuclear localization and transcriptional activity of the HIF-1α.
22,55
Because of the important role of TSGA10 in the cell proliferation, it is supposed to be a key player in the survival and growth of cancer cells, which can also serve as a tumor marker in solid tumors such as breast cancer.
8
Hagele and co-workers founded that there exists a prominent subcellular localization pattern for TSGA10 and HIF-1α in the tail of spermatozoa, in which the TSGA10 seems to prevent the nuclear localization and transcription activity of HIF-1α. They indicated that the N-terminal domain of HIF-1α can physically interact with the C-terminal domain of TSGA10.
22
However, the impact of the interaction of HIF-1α with TSGA10 in progression or suppression of cancer seems to be unclear. Our findings revealed that the MDA-MB-231 and MCF-7 cells treated with low glucose under hypoxic condition could improve their proliferation and motility, indicating hypoxia as a key player in terms of the breast cancer metastasis (Figs. 1 and 2). Further, TSGA10 seems to function as an inhibitor of metastasis and migration in the breast cancer MDA-MB-231 cells (Fig. 3). In the current study, we also used molecular docking approaches to analyze the interaction between TSGA10 and HIF-1α. The docking energy (-698.69 kcal/mol), an average of hydrogen bonds (2.91 Å), and the number of hydrophobic bonds showed that there is a high-affinity interaction between these proteins (Figs. 3 and 4). Our result is in agreement with that of the previously published work conducted by Mansouri et al.
52
They showed that the C-TAD domain of HIF-1α has a strong binding affinity to the C-terminal domain of TSGA10. They also reported the inhibitory role of TSGA10 on the HIF-1α dimerization, at which it leads to the inactivation of HIF-1α through the inhibition of CBP/P300 co-activators. Altogether, TSGA10 has an inhibitory effect on the cell growth, angiogenesis, migration, and metastasis, for which the HIF-1α seems to function as a provocative factor.
52
While the TSGA10 is mainly localized in the cell nucleus, the HIF-1α seems to be abundantly localized in the nucleus and cytoplasm of the cells (Fig. 6), hence their functions differ dramatically. We reconstructed these biological paths using the CellDesigner software.
Our results in 24 hours showed that the expression of TSGA10 gene increases when the migration of cells is low. In other words, at the early stages of cancer progression, the TSGA10 might impose a suppressive impact. However, with the increase of intracellular metabolites and disruption of pH homeostasis, TSGA10 cannot play a controlling role anymore and perhaps after this stage, it either acts oppositely provoking the progression of cancer cells, or its functional expression is stopped. Due to the lack of data and also the paradoxical observations in previous reports, further studies need to be accomplished to address the actual impacts of TSGA10 in the progression of cancer. Unlike some previously reported studies,
11,12
the expression level of TSGA10 in most of the human cancers is increased in comparison with the normal cells (https://cancergenome.nih.gov/). As we know, the level of mRNA cannot be considered as a measure of the protein levels. Therefore, to clarify the genetic function and mechanisms of the disease, a combination of genomics and proteomics experiments is expected to provide a better understanding. Based on our findings, an increased expression of TSGA10 appears to lead to a decrease in the migration and metastasis of cancer cells. In the high concentrations of glucose, in which solid tumors have good nutrients and grow extremely well, the expression of TSGA10 is speculated to possibly prevent the aggressive phenotypes. Under such conditions, we also applied hypoxia to mimic the TME and found an increased expression of the TSGA10 gene. Furthermore, the PPI network analysis of TSGA10 and HIF-1α resulted in 57 nodes and 387 edges (Tables 2 and 3). Then, we clustered the network into the functional and topological sub-network modules (Figs. 7, 8, and 9). In the systems-based approaches, we aimed to annotate the topological modules at the network level and by using the gene ontology enrichment analysis. In several studies, it has been shown that the modulation of PPI networks together with detection of highly connected hubs and interaction modules can result in possible detection/verification of less-known/unknown molecular functions, biological pathways, cellular localization, as well as cellular markers and antigens.
56,57
Such findings may result in the detection of biomarkers and candidate antigens for the future works such as drug and vaccine designing,
58
as well as mechanisms underlying diseases initiation and progression (Fig. 9). Moreover, the highly connected nodes have the main role in the organization of the bio-molecular networks.
59
This type of analysis is on the basis of “guilt-by-association” concept. Taken all together, the network modulation resulted in the detection of three major functional modules (Fig. 9), and TSGA10 and HIF-1α proteins located in the same modules (Fig. 10). As reported recently, the proteins that interact with each other tend likely to be co-localized in the adjacent cellular compartments.
60
Therefore, we used the GO-based annotation of these modules, and we observed these proteins represented as an interacting partner.
Conclusion
In our integrative analysis (wet- and dry-lab assays), we showed the expression behavior of TSGA10 in hypoxia and then constructed a PPI network of TSGA10 and HIF-1α and detected its functional modules. The in vitro and in silico analyses clearly represented a possible functional association between TSGA10 and HIF-1α proteins. We envision that the hub nodes of these modules (HIF-1α, ARNT, VEGFA, AKT1, TSGA10, HSP90AA1, VHL, and JUN) can be served as candidate biomarkers for the chemotherapy, vaccine, or immunotherapy interventions.
Acknowledgment
The authors wish to thank the members of cell culture facility at the Research Center for Pharmaceutical Nanotechnology (RCPN), Biomedicine Institute, Tabriz University of Medical Sciences for assisting us in conducting this study.
Funding sources
This study was funded (grant No: RCPN-94012) by the RCPN at Biomedicine Institute, Tabriz University of Medical Sciences.
Ethical statement
None to be declared.
Competing interests
Authors declare no conflict of interests.
Authors’ contribution
MRA, JB, and YO conceptualized and designed the project. MRA, ME, and MMP performed the experiments. MJN and MRM provided scientific inputs. MRA, JB, ME, MMP, and YO interpreted the data and wrote the article. JB and YO finalized the article.
Supplementary Materials
Supplementary file 1 contains Figs. S1-S3 and Tables S1-S4.
(pdf)
Research Highlights
What is the current knowledge?
simple
-
√ Testis-specific gene antigen 10 (TSGA10) is a less-known gene involved in the vague biological paths of different cancers.
What is new here?
simple
-
√ The increased expression of TSGA10 was found to be significantly associated with the reduced metastasis in the MDA-MB-231cells.
-
√ There is an inverse relationship between the TSGA10 mRNA level and the cellular migration in the MDA-MB-231cells.
-
√ The C-terminal domain of TSGA10 can interact with HIF-1α with high affinity, which might associate with some key interation nodes (i.e., HIF-1α, VEGFA, HSP90AA1, AKT1, ARNT, TP53, TSGA10, VHL, JUN, and EGFR).
-
√ TSGA10 functional expression alters under the hyper-/hypo-glycemia and hypoxia.
References
- Seifi-Alan M, Shamsi R, Ghafouri-Fard S, Mirfakhraie R, Zare-Abdollahi D, Movafagh A. Expression analysis of two cancer-testis genes, FBXO39 and TDRD4, in breast cancer tissues and cell lines. Asian Pac J Cancer Prev 2014; 14:6625-9. doi: 10.7314/apjcp.2013.14.11.6625 [Crossref] [ Google Scholar]
- Azam R, Ghafouri-Fard S, Tabrizi M, Modarressi MH, Ebrahimzadeh-Vesal R, Daneshvar M. Lactobacillus acidophilus and Lactobacillus crispatus culture supernatants downregulate expression of cancer-testis genes in the MDA-MB-231 cell line. Asian Pac J Cancer Prev 2014; 15:4255-9. doi: 10.7314/apjcp.2014.15.10.4255 [Crossref] [ Google Scholar]
- Chen YT, Gure AO, Tsang S, Stockert E, Jager E, Knuth A. Identification of multiple cancer/testis antigens by allogeneic antibody screening of a melanoma cell line library. Proc Natl Acad Sci U S A 1998; 95:6919-23. doi: 10.1073/pnas.95.12.6919 [Crossref] [ Google Scholar]
- Atanackovic D, Blum I, Cao Y, Wenzel S, Bartels K, Faltz C. Expression of cancer-testis antigens as possible targets for antigen-specific immunotherapy in head and neck squamous cell carcinoma. Cancer Biol Ther 2006; 5:1218-25. doi: 10.4161/cbt.5.9.3174 [Crossref] [ Google Scholar]
- Caballero OL, Chen YT. Cancer/testis (CT) antigens: potential targets for immunotherapy. Cancer Sci 2009; 100:2014-21. doi: 10.1111/j.1349-7006.2009.01303.x [Crossref] [ Google Scholar]
- Tanaka R, Ono T, Sato S, Nakada T, Koizumi F, Hasegawa K. Over-expression of the testis-specific gene TSGA10 in cancers and its immunogenicity. Microbiol Immunol 2004; 48:339-45. doi: 10.1111/j.1348-0421.2004.tb03515.x [Crossref] [ Google Scholar]
- Reimand K, Perheentupa J, Link M, Krohn K, Peterson P, Uibo R. Testis-expressed protein TSGA10 an auto-antigen in autoimmune polyendocrine syndrome type I. Int Immunol 2008; 20:39-44. doi: 10.1093/intimm/dxm118 [Crossref] [ Google Scholar]
- Dianatpour M, Mehdipour P, Nayernia K, Mobasheri MB, Ghafouri-Fard S, Savad S. Expression of Testis Specific Genes TSGA10, TEX101 and ODF3 in Breast Cancer. Iran Red Crescent Med J 2012; 14:722-6. doi: 10.5812/ircmj.3611 [Crossref] [ Google Scholar]
- Modarressi MH, Cameron J, Taylor KE, Wolfe J. Identification and characterisation of a novel gene, TSGA10, expressed in testis. Gene 2001; 262:249-55. doi: 10.1016/s0378-1119(00)00519-9 [Crossref] [ Google Scholar]
- Miryounesi M, Nayernia K, Mobasheri MB, Dianatpour M, Oko R, Savad S. Evaluation of in vitro spermatogenesis system effectiveness to study genes behavior: monitoring the expression of the testis specific 10 (TSGA10) gene as a model. Arch Iran Med 2014; 17:692-7. [ Google Scholar]
- Yuan X, He J, Sun F, Gu J. Effects and interactions of MiR-577 and TSGA10 in regulating esophageal squamous cell carcinoma. Int J Clin Exp Pathol 2013; 6:2651-67. [ Google Scholar]
- Jakhesara SJ, Koringa PG, Joshi CG. Identification of novel exons and transcripts by comprehensive RNA-Seq of horn cancer transcriptome in Bos indicus. J Biotechnol 2013; 165:37-44. doi: 10.1016/j.jbiotec.2013.02.015 [Crossref] [ Google Scholar]
- Hui L, Chen Y. Tumor microenvironment: Sanctuary of the devil. Cancer Lett 2015; 368:7-13. doi: 10.1016/j.canlet.2015.07.039 [Crossref] [ Google Scholar]
- Ansell SM, Vonderheide RH. Cellular composition of the tumor microenvironment. Am Soc Clin Oncol Educ Book 2013. doi: 10.1200/EdBook_AM.2013.33.e91 [Crossref]
- Barar J, Omidi Y. Dysregulated pH in Tumor Microenvironment Checkmates Cancer Therapy. Bioimpacts 2013; 3:149-62. doi: 10.5681/bi.2013.036 [Crossref] [ Google Scholar]
- Asgharzadeh MR, Barar J, Pourseif MM, Eskandani M, Jafari Niya M, Mashayekhi MR. Molecular machineries of pH dysregulation in tumor microenvironment: potential targets for cancer therapy. Bioimpacts 2017; 7:115-33. doi: 10.15171/bi.2017.15 [Crossref] [ Google Scholar]
- Busco G, Cardone RA, Greco MR, Bellizzi A, Colella M, Antelmi E. NHE1 promotes invadopodial ECM proteolysis through acidification of the peri-invadopodial space. Faseb j 2010; 24:3903-15. doi: 10.1096/fj.09-149518 [Crossref] [ Google Scholar]
- Balamurugan K. HIF-1 at the crossroads of hypoxia, inflammation, and cancer. Int J Cancer 2016; 138:1058-66. doi: 10.1002/ijc.29519 [Crossref] [ Google Scholar]
- Eskandani M, Vandghanooni S, Barar J, Nazemiyeh H, Omidi Y. Cell physiology regulation by hypoxia inducible factor-1: Targeting oxygen-related nanomachineries of hypoxic cells. Int J Biol Macromol 2017; 99:46-62. doi: 10.1016/j.ijbiomac.2016.10.113 [Crossref] [ Google Scholar]
- Semenza GL. Targeting HIF-1 for cancer therapy. Nat Rev Cancer 2003; 3:721-32. doi: 10.1038/nrc1187 [Crossref] [ Google Scholar]
- Corso S, Migliore C, Ghiso E, De Rosa G, Comoglio PM, Giordano S. Silencing the MET oncogene leads to regression of experimental tumors and metastases. Oncogene 2008; 27:684-93. doi: 10.1038/sj.onc.1210697 [Crossref] [ Google Scholar]
- Hagele S, Behnam B, Borter E, Wolfe J, Paasch U, Lukashev D. TSGA10 prevents nuclear localization of the hypoxia-inducible factor (HIF)-1alpha. FEBS Lett 2006; 580:3731-8. doi: 10.1016/j.febslet.2006.05.058 [Crossref] [ Google Scholar]
- Fischer HP. Mathematical modeling of complex biological systems: from parts lists to understanding systems behavior. Alcohol Res Health 2008; 31:49-59. doi: 10.1007/978-3-8349-9870-5_4 [Crossref] [ Google Scholar]
- Ajami NE, Gupta S, Maurya MR, Nguyen P, Li JY, Shyy JY. Systems biology analysis of longitudinal functional response of endothelial cells to shear stress. Proc Natl Acad Sci U S A 2017; 114:10990-5. doi: 10.1073/pnas.1707517114 [Crossref] [ Google Scholar]
- Peng W, Wang J, Cai J, Chen L, Li M, Wu FX. Improving protein function prediction using domain and protein complexes in PPI networks. BMC Syst Biol 2014; 8:35. doi: 10.1186/1752-0509-8-35 [Crossref] [ Google Scholar]
- De Las Rivas J, Fontanillo C. Protein-protein interactions essentials: key concepts to building and analyzing interactome networks. PLoS Comput Biol 2010; 6:e1000807. doi: 10.1371/journal.pcbi.1000807 [Crossref] [ Google Scholar]
- Wu D, Yotnda P. Induction and testing of hypoxia in cell culture. J Vis Exp 2011; 54:2899. doi: 10.3791/2899 [Crossref] [ Google Scholar]
- Webb B, Sali A. Protein structure modeling with MODELLER. Methods Mol Biol 2014; 1137:1-15. doi: 10.1007/978-1-4939-0366-5_1 [Crossref] [ Google Scholar]
- Wiederstein M, Sippl MJ. ProSA-web: interactive web service for the recognition of errors in three-dimensional structures of proteins. Nucleic Acids Res 2007; 35:W407-10. doi: 10.1093/nar/gkm290 [Crossref] [ Google Scholar]
- Luthy R, Bowie JU, Eisenberg D. Assessment of protein models with three-dimensional profiles. Nature 1992; 356:83-5. doi: 10.1038/356083a0 [Crossref] [ Google Scholar]
- Colovos C, Yeates TO. Verification of protein structures: patterns of nonbonded atomic interactions. Protein Sci 1993; 2:1511-9. doi: 10.1002/pro.5560020916 [Crossref] [ Google Scholar]
- Lovell SC, Davis IW, Arendall WB, de Bakker PI, Word JM, Prisant MG. Structure validation by Calpha geometry: phi,psi and Cbeta deviation. Proteins 2003; 50:437-50. doi: 10.1002/prot.10286 [Crossref] [ Google Scholar]
- Johansson MU, Zoete V, Michielin O, Guex N. Defining and searching for structural motifs using DeepView/Swiss-PdbViewer. BMC Bioinformatics 2012; 13:173. doi: 10.1186/1471-2105-13-173 [Crossref] [ Google Scholar]
- Pettersen EF, Goddard TD, Huang CC, Couch GS, Greenblatt DM, Meng EC. UCSF Chimera--a visualization system for exploratory research and analysis. J Comput Chem 2004; 25:1605-12. doi: 10.1002/jcc.20084 [Crossref] [ Google Scholar]
- Lang PT, Brozell SR, Mukherjee S, Pettersen EF, Meng EC, Thomas V. DOCK 6: combining techniques to model RNA-small molecule complexes. RNA 2009; 15:1219-30. doi: 10.1261/rna.1563609 [Crossref] [ Google Scholar]
- Pourseif MM, Moghaddam G, Naghili B, Saeedi N, Parvizpour S, Nematollahi A. A novel in silico minigene vaccine based on CD4(+) T-helper and B-cell epitopes of EG95 isolates for vaccination against cystic echinococcosis. Comput Biol Chem 2017. doi: 10.1016/j.compbiolchem.2017.11.008 [Crossref]
- Laskowski RA, Swindells MB. LigPlot+: multiple ligand-protein interaction diagrams for drug discovery. J Chem Inf Model 2011; 51:2778-86. doi: 10.1021/ci200227u [Crossref] [ Google Scholar]
- Huang DW, Sherman BT, Tan Q, Collins JR, Alvord WG, Roayaei J. The DAVID Gene Functional Classification Tool: a novel biological module-centric algorithm to functionally analyze large gene lists. Genome Biol 2007; 8:R183. doi: 10.1186/gb-2007-8-9-r183 [Crossref] [ Google Scholar]
- Szklarczyk D, Franceschini A, Wyder S, Forslund K, Heller D, Huerta-Cepas J. STRING v10: protein-protein interaction networks, integrated over the tree of life. Nucleic Acids Res 2015; 43:D447-52. doi: 10.1093/nar/gku1003 [Crossref] [ Google Scholar]
- Shannon P, Markiel A, Ozier O, Baliga NS, Wang JT, Ramage D. Cytoscape: a software environment for integrated models of biomolecular interaction networks. Genome Res 2003; 13:2498-504. doi: 10.1101/gr.1239303 [Crossref] [ Google Scholar]
- Chin CH, Chen SH, Wu HH, Ho CW, Ko MT, Lin CY. cytoHubba: identifying hub objects and sub-networks from complex interactome. BMC Syst Biol 2014; 8 Suppl 4:S11. doi: 10.1186/1752-0509-8-S4-S11 [Crossref] [ Google Scholar]
- Bader GD, Hogue CW. An automated method for finding molecular complexes in large protein interaction networks. BMC Bioinformatics 2003; 4:2. doi: 10.1186/1471-2105-4-2 [Crossref] [ Google Scholar]
- Van Hemert JL, Dickerson JA. PathwayAccess: CellDesigner plugins for pathway databases. Bioinformatics 2010; 26:2345-6. doi: 10.1093/bioinformatics/btq423 [Crossref] [ Google Scholar]
- Pourseif MM, Moghaddam G, Daghighkia H, Nematollahi A, Omidi Y. A novel B- and helper T-cell epitopes-based prophylactic vaccine against Echinococcus granulosus. BioImpacts 2018; 8:39-52. doi: 10.15171/bi.2018.06 [Crossref] [ Google Scholar]
- Oklu R, Walker TG, Wicky S, Hesketh R. Angiogenesis and current antiangiogenic strategies for the treatment of cancer. J Vasc Interv Radiol 2010; 21:1791-805; quiz 806. doi: 10.1016/j.jvir.2010.08.009 [Crossref] [ Google Scholar]
- Khosravi Shahi P, Fernandez Pineda I. Tumoral angiogenesis: review of the literature. Cancer Invest 2008; 26:104-8. doi: 10.1080/07357900701662509 [Crossref] [ Google Scholar]
- Rey S, Semenza GL. Hypoxia-inducible factor-1-dependent mechanisms of vascularization and vascular remodelling. Cardiovasc Res 2010; 86:236-42. doi: 10.1093/cvr/cvq045 [Crossref] [ Google Scholar]
- Lee K, Zhang H, Qian DZ, Rey S, Liu JO, Semenza GL. Acriflavine inhibits HIF-1 dimerization, tumor growth, and vascularization. Proc Natl Acad Sci U S A 2009; 106:17910-5. doi: 10.1073/pnas.0909353106 [Crossref] [ Google Scholar]
- Hu CJ, Sataur A, Wang L, Chen H, Simon MC. The N-terminal transactivation domain confers target gene specificity of hypoxia-inducible factors HIF-1alpha and HIF-2alpha. Mol Biol Cell 2007; 18:4528-42. doi: 10.1091/mbc.E06-05-0419 [Crossref] [ Google Scholar]
- Wang GL, Jiang BH, Rue EA, Semenza GL. Hypoxia-inducible factor 1 is a basic-helix-loop-helix-PAS heterodimer regulated by cellular O2 tension. Proc Natl Acad Sci U S A 1995; 92:5510-4. [ Google Scholar]
- Semenza GL. HIF-1: upstream and downstream of cancer metabolism. Curr Opin Genet Dev 2010; 20:51-6. doi: 10.1016/j.gde.2009.10.009 [Crossref] [ Google Scholar]
- Mansouri K, Mostafie A, Rezazadeh D, Shahlaei M, Modarressi MH. New function of TSGA10 gene in angiogenesis and tumor metastasis: a response to a challengeable paradox. Hum Mol Genet 2016; 25:233-44. doi: 10.1093/hmg/ddv461 [Crossref] [ Google Scholar]
- Modarressi MH, Behnam B, Cheng M, Taylor KE, Wolfe J, van der Hoorn FA. TSGA10 encodes a 65-kilodalton protein that is processed to the 27-kilodalton fibrous sheath protein. Biol Reprod 2004; 70:608-15. doi: 10.1095/biolreprod.103.021170 [Crossref] [ Google Scholar]
- Mobasheri MB, Jahanzad I, Mohagheghi MA, Aarabi M, Farzan S, Modarressi MH. Expression of two testis-specific genes, TSGA10 and SYCP3, in different cancers regarding to their pathological features. Cancer Detect Prev 2007; 31:296-302. doi: 10.1016/j.cdp.2007.05.002 [Crossref] [ Google Scholar]
- Behnam B, Chahlavi A, Pattisapu J, Wolfe J. TSGA10 is Specifically Expressed in Astrocyte and Over-expressed in Brain Tumors. Avicenna J Med Biotechnol 2009; 1:161-6. [ Google Scholar]
- Murakami Y, Tripathi LP, Prathipati P, Mizuguchi K. Network analysis and in silico prediction of protein-protein interactions with applications in drug discovery. Curr Opin Struct Biol 2017; 44:134-42. doi: 10.1016/j.sbi.2017.02.005 [Crossref] [ Google Scholar]
- Thangudu RR, Bryant SH, Panchenko AR, Madej T. Modulating protein-protein interactions with small molecules: the importance of binding hotspots. J Mol Biol 2012; 415:443-53. doi: 10.1016/j.jmb.2011.12.026 [Crossref] [ Google Scholar]
- Pourseif MM, Moghaddam G, Saeedi N, Barzegari A, Dehghani J, Omidi Y. Current status and future prospective of vaccine development against Echinococcus granulosus. Biologicals 2018; 51:1-11. doi: 10.1016/j.biologicals.2017.10.003 [Crossref] [ Google Scholar]
- He X, Zhang J. Why do hubs tend to be essential in protein networks?. PLoS Genet 2006; 2:e88. doi: 10.1371/journal.pgen.0020088 [Crossref] [ Google Scholar]
- Jiang JQ, Wu M. Predicting multiplex subcellular localization of proteins using protein-protein interaction network: a comparative study. BMC Bioinformatics 2012; 13 Suppl 10:S20. doi: 10.1186/1471-2105-13-S10-S20 [Crossref] [ Google Scholar]