Bioimpacts. 11(1):33-43.
doi: 10.34172/bi.2021.05
Original Research
Global metabolomics profiling of colorectal cancer in Malaysian patients
Nurul Azmir Amir Hashim 1, 2  , Sharaniza Ab-Rahim 1, Wan Zurinah Wan Ngah 3, Sheila Nathan 4, Nurul Syakima Ab Mutalib 5, Ismail Sagap 6, A. Rahman A. Jamal 5, Musalmah Mazlan 1, *
Author information:
1Department of Biochemistry and Molecular Medicine, Faculty of Medicine, Universiti Teknologi MARA, Cawangan Selangor, Kampus Sungai Buloh, 47000 Sungai Buloh, Selangor, Malaysia
2Institute of Medical and Molecular Biotechnology, Faculty of Medicine, Universiti Teknologi MARA, Cawangan Selangor, Kampus Sungai Buloh, 47000 Sungai Buloh, Selangor, Malaysia
3Universiti Kebangsaaan Malaysia Medical Centre, Jalan Yaacob Latif, Bandar Tun Razak, 56000 Batu 9 Cheras, Wilayah Persekututan Kuala Lumpur, Malaysia
4Faculty of Science and Technology, Universiti Kebangsaan Malaysia, 43600 UKM Bangi, Selangor, Malaysia
5UKM Medical Molecular Biology Institute (UMBI), UKM Medical Centre, Universiti Kebangsaan Malaysia, Jalan Yaacob Latiff, Bandar Tun Razak, 56000 Cheras, Kuala Lumpur, Malaysia
6Department of Surgery, Faculty of Medicine, Universiti Kebangsaan Malaysia, Jalan Yaacob Latiff, Bandar Tun Razak, 56000 Cheras, Kuala Lumpur, Malaysia
Abstract
Introduction:
The serum metabolomics approach has been used to identify metabolite biomarkers that can diagnose colorectal cancer (CRC) accurately and specifically. However, the biomarkers identified differ between studies suggesting that more studies need to be performed to understand the influence of genetic and environmental factors. Therefore, this study aimed to identify biomarkers and affected metabolic pathways in Malaysian CRC patients.
Methods:
Serum from 50 healthy controls and 50 CRC patients were collected at UKM Medical Centre. The samples were deproteinized with acetonitrile and untargeted metabolomics profile determined using liquid chromatography-quadrupole time-of-flight mass spectrometry (LC-QTOFMS, Agilent USA). The data were analysed using Mass Profiler Professional (Agilent, USA) software. The panel of biomarkers determined were then used to identify CRC from a new set of 20 matched samples.
Results:
Eleven differential metabolites were identified whose levels were significantly different between CRC patients compared to normal controls. Based on the analysis of the area under the curve, 7 of these metabolites showed high sensitivity and specificity as biomarkers. The use of the 11 metabolites on a new set of samples was able to differentiate CRC from normal samples with 80% accuracy. These metabolites were hypoxanthine, acetylcarnitine, xanthine, uric acid, tyrosine, methionine, lysoPC, lysoPE, citric acid, 5-oxoproline, and pipercolic acid. The data also showed that the most perturbed pathways in CRC were purine, catecholamine, and amino acid metabolisms.
Conclusion:
Serum metabolomics profiling can be used to identify distinguishing biomarkers for CRC as well as to further our knowledge of its pathophysiological mechanisms.
Keywords: Colorectal cancer, Metabolomics, Serum, Biomarkers, Pathways
Copyright and License Information
© 2021 The Author(s)
This work is published by BioImpacts as an open access article distributed under the terms of the Creative Commons Attribution License (
http://creativecommons.org/licenses/by-nc/4.0/
). Non-commercial uses of the work are permitted, provided the original work is properly cited.
Introduction
The prevalence of colorectal cancer (CRC) has increased globally and is currently the second most common cancer in the world (GLOBOCAN, 2018) accounting for 9.2% of all cancer deaths.
1
The gold standard for CRC detection is colonoscopy and sigmoidoscopy, which are invasive and expensive techniques.
2
However, Rutter et al noticed that some patients developed CRC despite earlier negative colonoscopy findings.
3
Therefore, accurate and less invasive biomarkers are needed for CRC detection.
Metabolomics is the study of small molecules known as metabolites. Metabolites are affected by genetic and biological variations. In addition, environment and diet also influence the metabolomics profile. Thus metabolomics is best represents the molecular phenotype.
4
Many researchers have turned to metabolomics studies in the search for new non-invasive biomarkers that can differentiate CRC from normal healthy persons. A number of studies have assessed the potential of serum metabolomics to serve as biomarkers for CRC. However, a comprehensive review of the 9 serum global metabolomics of CRC studies revealed that there were differences in the identified differential metabolites in CRC versus healthy individuals reported.
5
The differences among the different studies may be due to the large heterogeneity in study populations and differences in sample collection, CRC stage, analytical platforms as well as statistical methods used. This is not surprising as metabolomics profiles are not only dependent on biological factors that determine the susceptibility of an individual but are influenced by dietary and environmental factors as well. Therefore, in this study, we performed global metabolomics on Malaysian CRC patients to determine biomarkers and the altered metabolic pathways. The data will provide interesting comparisons to data from other populations as Malaysia is geographically and culturally at a crossroad between Indian sub-continent and the Far-East. Its culture embeds not only Southeast Asian values but is also influenced by Indian and Chinese cultures. Furthermore, the data on Malays and Malaysian Chinese will add to the growing knowledge on the influence of race and culture on metabolomics profiles.
Materials and Methods
Solvents and reagents
Analytical grade acetonitrile (ACN), (Fisher Scientific, Loughborough, Leicestershire, UK), formic acid and ammonium phosphate (Sigma-Aldrich, St. Louis, MO, USA, respectively) and deionized water (Milli-Q) (Millipore, Billerica, MA, USA) were used for LCMS/QTOF analysis.
Sample collection
The Research Ethics Committees of Universiti Kebangsaan Malaysia (UKM) and Universiti Teknologi MARA (UiTM) approved this study. All participants gave their written informed consent for the study. A total of 140 serum samples of CRC patients and healthy subjects were included in this study. One hundred samples (50 matched CRC with normal healthy subjects) were used to determine the differential metabolites and potential biomarkers and as well as the affected metabolic pathways in CRC (Table 1). The panel of biomarkers was then verified using a new set of samples comprising of 20 matched CRC and control samples (Table 2).
Table 1.
Demographic CRC patients and normal controls
|
|
CRC
|
Normal
|
| Ethnicity |
|
|
| Malay |
35 |
35 |
| Chinese |
15 |
15 |
| Gender |
|
|
| Male |
29 |
30 |
| Female |
21 |
20 |
| Stage (Duke) |
|
|
| A |
5 |
|
| B |
18 |
|
| C |
25 |
|
| D |
2 |
|
| Age (y) |
|
|
| Mean ± SD |
64±9 |
63±6 |
| Diagnosis* |
|
|
| Adenocarcinoma with mucinous component |
4 |
|
| Moderately differentiated adenocarcinoma |
17 |
|
| Well-differentiated adenocarcinoma |
27 |
|
| Minimal residual adenocarcinoma |
1 |
|
| Poorly differentiated adenocarcinoma |
1 |
|
Table 2.
Demographic data of validation sample sets of CRC patients and normal controls
|
|
CRC |
Normal |
| Ethnicity |
|
|
| Malay |
11 |
10 |
| Chinese |
9 |
10 |
| Gender |
|
|
| Male |
12 |
11 |
| Female |
8 |
9 |
| Stage (Duke) |
|
|
| A |
3 |
3 |
| B |
6 |
6 |
| C |
6 |
6 |
| D |
5 |
5 |
| Age (y) |
|
|
| Mean ± SD |
62±7 |
61±6 |
Blood samples were collected from the UKM Medical Centre, Kuala Lumpur, Malaysia, after consent. Blood was taken in the morning after an overnight fast and immediately centrifuged at 4500 rpm for 10 minutes at 4ºC to separate the serum. The serum was aliquoted and stored at -80ºC.
Sample preparations
Serum samples were deproteinized with acetonitrile (ACN) before injection into the LCMS/QTOF. Briefly, 40 µL serum was mixed with 40 µL cold distilled water, pH 10, and 80 µL cold ACN. After centrifugation at 4500 rpm for 10 minutes at 4°C, the supernatant was transferred to a new tube. 80 µL cold ACN was then added to the supernatant, mixed, and centrifuged again at 4500 rpm for 10 minutes at 4°C. The resultant supernatant was transferred to a new tube and dried in a concentrator for 1 hour 30 minutes. The dried samples were kept at -80oC until further analysis.
Quality control (QC) samples were prepared from pooled serum samples, processed similarly as the test samples, and were injected into the LCMS at the beginning of every 4 test samples. The inclusion of QC in the analysis served to provide an indicator of the stability and performance of the instrument as well as the reproducibility of the results obtained.
6
Global metabolomics analysis
Samples were analyzed using Agilent 6520 Q-TOF mass spectrometer with an electrospray ionization source (Agilent Technologies, CA, USA). For the chromatographic separation, Column Zorbax Eclipse Plus C18 (1.8 μm particle size, 2.1 × 100 mm column dimension) was used. The column was kept at 40°C during the run. A C18 column is a reverse-phase column, which contained carbon chains bonded to the silica particles inside the column. Hydrophobic and non-polar molecules will interact with the column as it passes through. The least hydrophobic component would elute first followed by the more hydrophobic molecule. The analysis was done both in the positive and negative mode using the electrospray ionization technique. For chromatographic separation in the positive mode, 0.1% formic acid in water and 0.1% formic acid in ACN were used to facilitate protonation of analytes, while for negative mode chromatographic separation, 0.1% ammonium formate was used instead of formic acid to facilitate deprotonation of analytes. Two microliters of the sample was injected into the LCMS which was run at a flow rate of 0.25 mL/min. A linear gradient was developed using 5% to 95% formic acid in ACN for 36 minutes. The total run time for each analysis was 48 minutes. The settings for the instrument were as follows: electrospray ionization source: V Cap 4000 V, skimmer 65 V and fragment 125 V; nebulizer: 45 PSIG [pounds per square in gauge] with nitrogen drying gas at a flow rate of 12 L/min; drying gas temperature: 350°C; a range of mass: m/z 50–1000 with at a rate of 2.5 spectra/s. The instrument was auto-calibrated before analysis of each batch of samples and reference mass correction was enabled throughout the analysis. The accuracy of the mass spectrometer to detect compounds was set at ±2 ppm. Reference standards (Agilent Technologies, CA, USA) of mass 121.050873 and 922.009798 were used to correct for low and high masses respectively.
Data treatment
Agilent Mass Hunter Qualitative Analysis software (Agilent Technologies, CA, USA) was used to process the data collected by Agilent Mass Hunter Workstation Data Acquisition software. Mass Hunter workstation software made use of the molecular feature extractor algorithm for data mining which was set at the mass of 15 ppm and retention time alignment of 0.2 minutes. The absolute height parameter of abundance was set at 200 to remove noise. Data was then processed using ‘Find by Formula’ algorithm parameters with charge states limited to 1 and absolute height >3000 counts. For positive ionization mode, the adducts used were H+ and Na+, while H- was used for negative ionization mode. The data was then converted from (.d) files) to (.cef) file using DA Reprocessor (Agilent Technologies, CA) software and transferred into Mass Profiler Professional (MPP) (Agilent Technologies, CA) software for analysis. The data were subjected to normalization, filtration, and recursion analysis.
Statistical analysis
To make sure the data were comparable, all the data were normalized at 75% percentile to remove redundant data. The first filter was frequency analysis, which was set to 50% to ensure 50% of compounds present in at least one studied group. Filtering by t test independent was done next to select compounds that were significantly different between CRC and normal samples. Next, the P value cut-off of 0.05 was used in Benjamini-Hochberg false discovery rate multiple testing. Fold change cut-off was set to 2 for listed compounds to identify differential metabolites between CRC and normal.
7-9
To confirm the presence of each entity in the samples, data was re-examined by recursion analysis. In the recursion analysis, extracted ion chromatograms (EICs) were re-extracted. Peaks from these EICs were inspected to remove false positives and false negatives. The identified entities from recursion analysis were subjected again for normalization, t test, filter, and fold change analyses. All the differential analysis and statistical analysis were done using MPP software.
Identification of metabolites
Entities obtained earlier were identified using an ID browser from Mass Profiler Professional software. This software used a database from Metlin. A 15 ppm mass error cut-off was used with a neutral mass range up to 2000 Da. Metabolites were identified with the top 10 best matched depending on the score. The limitation of the charge state was set to a maximum of two. The data was validated using pooled samples to determine accurate mass and retention time for collision-induced dissociation (CID) fragmentations. Thus, global metabolomics was performed on pooled serum samples and the data analyzed similarly as for the test samples. Fragments were then compared with database METLIN to verify the structure. The validation followed the criteria of the Metabolomics Standards Initiative level 1.
10
Evaluation of a panel of metabolites identified
A new set of serum samples from 20 CRC patients and 20 matched healthy individuals were used to validate the panel of biomarkers identified. The untargeted metabolomics profile was performed as described above. The data was used to predict CRC in this set of samples using Metaboanalyst 4.0 for biomarker analysis.
Pathways analysis
Metaboanalyst 4.0 was used to analyze the altered pathways in CRC patients. Data from the complete analysis were converted to CSV files to be analyzed by Metaboanalyst 4.0 (https://www.metaboanalyst.ca).
Results
Demographic of patients
Serum samples were obtained from CRC patients and normal controls participating in cancer screening at the Hospital Universiti Kebangsaan Malaysia (HUKM). CRC serum samples (n = 50) were obtained after the diagnosis was confirmed by histopathology. The recruited newly diagnosed patients had a mean age of 64 ± 9 years at the time of sample collection. There were 30 males (60%) and 20 females (40%). The patients comprised of 35 Malays and 15 Chinese. The CRC anatomical site, tissue histology, cancer staging (using the Dukes classification) are presented in Table 1. Histologically, most of the tumours were well-differentiated (54%, n = 27) and moderately differentiated (34%, n = 17). The remaining consist of mucinous component (8%, n = 4), poorly differentiated (2, n = 1) and minimal residual (2, n = 1) tumours. Blood samples from 50 normal healthy individuals with a mean age of 63 ± 6 years with gender and ethnicity matched served as controls.
A new sample set for evaluation was also obtained from HUKM. The recruited newly diagnosed 20 CRC patients had a mean age of 62 ± 7 years at the time of sample collection. There were 12 males (60%) and 8 females (40%). The patients comprised of 11 Malays and 9 Chinese. Blood samples from 20 normal healthy individuals with a mean age of 61 ± 6 years with gender and ethnicity matched served as controls.
The data from the untargeted metabolomics profiling showed that, for positive mode, 107594 peaks were detected initially by LCMS-QTOF. A total of 228 metabolites were detected after statistical analysis with a filter frequency of 50%, univariate significant analysis at a P value ≤ 0.05, and fold change cut-off ≥2.0 between healthy volunteers and CRC patients. Only 191 metabolites were identified in the Metlin database. Metlin uses a database from KEGG: Kyoto Encyclopedia of Genes and Genomes
11
and Human Metabolome Database
12
to identify metabolites. After the recursion analysis, only 131 metabolites were left. Statistical analysis before recursion was repeated to reduce false positives. Nine endogenous metabolites remained after aligned in recursion analysis. In negative mode, only two metabolites remained. A total of 11 metabolites were detected that were expressed differently between CRC patients and normal controls (Supplementary file 1, Table S1). The flow of analysis of the metabolites was summarised in Fig. 1. The metabolites identified to be differently expressed between the healthy volunteers and CRC patients include acetylcarnitine, hypoxanthine, xanthine, uric acid (UA), methionine, tyrosine, citric acid, 5-oxoproline, pipecolic acid, lysoPC, and lysoPE (Table 3).
Table 3.
Metabolites that were differentially expressed in CRC versus healthy controls
|
Metabolite
|
Class
|
Pathway
|
Regulation
|
Corrected
P
value
|
LogFC
|
| Methionine |
Amino acid |
Methionine |
↑ |
9.03×10⁻¹¹
|
10.94 |
| Acetylcarnitine |
Fatty acid ester |
Beta-oxidation |
↑ |
3.18×10⁻¹¹
|
10.74 |
| Uric acid |
Organic acid |
Purine |
↑ |
4.31×10⁻⁸
|
10.17 |
| Pipecolic acid |
Organic acid |
Lysine degradation |
↑ |
2.07×10⁻²
|
3.81 |
| Tyrosine |
Amino acid |
Tyrosine |
↑ |
4.99×10⁻¹²
|
13.05 |
| 5-Oxoproline |
Amino acid |
Glutathione degradation |
↑ |
3.38×10⁻⁶
|
9.11 |
| Hypoxanthine |
Nucleobases |
Purine |
↑ |
3.19×10⁻⁹
|
11.91 |
| Xanthine |
Nucleobases |
Purine |
↑ |
7.48×10⁻⁵
|
9.54 |
| Citric acid |
Organic acid |
Krebs cycle |
↑ |
9.15×10⁻³
|
4.60 |
| LysoPC (16:1) |
Fatty acid |
Phospholipid |
↓ |
2.14×10⁻³
|
-3.99 |
| LysoPE (22:6) |
Fatty acid |
Phospholipid |
↓ |
3.64×10⁻²
|
-3.36 |
↑ upregulated; ↓ down-regulated.
Verification of differential metabolites
LCMSMS was used in the verification of the structures of the differential metabolites identified earlier (Supplementary file 1, Fig. S2). By comparing the fragmentation patterns of the selected metabolites in the pooled samples, we confirmed the identities of acetylcarnitine, hypoxanthine, xanthine, UA, methionine, tyrosine, citric acid, 5-oxoproline, pipecolic acid, lysoPC, and lysoPE. The fragmented ion of each metabolite was matched with those in the METLIN database.

Fig. 1.
The flow of statistical analysis.
.
The flow of statistical analysis.
Class prediction model
Eleven statistically significant differential metabolites identified earlier were used to build a model using Metaboanalyst 4.0. Classification of samples into discrete classes was done using partial least square discrimination algorithm (PLS-DA) analysis (Fig. 2). PLS-DA from Fig. 2 is the combination of PLS-DA of positive and negative mode (Supplementary file 1, Fig. S1).

Fig. 2.
PLS-DA Score Plot for Patients and Healthy Volunteers using the 11 identified differential metabolites. Red plots represent the CRC patients and green plots represent normal controls.
.
PLS-DA Score Plot for Patients and Healthy Volunteers using the 11 identified differential metabolites. Red plots represent the CRC patients and green plots represent normal controls.
The area under the curve, sensitivity, and specificity indices were measured based on the constructed model. Sensitivity was determined by calculating the ratio of true positives (correctly predicted cancer samples) to the total number of CRC samples, whereas specificity was calculated from the ratio of true negatives (correctly predicted control samples) to the total number of control samples.
As shown in Fig. 3, tyrosine, hypoxanthine, acetylcarnitine, and methionine were classified as excellent performers. This represents the excellent positive ability of these metabolites to separate CRC patients and healthy individuals with 70%-90% sensitivity and specificity.
13
Predictive accuracies increased with an increase in the number of metabolites/biomarkers with the highest level (87.4%) when 11-panel biomarkers were used (Fig. 4).
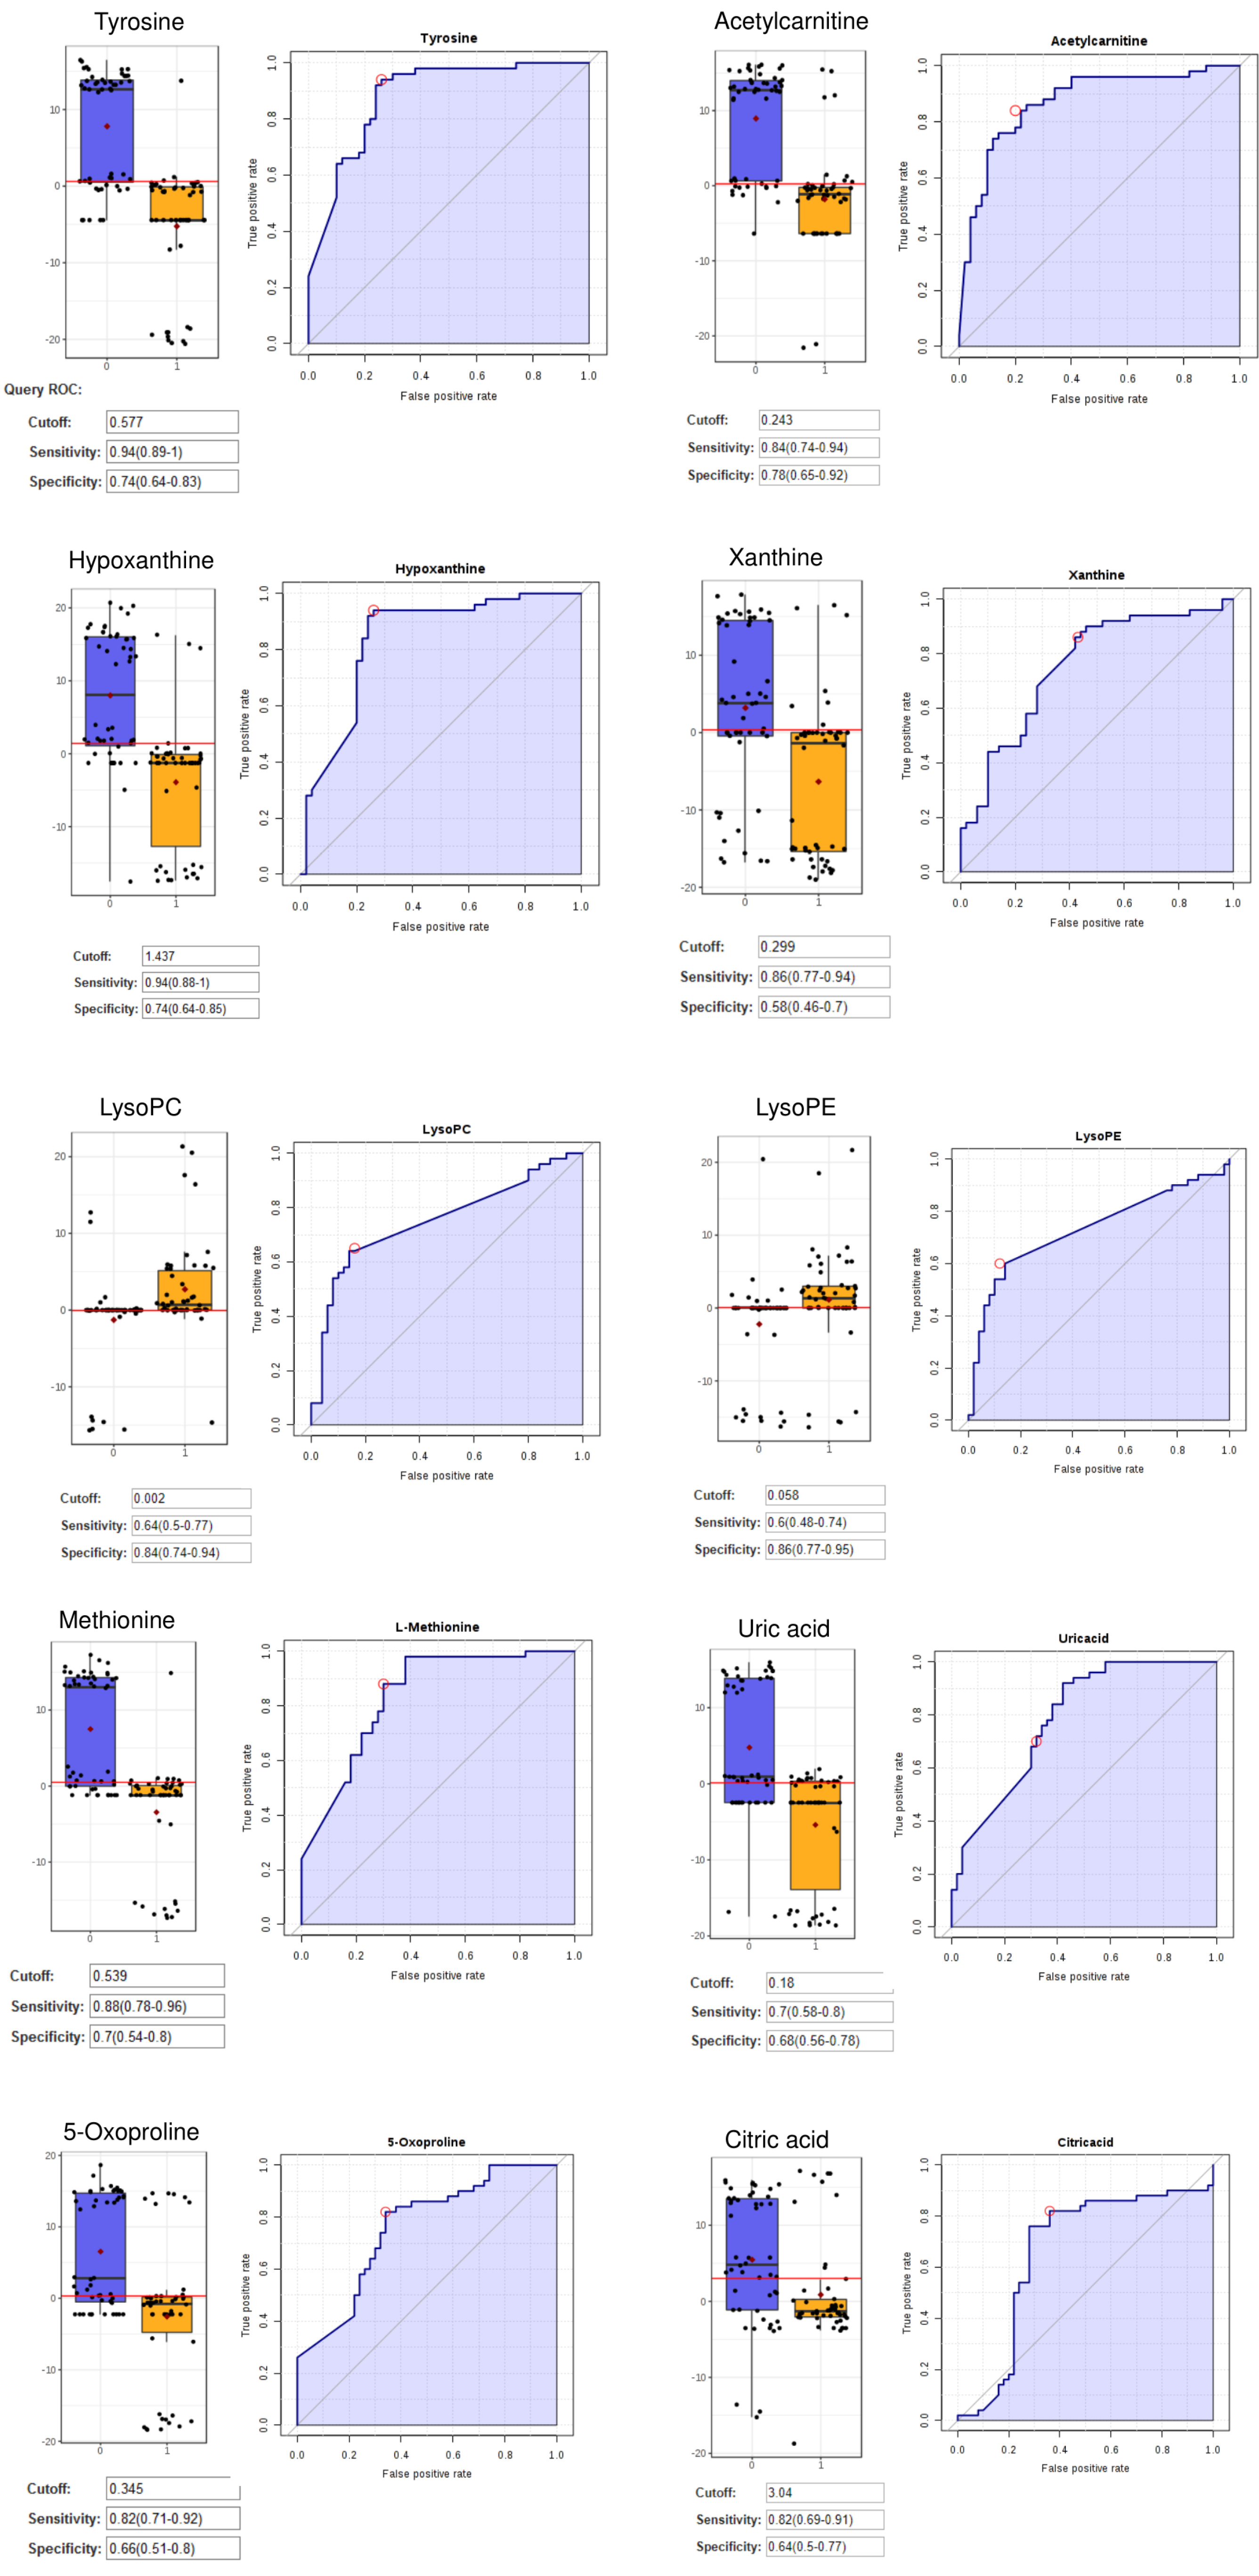
Fig. 3.
The ROC, Box-plot sensitivity and specificity of tyrosine, hypoxanthine, acetylcarnitine, methionine, xanthine, uric acid, lysoPC, lysoPE, 5-oxoproline, and citric acid.
.
The ROC, Box-plot sensitivity and specificity of tyrosine, hypoxanthine, acetylcarnitine, methionine, xanthine, uric acid, lysoPC, lysoPE, 5-oxoproline, and citric acid.
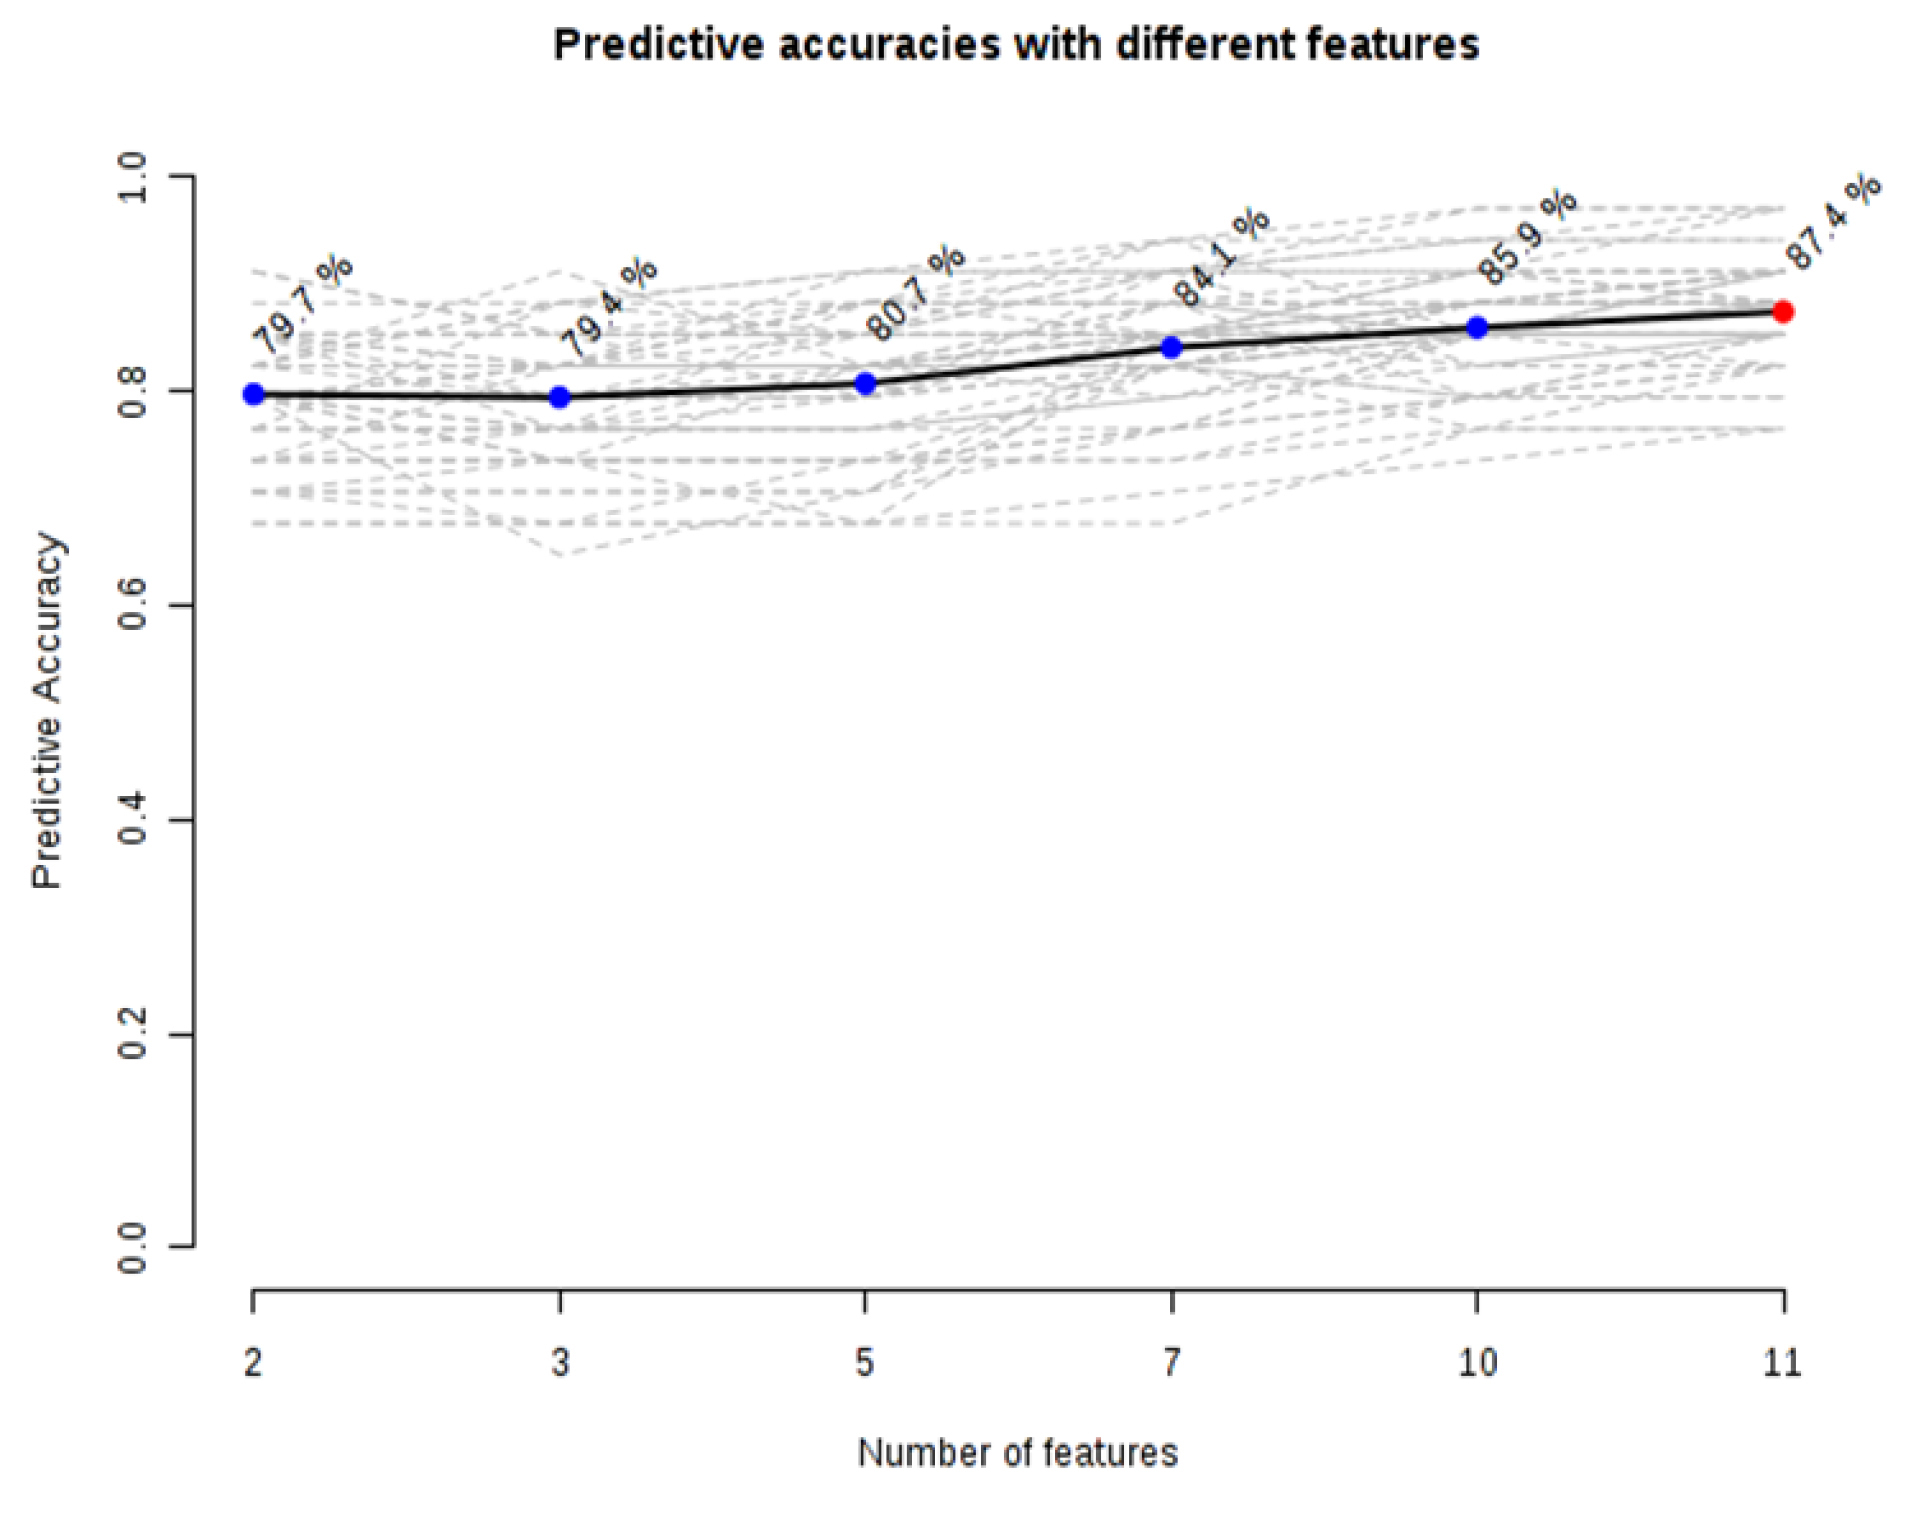
Fig. 4.
Graph of predictive accuracies with a different number of differential. A model with 11 metabolites showed an optimized model in separating patients from healthy volunteers.
.
Graph of predictive accuracies with a different number of differential. A model with 11 metabolites showed an optimized model in separating patients from healthy volunteers.
Verification of panel biomarkers
Global metabolomics was performed on 20 new matched samples as described above. PLS-DA was constructed using the 11 differential metabolites identified earlier and the result showed that there was good separation between CRC and normal controls using new sample sets (Fig. 5). Algorithm random forest analysis was used to determine the accuracy of the 11 identified differential metabolites in identifying CRC samples. The prediction of new samples showed 16 out of 20 CRC patients were correctly predicted while 16 out of 20 normal patients were correctly predicted (Table S2). The prediction has 80% accuracy.
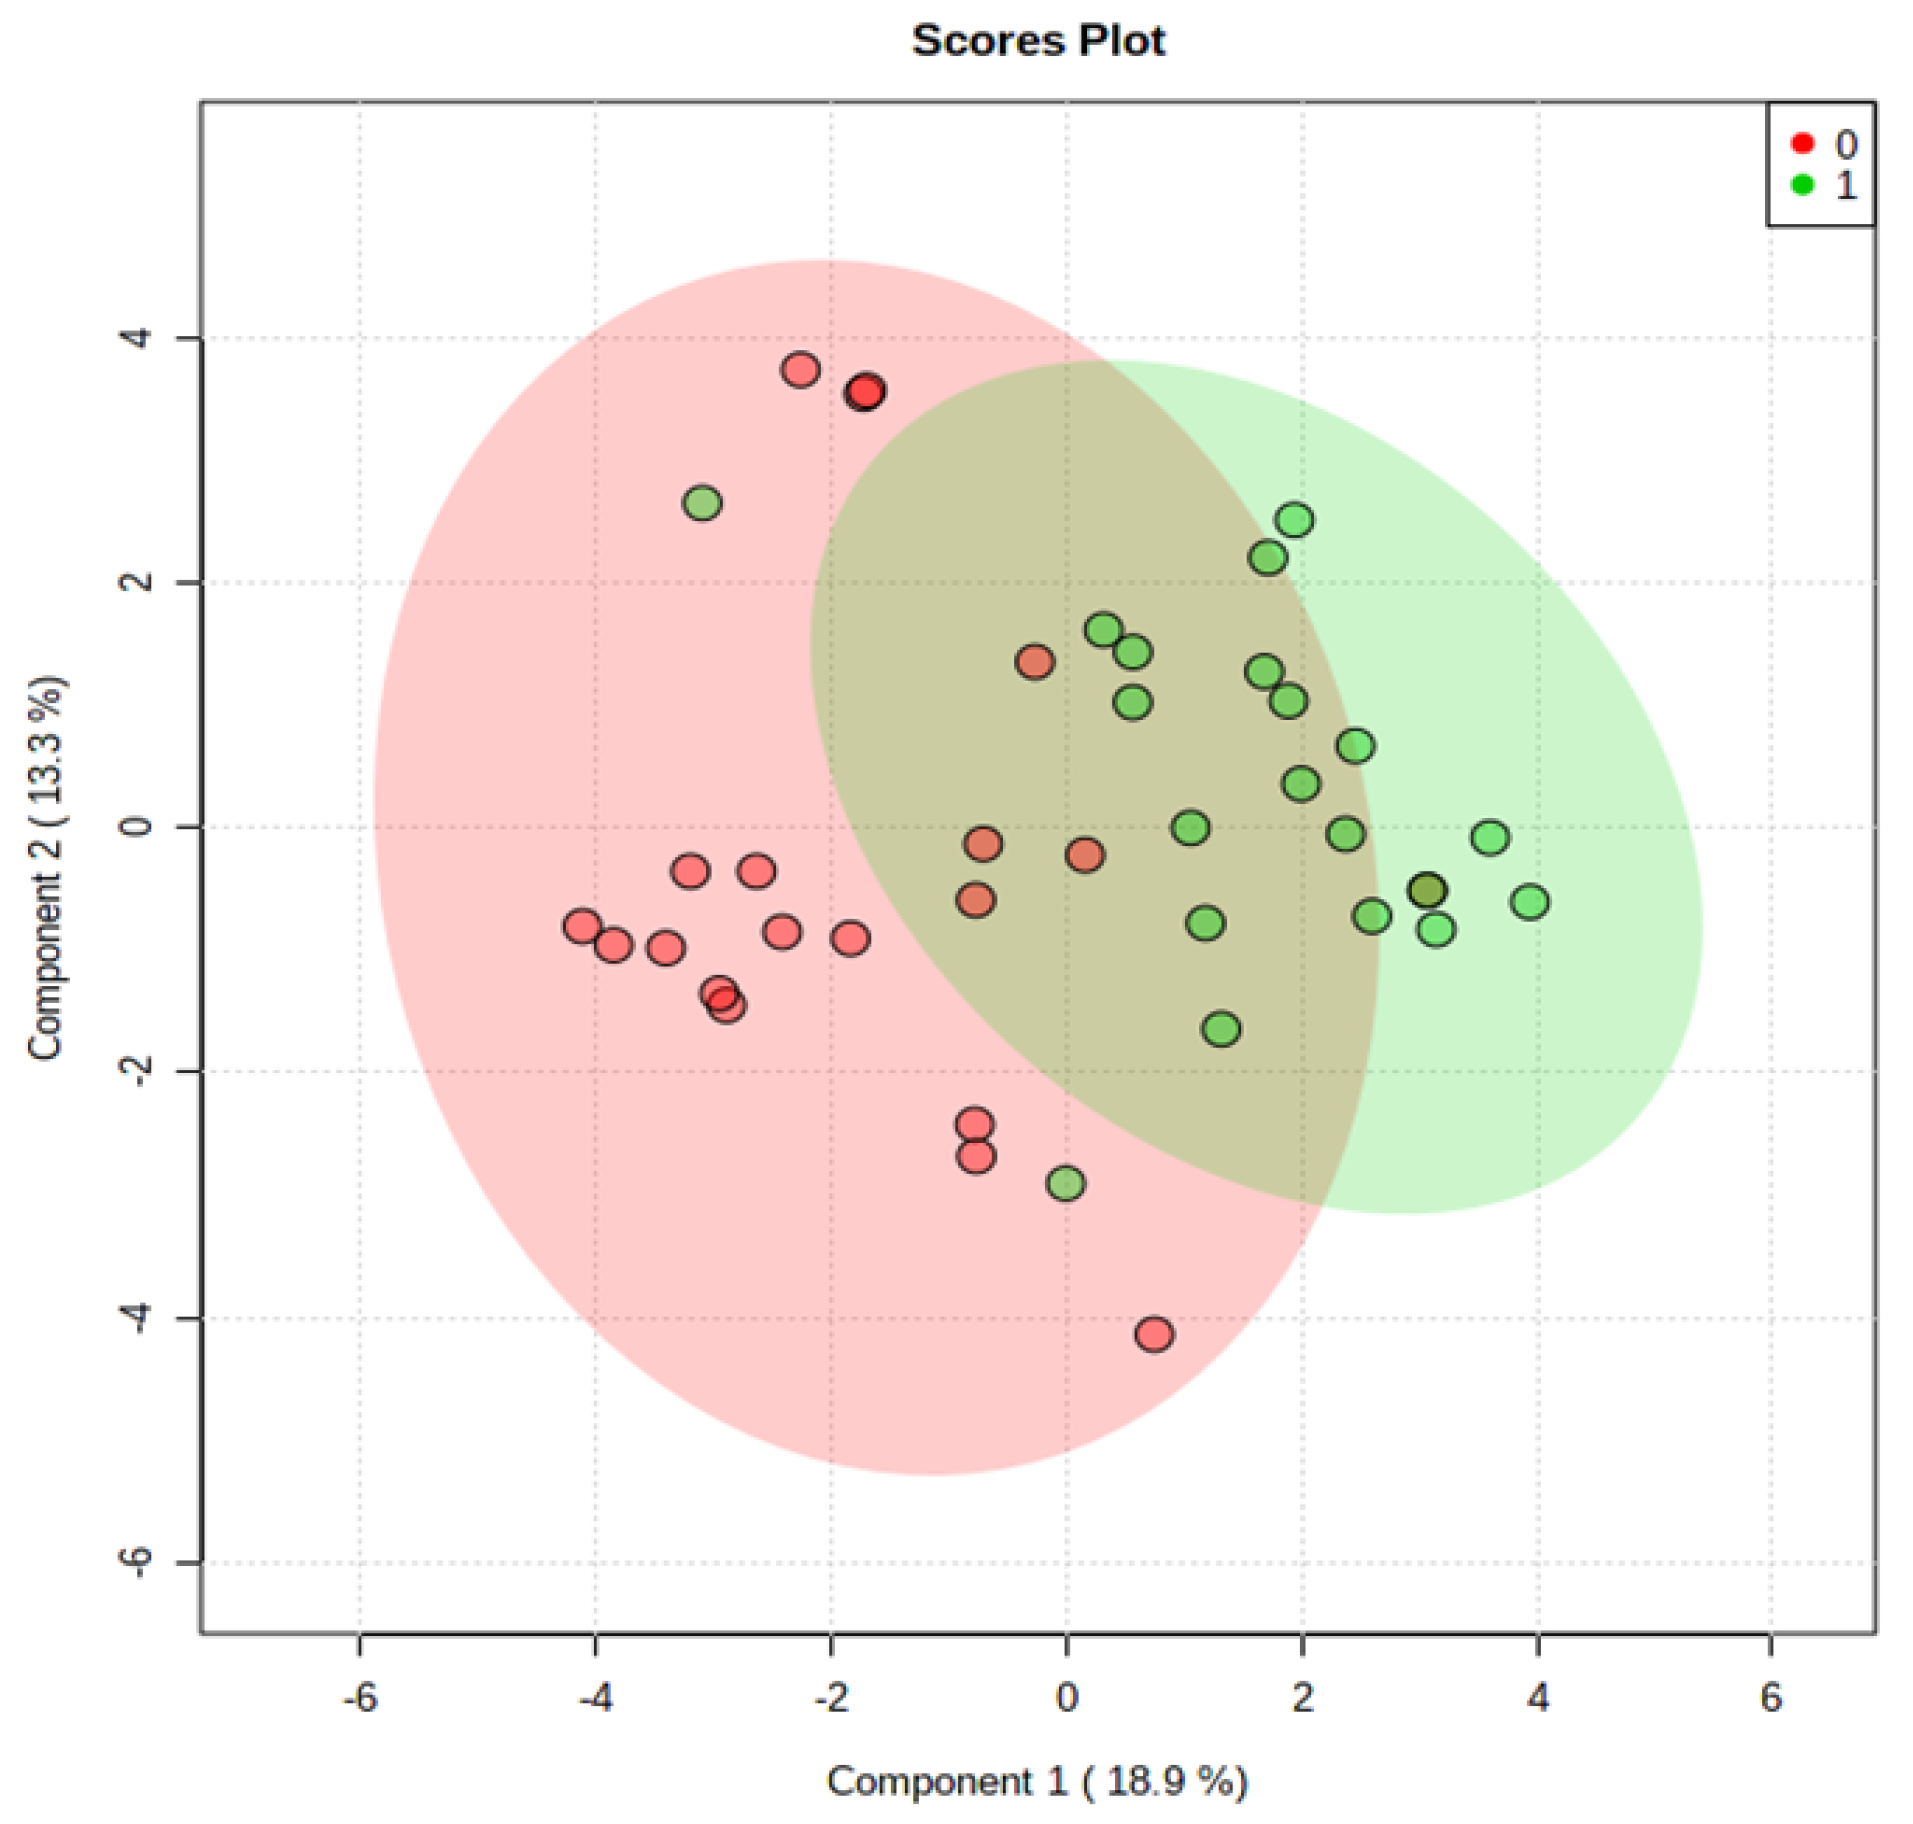
Fig. 5.
PLS-DA Plot of Serum for a new sample set of CRC patients and normal controls. (0) represent the CRC patients and (1) represent normal controls.
.
PLS-DA Plot of Serum for a new sample set of CRC patients and normal controls. (0) represent the CRC patients and (1) represent normal controls.
Identification of metabolic pathways
The identified differential metabolites were analyzed further using metabolite set enrichment analysis to determine altered pathways in CRC. The analysis was done using metabolomics data obtained from the analysis of the 50 CRC and 50 normal samples earlier. Fig. 6 shows that eight pathways were altered in CRC patients compared to normal controls with fold enrichment on more than 2. The altered pathways were mainly in purine metabolism, catecholamine biosynthesis, phenylalanine metabolism, tyrosine metabolism, thyroid hormone synthesis, beta-oxidation, and glutathione (GSH) metabolism. Purine metabolism recorded the highest p-value where this pathway is the most affected in CRC patients.
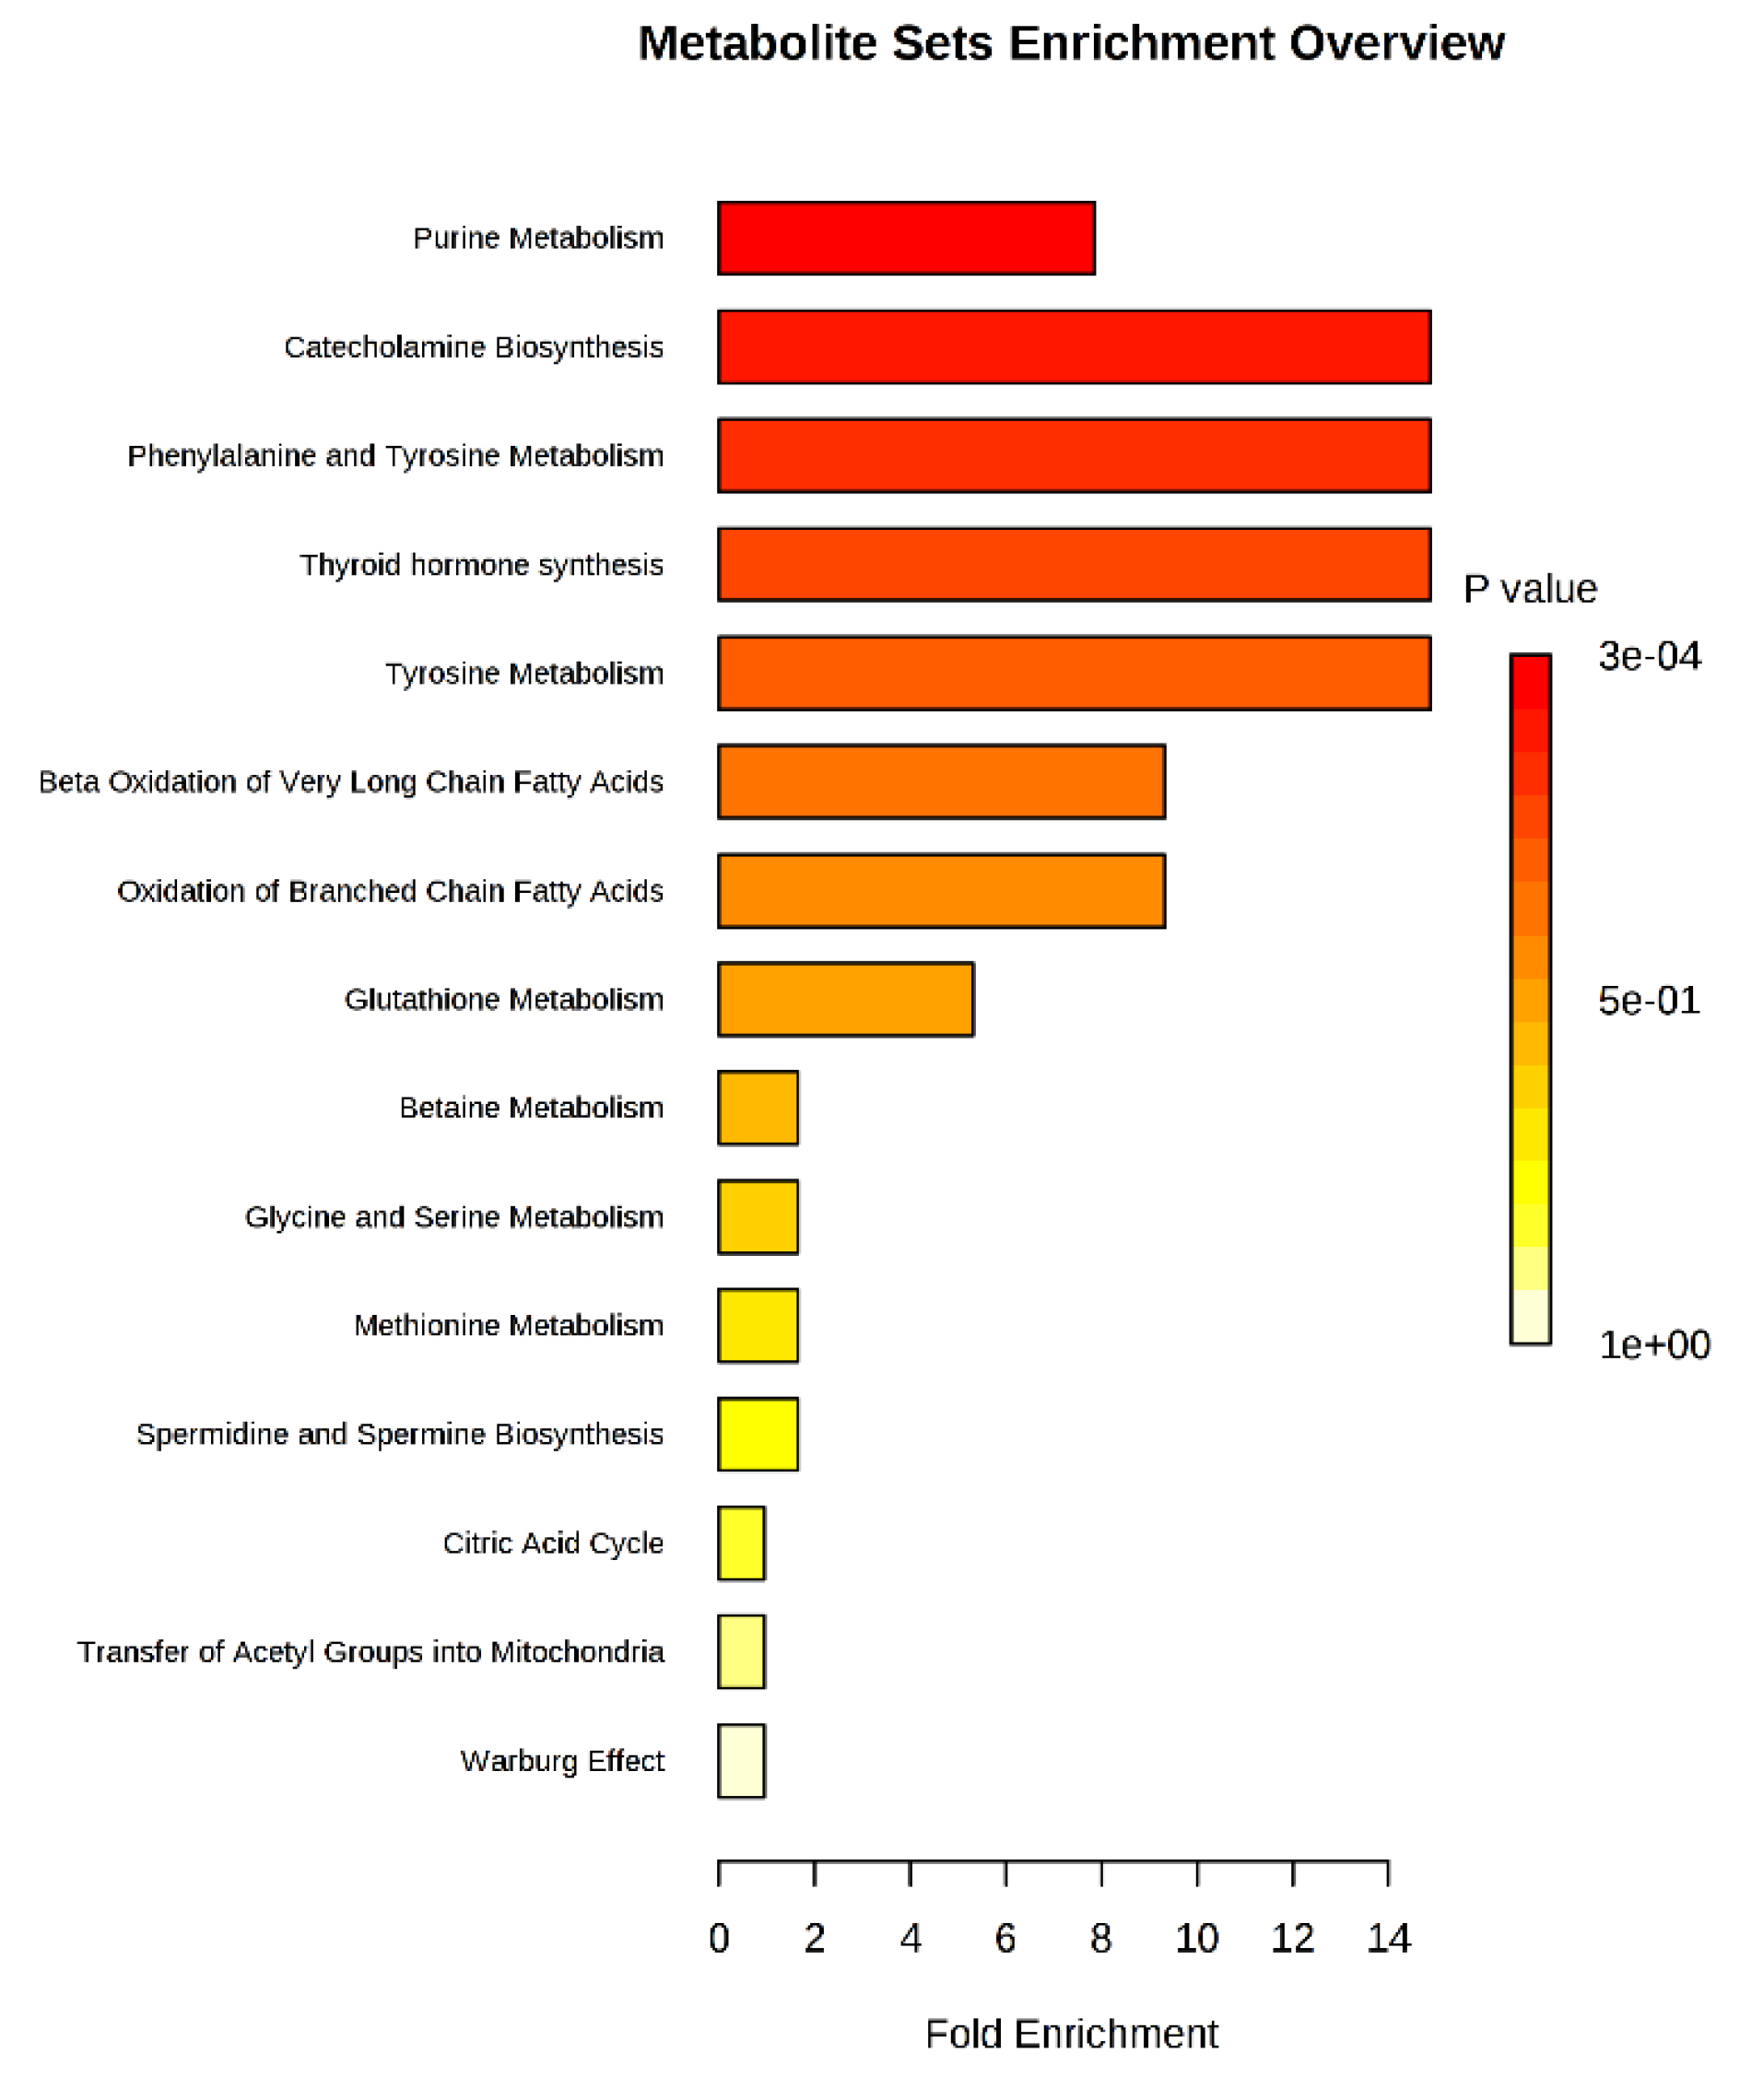
Fig. 6.
Metabolite set enrichment analysis is based on differentially expressed metabolites identified in the serum of CRC and normal controls.
.
Metabolite set enrichment analysis is based on differentially expressed metabolites identified in the serum of CRC and normal controls.
Discussion
Metabolomics is a tool that has been used in biomarker discovery for cancers including CRCs.
5
Metabolites are the final products of cellular activity where it is not only affected by biological factors but are also sensitive to the environment. Metabolomics studies have also revealed altered metabolic pathways in cancer and provide better insights in understanding cancer metabolic reprogramming. The present study identified 11 metabolites that were expressed significantly different between CRC patients and normal controls. Hypoxanthine, UA, acetylcarnitine, xanthine, methionine, tyrosine, pipecolic acid, 5-oxoproline, citric acid, lysoPC, and lysoPE were the differential metabolites.
All 11 differential metabolites identified in this study have been reported before. However, the same studies did not report all metabolites detected in this study. Different studies reported different combinations of differential metabolites as shown in Table 4. Therefore, the differential metabolic profile identified in this study is unique and different from those of the earlier studies.
Table 4.
Comparison of differential metabolites identified in the present study with other published reports
|
Metabolites
|
Present study
|
Qiu
14
|
Nishiumi
15
|
Tan
16
|
Cross
17
|
Zamani
18
|
Uchiyama
19
|
Long
20
|
Nishiumi
21
|
| Hypoxanthine |
|
|
|
|
|
|
√ |
√ |
|
| Xanthine |
|
|
|
|
√ |
|
|
√ |
|
| Methionine |
|
√ |
√ |
√ |
√ |
|
|
√ |
√ |
| Tyrosine |
|
√ |
√ |
√ |
√ |
|
|
√ |
√ |
| Uric acid |
|
|
|
|
|
|
√ |
|
√ |
| Acetylcarnitine |
|
|
|
√ |
|
|
|
|
|
| LysoPE |
|
|
|
√ |
|
|
|
|
|
| LysoPC |
|
|
|
√ |
|
|
|
|
|
| Citric acid |
|
|
|
√ |
|
√ |
√ |
|
|
| Pipecolic acid |
|
|
|
|
|
|
√ |
|
|
| 5-oxoproline |
|
|
|
|
|
|
|
√ |
|
Three metabolites out of the 11 differential metabolites identified in this study, hypoxanthine, xanthine, and UA belong to purine metabolism and may account for the observation that purine metabolism as being the most perturbed pathway in CRC. This pathway is not only observed to be affected in CRC
20,22,23
but also in other cancers.
24,25
Purine metabolism produces components of nucleotides, adenine, and guanine, that are essential for cell proliferation. Purine also participates in other biomolecule processes to provide energy and cofactors such as nicotinamide adenine dinucleotide and coenzyme A for cells to proliferate. Hence, the increased hypoxanthine and xanthine may be associated with an increased rate of purine salvage pathway to generate nucleic acid for cell growth and proliferation.
26
Increased hypoxanthine levels had also been reported by Uchiyama et al.
19
Similarly, increased xanthine and UAs were also reported by Cross et al.
17
However, the present result contradicted that of Long et al who reported that the levels of hypoxanthine and xanthine in CRC patients were decreased compared to controls.
20
It is interesting to note that metabolomics studies on other cancers have also reported elevated levels of hypoxanthine in cholangioma,
27
hepatocellular carcinoma,
27
lungs, and prostate cancer.
28
Furthermore, its levels in CRC tissues have been reported to be elevated.
22
Hypoxanthine is catalyzed by xanthine oxidase to xanthine which produces reactive oxygen species (ROS).
29
Increased intracellular ROS can induce cancer cell death and apoptosis. In order to balance ROS in the cells, some hypoxanthine is transported out from the cells by equilibrative nucleoside transporters.
30
This might explain the increased serum hypoxanthine level observed in our CRC patients. Cancer cells can also prevent apoptosis by activating c-Jun N-terminal kinases (JNKs) which in turn, catalyze the phosphorylation and downregulation of anti-apoptotic proteins, Bcl-2 and Bcl-XL.
31
An average level of ROS in cancer cells, therefore, has been suggested to promote cell proliferation and angiogenesis.
32,33
Increased UA levels had also been observed in advanced stages of rectal cancer
34
and head and neck carcinoma.
35
Uric acid is the end product of purine catabolism. Deamination of adenosine by adenosine deaminase produces inosine, which can be converted to hypoxanthine by purine nucleoside phosphorylase. Hypoxanthine is then converted to xanthine by xanthine oxidase. Xanthine oxidase also catalyzes the conversion of xanthine to UA. Hence, UA levels tend to reflect the levels of hypoxanthine and xanthine. Increased UA levels may have protective roles in tumor defense by acting as antioxidants to protect cells against free-radical oxidative damage,
36,37
and secondly, by stimulating the immune system.
36
The latter researchers observed that dying cells released UA and antigens which stimulated the maturation of dendritic cells which in turn, stimulated the immune system. CD8+ T-Lymphocytes inhibit tumor cell proliferation and migration as well as inducing cytotoxic cell death.
38
Elevated level of UA was reported to be associated with increase survival time of CRC patients.
39
5-oxoproline or pyroglutamate is an intermediate in GSH metabolism. 5-oxoproline is produced from the γ-glutamyl moiety of peptides by γ-glutamylcyclotransferase.
40
In this study, the level of 5-oxoproline was observed to be significantly higher in CRC than normal controls. Increased GSH amino acids including 5-oxoproline, have been reported in CRC tissues.
14
Elevated 5-oxoproline in the serum of CRC patients had also been reported.
15
Elevated 5-oxoproline has also been reported in nasopharyngeal carcinoma,
41
bladder cancer,
42
and hepatocellular cancer.
43
GSH, a major endogenous antioxidant,
37
plays a significant role in cellular detoxification and immune response.
38
Elevated GSH levels have been observed in numerous types of human cancer tissues and increased glutamate-cysteine ligase catalytic activity (GCLC) have also been reported in lung, breast, liver, and other types of cancer.
44
GCLC and GSH synthetase are enzymes in GSH metabolism and their levels were reported to be elevated in CRC tissues.
42
Hence increased GSH metabolism may indicate increased oxidative status in cancer cells due to increased energy metabolism.
The present study showed elevated methionine levels in CRC serum which is in contrast to the findings by Cross et al and Long et al.
17,20
Methionine is synthesized from homocysteine and 5-methyltetrahydrofolate and vitamin B12 and its synthesis in normal cells are adequate to meet the demand for cell growth. However, exogenous methionine is needed by cancer cells for survival. Methionine salvage enzyme is associated with the proliferation of CRC cell lines.
45
Cancer cells depend on methionine for polyamine synthesis. Polyamine level is associated with colon cancer as polyamine is crucial for cell growth.
46
Methionine also acts as a precursor of GSH from the catabolism of homocysteine. As stated earlier, GSH protects cells from oxidative stress by reducing reactive oxygen species.
47
Furthermore, methionine is also involved in the regulation of gene expression by acting as a methyl group donor for histone methylation.
48
The increased tyrosine in this study is similar to the findings of Nishiumi et al.
15
but is in contrast to the findings of Qiu et al, Cross et al and Nishiumi et al.
14,17,21
Tyrosine is a non-essential amino acid and is synthesized via hydroxylation of phenylalanine. It is a precursor in metabolic pathways of thyroid hormones, catecholamines, and melanin. L-DOPA, pyruvate, fumarate, and phenol are products of hydroxylation of tyrosine. Tyrosine is converted to phenol by tyrosine phenol-lyase (β-tyrosinase).
49
In the colon, phenols are a major product from tyrosine metabolism.
45
Tyrosine is also converted to fumarate through multiple enzymatic reactions. Thus, increased tyrosine levels have been suggested to increase the formation of fumarate for TCA cycle.
50
Tyrosine may also be involved in mucin production, serving as its building blocks. Mucins are glycoproteins that are involved in the protection of the epithelial surface, signaling transduction, and cell differentiation, and proliferation.
51
Several mucin antigens, such as MUC1
51
and MUC13
52
are overproduced in CRC. The increased tyrosine level observed in this present study may be due to the high demand for mucin synthesis and synthesis of fumarate for TCA cycle.
Altered tyrosine levels may also indicate dysregulation of tyrosine metabolism that includes thyroid hormone synthesis and catecholamine synthesis. Thyroid hormones are involved in colorectal cell differentiation, proliferation, tumorigenesis, and apoptosis. The thyroid hormone, triiodothyronine, at physiological concentrations triggers the activation of the phosphatidylinositol-3-kinase pathway by phosphorylation to promote cell proliferation and inhibit apoptosis.
53
Catecholamines are known as neurotransmitters and include epinephrine, norepinephrine, and dopamine. Catecholamines have been reported to affect tumor cell behavior and gene expression and hence tumor cell progression.
54
Lysophosphatidylcholine (LysoPC) is the product of the degradation of phosphatidylcholine (PC). The present findings showed decreased LysoPC level indicating tumor cells consumed LysoPC more rapidly compared to normal cells. The observation was in agreement with the findings by Zhao et al.
55
Other cancers such as leukemia were also reported to have decreased LysoPC level.
56
The decrease probably reflects its increased degradation by cells. Cleavage of LysoPC results in excess extracellular free fatty acids (FFA). Subsequently, these FFA can be consumed by tumor cells for energy via fatty acid oxidation.
57
LysoPC is also needed for incorporation into the cell membrane to maintain its stability and hence various biological processes as well as membrane fluidity.
58
The level of lysoPC may affect processes such as adhesion, receptor activity, and cell motility associated with cancer and metastasis.
59
Decreased lysoPC level in this study might be due to the conversion of lysoPC to free fatty acid to satisfy CRC cell demands for energy production.
The data from this study also showed that the most affected metabolic pathways observed were purine followed by catecholamine and amino acid metabolisms. The differential metabolites and their regulations as well as the affected metabolic pathways observed in our patients mirror the findings of some studies while differing from others. This highlights the unique profile of our patients. The variation of metabolites in different studies may not only be due to different genetic make-up but lifestyle and diet may play a major role also. Differences may also be due to samples taken from different CRC stages, the use of different analytical platforms, processing software, and extraction solvents as reviewed by Hashim et al.
5
Conclusion
Metabolic profiling on serum samples from CRC patients and normal controls has identified 11 differential metabolites as potential biomarkers. These 11 metabolites were hypoxanthine, xanthine, acetylcarnitine, UA, methionine, tyrosine, lysoPC, lysoPE, 5-oxoproline, pipecolic acid, and citric acid. The panel of 11 differential metabolites was able to discriminate between CRC and normal samples with an accuracy of 80%. Enrichment analysis revealed that purine metabolism was the most affected pathway in CRC in our patients.
Acknowledgement
We thanked Prof Dato Dr. Zaki Mohd Saleh, Prof Teh Lay Kek, and Mr. Mohd Izwan Yusof of iPROMISE, UiTM, Puncak Alam, Selangor, Malaysia for their invaluable technical support and advice during the running of the metabolomics analysis.
Funding Sources
This study was supported by Long Term Research Grant from the Ministry of Education, Malaysia (LRGS/2014/UKM-UiTM/K/03).
Ethical statement
The study was approved by the Research and Ethics committee of Universiti Teknologi MARA (UiTM), Shah Alam, Selangor, Malaysia and the Research and Ethics Committee of Universiti Kebangsaan Malaysia, Malaysia and UKM research ethics committee.
Competing interests
There is no conflict of interest
Authors’ Contribution
NAAH is the author and research student who performed the analysis and wrote the manuscript. SAR, WZWN, SN were involved in the discussion and provide ideas for the study, NSM, IS responsible for collecting samples, ARAJ provides the original idea and involved in obtaining the grant, MM is the leader of the study, designed the study, and involved in correcting and editing of the manuscript.
Supplementary Materials
Supplementary file 1 contains Tables S1- S2 and Figs. S1-S2.
(pdf)
Research Highlights
What is the current knowledge?
simple
-
√ Some metabolites have been identified as possible biomarkers for CRC but these biomarkers differ with the different studies.
-
√ Most studies suggest perturbation in amino acid metabolism in CRC.
What is new here?
simple
-
√ Different panel of biomarkers that can differentiate CRC samples from normal with 80% accuracy for our population
-
√ In addition, we find that purine metabolism is affected in our CRC patients which may indicate the differences in lifestyle and environment.
References
- Bray F, Ferlay J, Soerjomataram I, Siegel RL, Torre LA, Jemal A. Global cancer statistics 2018: GLOBOCAN estimates of incidence and mortality worldwide for 36 cancers in 185 countries. CA Cancer J Clin 2018; 68:394-424. doi: 10.3322/caac.21492 [Crossref] [ Google Scholar]
- Bretthauer M, Kaminski MF, Loberg M, Zauber AG, Regula J, Kuipers EJ. Population-Based Colonoscopy Screening for Colorectal Cancer: A Randomized Clinical Trial. JAMA Intern Med 2016; 176:894-902. doi: 10.1001/jamainternmed.2016.0960 [Crossref] [ Google Scholar]
- Rutter MD, Beintaris I, Valori R, Chiu HM, Corley DA, Cuatrecasas M. World Endoscopy Organization Consensus Statements on Post-Colonoscopy and Post-Imaging Colorectal Cancer. Gastroenterology 2018; 155:909-25. doi: 10.1053/j.gastro.2018.05.038 [Crossref] [ Google Scholar]
- Clish CB. Metabolomics: an emerging but powerful tool for precision medicine. Cold Spring Harb Mol Case Stud 2015; 1:a000588. doi: 10.1101/mcs.a000588 [Crossref] [ Google Scholar]
- Hashim NAA, Ab-Rahim S, Suddin LS, Saman MSA, Mazlan M. Global serum metabolomics profiling of colorectal cancer. Mol Clin Oncol 2019; 11:3-14. doi: 10.3892/mco.2019.1853 [Crossref] [ Google Scholar]
- Gika HG, Macpherson E, Theodoridis GA, Wilson ID. Evaluation of the repeatability of ultra-performance liquid chromatography-TOF-MS for global metabolic profiling of human urine samples. J Chromatogr B Analyt Technol Biomed Life Sci 2008; 871:299-305. doi: 10.1016/j.jchromb.2008.05.048 [Crossref] [ Google Scholar]
- Bannur Z, Teh LK, Hennesy T, Rosli WR, Mohamad N, Nasir A. The differential metabolite profiles of acute lymphoblastic leukaemic patients treated with 6-mercaptopurine using untargeted metabolomics approach. Clin Biochem 2014; 47:427-31. doi: 10.1016/j.clinbiochem.2014.02.013 [Crossref] [ Google Scholar]
- Mohamad N, Ismet RI, Rofiee M, Bannur Z, Hennessy T, Selvaraj M. Metabolomics and partial least square discriminant analysis to predict history of myocardial infarction of self-claimed healthy subjects: validity and feasibility for clinical practice. J Clin Bioinforma 2015; 5:3. doi: 10.1186/s13336-015-0018-4 [Crossref] [ Google Scholar]
- Ma X, Chi Y-H, Niu M, Zhu Y, Zhao Y-L, Chen Z. Metabolomics coupled with multivariate data and pathway analysis on potential biomarkers in cholestasis and intervention effect of paeonia lactiflora pall. Front Pharmacol 2016; 7:14. doi: 10.3389/fphar.2016.00014 [Crossref] [ Google Scholar]
- Sumner LW, Amberg A, Barrett D, Beale MH, Beger R, Daykin CA. Proposed minimum reporting standards for chemical analysis Chemical Analysis Working Group (CAWG) Metabolomics Standards Initiative (MSI). Metabolomics 2007; 3:211-21. doi: 10.1007/s11306-007-0082-2 [Crossref] [ Google Scholar]
- Kanehisa M, Goto S. KEGG: kyoto encyclopedia of genes and genomes. Nucleic Acids Res 2000; 28:27-30. doi: 10.1093/nar/28.1.27 [Crossref] [ Google Scholar]
- Wishart DS, Feunang YD, Marcu A, Guo AC, Liang K, Vazquez-Fresno R. HMDB 4.0: the human metabolome database for 2018. Nucleic Acids Res 2018; 46:D608-d17. doi: 10.1093/nar/gkx1089 [Crossref] [ Google Scholar]
- Xia J, Broadhurst DI, Wilson M, Wishart DS. Translational biomarker discovery in clinical metabolomics: an introductory tutorial. Metabolomics 2013; 9:280-99. doi: 10.1007/s11306-012-0482-9 [Crossref] [ Google Scholar]
- Qiu Y, Cai G, Su M, Chen T, Zheng X, Xu Y. Serum metabolite profiling of human colorectal cancer using GC-TOFMS and UPLC-QTOFMS. J Proteome Res 2009; 8:4844-50. doi: 10.1021/pr9004162 [Crossref] [ Google Scholar]
- Nishiumi S, Kobayashi T, Ikeda A, Yoshie T, Kibi M, Izumi Y. A novel serum metabolomics-based diagnostic approach for colorectal cancer. PLoS One 2012; 7:e40459. doi: 10.1371/journal.pone.0040459 [Crossref] [ Google Scholar]
- Tan B, Qiu Y, Zou X, Chen T, Xie G, Cheng Y. Metabonomics identifies serum metabolite markers of colorectal cancer. J Proteome Res 2013; 12:3000-9. doi: 10.1021/pr400337b [Crossref] [ Google Scholar]
- Cross AJ, Moore SC, Boca S, Huang WY, Xiong X, Stolzenberg-Solomon R. A prospective study of serum metabolites and colorectal cancer risk. Cancer 2014; 120:3049-57. doi: 10.1002/cncr.28799 [Crossref] [ Google Scholar]
- Zamani Z, Arjmand M, Vahabi F, Eshaq Hosseini SM, Fazeli SM, Iravani A. A metabolic study on colon cancer using (1)h nuclear magnetic resonance spectroscopy. Biochem Res Int 2014; 2014:348712. doi: 10.1155/2014/348712 [Crossref] [ Google Scholar]
- Uchiyama K, Yagi N, Mizushima K, Higashimura Y, Hirai Y, Okayama T. Serum metabolomics analysis for early detection of colorectal cancer. J Gastroenterol 2017; 52:677-94. doi: 10.1007/s00535-016-1261-6 [Crossref] [ Google Scholar]
- Long Y, Sanchez-Espiridion B, Lin M, White L, Mishra L, Raju GS. Global and targeted serum metabolic profiling of colorectal cancer progression. Cancer 2017; 123:4066-74. doi: 10.1002/cncr.30829 [Crossref] [ Google Scholar]
- Nishiumi S, Kobayashi T, Kawana S, Unno Y, Sakai T, Okamoto K. Investigations in the possibility of early detection of colorectal cancer by gas chromatography/triple-quadrupole mass spectrometry. Oncotarget 2017; 8:17115-26. doi: 10.18632/oncotarget.15081 [Crossref] [ Google Scholar]
- Ong ES, Zou L, Li S, Cheah PY, Eu KW, Ong CN. Metabolic profiling in colorectal cancer reveals signature metabolic shifts during tumorigenesis. Mol Cell Proteomics 2010. doi: 10.1074/mcp.M900551-MCP200 [Crossref]
- Brown DG, Rao S, Weir TL, O'Malia J, Bazan M, Brown RJ. Metabolomics and metabolic pathway networks from human colorectal cancers, adjacent mucosa, and stool. Cancer Metab 2016; 4:11. doi: 10.1186/s40170-016-0151-y [Crossref] [ Google Scholar]
- Wang D, Li W, Zou Q, Yin L, Du Y, Gu J. Serum metabolomic profiling of human gastric cancer and its relationship with the prognosis. Oncotarget 2017; 8:110000-15. doi: 10.18632/oncotarget.21314 [Crossref] [ Google Scholar]
- Sahu D, Lotan Y, Wittmann B, Neri B, Hansel DE. Metabolomics analysis reveals distinct profiles of nonmuscle-invasive and muscle-invasive bladder cancer. Cancer Med 2017; 6:2106-20. doi: 10.1002/cam4.1109 [Crossref] [ Google Scholar]
- Camici M, Allegrini S, Tozzi MG. Interplay between adenylate metabolizing enzymes and AMP-activated protein kinase. FEBS J 2018; 285:3337-52. doi: 10.1111/febs.14508 [Crossref] [ Google Scholar]
- Murakami Y, Kubo S, Tamori A, Itami S, Kawamura E, Iwaisako K. Comprehensive analysis of transcriptome and metabolome analysis in Intrahepatic Cholangiocarcinoma and Hepatocellular Carcinoma. Sci Rep 2015; 5:16294. doi: 10.1038/srep16294 [Crossref] [ Google Scholar]
- Kami K, Fujimori T, Sato H, Sato M, Yamamoto H, Ohashi Y. Metabolomic profiling of lung and prostate tumor tissues by capillary electrophoresis time-of-flight mass spectrometry. Metabolomics 2013; 9:444-53. doi: 10.1007/s11306-012-0452-2 [Crossref] [ Google Scholar]
- Németh M, Janda T, Horváth E, Páldi E, Szalai G. Exogenous salicylic acid increases polyamine content but may decrease drought tolerance in maize. Plant Sci 2002; 162:569-74. doi: 10.1016/S0168-9452(01)00593-3 [Crossref] [ Google Scholar]
- Senyavina NV, Tonevitskaya SA. Effect of Hypoxanthine on Functional Activity of Nucleoside Transporters ENT1 and ENT2 in Caco-2 Polar Epithelial Intestinal Cells. Bull Exp Biol Med 2015; 160:160-4. doi: 10.1007/s10517-015-3118-z [Crossref] [ Google Scholar]
- Cadenas E. Mitochondrial free radical production and cell signaling. Mol Aspects Med 2004; 25:17-26. doi: 10.1016/j.mam.2004.02.005 [Crossref] [ Google Scholar]
- Burdon RH, Gill V, Rice-Evans C. Oxidative stress and tumour cell proliferation. Free Radic Res Commun 1990; 11:65-76. [ Google Scholar]
- Rabbani ZN, Spasojevic I, Zhang X, Moeller BJ, Haberle S, Vasquez-Vivar J. Antiangiogenic action of redox-modulating Mn(III) meso-tetrakis(N-ethylpyridinium-2-yl)porphyrin, MnTE-2-PyP(5+), via suppression of oxidative stress in a mouse model of breast tumor. Free Radic Biol Med 2009; 47:992-1004. doi: 10.1016/j.freeradbiomed.2009.07.001 [Crossref] [ Google Scholar]
- Yuan C, Xu X-H, Wang X-L, Xu L, Chen Z, Li Y-Q. Relationship between serum uric acid and metastatic and nonmetastatic rectal cancer patients with undergoing no chemotherapy. Medicine 2016; 95:e5463-e. doi: 10.1097/MD.0000000000005463 [Crossref] [ Google Scholar]
- Dhankhar R, Dahiya K, Sharma TK, Ghalaut VS, Atri R, Kaushal V. Diagnostic significance of adenosine deaminase, uric acid and C-reactive protein levels in patients of head and neck carcinoma. Clin Lab 2011; 57:795-8. [ Google Scholar]
- Shi L, Chen S, Yang L, Li Y. The role of PD-1 and PD-L1 in T-cell immune suppression in patients with hematological malignancies. J Hematol Oncol 2013; 6:74. doi: 10.1186/1756-8722-6-74 [Crossref] [ Google Scholar]
- Tasaki E, Sakurai H, Nitao M, Matsuura K, Iuchi Y. Uric acid, an important antioxidant contributing to survival in termites. PLoS One 2017; 12:e0179426. doi: 10.1371/journal.pone.0179426 [Crossref] [ Google Scholar]
- Mantovani A, Allavena P, Sica A, Balkwill F. Cancer-related inflammation. Nature 2008; 454:436-44. doi: 10.1038/nature07205 [Crossref] [ Google Scholar]
- Dziaman T, Banaszkiewicz Z, Roszkowski K, Gackowski D, Wisniewska E, Rozalski R. 8-Oxo-7,8-dihydroguanine and uric acid as efficient predictors of survival in colon cancer patients. Int J Cancer 2014; 134:376-83. doi: 10.1002/ijc.28374 [Crossref] [ Google Scholar]
- Oakley AJ, Yamada T, Liu D, Coggan M, Clark AG, Board PG. The identification and structural characterization of C7orf24 as gamma-glutamyl cyclotransferase An essential enzyme in the gamma-glutamyl cycle. J Biol Chem 2008; 283:22031-42. doi: 10.1074/jbc.M803623200 [Crossref] [ Google Scholar]
- Tang F, Xie C, Huang D, Wu Y, Zeng M, Yi L. Novel potential markers of nasopharyngeal carcinoma for diagnosis and therapy. Clin Biochem 2011; 44:711-8. doi: 10.1016/j.clinbiochem.2011.03.025 [Crossref] [ Google Scholar]
- Kim AD, Zhang R, Han X, Kang KA, Piao MJ, Maeng YH. Involvement of glutathione and glutathione metabolizing enzymes in human colorectal cancer cell lines and tissues. Mol Med Rep 2015; 12:4314-9. doi: 10.3892/mmr.2015.3902 [Crossref] [ Google Scholar]
- Gao R, Cheng J, Fan C, Shi X, Cao Y, Sun B. Serum Metabolomics to Identify the Liver Disease-Specific Biomarkers for the Progression of Hepatitis to Hepatocellular Carcinoma. Sci Rep 2015; 5:18175. doi: 10.1038/srep18175 [Crossref] [ Google Scholar]
- Leonel C, Gelaleti GB, Jardim BV, Moschetta MG, Regiani VR, Oliveira JG. Expression of glutathione, glutathione peroxidase and glutathione S-transferase pi in canine mammary tumors. BMC Vet Res 2014; 10:49. doi: 10.1186/1746-6148-10-49 [Crossref] [ Google Scholar]
- Shlomi T, Fan J, Tang B, Kruger WD, Rabinowitz JD. Quantitation of cellular metabolic fluxes of methionine. Anal Chem 2014; 86:1583-91. doi: 10.1021/ac4032093 [Crossref] [ Google Scholar]
- Upp JR, Jr Jr. , Saydjari R, Townsend CM, Jr, Singh P, Barranco SC, Thompson JC Polyamine levels and gastrin receptors in colon cancers. Ann Surg 1988; 207:662-9. doi: 10.1097/00000658-198806000-00004 [Crossref] [ Google Scholar]
- Anderson ME. Glutathione: an overview of biosynthesis and modulation. Chem Biol Interact 1998; 111-112:1-14. doi: 10.1016/s0009-2797(97)00146-4 [Crossref] [ Google Scholar]
- Mentch SJ, Mehrmohamadi M, Huang L, Liu X, Gupta D, Mattocks D. Histone methylation dynamics and gene regulation occur through the sensing of one-carbon metabolism. Cell Metab 2015; 22:861-73. doi: 10.1016/j.cmet.2015.08.024 [Crossref] [ Google Scholar]
- Smith EA, Macfarlane GT. Enumeration of human colonic bacteria producing phenolic and indolic compounds: effects of pH, carbohydrate availability and retention time on dissimilatory aromatic amino acid metabolism. J Appl Bacteriol 1996; 81:288-302. doi: 10.1111/j.1365-2672.1996.tb04331.x [Crossref] [ Google Scholar]
- Hirayama A, Kami K, Sugimoto M, Sugawara M, Toki N, Onozuka H. Quantitative metabolome profiling of colon and stomach cancer microenvironment by capillary electrophoresis time-of-flight mass spectrometry. Cancer Res 2009; 69:4918-25. doi: 10.1158/0008-5472.can-08-4806 [Crossref] [ Google Scholar]
- Lillehoj EP, Kato K, Lu W, Kim KC. Cellular and molecular biology of airway mucins. Int Rev Cell Mol Biol 2013; 303:139-202. doi: 10.1016/b978-0-12-407697-6.00004-0 [Crossref] [ Google Scholar]
- Gupta BK, Maher DM, Ebeling MC, Stephenson PD, Puumala SE, Koch MR. Functions and regulation of MUC13 mucin in colon cancer cells. J Gastroenterol 2014; 49:1378-91. doi: 10.1007/s00535-013-0885-z [Crossref] [ Google Scholar]
- Lin Y, Rao J, Zha X-l, Xu H. Angiopoietin-Like 3 Induces Podocyte F-Actin Rearrangement through Integrin /FAK/PI3K Pathway-Mediated Rac1 Activation. BioMed Res Int 2013; 2013:8. doi: 10.1155/2013/135608 [Crossref] [ Google Scholar]
- Entschladen F, Drell TLt, Lang K, Joseph J, Zaenker KS. Tumour-cell migration, invasion, and metastasis: navigation by neurotransmitters. Lancet Oncol 2004; 5:254-8. doi: 10.1016/s1470-2045(04)01431-7 [Crossref] [ Google Scholar]
- Zhao Z, Xiao Y, Elson P, Tan H, Plummer SJ, Berk M. Plasma lysophosphatidylcholine levels: potential biomarkers for colorectal cancer. J Clin Oncol 2007; 25:2696-701. doi: 10.1200/jco.2006.08.5571 [Crossref] [ Google Scholar]
- Kuliszkiewicz-Janus M, Tuz MA, Baczynski S. Application of 31P MRS to the analysis of phospholipid changes in plasma of patients with acute leukemia. BiochimBiophys Acta 2005; 1737:11-5. doi: 10.1016/j.bbalip.2005.08.019 [Crossref] [ Google Scholar]
- Santos CR, Schulze A. Lipid metabolism in cancer. FEBS J 2012; 279:2610-23. doi: 10.1111/j.1742-4658.2012.08644.x [Crossref] [ Google Scholar]
- Raynor A, Jantscheff P, Ross T, Schlesinger M, Wilde M, Haasis S. Saturated and mono-unsaturated lysophosphatidylcholine metabolism in tumour cells: a potential therapeutic target for preventing metastases. Lipids Health Dis 2015; 14:69. doi: 10.1186/s12944-015-0070-x [Crossref] [ Google Scholar]
- Hishikawa D, Hashidate T, Shimizu T, Shindou H. Diversity and function of membrane glycerophospholipids generated by the remodeling pathway in mammalian cells. J Lipid Res 2014; 55:799-807. doi: 10.1194/jlr.R046094 [Crossref] [ Google Scholar]