Bioimpacts. 11(2):101-109.
doi: 10.34172/bi.2021.17
Original Research
Classification of seed members of five riboswitch families as short sequences based on the features extracted by Block Location-Based Feature Extraction (BLBFE) method
Faegheh Golabi 1, 2  , Elnaz Mehdizadeh Aghdam 3, 4 , Mousa Shamsi 1, * , Mohammad Hossein Sedaaghi 5 , Abolfazl Barzegar 6 , Mohammad Saeid Hejazi 3, 4, *
Author information:
1Genomic Signal Processing Laboratory, Faculty of Biomedical Engineering, Sahand University of Technology, Tabriz, Iran
2Faculty of Advanced Medical Sciences, Tabriz University of Medical Sciences, Tabriz, Iran
3Molecular Medicine Research Center, Biomedicine Institute, Tabriz University of Medical Sciences, Tabriz, Iran
4Department of Pharmaceutical Biotechnology, Faculty of Pharmacy, Tabriz University of Medical Sciences, Tabriz, Iran
5Faculty of Electrical Engineering, Sahand University of Technology, Tabriz, Iran
6Research Institute of Bioscience and Biotechnology, University of Tabriz, Tabriz, Iran
Abstract
Introduction:
Riboswitches are short regulatory elements generally found in the untranslated regions of prokaryotes’ mRNAs and classified into several families. Due to the binding possibility between riboswitches and antibiotics, their usage as engineered regulatory elements and also their evolutionary contribution, the need for bioinformatics tools of riboswitch detection is increasing. We have previously introduced an alignment independent algorithm for the identification of frequent sequential blocks in the families of riboswitches. Herein, we report the application of block location-based feature extraction strategy (BLBFE), which uses the locations of detected blocks on riboswitch sequences as features for classification of seed sequences. Besides, mono- and dinucleotide frequencies, k-mer, DAC, DCC, DACC, PC-PseDNC-General and SC-PseDNC-General methods as some feature extraction strategies were investigated.
Methods:
The classifiers of the Decision tree, KNN, LDA, and Naïve Bayes, as well as k-fold cross-validation, were employed for all methods of feature extraction to compare their performances based on the criteria of accuracy, sensitivity, specificity, and f-score performance measures.
Results:
The outcome of the study showed that the BLBFE strategy classified the riboswitches indicating 87.65% average correct classification rate (CCR). Moreover, the performance of the proposed feature extraction method was confirmed with average values of 94.31%, 85.01%, 95.45% and 85.38% for accuracy, sensitivity, specificity, and f-score, respectively.
Conclusion:
Our result approved the performance of the BLBFE strategy in the classification and discrimination of the riboswitch groups showing remarkable higher values of CCR, accuracy, sensitivity, specificity and f-score relative to previously studied feature extraction methods.
Keywords: Riboswitches, Feature extraction, Block-finding algorithm, BLBFE, Classification
Copyright and License Information
© 2021 The Author(s)
This work is published by BioImpacts as an open access article distributed under the terms of the Creative Commons Attribution License (
http://creativecommons.org/licenses/by-nc/4.0/). Non-commercial uses of the work are permitted, provided the original work is properly cited.
Introduction
Riboswitches, usually found in the 5’-UTR of mRNA, act as specific and selective sensors of various intracellular ligands. In the mechanistic view, the riboswitches’ aptamer domain ligand binding triggers conformational changes of the expression platform leading to the downstream gene regulation.
1
The rise in antibiotic resistance, as well as limitations in available effective antibiotics, motivate the scientists in the field to seek novel antibacterial compounds to battle these life-threatening phenomena.
2
Since the discovery of riboswitches, they were proposed as promising antibacterial targets for the following reasons.
3,4
First, the high selectivity and specificity of riboswitches propose them as suitable RNA receptors in antibacterial compound design.
5
Second, limited distribution of riboswitches mostly in prokaryotes,
6
theoretically prevents cross-reactivity of candidate bacterial riboswitch sensing compounds with nonbacterial, especially eukaryotic cells. Third, riboswitches are present in the mRNA of survival or/and virulence genes,
7
as a result, targeting of such riboswitches enhances the possibility of developing bactericidal or bacteriostatic compounds with a different mechanism. Accordingly, several types of riboswitches have been applied for antibiotic development.
4,8-10
However, few successful compounds have been introduced, so far. One of the latest and promising compounds, “Ribocil”, was developed as a bacteriostatic compound and a highly robust riboflavin riboswitches inhibitor by Merck company.
11
On the other side, mutations in riboswitches could give rise to ligand and antibiotic resistance. It is reported that some well-known antibiotics exert their effects via specific or unspecific binding to different classes of riboswitches. For example, roseoflavin
12
and pyrithiamine,
13
are specific binders of FMN and TPP riboswitches, respectively, and conformational changing mutations in the riboswitches could trigger the antibiotic resistance occurrences in bacteria.
Overall, riboswitches are important platforms regarding drug design researches. Furthermore, they could be applied to design robust artificial regulatory elements in constructs using for gene therapy,
14
biosensors,
15
etc. Besides, riboswitches are important sequences from the evolutionary point of view and one of the evidence of RNA world hypothesis.
16
As a result, any tools to find and introduce new representatives of known/unknown riboswitches could be a significant aid in the field.
Nowadays, more than 40 different classes of riboswitches have been reported.
17
Each class is usually nominated based on the ligand that binds to the riboswitches specifically and selectively. Some other riboswitches are assigned as “orphan riboswitches” as their ligands are unknown, however, their sequence and structure highly resemble a riboswitch pattern.
18,19
As, the aptamer domain of the riboswitches are the most highly conserved sequences in the biological world, the most common strategy to detect known riboswitches is the use of comparative sequence analysis computational tools.
20
In this way variants of a known riboswitch class can be found by detecting sequences with higher sequence identity and secondary structure model of the corresponding riboswitch class.
17
Accordingly, various methods including hidden Markov models (HMM),
21,22
context-sensitive HMMs (cs-HMM),
23
profile-HMM,
24
and CM or covariance model
25
have been developed to classify the riboswitches. However, such methods have limitations mainly outliers that do not fit with consensus sequences or secondary structures, and also rely on a large database for alignment and homology search.
This is why we have recently developed an alignment-free method of block finding which detects common sequential blocks in riboswitch classes.
26
The method was able to spot 21 particular blocks with the size of 3 to 9 nucleotides to verify riboswitch families of FMN, PreQ1, Purine, SAM and TPP. Using the positions of detected blocks, a new feature extraction method called “block location-based feature extraction” (BLBFE) was designed and used for the classification of 400 random “full” sequences from 5 mentioned riboswitch families.
27
Moreover, seven other families of riboswitches including cobalamin, cyclic-di-GMP-I, glycine, lysine, SAH, SAM-alpha, and SAM-IV riboswitches were studied using the block finding algorithm and BLBFE.
28
In the present study, we used the BLBFE method to classify the seed members of FMN, PreQ1, Purine, SAM, and TPP riboswitch families, based on their family-specific blocks. Mono- and dinucleotide frequencies, k-mer, DAC, DCC, DACC, PC-PseDNC-General and SC-PseDNC-General, as seven separate feature extraction methods, were also considered for their comparative performances against the BLBFE method.
29,30
Decision tree,
31
k-nearest neighbors (KNN),
32
linear discriminant analysis (LDA)
33
and Naïve Bayes
34-36
classifiers accompanied by k-fold cross-validation
37
were utilized to detect the classes of riboswitches with all feature extraction methods. Applying the confusion matrices, the calculation of the performance measures including accuracy, sensitivity, specificity and f-score were carried out to compare the performance efficacy and validity of BLBFE and the other feature extraction methods in the categorization of the riboswitches.
Materials and Methods
Datasets
The seed members of riboswitches families of FMN, PreQ1, Purine, SAM, and TPP, containing 144, 41, 133, 433, and 115 members in each class, respectively, were included in this study (Table 1). Datasets were acquired from the Rfam 12.0 database.
38,39
Table 1.
The seed data related to five families of riboswitches employed in this study, obtained from the Rfam 12.0 database
|
Rfam accession number
|
Riboswitch family name
|
Number of seed data
|
| RF00050 |
FMN |
144 |
| RF00522 |
PreQ1 |
41 |
| RF00167 |
Purine |
133 |
| RF00162 |
SAM |
433 |
| RF00059 |
TPP |
115 |
Feature extraction
The proposed method of feature extraction
We applied a new feature extraction strategy for the classification of riboswitches.
30
In this approach, we used the positions of family-specific sequential blocks on different riboswitches as features. The sequential blocks were detected using our former described sequential block finding technique.
29
The method is specific for being an alignment-free based method, searching for the presence of conserved motifs in the members of each riboswitch family and determines the sequential blocks characterization of each family. The family-specific sequential blocks for 5 riboswitch classes used in the present study are listed in Table 2.
Table 2.
The identified frequent blocks for 5 riboswitch families using block finding algorithm.
|
Blocks
|
Riboswitch family name
|
| ACCG, CCGAC, CGGU, GGAUG, GGGC, GGUG, UCCC |
FMN |
| AAAAAACUA, CCC, GGUUC |
PreQ1 |
| UAUA, UCUACC |
Purine |
| AGA, AUC, GAGGGA, GCAACC, GCCC, GUGC |
SAM |
| ACCUG, CUGAGA, GGG |
TPP |
In BLBFE, the observations related to riboswitch family members were produced according to the incidence and the location of the blocks in the sequences. The location of the blocks in the sequence was determined by the start nucleotide of each block. The location was set to zero and for the absent blocks in the sequence. For example, in the sample sequence of:
"CCGCAUUCUCAGGGCAGGGUGAAAUUCCCUACUGGCGGUCAAGCCCGCGAGCGUUUGUUAUAAGG"
the sample blocks of ‘GCCC’, ‘UAUA’ and ‘GGUG’ are present in locations of 43, 59 and 18 from the start of the sequence, respectively. This is while the sample blocks of ‘GGUUC’, ‘GCAACC’, ‘GUGC’ and ‘ACCG’ are absent and their locations are considered as zero. This means that considering the template of [GGUUC, GCCC, GCAACC, GUGC, UAUA, GGUG] and using the proposed method of BLBFE, the sample sequence above is converted to an array with the length equal to the number of blocks: [0, 43, 0, 0, 59, 18, 0]
Accordingly, each riboswitch in each class was represented by an observation. As 21 blocks are detected for 5 families, the produced observations were 1 by 21 arrays and the value of observations equated to the members of five riboswitch families. The sequences were then classified into their associated families utilizing the generated observations.
Nucleotide frequency-based method
The mononucleotide and dinucleotide frequencies of sequences were used as features.
40
This means that occurrences of 4 mononucleotide motifs (A, C, G, U) and 16 dinucleotide motifs (AA, AC, AG, AU, CA, CC, CG, CU, GA, GC, GG, GU, UA, UC, UG, and UU) for each riboswitch sequence were counted and put into a 1 by 20 array for each sequence, accordingly. Once more, the classifiers were utilized for the produced observations.
Nucleic acid composition (basic k-mer)
In this approach, to reflect RNA sequence’s local or short-range sequence compositions the incidence frequencies of k neighboring nucleic acids (k-mers) were applied.
41
Autocorrelation
Three modes are presented to show the correlation between two dinucleotides within an RNA sequence indicating their physicochemical properties: Dinucleotide based autocovariance (DAC), dinucleotide based cross-covariance (DCC), and dinucleotide based auto-cross covariance (DACC) that combines DAC and DCC.
42-44
Pseudo nucleotide composition
Two schemes fall into these categories: 1) General parallel correlation pseudo dinucleotide composition (PC-PseDNC-General) which generated the parallel correlation components for RNA sequences via the physicochemical properties. 2) General series correlation pseudo dinucleotide composition (SC-PseDNC-General) which generated the corresponding series correlation components via the equal style.
42,45
Pse-in-One web server applied the three described methods of feature extraction, nucleic acid composition (basic k-mer), autocorrelation and pseudo nucleotide composition.
29,30
Cross-validation
The generalization of the classifiers was validated using k-fold cross-validation (CV),
37
which is the most popular cross-validation procedure due to its mild computational cost. It confirms the difference between training and validation sets. In the standard k-fold cross-validation, the initial training data is randomly split into k partitions (folds) of almost equal cardinality. The classification algorithm is iteratively trained on k-1 folds while using the remaining fold (called the “holdout fold”) as the validation set. The mean of the correct classification levels of k stages shows the overall correct classification rate (CCR). Here, k=10 folds was used because of suitably low computational cost in addition to the good error estimation.
33,46-48
The classifiers
To compare the performances of the proposed feature extraction methodology and previously studied feature extraction approaches, four classifiers were employed.
Decision tree classifier
Indecision tree learning, a common data mining method, a predictive model is created to produce an output variable using several input variables. For this, the observations are represented in the branches while the conclusions about the class label of any data are shown in the leaves.
31
K-nearest neighbors (KNN) classifier
In this type of classification, an input data is categorized into a certain class, based on a greater number of votes of the class’s K nearest neighbors. K is typically equivalent to a positive number of classes.
32
Accordingly, the K was equaled to 5 in this study.
Linear discriminant analysis (LDA) classifier
This is a method for pattern recognition, machine learning, and statistics, to separates or characterizes two or more classes of items using a linear combination of features.
33
Naïve Bayesian classifier
This is a simple probabilistic classifier used in machine learning. Moreover, this classifier is assuming strong (naïve) independence between the features, using Bayes' theorem. It means the independence of the value of a particular feature from the value of other features.
34-36
Evaluation of classifiers' performance
Based on the confusion matrices, the equations (1) to (4) were used to calculate the accuracy, sensitivity, specificity, and f-score as important performance factors
49-51
:
The number of members of each class that are classified into their true class is denoted by TP. On the other hand, FP shows the number of false positives, the sequences which are falsely annotated to a class. Also, TN and FN are the number of true negatives and false negatives, respectively.
Moreover, the CCR for each classification was calculated by dividing the number of total truly classified sequences (sum of TPs for all families) by the total number of classified sequences and was reported as a percentage. The illustration of the current study’s program flow is shown in Fig. 1.
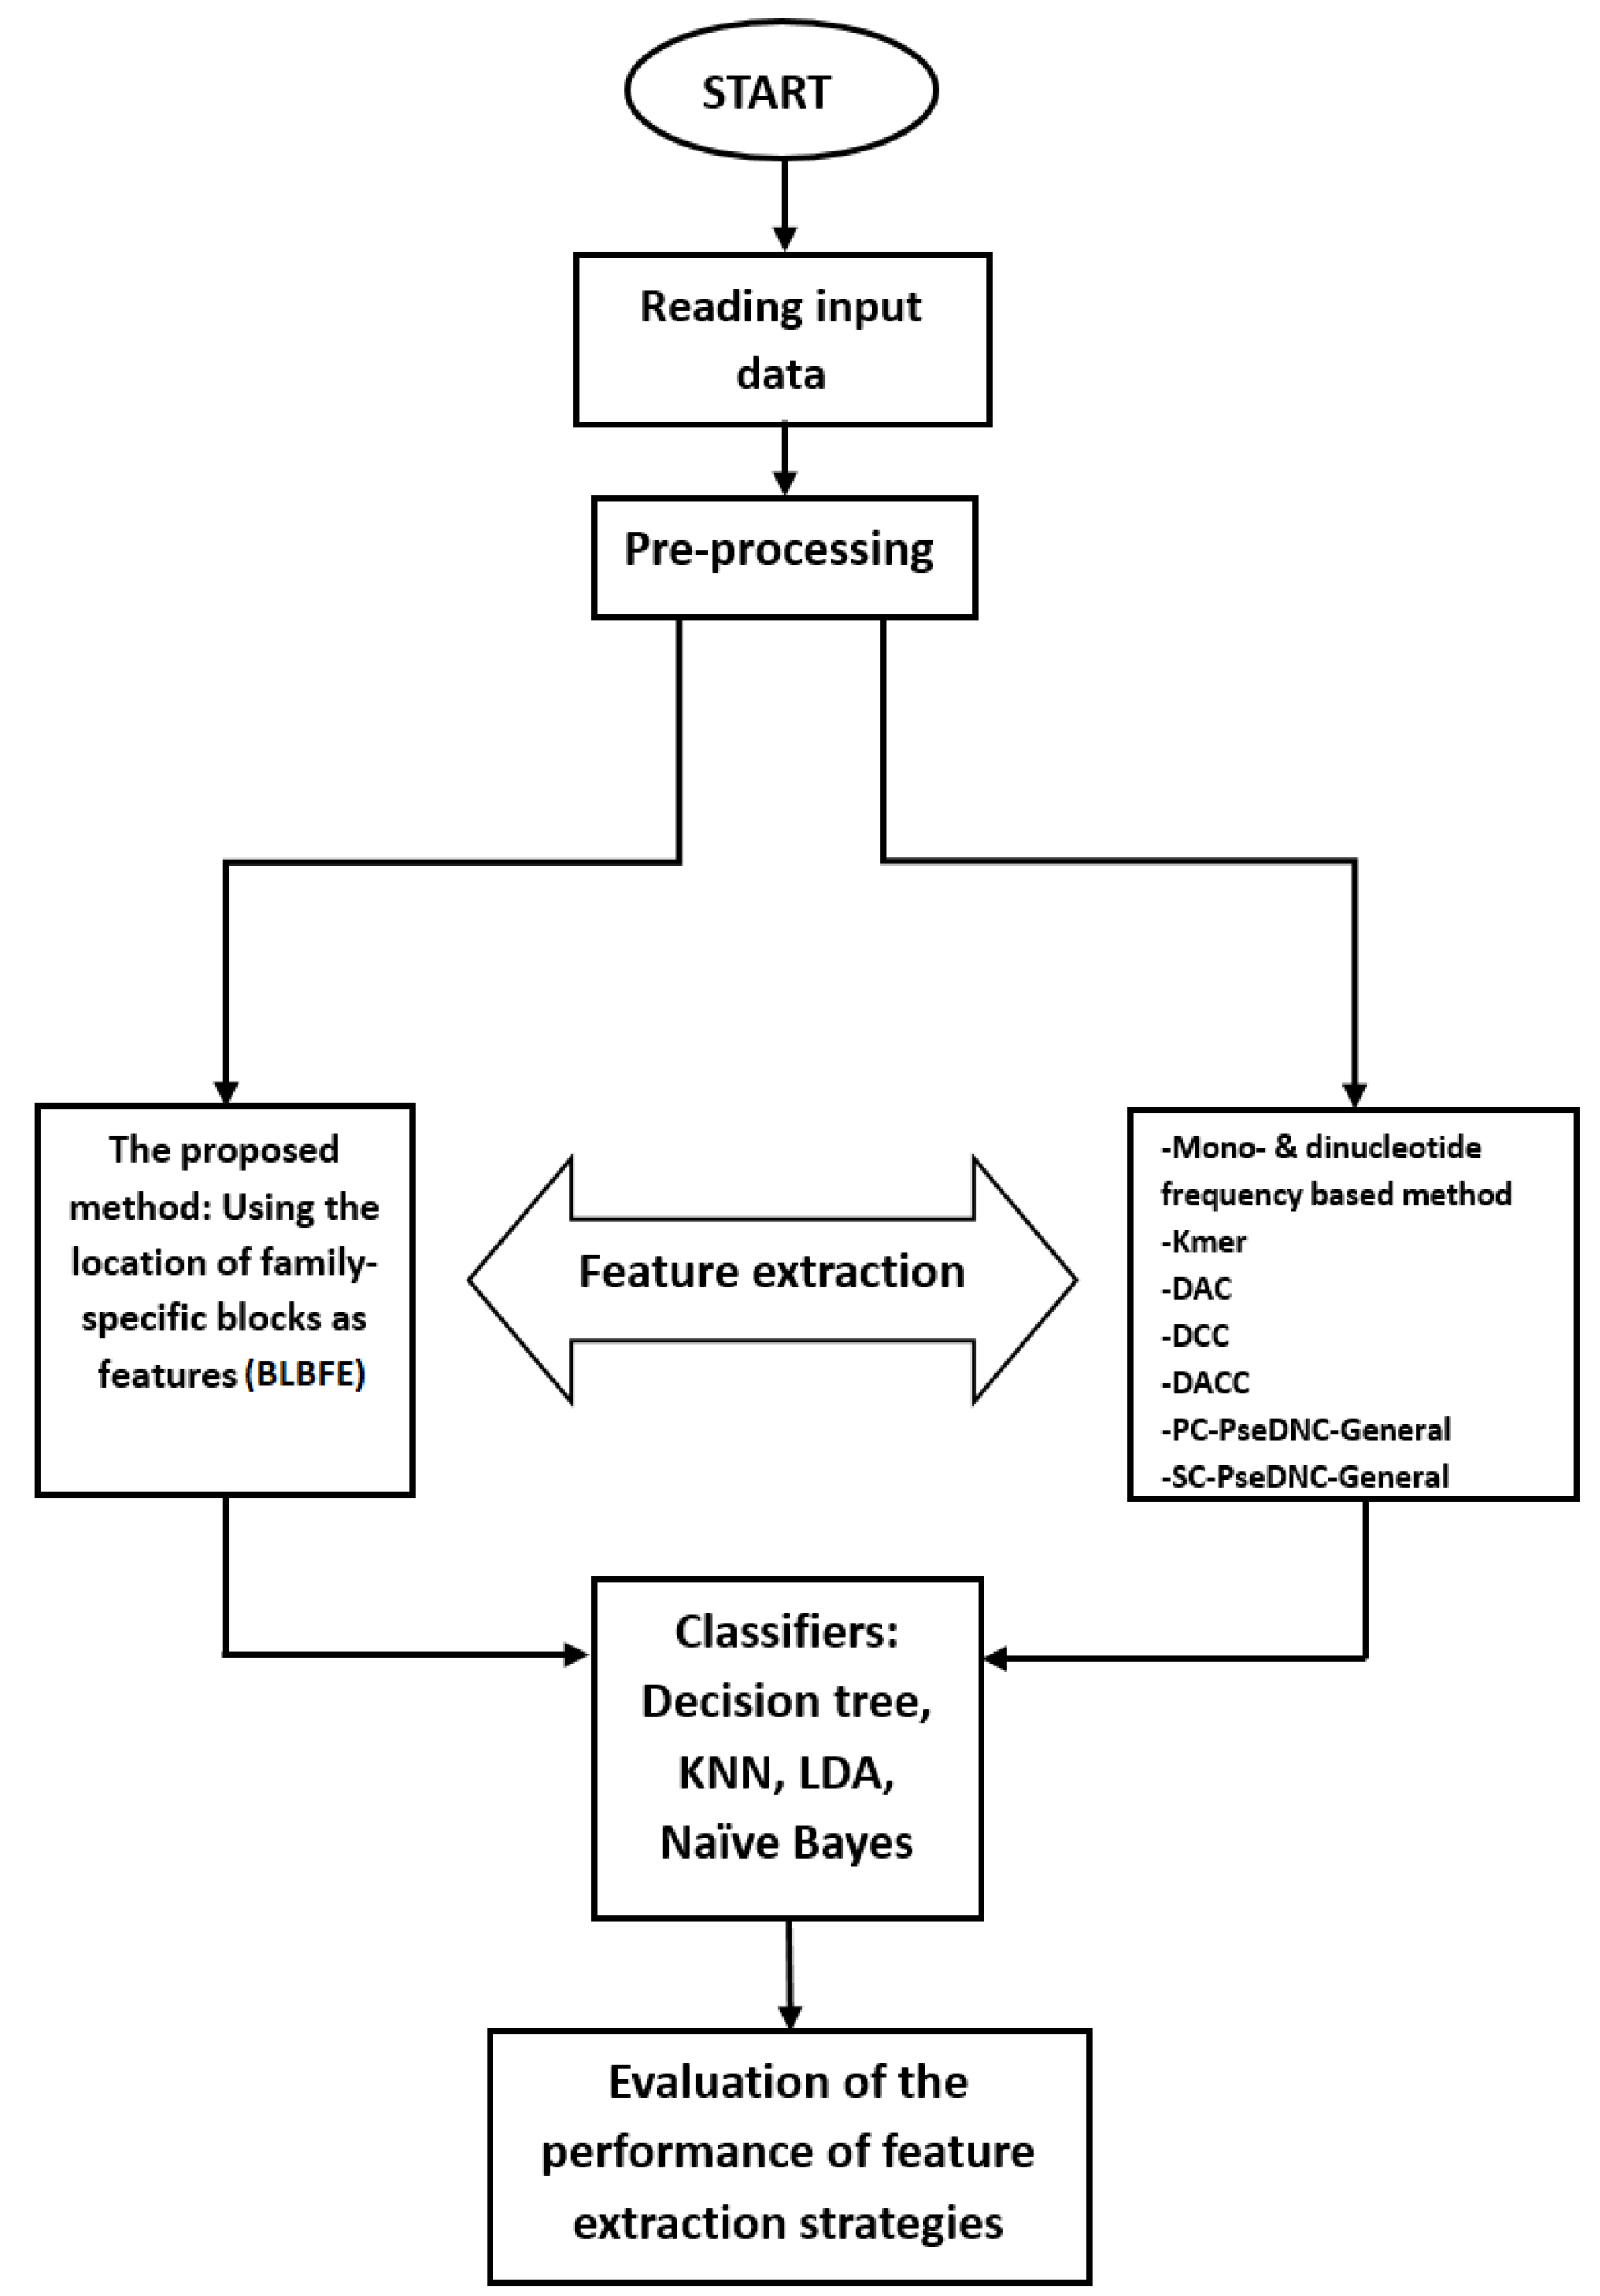
Fig. 1.
The program flow of this study is illustrated. The BLBFE method, as well as 7 other feature extraction methods, are used for the riboswitches and their classification performances were evaluated and compared.
.
The program flow of this study is illustrated. The BLBFE method, as well as 7 other feature extraction methods, are used for the riboswitches and their classification performances were evaluated and compared.
Results and Discussion
Classification results
In our previous study, the successful application of a sequential based block finding algorithm was shown to be used for the detection of family-specific blocks of the riboswitches.
26
In this method, the detection and determination of 21 specific blocks [GGGC, GGUG, UCCC, ACCG, CGGU, CCGAC, GGAUG, GGUUC, CCC, AAAAAACUA, UAUA, UCUACC, AUC, AGA, GAGGGA, GCCC, GCAACC, GUGC, GGG, CUGAGA, ACCUG] were carried out for 5 riboswitches families. Later, we proposed a BLBFE method which creates annotations for riboswitch classes.
27,28
Using the same method in the present study, the locations of the 21 detected blocks were taken as family members’ features which led to 1 by 21 arrays of observations. Every array represents each riboswitch sequence for the developed classifier. Consequently, as 866 members were present in the five studied riboswitch classes, 866 arrays were generated of 1 by 21 observations.
The frequency of 20 mono- and dinucleotides including A, C, G, U, AA, AC, AG, AU, CA, CC, CG, CU, GA, GC, GG, GU, UA, UC, UG, and UU in all of 866 members, were considered as the second set of features, resulting in the generation of 866 arrays of 1 by 20 as observations. In addition, 866 observation arrays of 1 by 16 were obtained using the k-mer technique of feature extraction with k=2 to produce pseudo components for 866 riboswitches.
The DAC approach of feature extraction with lag=4 resulted in 24 features and generated 866 arrays of 1 by 24 observations. Also, the feature extraction methods of DCC and DACC with lag=1, produced 866 observation arrays of 1 by 30 and 866 observation arrays of 1 by 36, respectively. The "slide", "roll", "rise", "shift", "tilt" and "twist" were chosen as the physicochemical features for DAC, DCC and DACC methods.
Furthermore, 26 and 22 features were generated considering lambda=10 for the PC-PseDNC-General and lambda=1 for the SC-PseDNC-General methods, respectively, with weight=0.5 for both of them. Therefore, PC-PseDNC-General and SC-PseDNC-General methods generate 866 observation arrays of 1 by 26 and 866 observation arrays of 1 by 22, respectively. Similarly, the "slide", "roll", "rise", "shift", "tilt" and "twist" were chosen as physicochemical features for the last described methods of feature extraction.
When using any of the 8 methods of feature extraction, 144, 41, 133, 433, and 115 observations out of the 866 ones belonged to FMN, PreQ1, Purine, SAM, and TPP families, respectively. Decision tree, KNN, LDA, and Naïve Bayes classifiers along with the 10-fold cross-validation were utilized for each set of observations and correct and incorrect classification of riboswitches for every set were considered to calculate the corresponding CCRs.
The CCRs of the classifications are shown in Fig. 2. Using the BLBFE method, the highest CCR with 96.88% belonged to the KNN classifier while the CCR of 63.97% for the Naïve Bayes classifier indicated a poor performance. Among the eight studied feature extraction methods, the proposed method of BLBFE showed the highest level of 89.45% for the mean CCR of four classifiers. Using the mono- and dinucleotide frequency-based method, the mean CCR level decreased to 76.03%. The methods of feature extraction other than BLBFE also showed relatively less CCR. The value of average CCRs for the different methods of k-mer, DAC, DCC, DACC, PC-PseDNC-General and SC-PseDNC-General were 75.24%, 70.76%, 76.88%, 76.61%, 72.77% and 75.7%, respectively.
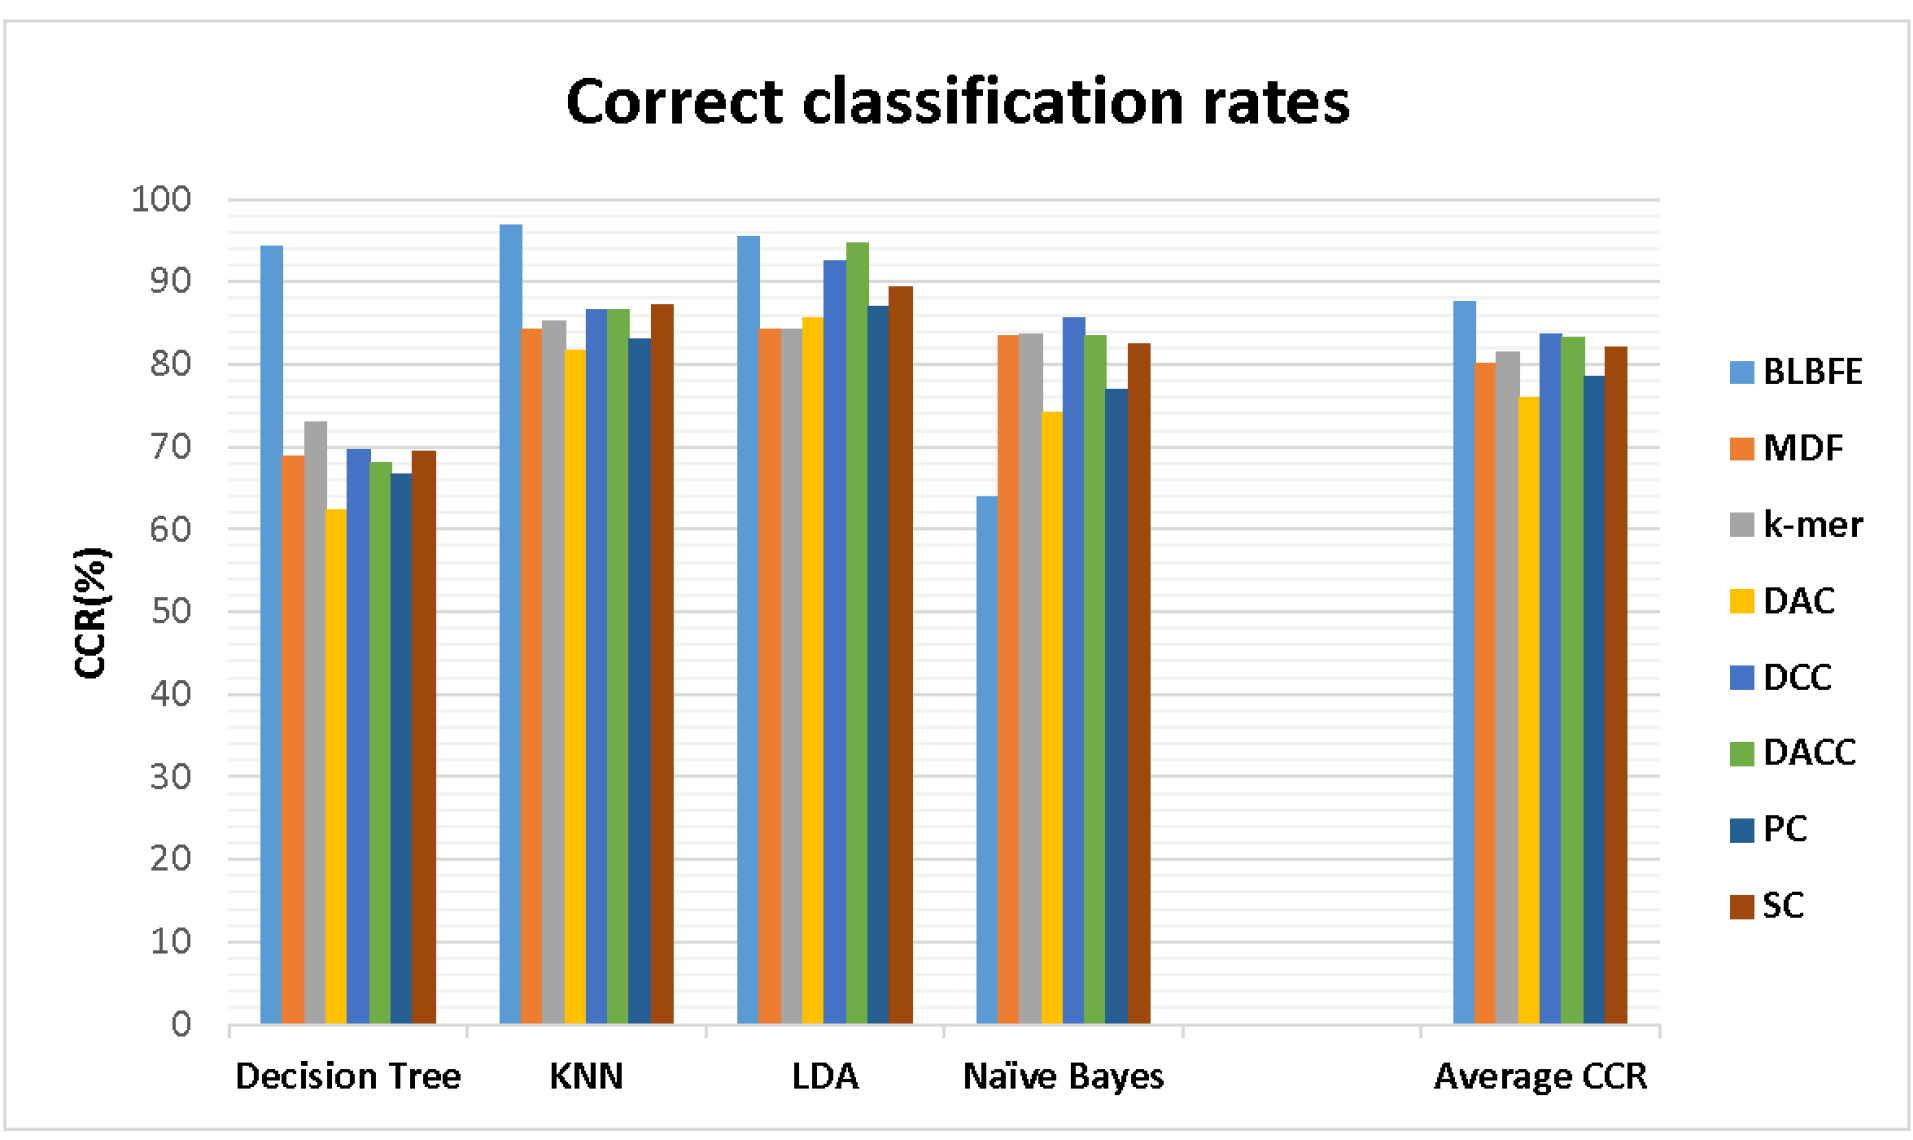
Fig. 2.
The Correct classification rates for the 4 classifiers using 8 methods of feature extraction were shown. The methods are including BLBFE: the block location-based method, MDF: mono- and dinucleotide frequency-based method, k-mer: nucleic acid composition by basic k-mer, DAC: dinucleotide based autocovariance, DCC: dinucleotide based cross-covariance, DACC: dinucleotide based auto-cross covariance, PC-PseDNC-General: General parallel correlation pseudo dinucleotide composition and SC-PseDNC-General: General series correlation pseudo dinucleotide composition.
.
The Correct classification rates for the 4 classifiers using 8 methods of feature extraction were shown. The methods are including BLBFE: the block location-based method, MDF: mono- and dinucleotide frequency-based method, k-mer: nucleic acid composition by basic k-mer, DAC: dinucleotide based autocovariance, DCC: dinucleotide based cross-covariance, DACC: dinucleotide based auto-cross covariance, PC-PseDNC-General: General parallel correlation pseudo dinucleotide composition and SC-PseDNC-General: General series correlation pseudo dinucleotide composition.
Evaluation results
The multiclass confusion matrix presentation for the decision tree classifier with the BLBFE method is shown in Table 3. As mentioned before, TP is the number of true positives, TN reflects the number of true negatives, FP shows the number of false positives and FN represents the number of false negatives. The multiclass confusion matrices for KNN, LDA and Naïve Bayes classifiers with the BLBFE method are represented in the supplementary file. The multiclass confusion matrices were also generated for the other seven feature extraction techniques. Consequently, according to the confusion matrices, the measures of accuracy, sensitivity, specificity, and f-score for all classifiers were calculated based on the BLBFE method and presented in Table 4.
Table 3.
The confusion matrix for the decision Tree classifier, when using the BLBFE method
|
Riboswitch Families: Predicted/True
|
FMN
|
PreQ1
|
Purine
|
SAM
|
TPP
|
TP
|
TN
|
FP
|
FN
|
| FMN |
141 |
2 |
0 |
0 |
1 |
141 |
675 |
14 |
3 |
| PreQ1 |
1 |
36 |
3 |
1 |
0 |
36 |
780 |
8 |
5 |
| Purine |
6 |
5 |
112 |
6 |
5 |
112 |
704 |
6 |
21 |
| SAM |
0 |
1 |
1 |
426 |
5 |
426 |
390 |
12 |
7 |
| TPP |
7 |
0 |
2 |
5 |
101 |
101 |
715 |
10 |
14 |
Table 4.
Performance measures for 8 feature extraction methods used in 4 classifiers
|
|
|
BLBFE
|
MDF
|
k-mer
|
DAC
|
DCC
|
DACC
|
PC
|
SC
|
|
CCR
|
Decision Tree |
94.23
|
68.94 |
73.09 |
62.36 |
69.63 |
68.13 |
66.74 |
69.4 |
| KNN |
96.88
|
84.18 |
85.22 |
81.64 |
86.61 |
86.72 |
83.14 |
87.3 |
| LDA |
95.5
|
84.18 |
84.3 |
85.68 |
92.61 |
94.69 |
87.07 |
89.38 |
| Naïve Bayes |
63.97 |
83.49 |
83.6 |
74.13 |
85.57
|
83.49 |
76.91 |
82.45 |
|
Accuracy
|
Decision Tree |
97.61
|
85.22 |
87.52 |
81.27 |
85.54 |
84.6 |
83.87 |
85.39 |
| KNN |
98.73
|
93.22 |
93.72 |
91.94 |
94.27 |
94.31 |
92.7 |
94.64 |
| LDA |
98.16
|
93.23 |
93.3 |
93.88 |
96.94 |
97.83 |
94.54 |
95.54 |
| Naïve Bayes |
82.72 |
92.87 |
92.97 |
88.24 |
93.78
|
92.79 |
89.58 |
92.42 |
|
Sensitivity
|
Decision Tree |
91.23
|
62.49 |
68.79 |
55.22 |
62.81 |
58.59 |
60.85 |
62.85 |
| KNN |
95.4
|
80.68 |
81.29 |
76.43 |
82.27 |
82.58 |
79.45 |
83.68 |
| LDA |
93.75 |
85.44 |
86.09 |
86.96 |
92.21 |
95.65
|
89.25 |
90.33 |
| Naïve Bayes |
59.66 |
80.22 |
80.55
|
65.02 |
78.77 |
77.1 |
71.48 |
77.36 |
|
Specificity
|
Decision Tree |
98.35
|
88.15 |
90.44 |
85.06 |
88.68 |
87.83 |
87.2 |
88.71 |
| KNN |
99.04
|
94.43 |
94.7 |
93.46 |
95.51 |
95.63 |
94.24 |
95.56 |
| LDA |
98.83
|
95.38 |
95.41 |
95.85 |
97.84 |
98.48 |
96.39 |
97.04 |
| Naïve Bayes |
85.57 |
94.05 |
94.14 |
89.94 |
94.76
|
94.1 |
91.49 |
93.63 |
|
f-score
|
Decision Tree |
91.09
|
62.89 |
68.35 |
54.69 |
63.53 |
59.64 |
60.19 |
62.6 |
| KNN |
95.88
|
81.88 |
83.25 |
78.6 |
84.03 |
83.98 |
80.64 |
85.2 |
| LDA |
93.85 |
83.81 |
84.33 |
85.28 |
92.09 |
94.94
|
87.32 |
88.23 |
| Naïve Bayes |
60.69 |
82.14 |
82.22
|
68.12 |
81.86 |
79.48 |
72.36 |
79.05 |
The highest value in each row is bolded.
The calculated performance measures for the studied classifiers according to the feature extraction methods are presented in Table 4. For each classifier, the highest measure among the feature extraction methods is bolded. As can be seen, the BLBFE method showed the best performance according to all five factors of CCR, accuracy, sensitivity, specificity and f-score for the decision tree as well as KNN classifiers. Also, LDA classifier, showed reasonably good performance based on 3 measures of CCR, accuracy and specificity, while the two factors of sensitivity and f-score were also acceptably high. Only the naïve Bayes classifier performed relatively poor in company with the BLBFE method.
All the studied BLBFE method’s performance parameters are also demonstrated in Fig. 3. Accordingly, the best performance with the accuracy of 98.73 % was shown for the KNN classifier, which is the highest among 4 classifiers. This is while the Naïve Bayes classifier with an accuracy of 82.72% showed the poorest performance. This result was also confirmed by other evaluation measures. The highest sensitivity also belonged to KNN classifier which equals 95.4% and the lowest sensitivity was 59.66% for the Naïve Bayes classifier. The specificity factor of 99.04% was shown for the KNN classifier was whereas the lowest specificity of 85.57% was presented for the Naïve Bayes classifier. All the same, the highest f-score of 95.88% is presented for the KNN classifier. Similarly, the Naïve Bayes classifier showed the lowest f-score of 60.69 %.
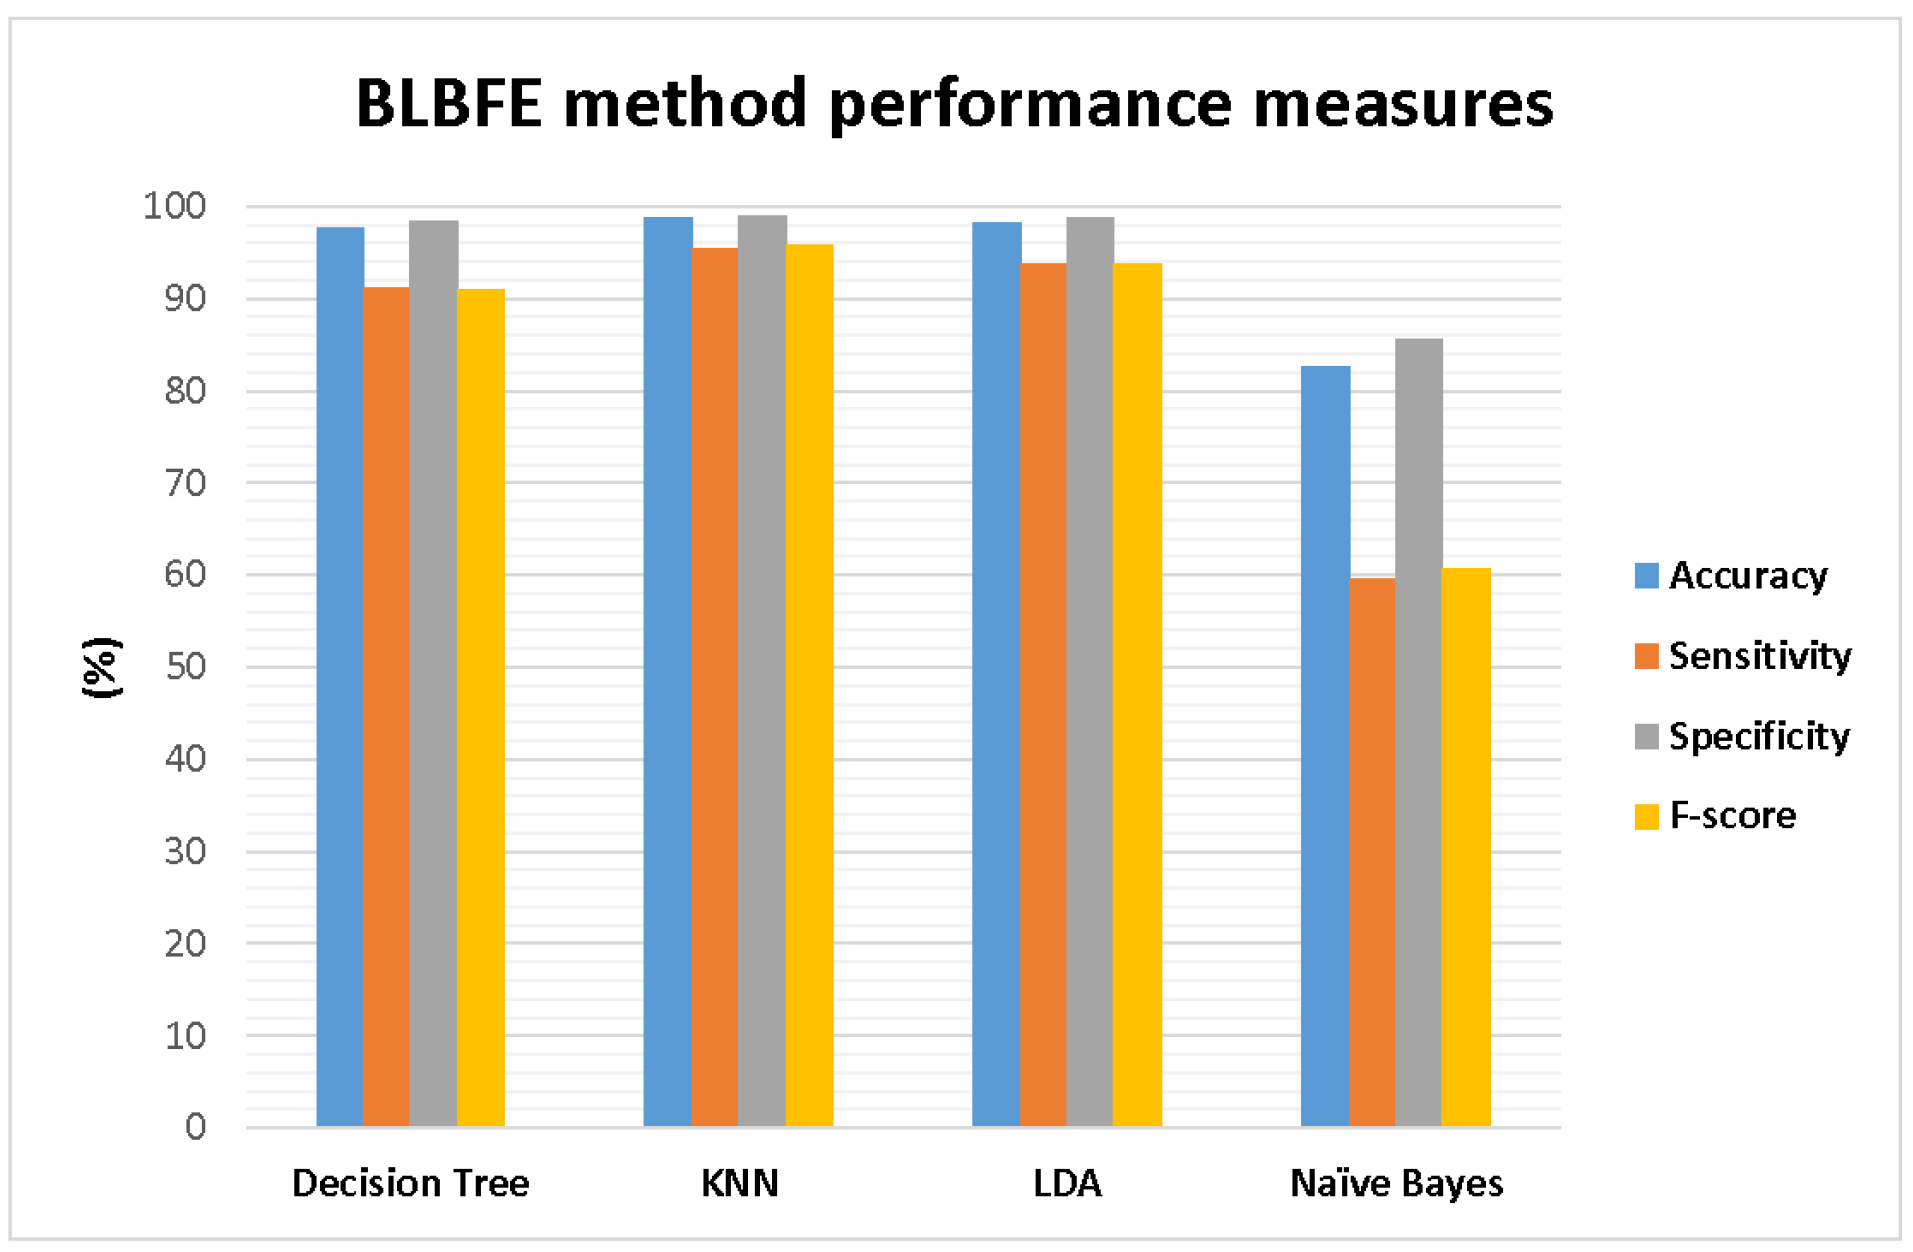
Fig. 3.
The performance measures of accuracy, sensitivity, specificity, and F-score for the proposed method of BLBFE applied in 5 classifiers.
.
The performance measures of accuracy, sensitivity, specificity, and F-score for the proposed method of BLBFE applied in 5 classifiers.
Fig. 4A-D shows accuracy, sensitivity, specificity, and f-score parameters regarding all the methods of feature extraction in addition to the average performance measures for each method.
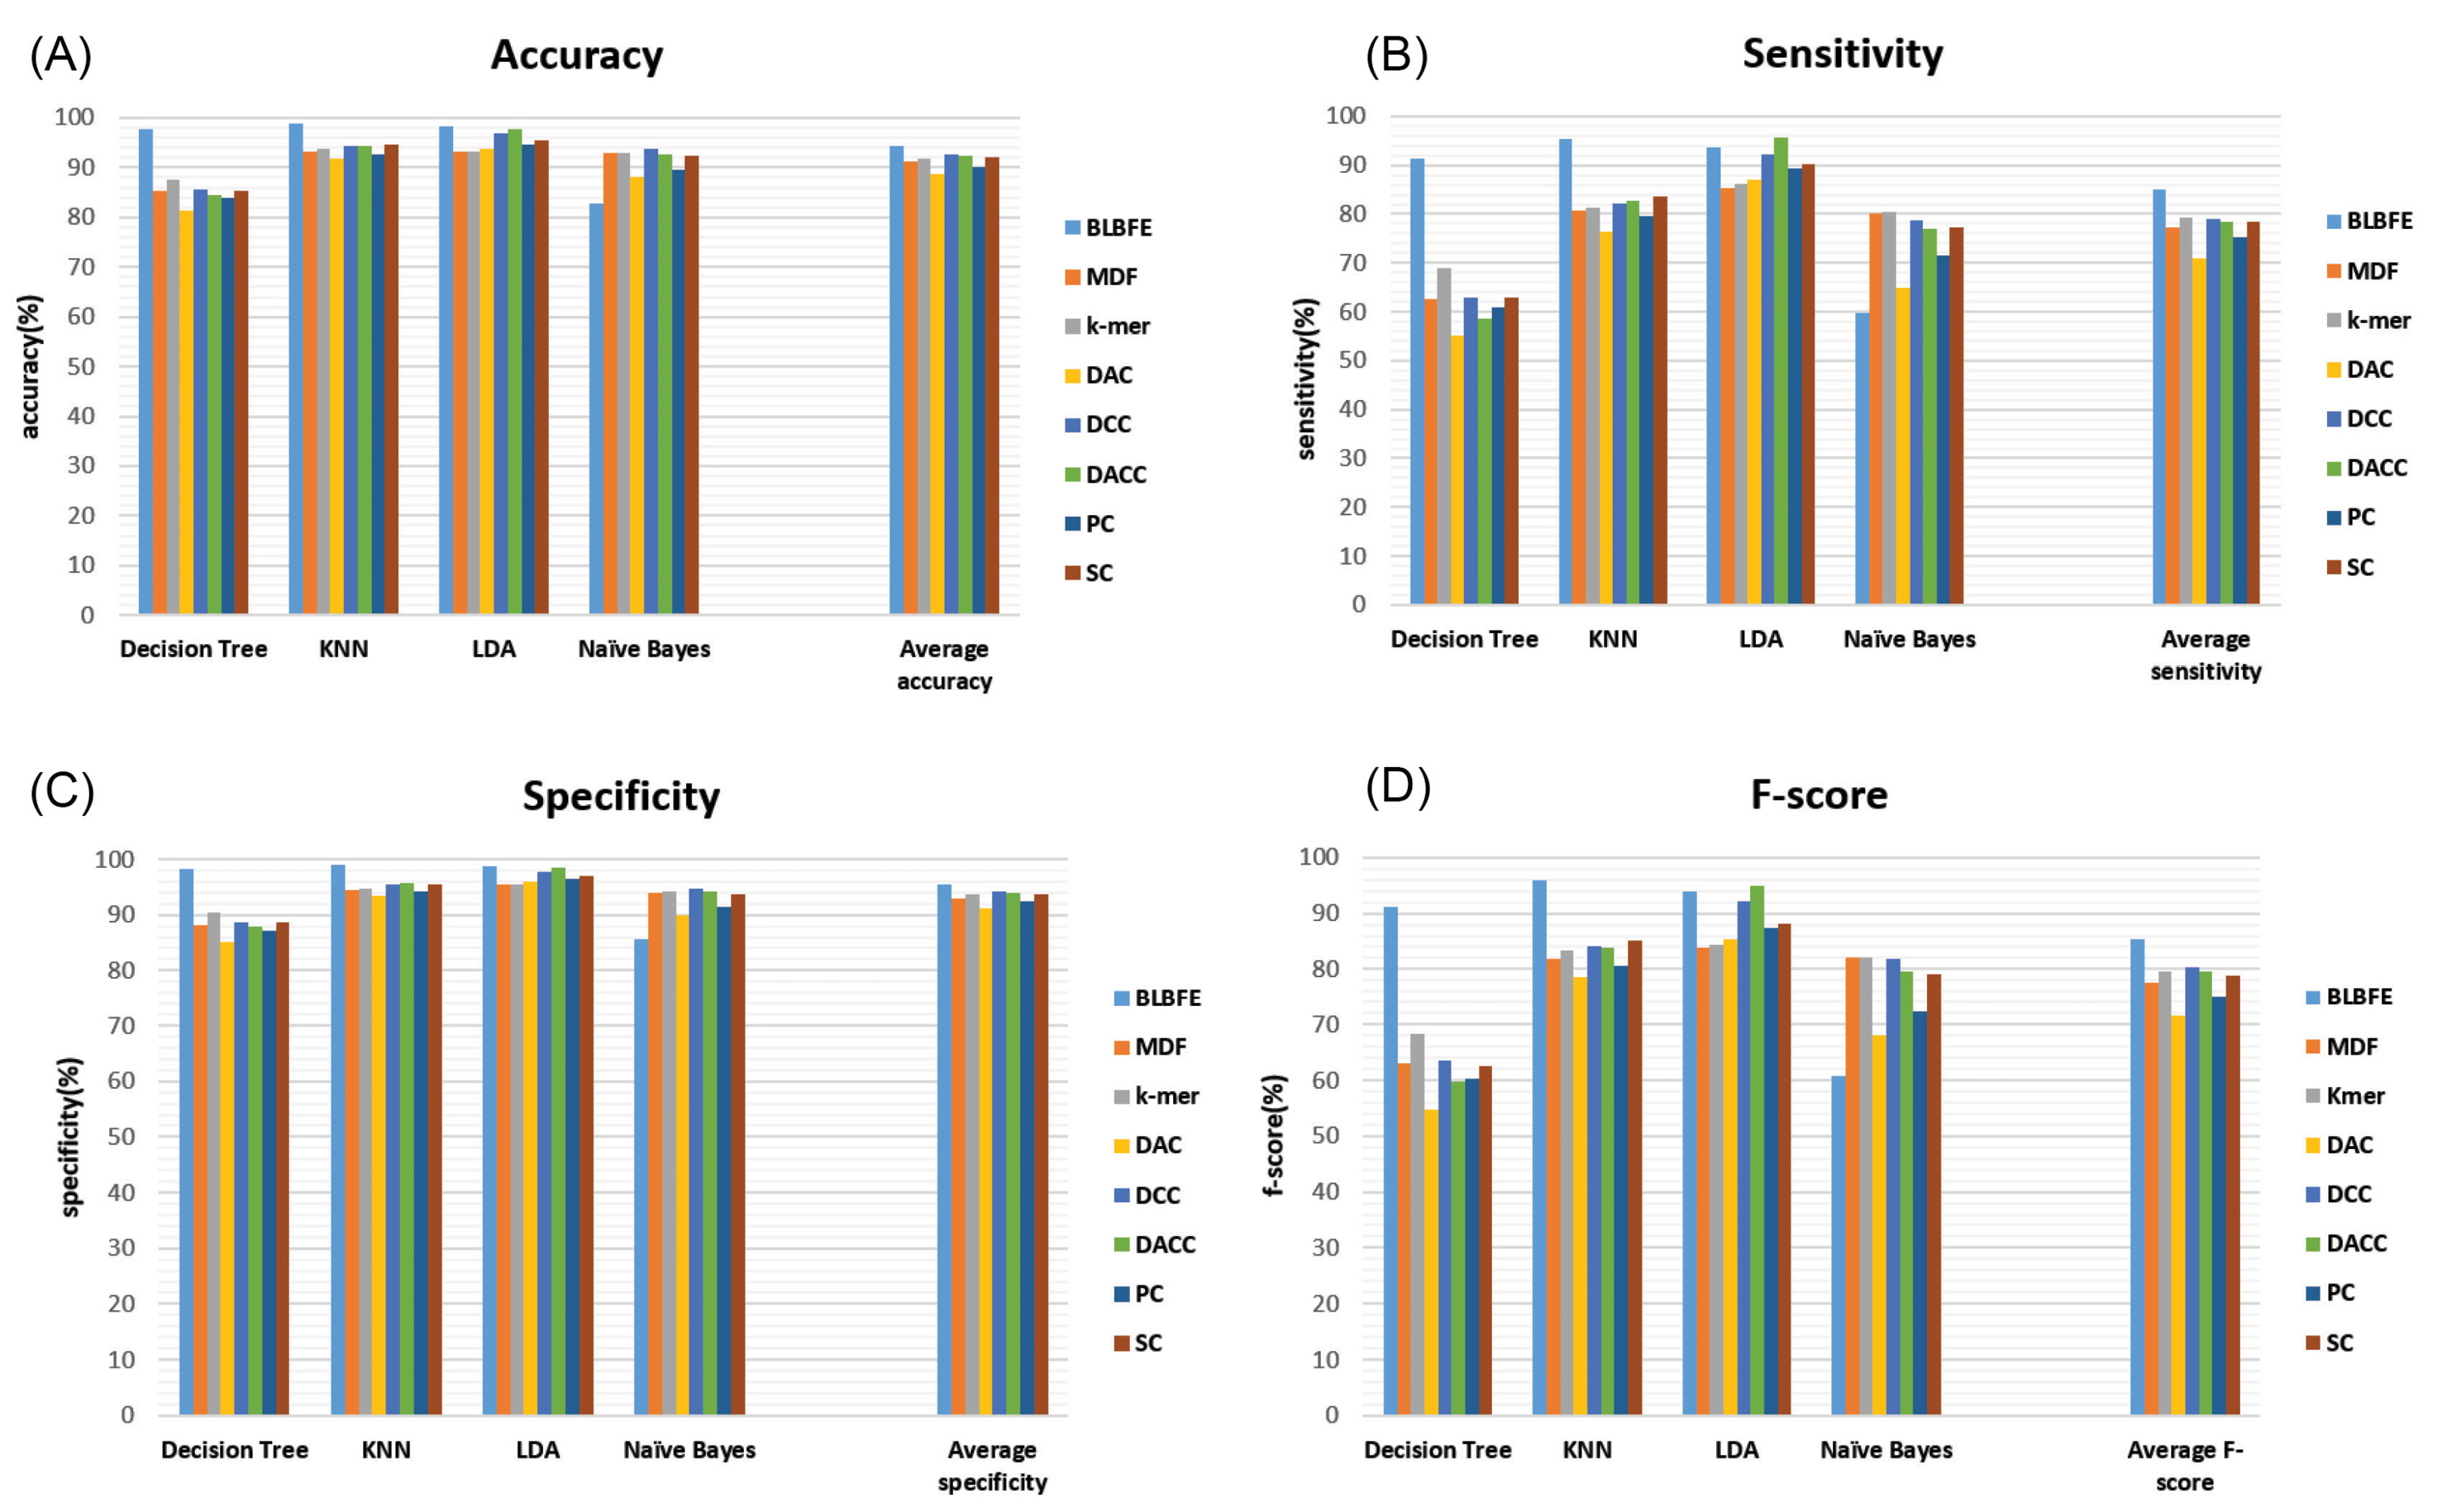
Fig. 4.
Comparison of performance measures of classifiers using 8 methods of feature extraction, BLBFE: the block location-based method, MDF: mono- and dinucleotide frequency-based method, k-mer: nucleic acid composition by basic k-mer, DAC: dinucleotide based autocovariance, DCC: dinucleotide based cross-covariance, DACC: dinucleotide based auto-cross covariance, PC-PseDNC-General: General parallel correlation pseudo dinucleotide composition and SC-PseDNC-General: General series correlation pseudo dinucleotide composition, (a) accuracy, (b) sensitivity, (c) specificity and (d) F-score, calculated based on the confusion matrices.
.
Comparison of performance measures of classifiers using 8 methods of feature extraction, BLBFE: the block location-based method, MDF: mono- and dinucleotide frequency-based method, k-mer: nucleic acid composition by basic k-mer, DAC: dinucleotide based autocovariance, DCC: dinucleotide based cross-covariance, DACC: dinucleotide based auto-cross covariance, PC-PseDNC-General: General parallel correlation pseudo dinucleotide composition and SC-PseDNC-General: General series correlation pseudo dinucleotide composition, (a) accuracy, (b) sensitivity, (c) specificity and (d) F-score, calculated based on the confusion matrices.
Considering the other 7 feature extraction methods, the DCC method has an average accuracy of 92.63% which is the highest, while DACC and SC-PseDNC-General methods are closely behind with average accuracies of 92.38% and 92%, respectively. This is still lower than the BLBFE method’s average accuracy of 94.31%. The highest accuracy among the 7 methods is 97.83% which belongs to the LDA classifier with the DACC feature extraction. Only the naïve Bayes classifier shows relatively higher accuracy when using the other methods of feature extraction compared to the BLBFE method.
Again the BLBFE method with the average sensitivity of 85.01% has the best performance. Within the other methods of feature extraction, 79.18% average sensitivity was the highest for the k-mer method. The SC-PseDNC-General and DACC methods were in the following order with the mean sensitivity scores of 78.56% and 78.48%, respectively.
The factor of specificity performance demonstrates similar outcomes. The highest average specificity of 95.45% belonged to the BLBFE method whereas the DCC and DACC methods with values of 94.2% and 94.01%, respectively have the highest average specificities among the other seven feature extraction methods.
At last, the BLBFE method with the f-score of 95.88% has shown the highest level with the KNN classifier. It also presents the highest mean f-score level of 85.38% whereas the average f-score of DCC method was 80.38%.
Comparing the methods of feature extraction, the application of BLBFE method has shown a better performance of classifiers. As can be seen, excluding the Naïve Bayes classifier, better measures resulted from the other three classifiers using the BLBFE method. On the other hand, the average levels of 94.31%, 85.01%, 95.45% and 85.38% for the accuracy, sensitivity, specificity and f-score for the BLBFE method with, respectively, showed far better results compared to the other methods such as the DCC method with the maximum average accuracy of 92.63%, the maximum average specificity of 94.2% and the maximum average f-score of 80.38% and the k-mer method with a maximum average sensitivity of 79.18%.
Conclusion
We studied the application of the BLBFE method, a developed feature extraction scheme that utilizes the existence and the location of sequential blocks as features to classify the riboswitches. Besides, seven additional methods of feature extraction including basic k-mer, mono- and dinucleotide frequencies, PC-PseDNC-General, SC-PseDNC-General, DAC, DCC and DACC were included in our study. The performance of the BLBFE method was compared to the other methods using four popular classifiers for all feature extraction strategies. Considering all the results, specifically the average CCR of 87.65%, the BLBFE indicated a better function in the classification of the riboswitches in comparison with the other 7 methods, among which DCC showed the maximum average CCR (83.61%). Using the BLBFE method, KNN and decision tree classifiers closely competed on being the best performing classifiers, while the Naïve Bayes classifier presented comparatively low performance. The compared 7 methods performed almost well, however DCC, DACC and k-mer methods represented relatively better functions according to the performance measures. Among the classifications when using the 7 additional feature extraction methods, KNN and LDA classifiers displayed the best performances followed by the naïve Bayes classifier.
In conclusion, by comparison of the average performance measures of the feature extraction methods, the employment of the BLBFE method (especially with KNN or decision tree classifiers) resulted in higher performance in the categorization of the riboswitches. Our results imply that the BLBFE principle, which utilizes the locations of family-specific blocks as features, is highly fit for riboswitch classification. Additionally, when the BLBFE is used as the feature extraction method, 3 of the 4 classifiers, including decision Tree, KNN and LDA function suitably, from which KNN achieves the best performance.
Funding sources
The authors received no financial support for the research, authorship,
and publication of this article.
Ethical statement
There is none to be disclosed.
Competing interests
There is no conflict of interests to be reported.
Authors’ contribution
FG, MS, MHS, and MSH designed the study. FG and EMA collected the data. FG, MSH did the in-silico study. FG, MS, MHS, and MSH developed the algorithm and computer program. FG, AB, and MSH analyzed the data. FG, EMA, and MSH prepared and wrote the manuscript. FG, MHS, and MSH edited the manuscript.
Research Highlights
What is the current knowledge?
simple
-
√ The common methods for riboswitch classification are alignment-based approaches.
-
√ An alignment-free algorithm was designed for the detection of specific blocks in riboswitch families. BLBFE strategy which was recently introduced, used the locations of the blocks to classify riboswitches.
What is new here?
simple
-
√ Employing the BLBFE method accompanied by KNN or decision tree classifiers results in better performance in the classification of riboswitches.
References
- Mandal M, Breaker RR. Gene regulation by riboswitches. Nat Rev Mol Cell Biol 2004; 5:451-63. [ Google Scholar]
- Lewis R. The rise of antibiotic-resistant infections. FDA Consum 1995; 29:11-5. [ Google Scholar]
- Blount KF, Breaker RR. Riboswitches as antibacterial drug targets. Nat Biotechnol 2006; 24:1558-64. doi: 10.1038/nbt1268 [Crossref] [ Google Scholar]
- Blount KF, Wang JX, Lim J, Sudarsan N, Breaker RR. Antibacterial lysine analogs that target lysine riboswitches. Nat Chem Biol 2007; 3:44-9. doi: 10.1038/nchembio842 [Crossref] [ Google Scholar]
- Penchovsky R, Stoilova CC. Riboswitch-based antibacterial drug discovery using high-throughput screening methods. Expert Opin Drug Discov 2013; 8:65-82. doi: 10.1517/17460441.2013.740455 [Crossref] [ Google Scholar]
- Cheah MT, Wachter A, Sudarsan N, Breaker RR. Control of alternative RNA splicing and gene expression by eukaryotic riboswitches. Nature 2007; 447:497-500. doi: 10.1038/nature05769 [Crossref] [ Google Scholar]
- Gao F, Luo H, Zhang CT, Zhang R. Gene essentiality analysis based on DEG 10, an updated database of essential genes. Methods Mol Biol 2015; 1279:219-33. doi: 10.1007/978-1-4939-2398-4_14 [Crossref] [ Google Scholar]
- Blount KF, Megyola C, Plummer M, Osterman D, O'Connell T, Aristoff P. Novel riboswitch-binding flavin analog that protects mice against Clostridium difficile infection without inhibiting cecal flora. Antimicrob Agents Chemother 2015; 59:5736-46. doi: 10.1128/aac.01282-15 [Crossref] [ Google Scholar]
- Mulhbacher J, Brouillette E, Allard M, Fortier LC, Malouin F, Lafontaine DA. Novel riboswitch ligand analogs as selective inhibitors of guanine-related metabolic pathways. PLoS Pathog 2010; 6:e1000865. doi: 10.1371/journal.ppat.1000865 [Crossref] [ Google Scholar]
- Kim JN, Blount KF, Puskarz I, Lim J, Link KH, Breaker RR. Design and antimicrobial action of purine analogues that bind Guanine riboswitches. ACS Chem Biol 2009; 4:915-27. doi: 10.1021/cb900146k [Crossref] [ Google Scholar]
- Howe JA, Wang H, Fischmann TO, Balibar CJ, Xiao L, Galgoci AM. Selective small-molecule inhibition of an RNA structural element. Nature 2015; 526:672-7. doi: 10.1038/nature15542 [Crossref] [ Google Scholar]
- Serganov A, Huang L, Patel DJ. Coenzyme recognition and gene regulation by a flavin mononucleotide riboswitch. Nature 2009; 458:233-7. doi: 10.1038/nature07642 [Crossref] [ Google Scholar]
- Sudarsan N, Cohen-Chalamish S, Nakamura S, Emilsson GM, Breaker RR. Thiamine pyrophosphate riboswitches are targets for the antimicrobial compound pyrithiamine. Chem Biol 2005; 12:1325-1335. doi: 10.1016/j.chembiol.2005.10.007 [Crossref] [ Google Scholar]
- Strobel B, Klauser B, Hartig JS, Lamla T, Gantner F, Kreuz S. Riboswitch-mediated Attenuation of Transgene Cytotoxicity Increases Adeno-associated Virus Vector Yields in HEK-293 Cells. Mol Ther 2015; 23:1582-1591. doi: 10.1038/mt.2015.123 [Crossref] [ Google Scholar]
- Meyer A, Pellaux R, Potot S, Becker K, Hohmann HP, Panke S. Optimization of a whole-cell biocatalyst by employing genetically encoded product sensors inside nanolitre reactors. Nat Chem 2015; 7:673-8. doi: 10.1038/nchem.2301 [Crossref] [ Google Scholar]
-
Breaker RR. Riboswitches and the RNA world. Cold Spring Harb Perspect Biol 2012; 4. 10.1101/cshperspect.a003566
- McCown PJ, Corbino KA, Stav S, Sherlock ME, Breaker RR. Riboswitch diversity and distribution. Rna 2017; 23:995-1011. doi: 10.1261/rna.061234.117 [Crossref] [ Google Scholar]
- Greenlee EB, Stav S, Atilho RM, Brewer KI, Harris KA, Malkowski SN. Challenges of ligand identification for the second wave of orphan riboswitch candidates. RNA Biol 2018; 15:377-90. doi: 10.1080/15476286.2017.1403002 [Crossref] [ Google Scholar]
- Barrick JE, Corbino KA, Winkler WC, Nahvi A, Mandal M, Collins J. New RNA motifs suggest an expanded scope for riboswitches in bacterial genetic control. Proc Natl Acad Sci U S A 2004; 101:6421-6. doi: 10.1073/pnas.0308014101 [Crossref] [ Google Scholar]
- Breaker RR. Prospects for riboswitch discovery and analysis. Mol Cell 2011; 43:867-79. doi: 10.1016/j.molcel.2011.08.024 [Crossref] [ Google Scholar]
- Krogh A, Mian IS, Haussler D. A hidden Markov model that finds genes in Ecoli DNA. Nucleic Acids Res 1994; 22:4768-78. doi: 10.1093/nar/22.22.4768 [Crossref] [ Google Scholar]
- Salzberg SL, Delcher AL, Kasif S, White O. Microbial gene identification using interpolated Markov models. Nucleic Acids Res 1998; 26:544-8. [ Google Scholar]
-
Yoon B, Vaidyanathan P, editors. HMM with auxiliary memory: a new tool for modeling RNA secondary structures. Proc 38th Asilomar Conference on Signals, Systems, and Computers; 2004.
- Singh P, Bandyopadhyay P, Bhattacharya S, Krishnamachari A, Sengupta S. Riboswitch detection using profile hidden Markov models. BMC Bioinformatics 2009; 10:325. doi: 10.1186/1471-2105-10-325 [Crossref] [ Google Scholar]
- Eddy SR, Durbin R. RNA sequence analysis using covariance models. Nucleic Acids Res 1994; 22:2079-88. [ Google Scholar]
- Golabi F, Shamsi M, Sedaaghi MH, Barzegar A, Hejazi MS. Development of a new sequential block finding strategy for detection of conserved sequences in riboswitches. Bioimpacts 2018; 8:15-24. [ Google Scholar]
- Golabi F, Shamsi M, Sedaaghi MH, Barzegar A, Hejazi MS. Development of a new oligonucleotide block location-based feature extraction (BLBFE) method for the classification of riboswitches. Mol Genet Genom 2020; 295:525-34. doi: 10.1007/s00438-019-01642-z [Crossref] [ Google Scholar]
- Golabi F, Shamsi M, Sedaaghi MH, Barzegar A, Hejazi MS. Classification of Riboswitch Families Using Block Location-Based Feature Extraction (BLBFE) Method. Adv Pharm Bull 2020; 10:97-105. doi: 10.15171/apb.2020.012 [Crossref] [ Google Scholar]
- Liu B, Liu F, Wang X, Chen J, Fang L, Chou K-C. Pse-in-One: a web server for generating various modes of pseudo components of DNA, RNA, and protein sequences. Nucleic Acids Res 2015; 43:W65-W71. doi: 10.1093/nar/gkv458 [Crossref] [ Google Scholar]
- Liu B, Wu H, Chou K-C. Pse-in-One 20: An Improved Package of Web Servers for Generating Various Modes of Pseudo Components of DNA, RNA, and Protein Sequences. Natural science 2017; 09:67-91. doi: 10.4236/ns.2017.94007 [Crossref] [ Google Scholar]
-
Quinlan JR. C4.5: Programs for machine learning. Elsevier; 2014.
-
Heijden Fvd, Duin RPW, de Ridder D, Tax DMJ. Classification, Parameter Estimation and State Estimation: An engineering approach using MATLAB: John Wiley & Sons, Ltd; 2004. 10.1002/0470090154.ch2
-
Hastie T, Tibshirani R, Friedman J. The elements of statistical learning: Data mining, inference, and prediction. 2nd ed. Springer; 2009.
- Pudil P, Novovičová J, Kittler J. Floating search methods in feature selection. Pattern Recognit Lett 1994; 15:1119-25. doi: 10.1016/0167-8655(94)90127-9 [Crossref] [ Google Scholar]
- Friedman N, Geiger D, Goldszmidt M. Bayesian Network Classifiers. Machine Learning 1997; 29:131-63. doi: 10.1023/a:1007465528199 [Crossref] [ Google Scholar]
-
John GH, Langley P. Estimating continuous distributions in Bayesian classifiers. Proceedings of the Eleventh conference on Uncertainty in artificial intelligence: Morgan Kaufmann Publishers Inc.; 1995. p. 338-45.
- Arlot S, Celisse A. A survey of cross-validation procedures for model selection. Statist Surv 2010; 4:40-79. doi: 10.1214/09-SS054 [Crossref] [ Google Scholar]
- Griffiths-Jones S, Moxon S, Marshall M, Khanna A, Eddy SR, Bateman A. Rfam: annotating non-coding RNAs in complete genomes. Nucleic acids res 2005; 33:D121-D4. [ Google Scholar]
-
Nawrocki EP, Burge SW, Bateman A, Daub J, Eberhardt RY, Eddy SR, et al. Rfam 12.0: updates to the RNA families database. Nucleic acids res 2014; gku1063.
- Singh S, Singh R. Application of supervised machine learning algorithms for the classification of regulatory RNA riboswitches. Brief Funct Genomics 2016; 16:99-105. doi: 10.1093/bfgp/elw005 [Crossref] [ Google Scholar]
- Wei L, Liao M, Gao Y, Ji R, He Z, Zou Q. Improved and Promising Identification of Human MicroRNAs by Incorporating a High-Quality Negative Set. IEEE/ACM Trans Comput Biol Bioinform 2014; 11:192-201. doi: 10.1109/tcbb.2013.146 [Crossref] [ Google Scholar]
- Friedel M, Nikolajewa S, Sühnel J, Wilhelm T. DiProDB: a database for dinucleotide properties. Nucleic Acids Res 2009; 37:D37-D40. doi: 10.1093/nar/gkn597 [Crossref] [ Google Scholar]
- Dong Q, Zhou S, Guan J. A new taxonomy-based protein fold recognition approach based on autocross-covariance transformation. Bioinformatics 2009; 25:2655-62. doi: 10.1093/bioinformatics/btp500 [Crossref] [ Google Scholar]
- Guo Y, Yu L, Wen Z, Li M. Using support vector machine combined with auto covariance to predict protein-protein interactions from protein sequences. Nucleic Acids Res 2008; 36:3025-30. doi: 10.1093/nar/gkn159 [Crossref] [ Google Scholar]
- Chen W, Zhang X, Brooker J, Lin H, Zhang L, Chou KC. PseKNC-General: a cross-platform package for generating various modes of pseudo nucleotide compositions. Bioinformatics 2015; 31:119-20. doi: 10.1093/bioinformatics/btu602 [Crossref] [ Google Scholar]
- Breiman L, Spector P. Submodel Selection and Evaluation in Regression The X-Random Case. International Statistical Review 1992; 60:291-319. doi: 10.2307/1403680 [Crossref] [ Google Scholar]
-
Kohavi R. A study of cross-validation and bootstrap for accuracy estimation and model selection. Proceedings of the 14th international joint conference on Artificial intelligence - Volume 2; Montreal, Quebec, Canada; 1995. p. 1137-43.
- Braga-Neto UM, Dougherty ER. Is cross-validation valid for small-sample microarray classification?. Bioinformatics 2004; 20:374-80. doi: 10.1093/bioinformatics/btg419 [Crossref] [ Google Scholar]
- Fawcett T. An introduction to ROC analysis. Pattern Recogn Lett 2006; 27:861-74. doi: 10.1016/j.patrec.2005.10.010 [Crossref] [ Google Scholar]
- Sun Y, Kamel MS, Wong AKC, Wang Y. Cost-sensitive boosting for classification of imbalanced data. Pattern Recogn 2007; 40:3358-78. doi: 10.1016/j.patcog.2007.04.009 [Crossref] [ Google Scholar]
- Sokolova M, Lapalme G. A systematic analysis of performance measures for classification tasks. Information Processing & Management 2009; 45:427-37. doi: 10.1016/j.ipm.2009.03.002 [Crossref] [ Google Scholar]