Bioimpacts. 11(2):157-164.
doi: 10.34172/bi.2021.13
Original Research
Function of arteries and veins in conditions of simulated cardiac arrest
Seyed Mehdi Kamali Shahri 1  , Christian Contarino 2, Francesco Chifari 2, Morteza Mahmoudi 3, *, Simon Gelman 1, *
Author information:
1Department of Anesthesiology, Perioperative and Pain Medicine, Brigham and Women's Hospital, Harvard Medical School, MA, USA
2Computational Life Inc., Delaware, USA
3Precision Health Program and Department of Radiology, Michigan State University, MI, USA
Abstract
Introduction:
The study examined the behavior of vasculature in conditions of eliminated cardiac function using mathematical modeling. In addition, we addressed the question of whether the stretch-recoil capability of veins, at least in part accounts for the slower response to simulated cardiac arrest.
Methods:
In the first set of computational experiments, blood flow and pressure patterns in veins and arteries during the first few seconds after cardiac arrest were assessed via a validated multi-scale mathematical model of the whole cardiovascular system, comprising cardiac dynamics, arterial and venous blood flow dynamics, and microcirculation. In the second set of experiments, the effects of stretch-recoil zones of venous vessels with different diameters and velocities on blood velocity and dynamic pressure analyzed using computational fluid dynamics (CFD) modeling.
Results:
In the first set of experiments, measurement of changes in velocity, dynamic pressure, and fluid flow revealed that the venous system responded to cardiac arrest more slowly compared to the arteries. This disparity might be due to the intrinsic characteristics of the venous system, including stretch-recoil and elastic fiber composition. In the second set of experiments, we attempted to determine the role of the stretch-recoil capability of veins in the slower response to cardiac arrest. During the second set of experiments, we found that this recoil behavior increased dynamic pressure, velocity, and blood flow. The enhancement in dynamic pressure through combining the results from both experiments yielded a 15-40% increase in maximum dynamic pressure due to stretch-recoil, depending on vein diameter under normal conditions.
Conclusion:
In the situation of cardiac arrest, the vein geometry changes continue, promoting smooth responses of the venous system. Moreover, the importance of such vein behavior in blood displacement may grow as the pressure on the venous side gradually decreases with time. Our experiments suggest that the driving force for venous return is the pressure difference that remains within the venous system after the energy coming from every ventricular systole spent to overcome the resistance created by arterial and capillary systems.
Keywords: Blood flow, Venous system, Stretch-recoil, CFD
Copyright and License Information
© 2021 The Author(s)
This work is published by BioImpacts as an open access article distributed under the terms of the Creative Commons Attribution License (
http://creativecommons.org/licenses/by-nc/4.0/). Non-commercial uses of the work are permitted, provided the original work is properly cited.
Introduction
Goal-Directed Hemodynamic Therapy (GDHT) is a widespread component of treatment for patients during and after surgical intervention.
1
The main end-point of GDHT is to achieve optimal function of the cardiovascular system and maintain an adequate supply of oxygen and nutrients to the tissues during the inflammatory response to surgical intervention. Therefore, the common approach is to measure cardiac output (CO) and infuse enough fluid (with or without additional pharmacologic intervention) to achieve the desired CO. Unfortunately, the overall results of GDHT consistently fail to reach expectations
2-4
for a variety of reasons,
5-7
including a failure to respond to fluid challenge in almost half of the patients.
8
The present study attempted to shed light on the critical question of why the normal heart fails to respond, even temporarily, to an infusion of the appropriate aliquot of fluid.
There is a contradiction in the physiologic literature concerning what drives venous return (VR).
5,9-12
The classical theory was created by Guyton and colleagues, who has believed that VR drives by mean circulatory filling pressure (MCFP), or the pressure within the entire vascular system at the cardiac arrest time.
13-16
On the other hand, quite a few physiologists have suggested that the driving force for VR is the pressure that remains after overcoming the resistance to flow through the arterial vasculature and microcirculation.
6,11,17
Thus, this study hypothesized that both questions stated above — why the heart may not respond to a fluid challenge and what drives VR — could be answered, at least partially, by specific characteristics of the veins per se. Mathematical modeling was used to test the stated hypothesis.
Recently, one possible reason suggested for the lack of response of the heart to fluid challenge is that infusion of an aliquot of fluid may not increase preload and therefore would not increase cardiac output CO.
5
Specifically, the infused fluid, mixed with the existing blood, constitute stressed volume (Vs) and unstressed volume (Vu) within the venous system. If the Vs does not increase, the heart does not respond to fluid infusion.
5-7
The first portions of the infused fluid would constitute the Vu because, by definition, the pressure is lower than the pressure in Vs. Only when the infused fluid causes transmural pressure (Ptm) to increase above zero does the Vu become the Vs, leading to an increase in VR and CO. During infusion, the Vs increases not only because of the newly infused fluid but also because part of the Vu fluid converts to Vs. In this study, we showed through computational modeling that the hemodynamics within veins and arteries respond differently to cardiac arrest. In particular, venous pressure requires more time to reach MCFP than does arterial pressure.
Investigating such characteristics within a cross-section of vessels is necessary to understand these dynamics, but accurate experimental methods to precisely monitor these variables are limited at present. One alternative is a computational simulation. Therefore, we used the Digital Avatar software and a computational fluid dynamics (CFD) approach to explore the controlling VR. Computational approaches have widely described the complex biological environments and interactions,
16-21
including blood flow, pressures, and velocities in different vessels with various characteristics.
22-28
Despite the impressive potential of CFD modeling for solving complex problems in various engineering areas, it has limitations applying to realistic problems. The main drawback is the lack of actual experiments to confirm the CFD results. The other restrictions of the CFD include numerical errors and the lack of detailed knowledge of fluid mechanics, such as defining appropriate geometric modeling, fluid properties, and boundary conditions.
28
Materials and Methods
The mathematical model used to assess hemodynamics within the venous system after cardiac function ceases was the Digital Avatar (Computational Life Inc, Delaware): a multi-scale mathematical model of the whole cardiovascular system, which extends to previously validated models.
20
This model relies on visco-elastic, one-dimensional blood flow models (1D) of the main arteries and veins belonging to both the systemic and pulmonary circulations. Additionally, the model consists of the compartmental models for simulating microcirculation and heart chambers connected in a network that includes 388 vessels and 137 compartments.
20
Using this model permitted us to study and analyze pressure and flow waveform propagation throughout a network of vessels, including the pressure and volume of each cardiac chamber and microcirculation region.
The main features of the dynamics that develop in a healthy scenario are well captured by this model, which has been validated by comparing numerical predictions concerning the data reported in the literature and some in vivo measurements (see Fig. 1 for details). Though this framework has been used as a starting point to simulate the conditions that develop after cardiac arrest, it is noteworthy that the model used for these simulations reflects a simplified vision of the cardio-circulatory system. In other words, we have not considered muscle pumping effects, respiratory effects, or autoregulatory mechanisms in response to pressure drops in the model.

Fig. 1.
Pressure and flow dynamics predicted using the Digital Avatar to simulate a healthy human. Results for blood pressure and flow dynamics in the major veins (left upper side) and arteries (right upper side) of the systemic circulation and the pressure waveform inside the right atrium (lower left) and left ventricle (lower right). Inside the legend of each plot are the mean pressure (blue line) and the mean flow rate (red line) of the corresponding vessel.
.
Pressure and flow dynamics predicted using the Digital Avatar to simulate a healthy human. Results for blood pressure and flow dynamics in the major veins (left upper side) and arteries (right upper side) of the systemic circulation and the pressure waveform inside the right atrium (lower left) and left ventricle (lower right). Inside the legend of each plot are the mean pressure (blue line) and the mean flow rate (red line) of the corresponding vessel.
Cardiac arrest was simulated by linearly reducing to zero the elasticity variation of every cardiac chamber during systole, thus eliminating heart contractions. This process sets to take place after the simulation of the healthy scenario reached numerical stability and also designed to take place over a short time to avoid as much as possible propagation of the pressure waves caused by heart activity.
As a further step to investigate the veins’ behavior, we ran other numerical simulations using the CFD software Fluent. We analyzed the pressure and flow dynamics inside a part of a vein with a total length of 6.5 cm. Veins with different diameters (i.e., 0.1-1.5 cm) were examined, and the full vein length remained constant at 6.5 cm. Three stretch-recoil zones were considered in the middle of the vein, as shown in Fig. 2: 15% of vein diameters were assumed to compress and decompress, representing one of the scenarios disturbing the flow pattern in in vivo conditions. Before the stretch-recoil zone, a section of the straight vein was positioned at the flow entrance (on the left side) to eliminate the effects of partial flow development. Schematics of veins with different diameters showed elsewhere (Supplementary file 1, Fig. S1).
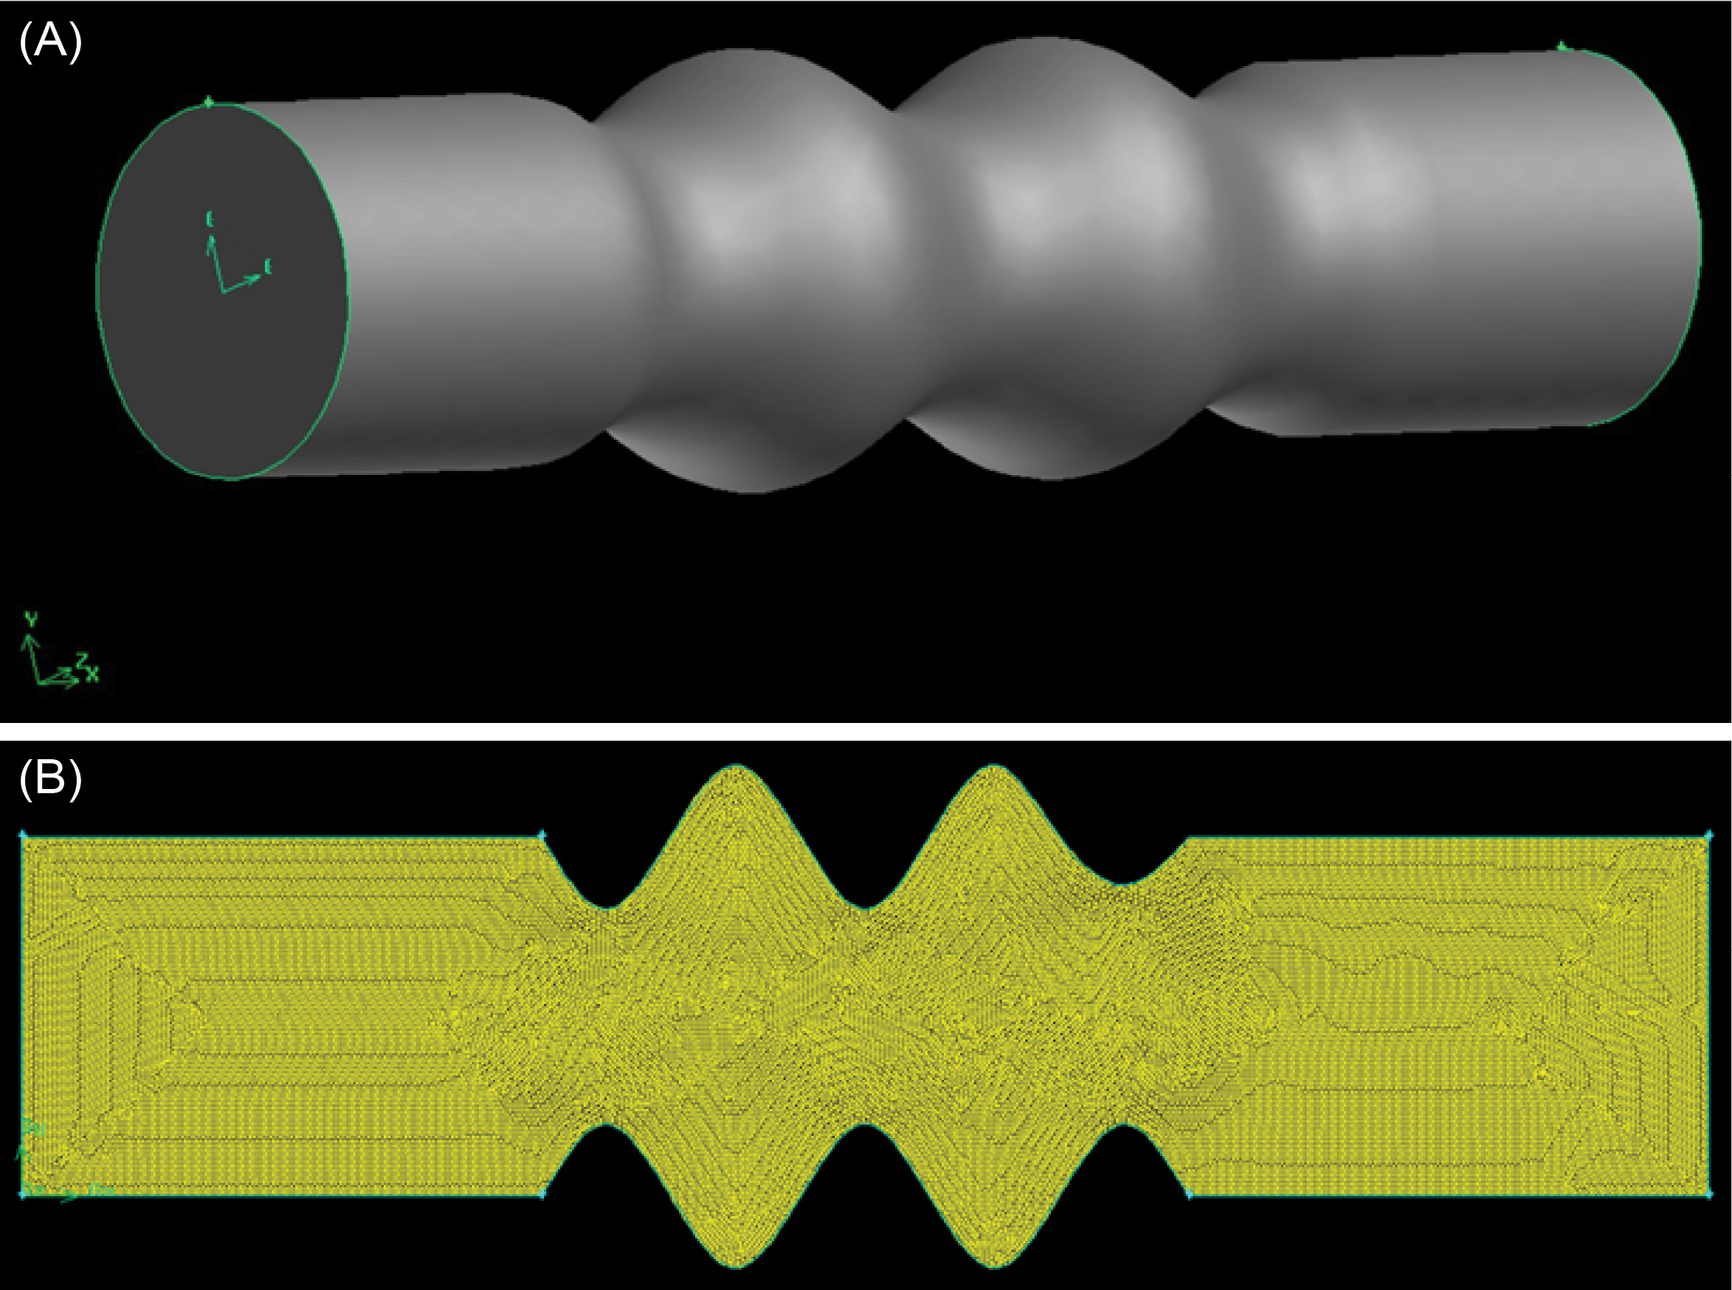
Fig. 2.
Schematic representation of vein in (A) 3D model, and (B ) 2D meshed (cross-section from the 3D model).
.
Schematic representation of vein in (A) 3D model, and (B ) 2D meshed (cross-section from the 3D model).
Despite initially designing a 3D model of the vein (Fig. 2A), a 2D cross-sectional model derived from the 3D model (Fig. 2B) applied here to demonstrate the contours of velocity, dynamic pressure, and flow rate, since each point in the 2D model (surface model) satisfies the locations of points in a circle (3D model) with analogous properties.The volume and surface geometries were built and subsequently meshed in Gambit software. Then the meshed surface models were exported for use in CFD software. The surface mesh was created via the face surface Quand/Pave algorithm and then smoothed using the length-weighted Laplacian algorithm. The final mesh size was estimated by an mesh convergence analysis. The boundary zones and continuous zone were also defined in the Gambit software.
The computational model of the fluids considers as a 2D incompressible Navier-Stokes equation written in a conservation form for mass and momentum. The laminar model in steady-state and unsteady-state modes was applied to describe the flow patterns, since the flow is in a laminar zone based on the velocity and viscosity of blood and vein diameter. The boundary and operating conditions were also determined. The inner walls were assumed rigid with a no-slip condition, which means that the fluid velocity on the boundary is zero. A full laminar flow and fixed outflow assumed for blood flow in the vein (Supplementary file 1).
Results
Using the Digital Avatar software, it was possible to assess the blood flow and pressure dynamics both in the scenario of a healthy human and during the absence of a heartbeat.
20
Fig. 1 shows pressure and flow waveforms in various arterial and venous blood vessels during a single cardiac cycle of a healthy human. Thanks to the 1D formulation of the mathematical model on which this software is based, it is possible to see that arterial pressure and flow waveforms are highly dependent on left ventricle contraction. Arterial pressure rises during systole (≅ 0.1-0.3 s) and decreases during diastole (≅ 0.3-0.85 s). On the other hand, venous pressure and flow waveforms depend strongly on the right atrial contraction. Venous pressure peaks during atrial contraction (≅ 0.75-0.90 s) and decreases as the right atrium relaxes. Elastic recoil of both arterial and venous segments is integrated into our mathematical formulation. The compliance of microcirculatory compartments enables blood to be stored and slowly released during each cardiac cycle. This can be appreciated during the pressure decay in the diastolic phase. The assumptions we made to simulate cardiac arrest conditions assure that no external forces interact with the fluid dynamics since heart activity is stopped and effects due to respiration and to the muscles' contraction are not included. This result implies that the only driving force acting on the blood is the pressure gradient physiologically present throughout the cardiovascular system, generated and maintained by the heart activity.
As the heart pumping function is blocked, blood moves from regions in which there is high pressure to lower pressure regions, unless or until an equilibrium is reached. The mathematical model used to run this simulation clearly describes this process. The numerical results (Fig. 3) showed how blood pressure gradually decreases throughout the whole systemic arterial network of vessels. Additionally, the pressure on the venous side progressively increases or decreases to match the value that reaches on the arterial side, which corresponds to Peq≅ 9 mm Hg. This equilibrium pressure predicts the so-called mean circulatory filling pressure (MCFP) in the virtual human and falls within existing estimations in a pig model (10.5+/- 2.3 (SD) mm Hg).
29
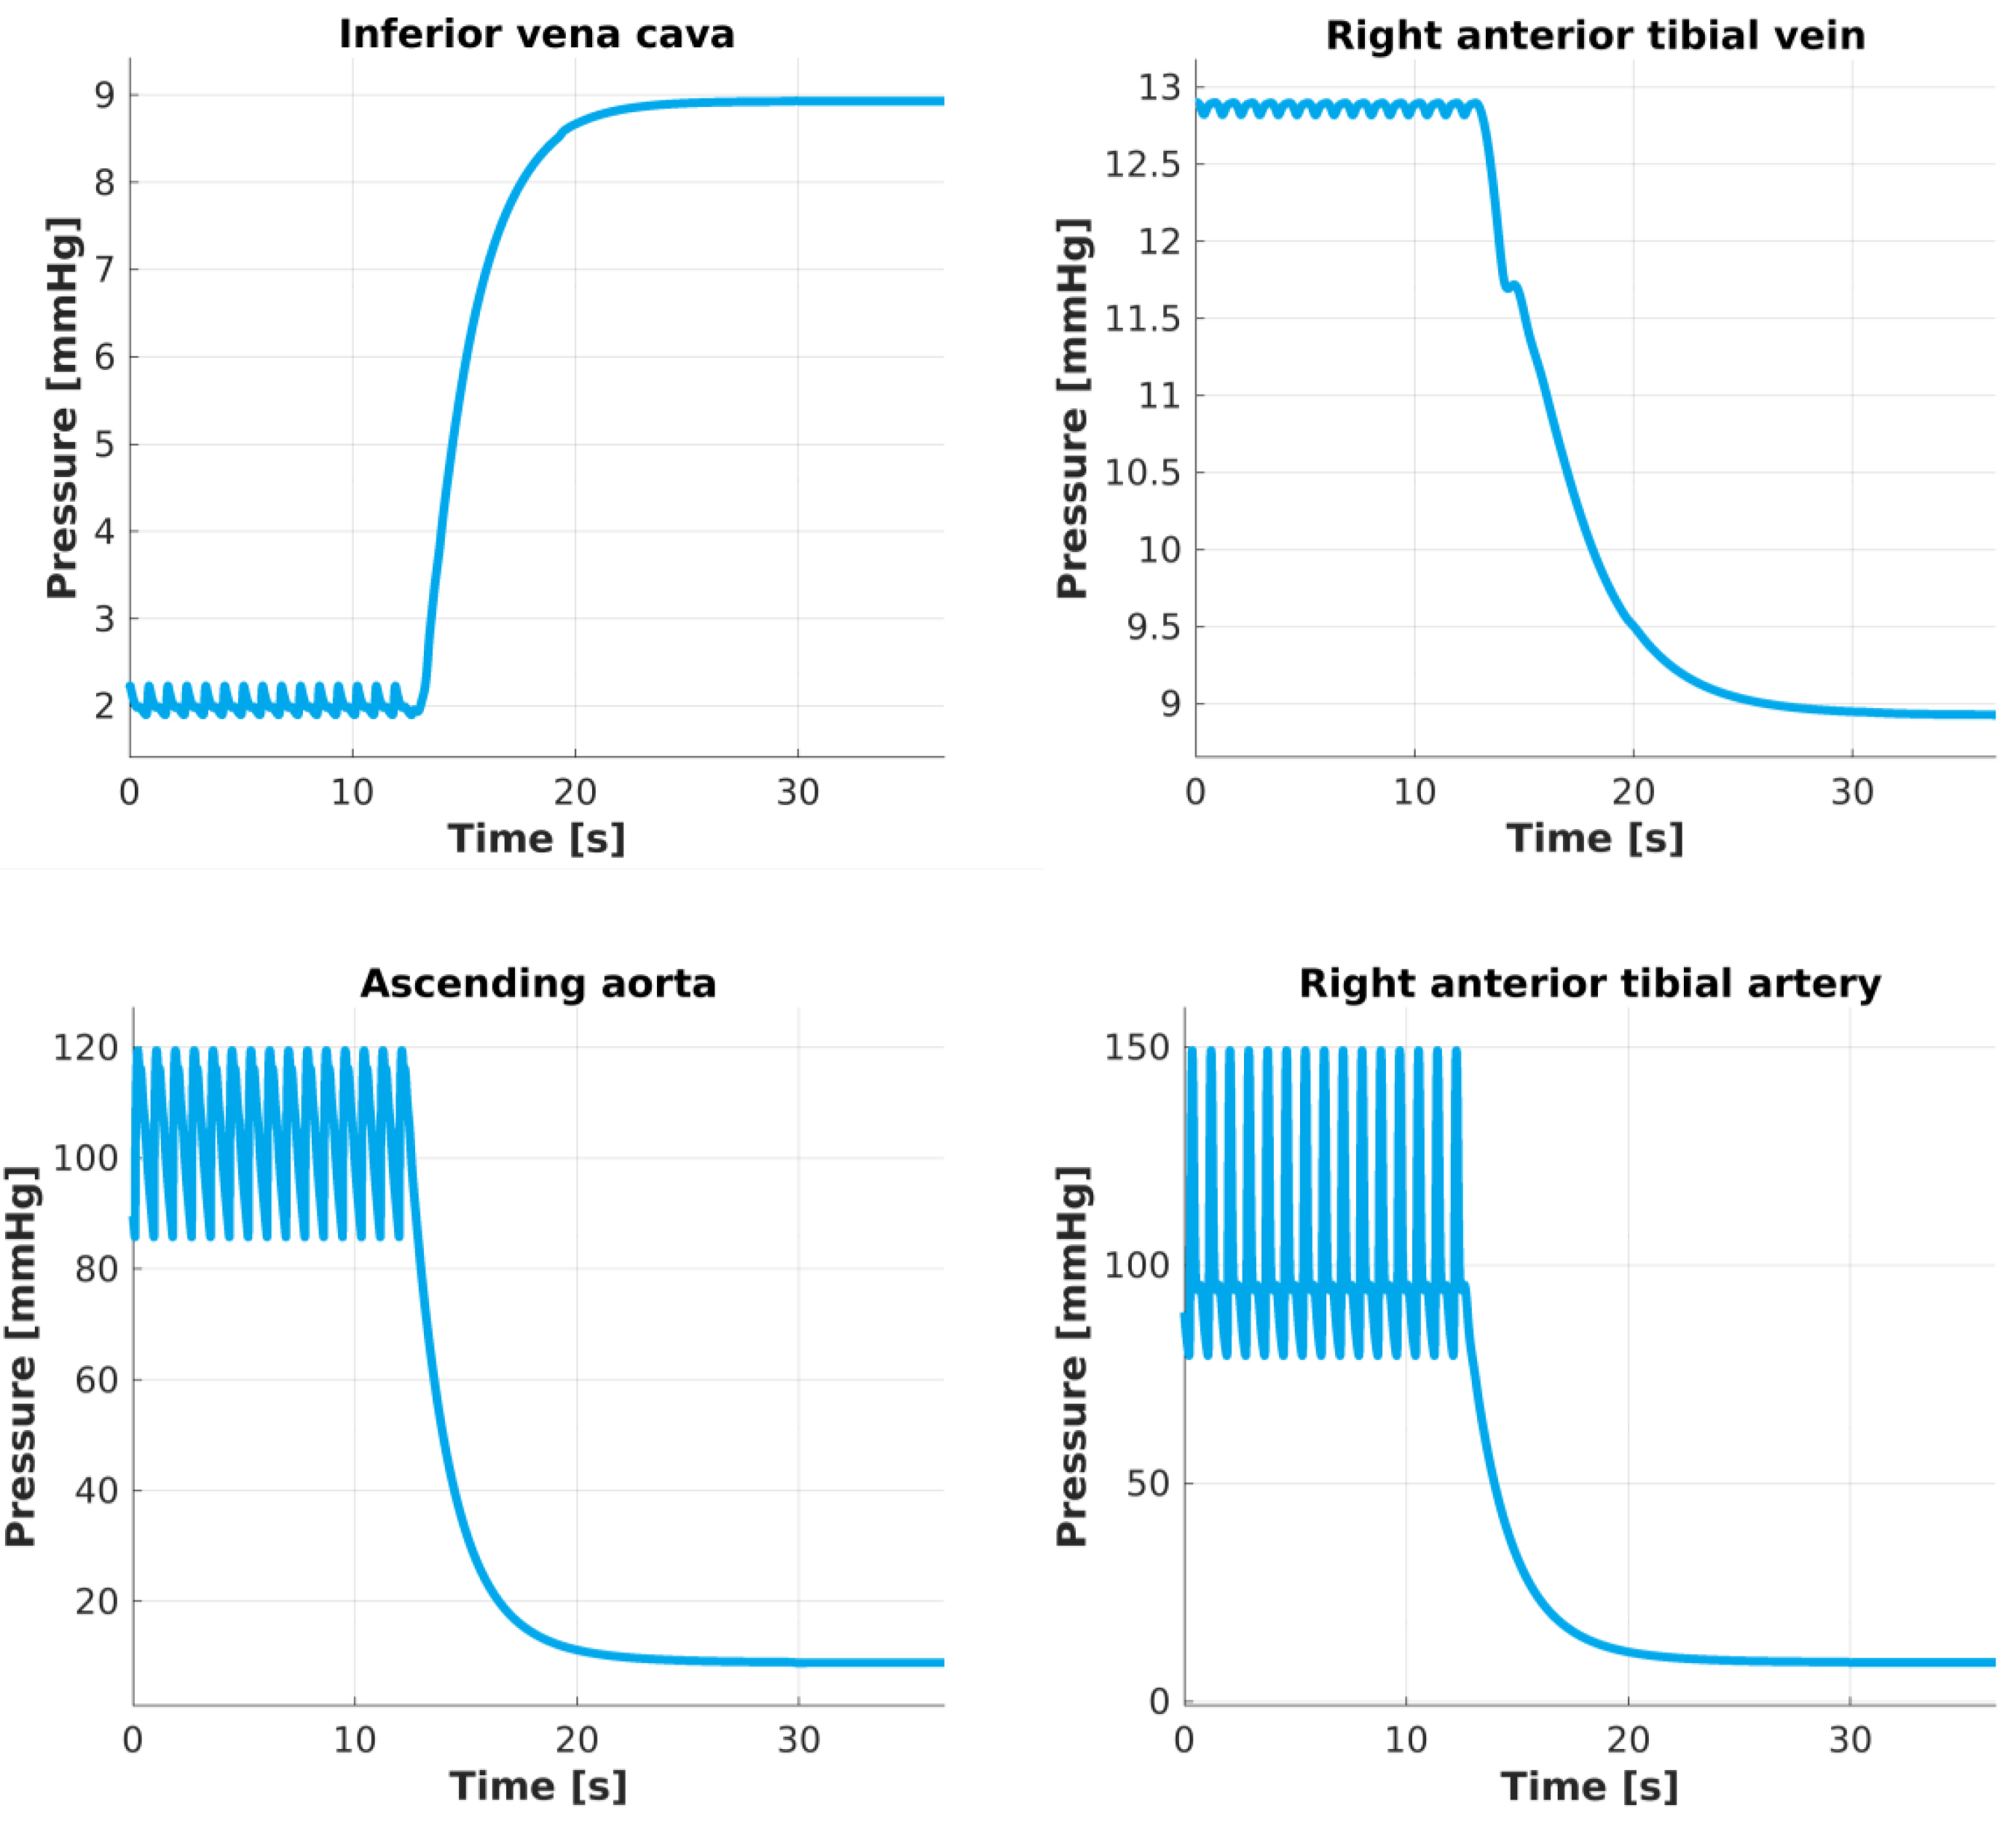
Fig. 3.
Pressure changes after heart activity is blocked. Pressure predictions in the center of these four vessels describe a periodic oscillatory pattern until the heart stops beating. At t ≅ 12 s heart activity is blocked and pressures gradually change, taking approximately t =13 s to reach the equilibrium Peq≅ 9 mm Hg.
.
Pressure changes after heart activity is blocked. Pressure predictions in the center of these four vessels describe a periodic oscillatory pattern until the heart stops beating. At t ≅ 12 s heart activity is blocked and pressures gradually change, taking approximately t =13 s to reach the equilibrium Peq≅ 9 mm Hg.
Effects on blood flow show less uniform behavior. In Fig. 4, as the heart stops beating, blood flow on the arterial side stops in a short time (less than ten seconds); however, venous blood takes longer to stop completely. In our computational results, it can take up to t =13 s. The time required for blood flow to completely stop, allowing the overall system to reach an equilibrium pressure of Peq≅ 9 mm Hg, is related to compliant behavior of arterial segments, venous segments, and microcirculation. In particular, inertia prevents blood from stopping immediately after the heart activity ceases. In other words, elastic recoil is the mechanism through which blood can be stored and slowly released into medium- and small-sized blood vessels. Moreover, the results showed for the large veins that small oscillations are still present after the heart ceased its activity.
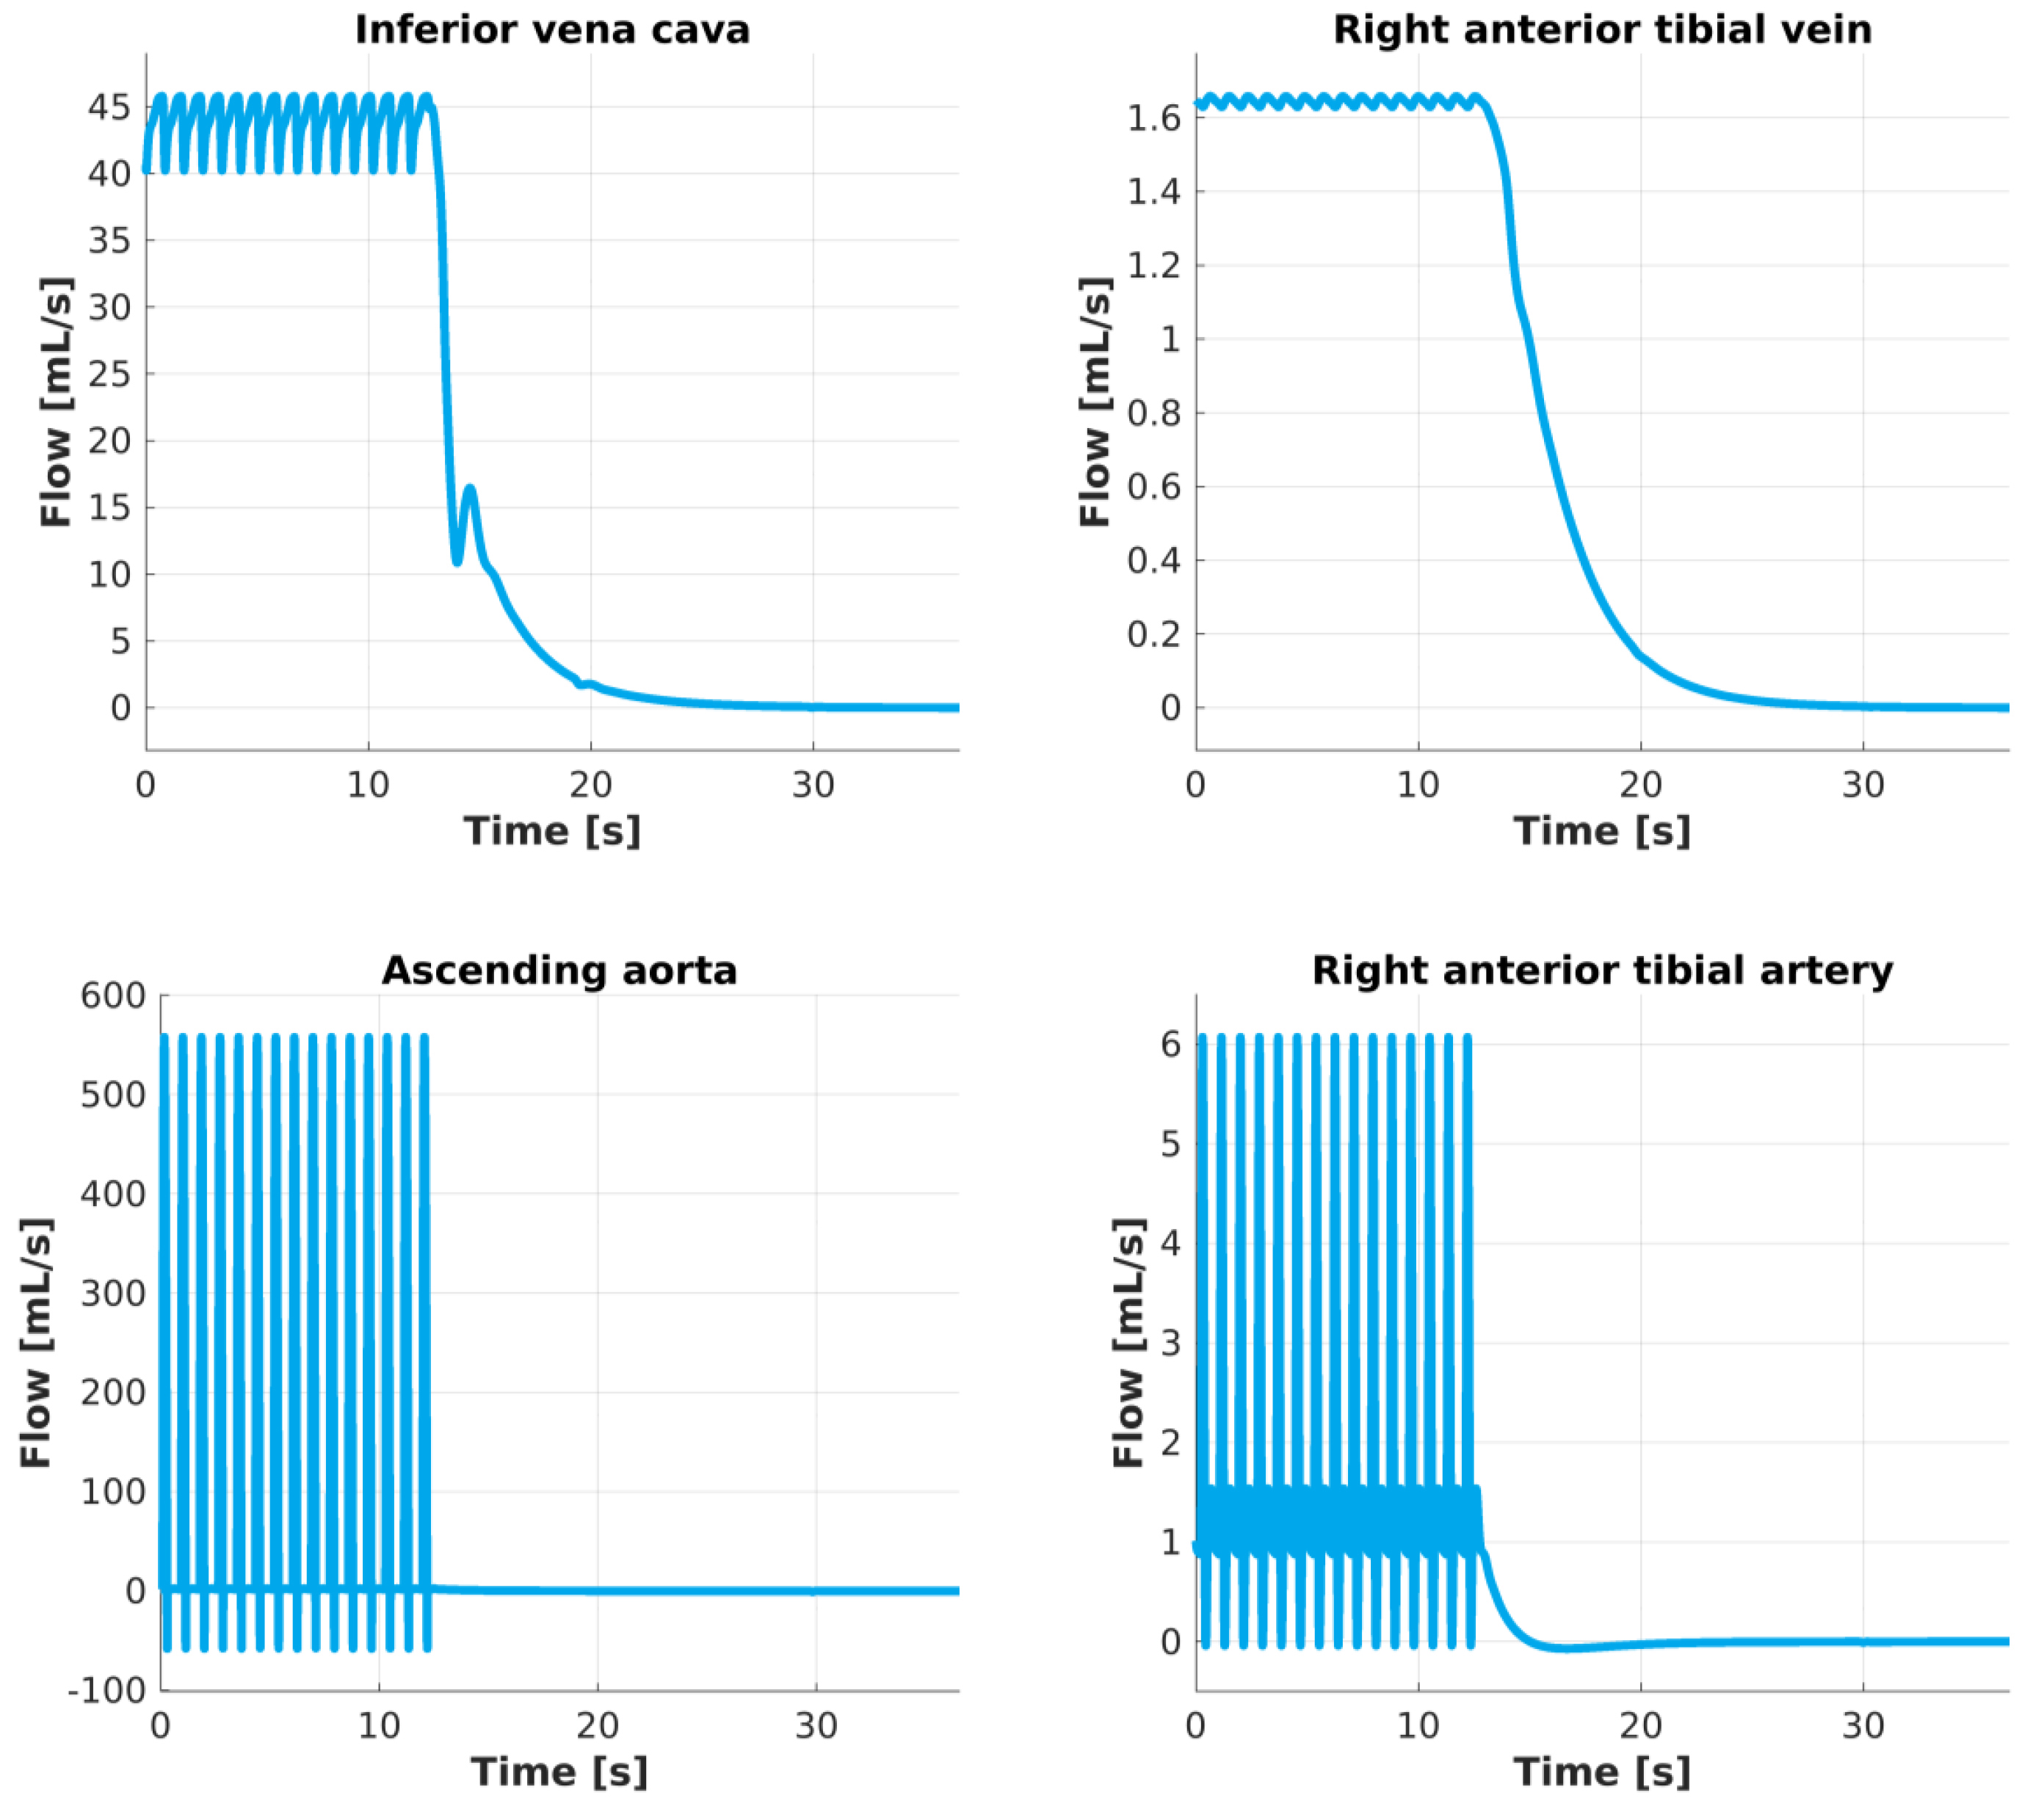
Fig. 4.
Flow changes after heart activity is blocked. The amount of blood flow predicted in the center of these four vessels describes a periodic oscillatory pattern until the heart stops beating. At t ≅ 12 s heart activity is blocked and blood stops flowing rapidly inside arteries and slower inside veins. Inside the ascending aorta blood flow stops immediately while in a more peripheral vessel such as the right anterior tibial artery about 5 seconds are necessary. The venous side results show that it takes a longer time (about 13s) to reach a null flow rate.
.
Flow changes after heart activity is blocked. The amount of blood flow predicted in the center of these four vessels describes a periodic oscillatory pattern until the heart stops beating. At t ≅ 12 s heart activity is blocked and blood stops flowing rapidly inside arteries and slower inside veins. Inside the ascending aorta blood flow stops immediately while in a more peripheral vessel such as the right anterior tibial artery about 5 seconds are necessary. The venous side results show that it takes a longer time (about 13s) to reach a null flow rate.
Several simulations via Fluent 6.0 software run to assess the influence of venous diameter and blood velocity on the pressure and flow dynamics inside a venous vessel model in the presence of stretch-recoil zones.
Effects of vein diameter
The blood velocity at the vein inlet in this section was presumed constant at 15 cm/s as an average velocity.
30
As illustrated in Fig. S2, the contour pattern underwent substantial changes as the vein diameter (D) increased. In the smallest vein diameter (i.e., 0.1 cm), the velocity periodically increased in the stretch-recoil zones and smoothed at the end of the vein (Fig. S2A). A more uniform velocity pattern was observed across the stretch-recoil zone when the vein diameter enlarged to 0.5 cm (Fig. S2B). The largest diameter (i.e., 1.5 cm) demonstrated the most-uniform velocity in the stretch-recoil zone as the maximum velocity measured at the center of the vein at the beginning of the recoil section (Fig. S2C). The stretch zones close to the wall of the vein showed the lowest velocities regardless of diameter.
The contours of dynamic pressure behaved similarly to the velocity contours, as shown in Fig. S3. The dynamic pressure in an incompressible fluid generates via fluid displacement. The dynamic pressure increased significantly in the stretch zone and reduced in the recoil zone (Fig. S3A); however, the effect of stretch disappeared with the diameter increase (Fig. S3B and S3C). The effect of dynamic pressure diminished considerably as the blood left the stretch-recoil zone. This figure suggests that the “wavy” behavior has a higher impact on dynamic pressure in veins with smaller diameters than veins with larger diameters. On the other hand, the maximum dynamic pressure obtained due to stretch-recoil in different vein diameters varied between 0.24-0.44 mm Hg from large to small vein diameters, encompassing 15-40% of maximum dynamic pressure in the venous system (0.6-3 mm Hg as shown in Fig. 1) before cardiac arrest. Therefore, the wavy behavior comprises a larger proportion (up to 30%) of maximum dynamic pressure in veins with bigger diameters. The remaining dynamic pressure could be attributable to the residual pressure from the left ventricle. Furthermore, this geometric effect acts independent of the cardiac arrest condition, and therefore, its effect increases as the cardiac arrest occurs.
Although the flow rate pattern substantially changed in the stretch-recoil zone, alteration of the vein diameter showed a similar effect on the magnitude of flow rate (see Fig. S4 for details). In all studied vein diameters, the blood flow changed accordingly:
, where,
, V, and A are flow, velocity, and vein cross-sectional area, respectively.
Effect of velocities
The vein diameter assumed constant at 1.5 cm.
31,32
The stretch-recoil process shifts the blood flow in the center of the vein and consequently increases velocity (Fig. S5). The stretched zones have the lowest velocities independent of inlet velocity magnitude. The effect of stretch-recoil on velocity extended the pattern of contours along the vein as velocity increased.
As the velocity increased in the stretch-recoil zones, the dynamic pressure also increased (Fig. S6). The highest and lowest dynamic pressures were observed at the entrance of stretch-recoil zones and the stretch area, respectively. The dynamic pressure dropped considerably at the end of the stretch-recoil zone.
The flow rate increased with velocity while showing a similar pattern at various velocities (Fig. S7). However, for the blood temporarily trapped in the stretch regions, the stretch-recoil process increased the flow rate in the vein.
Pressure and flow increased simultaneously when the fluid entered the recoiled zones (see Fig. 5 for details), which is in line with our hypothesis thatthe recoil of the vein enhanced the differences in flow characteristics in the same section. This phenomenon occurs according to Bernoulli’s equation for incompressible fluids (P0=P+1/2ρV2) and flow-velocity equation (
), where P0, P, V,
, and A are total pressure, flow rate, stagnation pressure, velocity, and vein cross-sectional area, respectively. As defined in the above equation, the total pressure is the summation of the static and dynamic pressures. As shown in Fig. 5a, dynamic pressure increased as velocity increased due to the smaller vein diameter in recoiled sections in contrast to stretched regions. However, while the total blood flow in the vein inlet and outlet remained constant, the flow was enhanced in recoiling areas due to velocity increment as shown in Fig. 5B.
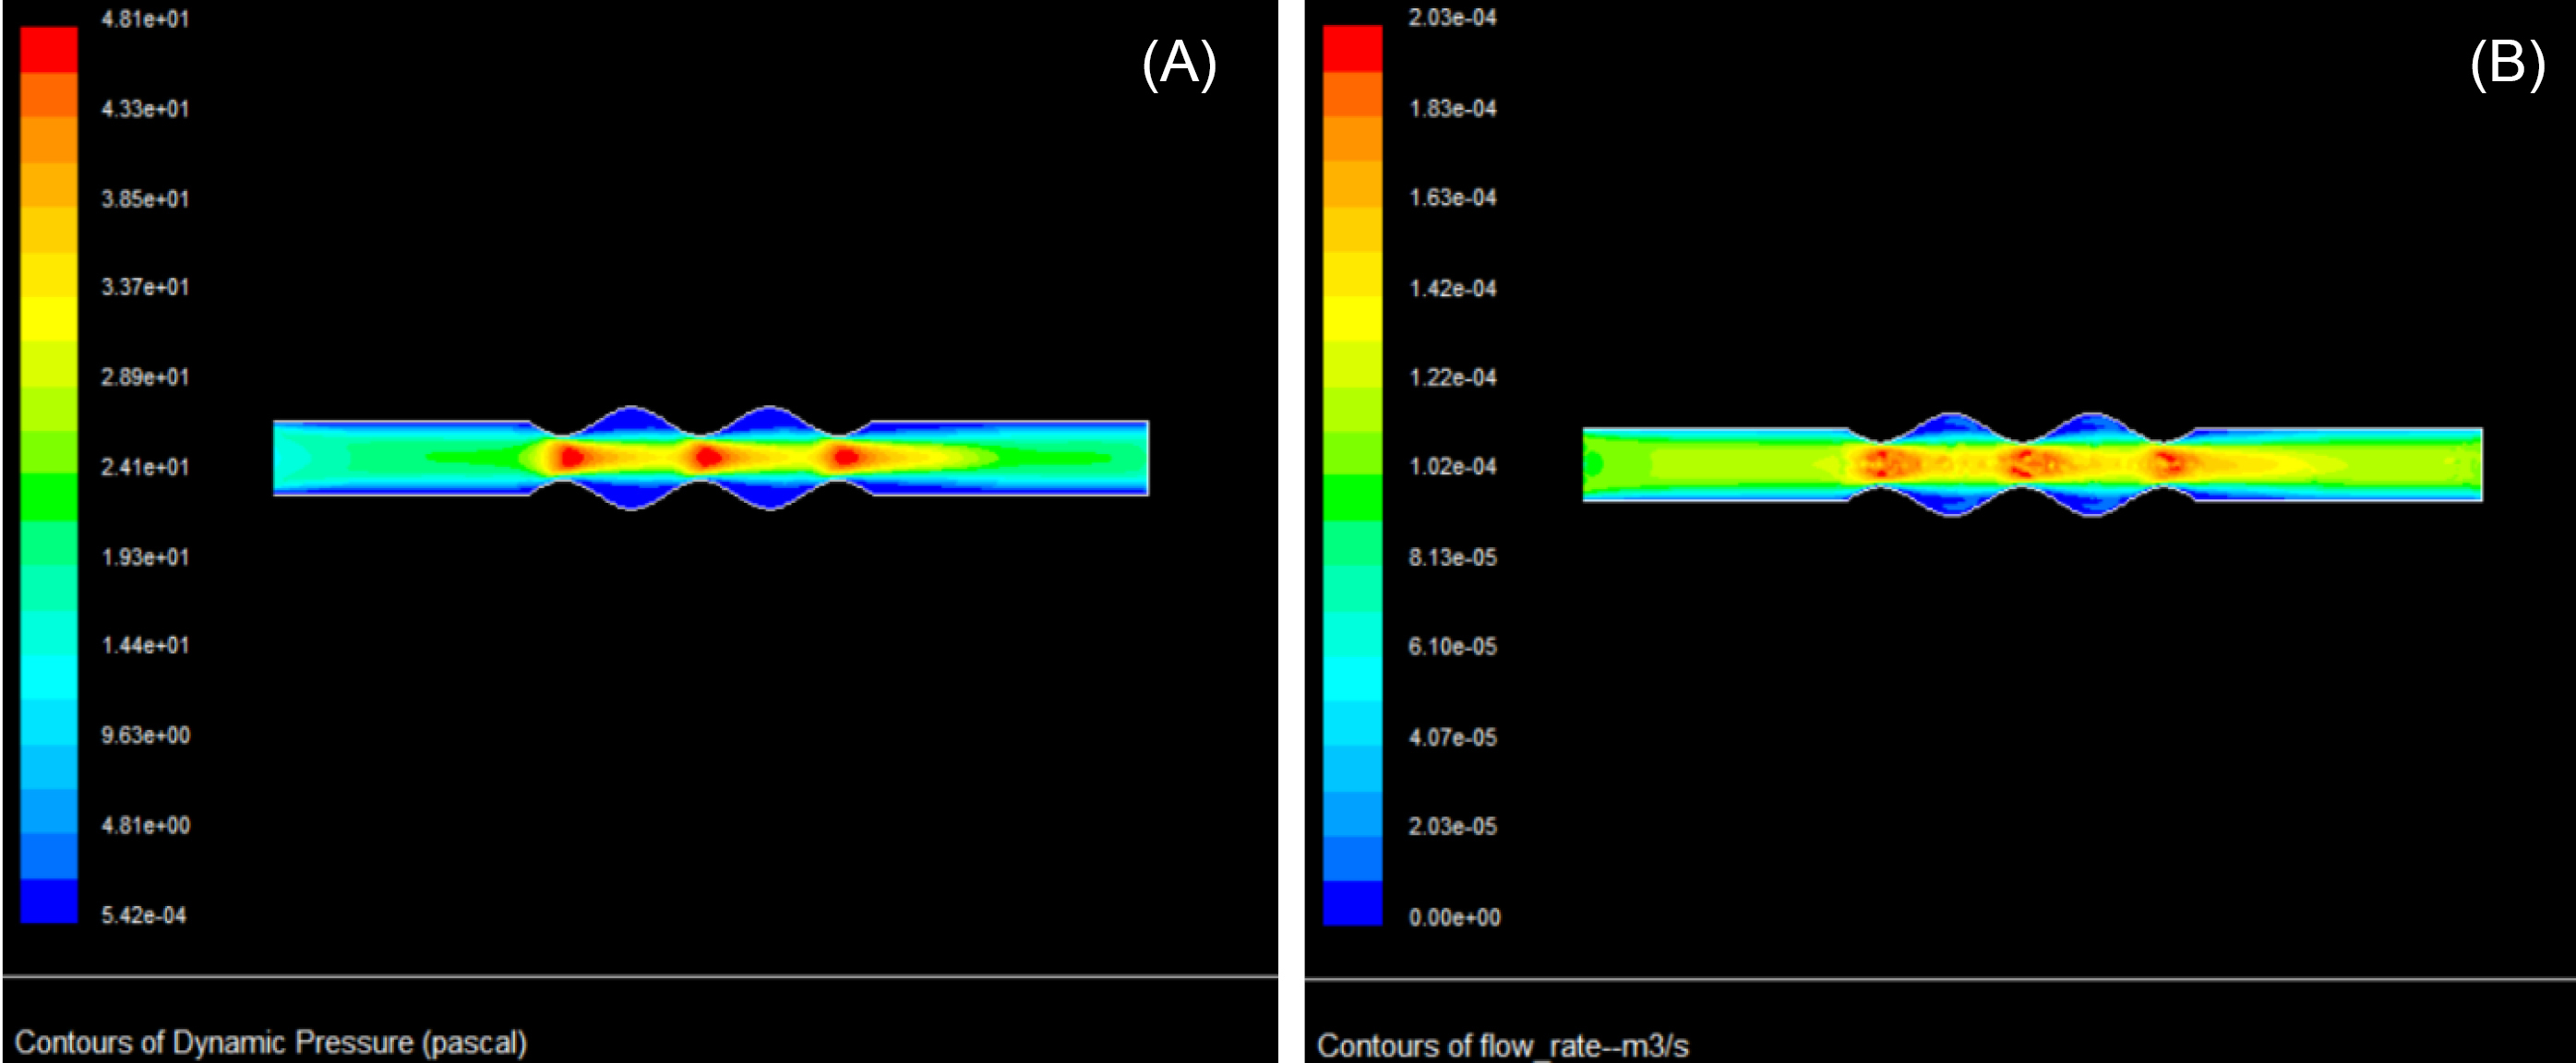
Fig. 5.
Contours of blood dynamic pressure (A), and blood flow rate (B) during the stretch-recoil process. The diameter and blood velocity of the vein are 0.5 cm and 15 cm/s, respectively.
.
Contours of blood dynamic pressure (A), and blood flow rate (B) during the stretch-recoil process. The diameter and blood velocity of the vein are 0.5 cm and 15 cm/s, respectively.
We can easily imagine that this also happens when blood from a smaller vein enters a larger vein. We may further speculate that this creates unsteady-state conditions. Without the geometric changes (induced by recoil and stretch of the vein) we observed, variation would have been minimal.
Discussion and Physiologic Implications
In addition to multiple dramatic differences in structure between arteries and veins, the specific characteristics of function of the veins in the regulation of venous flow are still not fully understood. This begs the question of what are the specific roles played by the different parts of the cardiovascular system in overall hemodynamics. We decided to conduct experiments using a multiscale mathematical model of the cardiovascular system that would entirely separate the roles of the heart versus arterial and venous vasculatures in overall hemodynamics. To achieve this goal, we chose to study vascular function under the condition of turned off cardiac activity, where we observed drastic differences between small and large veins. In particular, our computational results suggest that venous blood takes more time to i) reach a steady state of zero flow and ii) null pressure difference between arteries and veins.
Using a modeling system that reflects fluid mechanics equations, we offer the following speculation regarding what drives venous return. We assumed that the reason that drives the venous flow in the cardiac arrest situation is the dissimilarities between arteries and veins. The modeling is an integrated function of many parameters.
Blood flow through small veins is smooth, probably due to the difference in pressures between the arterial and venous sides of the circulation. In a small vein, blood periodically accumulates before entering, creates a pressure difference, and requires more time to flow in these vessels. Meanwhile, more blood compiles proximal to the vein, creating pressure that stretches the vessel walls.
In CFD simulation, the large veins contrast to small veins, show a smaller pressure gradient between proximal and distal portions, compared with smaller veins, and therefore may be prone to backward flow with a slight change in inlet pressure following each heartbeat. The presence of internal valves in larger veins prevents any reverse flow, leaving only one-directional blood flow. Therefore, valves may help eliminate oscillations of blood flow, making it smooth. The stretch-recoil of small veins cannot assure overall smooth and non-pulsatile flow, because (unlike the large veins with their valves), fluid may reverse and disturb the flow.
The developed pressure in LV drives the arterial flow. In our experiments, the pressure gradient between arterial and venous sections of the vasculature gradually decreases, reflecting the absence of heart contractions. The absence of heart activity led to a re-distribution of blood through the whole cardio-circulatory system, causing a progressive decrease in arterial pressure and a progressive increase in venous pressure.
During the flow through the vasculature, the high pressure generated by cardiac contractions used to overcome peripheral resistance to flow such as the arterial and capillary wall, viscosity of blood, and other resistivities. The mechanism suggested above, the elasticity that achieves the stretch-recoil phenomenon, in concert with muscle pumping, pulmonary ventilation, and some other factors, may play secondary roles in driving the VR.
Finally, we would like to emphasize the shortcomings of the observations presented here that need development in future investigations. Our study partially based on two interdependent assumptions: i) blood is still flowing through the veins, even after a certain amount of time (i.e., a couple of seconds) after heart arrest, and ii) even under the conditions of cardiac arrest a "vibration" is induced in the venous walls due to the stretch-recoil phenomenon.
Although the stretch-recoil phenomenon in arteries reinforced by the heartbeat, we do not fully understand all the factors involved in the venous return system. For example, our study did not uncover how and to what extent the stretch-recoil phenomenon is caused by an active muscular contraction that exerts periodic elastic forces (i.e., changing the vessel diameter in time, even during cardiac arrest) and/or the stretch-recoil zones represent a static geometric phenomenon due to the tortuosity of venous vessels (i.e., at a given point along a vein the diameter does not change over time, but changes "in space" moving away from that point). This problem is the main issue we were unable to clarify in our simulations, as we do not fully understand the mechanisms underlying the vein return system and their interdependency.
Conclusion
Using computational approaches, our results suggest differences between the behavior of the venous and arterial systems during their separation from cardiac function (i.e., cardiac arrest). CFD was used for a detailed study of the stretch-recoil of the venous wall during healthy and cardiac arrest conditions. The result under normal situations indicated that dynamic pressure, velocity, and blood flow increased as the vein recoiled after stretching. In normal healthy conditions, the increments in dynamic pressure varied in the range of 15-40% of maximum dynamic pressure.
The effect of the increases in dynamic pressure appeared more significant in veins with larger diameters (over 30% of maximum dynamic pressure) compared to veins with small diameters. Similar changes in the geometry of the veins are expected in cardiac arrest conditions, which could help maintain some flow and slow down the quick response. These results in the stretched small veins are negligible owing to a persistent high-pressure difference between arterial and venous sides. Therefore, larger veins, with their greater diameter, can stretch to a greater degree and maintain some minimal flow in the absence of cardiac function for a short period, until tissue oxygen deprivation would paralyze all vascular function.
In the cardiac arrest condition, a delayed response to the cessation of heart function was observed, attributable mainly to the stretching-recoiling capability of the elastic fibers. Such constant stretch-recoil within the small veins is associated with continual changes in variables such as pressures, compliances, and flows. Such continuing changes in the hemodynamic variables force us to live with the idea of a “steady-state” condition as average values of different hemodynamic parameters in short periods. Therefore, strictly speaking, a “steady-state” condition (i.e., meaning something that does not move after cardiac arrest) does not exist in reality.
Funding sources
Dept of Anesthesiology, Perioperative and Pain Medicine, BWH, HMS.
Ethical statement
There is none to be declared.
Competing interests
No competing interests to be disclosed.
Authors’ contribution
SMKS as the first author, contributed to the paper as following: data handling, experiments design, data analysis, study validation, data presentation, draft preparation, writing and reviewing. CC provided intellectual contributions and oversaw the numerical experiments of the multi-scale computational model of the cardiovascular system, and contributed to the relative design and participated in manuscript preparation. FC provided intellectual contributions and oversaw the numerical experiments of the multi-scale computational model of the cardiovascular system, and contributed to the relative design and participated in manuscript preparation. MM as the corresponding author contributed to conceptualization, design, supervision, draft preparation, study consultation, writing and reviewing, and project administration. SG: as the corresponding author, contributed to conceptualization, study validation, supervision, draft preparation, study consultation, writing and reviewing, and project administration.
Supplementary Materials
Supplementary file 1 contains Figs. S1-S7.
(pdf)
Research Highlights
What is the current knowledge?
simple
-
√ The vasculature functionalities in normal conditions are well-known, but their behavior in the eliminated cardiac function is unknown.
What is new here?
simple
-
√ In cardiac arrest condition, response of venous system is slower than artery, partially due to intrinsic characteristics of venous structure.
References
- Rivers E, Nguyen B, Havstad S, Ressler J, Muzzin A, Knoblich B. Early goal-directed therapy in the treatment of severe sepsis and septic shock. N Engl J Med 2001; 345:1368-77. doi: 10.1056/NEJMoa010307 [Crossref] [ Google Scholar]
- Sandham JD, Hull RD, Brant RF, Knox L, Pineo GF, Doig CJ. A randomized, controlled trial of the use of pulmonary-artery catheters in high-risk surgical patients. N Engl J Med 2003; 348:5-14. doi: 10.1056/NEJMoa021108 [Crossref] [ Google Scholar]
- Grocott MP, Dushianthan A, Hamilton MA, Mythen MG, Harrison D, Rowan K. Perioperative increase in global blood flow to explicit defined goals and outcomes after surgery: a Cochrane Systematic Review. Br J Anaesth 2013; 111:535-48. doi: 10.1093/bja/aet155 [Crossref] [ Google Scholar]
- Pearse RM, Harrison DA, MacDonald N, Gillies MA, Blunt M, Ackland G. Effect of a perioperative, cardiac output-guided hemodynamic therapy algorithm on outcomes following major gastrointestinal surgery: a randomized clinical trial and systematic review. JAMA 2014; 311:2181-90. doi: 10.1001/jama.2014.5305 [Crossref] [ Google Scholar]
- Gelman S, Bigatello L. The physiologic basis for goal-directed hemodynamic and fluid therapy: the pivotal role of the venous circulation. Can J Anaesth 2018; 65:294-308. doi: 10.1007/s12630-017-1045-3 [Crossref] [ Google Scholar]
- Brengelmann GL. Venous return and the physical connection between distribution of segmental pressures and volumes. Am J Physiol Heart Circ Physiol 2019; 317:H939-H53. doi: 10.1152/ajpheart.00381.2019 [Crossref] [ Google Scholar]
- Brengelmann GL. What if what you are looking for is not there?. J Appl Physiol 2019; 127:272-3. doi: 10.1152/japplphysiol.00155.2019 [Crossref] [ Google Scholar]
- Bentzer P, Griesdale DE, Boyd J, MacLean K, Sirounis D, Ayas NT. Will This Hemodynamically Unstable Patient Respond to a Bolus of Intravenous Fluids?. Jama 2016; 316:1298-309. doi: 10.1001/jama.2016.12310 [Crossref] [ Google Scholar]
- Magder S. The classical Guyton view that mean systemic pressure, right atrial pressure, and venous resistance govern venous return is/is not correct. J Appl Physiol (1985) 2006; 101:1533. doi: 10.1152/japplphysiol.00903.2006 [Crossref] [ Google Scholar]
- Gelman S. Venous function and central venous pressure: a physiologic story. Anesthesiology 2008; 108:735-48. doi: 10.1097/ALN.0b013e3181672607 [Crossref] [ Google Scholar]
- Beard DA, Feigl EO. CrossTalk opposing view: Guyton's venous return curves should not be taught. J Physiol 2013; 591:5795-7. doi: 10.1113/jphysiol.2013.260034 [Crossref] [ Google Scholar]
- Berlin DA, Bakker J. Understanding venous return. Intensive Care Med 2014; 40:1564-6. doi: 10.1007/s00134-014-3379-4 [Crossref] [ Google Scholar]
- Guyton AC, Lindsey AW, Abernathy B, Richardson T. Venous return at various right atrial pressures and the normal venous return curve. Am J Physiol 1957; 189:609-15. doi: 10.1152/ajplegacy.1957.189.3.609 [Crossref] [ Google Scholar]
- Guyton AC, Abernathy B, Langston JB, Kaufmann BN, Fairchild HM. Relative importance of venous and arterial resistances in controlling venous return and cardiac output. Am J Physiol 1959; 196:1008-14. doi: 10.1152/ajplegacy.1959.196.5.1008 [Crossref] [ Google Scholar]
- Brengelmann GL. Letter to the editor: Why persist in the fallacy that mean systemic pressure drives venous return?. Am J Physiol Heart Circ Physiol 2016; 311:H1333-h5. doi: 10.1152/ajpheart.00536.2016 [Crossref] [ Google Scholar]
- Kitano H. Computational systems biology. Nature 2002; 420:206. doi: 10.1038/nature01254 [Crossref] [ Google Scholar]
- Crampin E, Schnell S, McSharry P. Mathematical and computational techniques to deduce complex biochemical reaction mechanisms. Prog Biophys Mol Biol 2004; 86:77-112. doi: 10.1016/j.pbiomolbio.2004.04.002 [Crossref] [ Google Scholar]
- Mahmoudi M, Lynch I, Ejtehadi MR, Monopoli MP, Bombelli FB, Laurent S. Protein− nanoparticle interactions: opportunities and challenges. Chem Rev 2011; 111:5610-37. doi: 10.1021/cr100440g [Crossref] [ Google Scholar]
- Ghavami M, Rezaei M, Ejtehadi R, Lotfi M, Shokrgozar MA, Abd Emamy B. Physiological temperature has a crucial role in amyloid beta in the absence and presence of hydrophobic and hydrophilic nanoparticles. ACS Chem Neurosci 2012; 4:375-8. doi: 10.1021/cn300205g [Crossref] [ Google Scholar]
- Muller LO, Toro EF. A global multiscale mathematical model for the human circulation with emphasis on the venous system. Int J Numer Method Biomed Eng 2014; 30:681-725. doi: 10.1002/cnm.2622 [Crossref] [ Google Scholar]
- Heydari T, Heidari M, Mashinchian O, Wojcik M, Xu K, Dalby MJ. Development of a Virtual Cell Model to Predict Cell Response to Substrate Topography. ACS Nano 2017; 11:9084-92. doi: 10.1021/acsnano.7b03732 [Crossref] [ Google Scholar]
- Goubergrits L, Affeld K, Wellnhofer E, Zurbrügg R, Holmer T. Estimation of wall shear stress in bypass grafts with computational fluid dynamics method. Int J Artif Organs 2001; 24:145-51. doi: 10.1177/039139880102400306 [Crossref] [ Google Scholar]
-
Botar C. CFD Simulation of the Portal Vein Blood Flow. In: Vasile T, Sfrangeu S, Clichici S, Agachi P, Badea R, et al., editors. International Conference on Advancements of Medicine and Health Care through Technology. IFMBE Proceedings. vol 26. Berlin, Heidelberg: Springer; 2009. 10.1007/978-3-642-04292-8_79
- Botar C, Vasile T, Sfrangeu S, Clichici S, Agachi P, Badea R. Validation of CFD simulation results in case of portal vein blood flow. Computer Aided Chemical Engineering 2010; 28:205-10. [ Google Scholar]
- Nordgaard H, Swillens A, Nordhaug D, Kirkeby-Garstad I, Van Loo D, Vitale N. Impact of competitive flow on wall shear stress in coronary surgery: computational fluid dynamics of a LIMA–LAD model. Cardiovasc Res 2010; 88:512-9. doi: 10.1093/cvr/cvq210 [Crossref] [ Google Scholar]
- Pereira J, e Moura JS, Ervilha A, Pereira J. On the uncertainty quantification of blood flow viscosity models. Chemi Engi Sci 2013; 101:253-65. doi: 10.1016/j.ces.2013.05.033 [Crossref] [ Google Scholar]
- Sigovan M, Rayz V, Gasper W, Alley HF, Owens CD, Saloner D. Vascular remodeling in autogenous arterio-venous fistulas by MRI and CFD. Annals of biomedical engineering 2013; 41:657-68. doi: 10.1007/s10439-012-0703-4 [Crossref] [ Google Scholar]
- Lee B-K. Computational fluid dynamics in cardiovascular disease. Korean circulation journal 2011; 41:423-30. doi: 10.4070/kcj.2011.41.8.423 [Crossref] [ Google Scholar]
- Versprille A, Jansen JRC, Drop A, Hulsmann AR. Mean systemic filling pressure as a characteristic pressure for venous return. Pflügers Archiv 1985; 405:226-33. doi: 10.1007/BF00582565 [Crossref] [ Google Scholar]
-
Brant WE. The Core Curriculum, Ultrasound. Lippincott Williams & Wilkins; 2001.
- Geleto G, Getnet W, Tewelde T. Mean normal portal vein diameter using sonography among clients coming to radiology Department of Jimma University Hospital, Southwest Ethiopia. Ethiop J Health Sci 2016; 26:237-42. doi: 10.4314/ejhs.v26i3.6 [Crossref] [ Google Scholar]
- Stamm ER, Meier JM, Pokharel SS, Clark T, Glueck DH, Lind KE. Normal main portal vein diameter measured on CT is larger than the widely referenced upper limit of 13 mm. Abdom Radiol (NY) 2016; 41:1931-6. doi: 10.1007/s00261-016-0785-9 [Crossref] [ Google Scholar]