Bioimpacts. 13(1):51-61.
doi: 10.34172/bi.2022.23698
Original Article
Silibinin induces immunogenic cell death in cancer cells and enhances the induced immunogenicity by chemotherapy
Sevda Jafari 1, 2  , Saba Heydarian 1, 2, Raymond Lai 3, Elnaz Mehdizadeh Aghdam 2, Ommoleila Molavi 1, 2, *
Author information:
1Biotechnology Research Center, Tabriz University of Medical Sciences, Tabriz, Iran
2Department of Pharmaceutical Biotechnology, Faculty of Pharmacy, Tabriz University of Medical Sciences, Tabriz, Iran
3Department of Laboratory Medicine & Pathology, Faculty of Medicine & Dentistry, University of Alberta, Edmonton, Canada
Abstract
Introduction:
Silibinin is a natural flavonoid compound known to induce apoptosis in cancer cells. Despite silibinin's safety and efficacy as an anticancer drug, its effects on inducing immunogenic cell death (ICD) are largely unknown. Herein, we have evaluated the stimulating effects of silibinin on ICD in cancer cells treated with silibinin alone or in combination with chemotherapy.
Methods: The anticancer effect of silibinin, alone or in combination with doxorubicin or oxaliplatin (OXP), was assessed using the MTT assay. Compusyn software was used to analyze the combination therapy data. Western blotting was conducted to examine the level of STAT3 activity. Flow cytometry was used to analyze calreticulin (CRT) and apoptosis. The heat shock protein (HSP70), high mobility group box protein1 (HMGB1), and IL-12 levels were assessed by ELISA.
Results: Compared to the negative control groups, silibinin induced ICD in CT26 and B16F10 cells and significantly enhanced the induction of this type of cell death by doxorubicin, and these changes were allied with substantial increases in the level of damage-associated molecular patterns (DAMPs) including CRT, HSP70, and HMGB1. Furthermore, conditioned media from cancer cells exposed to silibinin and doxorubicin was found to stimulate IL-12 secretion in dendritic cells (DCs), suggesting the link of this treatment with the induction of Th1 response. Silibinin did not augment the ICD response induced by OXP.
Conclusion: Our findings showed that silibinin can induce ICD and it potentiates the induction of this type of cell death induced by chemotherapy in cancer cells.
Keywords: Immunotherapy, Combination therapy, DAMPs, Silibinin, Th1 response
Copyright and License Information
© 2023 The Author(s).
This work is published by BioImpacts as an open access article distributed under the terms of the Creative Commons Attribution Non-Commercial License (
http://creativecommons.org/licenses/by-nc/4.0/). Non-commercial uses of the work are permitted, provided the original work is properly cited.
Introduction
Immunogenic cell death (ICD) is a specific type of regulated cell death known to stimulate antitumor immune responses against cancer-specific antigens.1 In cancer immunotherapy, cancer immune evasion and immunosuppression are among the main mechanisms of treatment failure. 2 Previous studies have demonstrated that induction of ICD is a promising strategy to overcome cancer-induced immunosuppression in the tumor microenvironment (TME).3,4
ICD is characterized by exposure and release of immunogenic factors called damage-associated molecular patterns (DAMPs). Calreticulin (CRT) is one of the main types of DAMPs that appeared on tumor cells' surfaces during endoplasmic reticulum stress.5 CRT expression on the cancer cell surface is a phagocytic signal and it promotes apoptotic bodies' recognition by dendritic cells (DCs). Adenosine triphosphate (ATP) is another immunogenic molecule released by dying cancer cells during autophagic stress and it attracts DCs into the cancer site by stimulating purinergic receptors.1,6 Two other well-known types of DAMPs are heat shock proteins (HSP70) and high mobility group box-1(HMGB1), known to be released from dying cancer cells into the extracellular space where they activate DCs through toll-like receptor 4 (TLR4).7,8 It has been shown that the binding of HSP70 and HMGB1 to TLR4 receptors induces a Th1 antitumor immune response, which is known to be the effective type of immune response against cancer. Interestingly, previous studies have shown that DAMPs secreted from dying cells modulate immunosuppression in TME, thereby improving the immune responses against cancer.9,10
Prior studies have shown that radiotherapy and several classes of natural andsynthetictherapeutic drugs, such as oxaliplatin (OXP) and doxorubicin (DOX), can induce ICDand activate anticancer immune responses in vitro and in vivo.11,12 Among these therapeutics, some of the natural compounds seem to be promising agents for the induction of ICD, due to their relatively low toxicity and potent anticancer activity.13,14
Silibinin is a natural cytotoxic flavanone and one of the most studied constituents of the silymarin flavonolignan complex. There have been a lot of studies that show that silibinin can fight and prevent cancer in a lot of different types of cancer cells.14 One of the mechanisms underlying the anticancer property of silibinin stems from its role in inhibiting cell cycle progression and inducing apoptosis in cancer cells, via its suppression of various survival and mitogenic pathways. Silibinin is also known to inhibit cancer metastasis and angiogenesis. Furthermore, silibinin has been described to be a potent chemosensitizer, by reducing drug-associated toxicity as well as overcoming STAT3-associated drug resistance in cancer cells harboring active STAT3.15
Despite the well-known anticancer effects of silibinin, there have been no studies on the induction of ICD by this compound. In the present study, we evaluated the potential of silibinin for inducing ICD in cancer cells. We also assessed if silibinin can enhance ICD induced by other agents. We found that silibinin alone can induce ICD. Moreover, it can significantly enhance ICD induced by some chemotherapy drugs. B16F10 and CT26 cell lines were selected as cancer models for melanoma and colon cancers, respectively.
Materials and Methods
Reagents
DOX hydrochloride, OXP, and silibinin were provided respectively from Ontario Chemicals Inc. (Ontario, Canada), Sigma-Aldrich (St. Louis, MO, USA), and Abcam (ab120952, USA). FITC Annexin V–PI apoptosis staining kit and mouse interleukin-12 (IL-12) p70 Elisa kit (cat. no. 88712122) were obtained from Invitrogen eBioscience (San Diego, CA, USA). MTT reagents were purchased from Sigma-Aldrich (St. Louis, MO, USA). Phycoerythrin-conjugated CRT monoclonal antibody (cat. no. ADI-SPA-601PE-D) was purchased from Enzo Life Sciences (Farmingdale, NY, USA). The HSP70 (E1752Mo) and HMGB1 (E0523Mo) ELISA kits were obtained from the bioassay technology laboratory (Shanghai, China). Fetal bovine serum (FBS), RPMI 1640, L-glutamine, and penicillin/streptomycin, were obtained from GIBCO Laboratories (Grand Island, NY, USA). Animal-free recombinant murine granulocyte-monocyte colony-stimulating factor (GM-CSF) was ordered from PeproTech (Rocky Hill, NJ). Lipopolysaccharide (LPS) was ordered from Invitrogen. Mouse monoclonal antibodies to STAT3 (cat. no. 678002) and phosphorylated STAT3 (p-STAT3, Tyr705) (cat. no. 651002) were provided from Biolegend (San Diego, CA, USA). Horseradish peroxidase (HRP)-conjugated anti-mouse IgG secondary antibody (cat. no. sc-516102) and β-Actin antibody (cat. no. sc-47778) were obtained from Santa Cruz (USA). A protease inhibitor cocktail was obtained from Roche Diagnostics. Molecular weight protein Ladder was obtained from Thermo Fisher Scientific (Waltham, USA). Enhanced chemiluminescence (ECL) western blotting substrate was purchased from Thermo Scientific (Rockford, USA).
Cell lines and mice
CT26 (colon cancer) and B16F10 (melanoma) cell lines were provided by the Pasture Institute of Iran (Tehran, Iran) and maintained in RPMI supplemented with FBS (10%) and penicillin/streptomycin (100 U/mL) and incubated in a humidified atmosphere at 37°C with 5% CO2. All the experiments were performed in the log phase of cell growth. C57BL/6 mice (female) were obtained from the Pasteur Institute of Iran. About 9-12 weeks old mice were applied for the preparation of primary DC culture. Animal experiments were performed according to the Tabriz Medical University's use of laboratory animal guidelines.
Cytotoxicity assay
To assess the in vitro cytotoxicity of silibinin, OXP, and DOX, the 3-(4, 5-dimethylthiazol-2-yl)-2,5-diphenyltetrazolium bromide (MTT) assay was conducted. CT26 and B16F10 cells (0.3×10⁴) were seeded into 96-well plates and allowed to incubate overnight. Each compound alone or the combinations of two compounds at different concentrations were used to treat the cells when they were in the log phase of cell growth. Untreated or DMSO-treated cells were used as control cells. In this study, 48 h incubation time resulted in an acceptable level of cell death in the cancer cells exposed to the anticancer drugs; therefore, 48 hours was selected as the optimum incubation time to study the anticancer effect of compounds. After 48 hours incubation time, MTT solution (0.5 mg/mL) was added to the cells, and the cells were incubated for the other 4 hours at 37°C. In the final stage, the medium was removed, the DMSO was added, and the absorbance was assessed at 570 nm by ELISA Reader (BioTek Instruments, Inc. USA). To obtain dose-response curves and calculate IC50 values, GraphPad Prism software was used.
Data obtained by MTT assay were applied to determine the combination index (CI) values by CompuSyn software for each combination therapy and the corresponding effects were shown by Fa. The Fa, fraction of cells inhibited after treatment, is defined between 0 and 1. For instance, Fa= 0.5 demonstrates cell growth is inhibited by 50%. As stated by the Chou-Talalay method, CI >1.1, CI=0.9-1.1, and CI<0.9 indicate respectively an antagonistic, an additive, and a synergistic effect in drug combination studies.16 IC50 values of each agent were used to select drug concentrations for combination therapy. To avoid the agents' cytotoxicity at higher concentrations, we applied the drugs at levels lower than their IC50. Moreover, combination therapy with the selected concentration of compounds resulted in a maximal anticancer effect shown with CI.
Western blotting assay
We used a western blotting assay to assess (STAT3, pSTAT3, and β-Actin) in the cells exposed to silibinin. 4×10⁵ cells (CT26 and B16 cells) were seeded into dishes (100 mm) and exposed to silibinin, DOX, and OXP single-agents and/or in combination with each other. After 48 hours treatment, the cells were collected and lysed with RIPA lysis buffer containing PMSF and protease inhibitor cocktail and then incubated for 30 minutes at 4°C. The lysates were centrifuged for 10 minutes at 4°C and 120 ×g. To determine the sample's total protein, we applied the BCL kit. The samples were then boiled for 5 minutes at 100°C and were run on 10% polyacrylamide gel electrophoresis. Separated proteins were transferred onto a polyvinylidene difluoride (PVDF) membrane. Tris-buffered saline containing 0.05% v/v Tween-20 and 5% skim milk was used to block the membrane. Subsequently, the membrane was incubated with primary antibodies, and HRP conjugated secondary antibodies. Finally, the bands were visualized with ECL detection kit.
Apoptosis analysis
CT26 and B16F10 cells (1×10⁵) were plated in dishes (60 mm), and after overnight incubation, the cells were treated with either chemotherapy drug alone or in combination with silibinin for 48 h. Annexin-FITC/PI assay kit was used for staining the cells according to the manufacturer's protocol, and the stained samples were analyzed immediately bythe FACSCalibur flow cytometer (Becton Dickinson, Franklin Lake, NJ, and the USA).
Assessment of CRT exposure on the surface of cancer cells
The cells were seeded and treated in the same procedure mentioned above. The cells were then stained with an anti-CRT monoclonal antibody (PE-conjugated) and analyzed using the FACSCalibur flow cytometer (Becton Dickinson, Franklin Lake, NJ, and the USA).
Assessment of HSP70 and HMGB1 secretion
CT26 and B16F10 cells (1×10⁵) were seeded again in 60 mm dishes, and after overnight incubation, they were exposed to determined monotherapies and combination therapies for 48 hours. The collected supernatants of the untreated and treated cells were used as samples to measure the level of HSP70 and HMGB1 by ELISA Kits according to the manufacturer's instructions.
Isolation and generation of murine bone marrow-derived dendritic cells (BMDCs)
Isolation and generation of DC primary cultures from C57BL/6 mice were performed according to the previously established procedure of 7-day culture of bone marrow precursors.17 In brief, the femurs were excised and isolated from surrounding tissues. The whole bone was cleaned with 70% ethanol and washed with phosphate buffer saline (PBS). Then, both ends of the bone were cut up with scissors, and the bone marrow was flushed with PBS by an insulin syringe. The acquired leukocytes were filtrated with a cell strainer (40 µm) to collect single-cell suspension. After one washing step with PBS, about 2 ×10⁷ cells were obtained per femur.
To produce matured BMDCs, on day 0, we plated the isolated leukocytes at 2×10⁶ cells in 100 mm tissue culture dishes containing 10 mL of 1:1 mixture of DC complete media (RPMI-1640 with 10% heat-inactivated FBS, L-glutamine, penicillin-streptomycin, and 20 ng/mL GM-CSF) and the gathered conditioned media (CM) from CT26 and B16F10 cells containing 20 ng/mL GM-CSF. On day 3, the other 10 mL of DC complete medium was added. On day 6, 10 mL of the DC culture supernatant was exchanged with 10 mL of fresh media containing a 1:1 mixture of DC complete media and CM supplemented with 20 ng/mL of GM-CSF. On day 7, the supernatant of cultures was collected and detected for IL-12 secretion. A group of leukocytes grown in the absence of CM was the negative control, and the other group was treated with 100 ng/mL LPS on day 7 (the supernatant was collected after 24 hours) was used as the positive control.
To prepare CM from CT26 and B16F10 cancer cells, we cultured and treated the cells with the determined mono and combination therapies in 60 mm tissue culture dishes for 48 hours. Afterward, the cancer cells' supernatant was collected, and centrifugation and filtration were used in the experiments.
Analysis of functional maturation characteristics of BMDCs by ELISA
Matured DCs were generated according to the described method in the prior section, and DCs supernatant was collected to be analyzed for the level of IL-12 secretion through a commercially available ELISA kit and according to the manufacturer's instructions.
Statistical analysis
In this study, each experiment was performed in triplicate, and all data were depicted by mean ± standard deviation (SD). Data were analyzed using GraphPad Prism software. Statistical analysis was done with a One-way ANOVA analysis of variance, followed by Tukey's post hoc tests for multiple comparisons. The level of statistical significance was P<0.05. In this study, * indicates P < 0.05, ** indicates P <0.01, *** indicates P < 0.001, and **** indicates P < 0.0001.
Results
Growth inhibitory effects of silibinin single-agent or in combination with chemotherapy drugs in cancer cells
We determined the growth inhibitory effect of silibinin in cancer cells by MTT assay. Dose-response curves for anticancer effects of silibinin in B16F10 and CT26 cells have been shown in Fig. 1A and B. In B16F10 and CT26 cells, the IC50 values for silibinin were 90 ± 3.1 M and 105.8 ± 3.5 M, respectively.
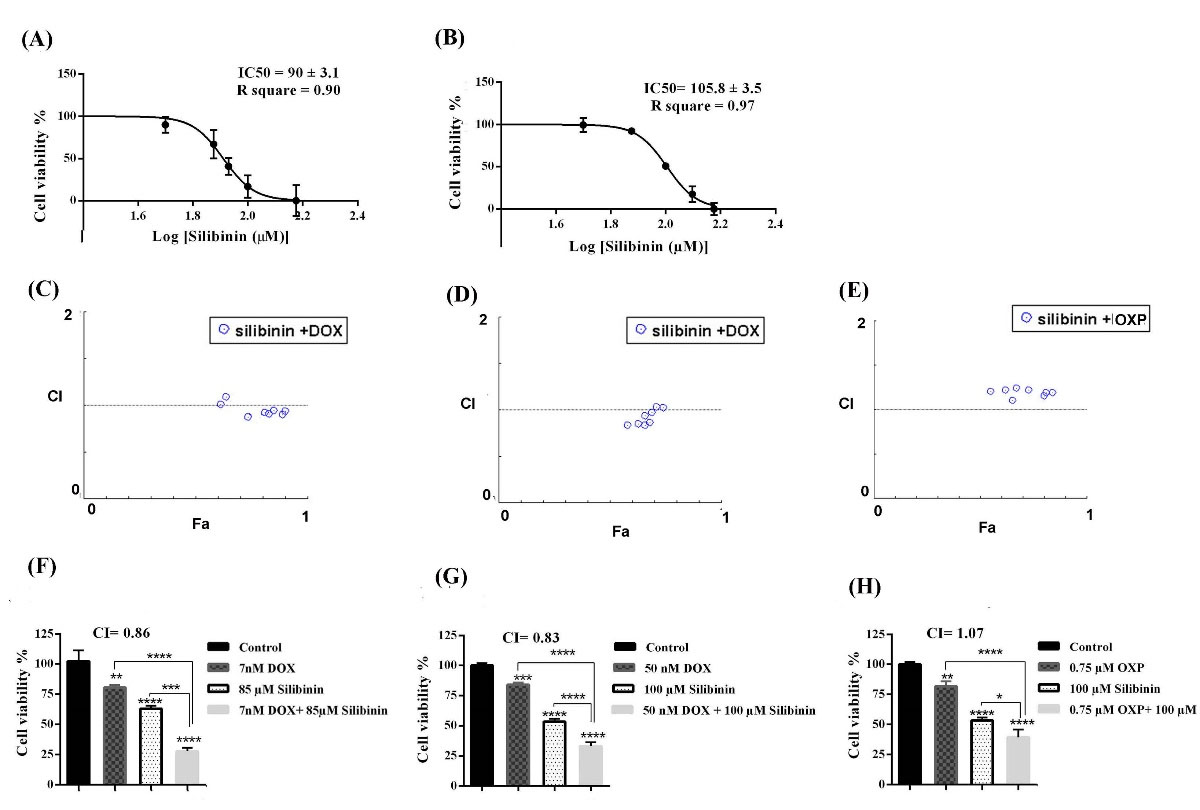
Fig. 1.
Dose-response curves of silibinin, in (A) B16F10 cells, (B) CT26 cells. Dose-response curves were created by GraphPad prism software to obtain IC50 values. Fa-CI plot of combination therapy in (C) B16F10 cell, (D) and (E) CT26 cells obtained by Compusyn software. Anticancer effect of each mono- and combination therapies were determined by MTT assay (F) silibinin, DOX, and silibinin+DOX in B16F10 cell, (G) silibinin, DOX, and silibinin+DOX and (H) silibinin, OXP, silibinin+OXP in CT26 cell. All experiments were repeated three times (n=3), and data represent mean ± SD (standard deviation).
*P<0.05, **P<0.01 and ***P<0.001 and ****P<0.0001.
.
Dose-response curves of silibinin, in (A) B16F10 cells, (B) CT26 cells. Dose-response curves were created by GraphPad prism software to obtain IC50 values. Fa-CI plot of combination therapy in (C) B16F10 cell, (D) and (E) CT26 cells obtained by Compusyn software. Anticancer effect of each mono- and combination therapies were determined by MTT assay (F) silibinin, DOX, and silibinin+DOX in B16F10 cell, (G) silibinin, DOX, and silibinin+DOX and (H) silibinin, OXP, silibinin+OXP in CT26 cell. All experiments were repeated three times (n=3), and data represent mean ± SD (standard deviation).
*P<0.05, **P<0.01 and ***P<0.001 and ****P<0.0001.
The dose-response curves for growth inhibitory effects of DOX in B16F10 and CT26 cells were determined in our previous work,18 and it was shown that DOX inhibited the growth of B16F10 and CT26 cells with IC50 values of 11.4 ± 1.9 nM and 257.3 ± 12 nM, respectively.
The effects of OXP on cell growth and ICD were tested in CT26, and the dose-response curve for growth inhibitory effects of OXP was reported in the previous study.18 The IC50 value for anticancer effects of OXP was found to be 1.56 ± 0.29 µM in CT26 cells.
To evaluate whether silibinin can increase the anticancer effects of the selected chemotherapy drugs(OXP and DOX) in CT26 and B16F10 cancer cells, we exposed the cells with silibinin single-agent or in combination with OXP or DOX. Table 1 shows the different concentrations of combination therapies and their inhibitory effects.
Table 1.
The concentration of compounds and the fraction of cell inhibited after treatment (Fa)
|
B16F10 cells
|
CT26 cells
|
|
Silibinin + DOX
|
Fa
|
Silibinin + DOX
|
Fa
|
Silibinin + OXP
|
Fa
|
| 85 µM + 5 nM |
0.57 |
85 µM + 50 nM |
0.58 |
85 µM + 0.75 µM |
0.55 |
| 100 µM + 5 nM |
0.63 |
100 µM+ 50 nM |
0.66 |
100 µM+ 0.75 µM |
0.65 |
| 85 µM + 7 nM |
0.72 |
85 µM + 100 nM |
0.63 |
85 µM + 1 µM |
0.62 |
| 100 µM + 7 nM |
0.81 |
100 µM+ 100 nM |
0.68 |
100 µM+ 1 µM |
0.67 |
| 85 µM +10 nM |
0.83 |
85 µM + 200 nM |
0.66 |
85 µM + 1.5 µM |
0.73 |
| 100 µM +10 nM |
0.85 |
100 µM+ 200 nM |
0.69 |
100 µM+ 1.5 µM |
0.80 |
| 85 µM + 15 nM |
0.89 |
85 µM + 400 nM |
0.71 |
85 µM + 2 µM |
0.81 |
| 100 µM + 15 nM |
0.90 |
100 µM+ 400 nM |
0.74 |
100 µM + 2 µM |
0.84 |
Among different treatments, the lowest CI was considered an optimum concentration to treat cancer cells in the following experiments. Fig. 1C, D, and E show the CI-Fa plots obtained by Compusyn software. Each of the monotherapy and combination therapy concentrations used in this study demonstrated a significant reduction of cell viability in cancer cells as compared with an untreated control group (Fig. 1F, G, and H). Additional images obtained by Compusyn are available in Fig. S1 of Supplementary file 1. The optimum CI in B16F10 cells treated with a combination of silibinin and DOX was achieved by 85 µM of silibinin and 7 nM of DOX. The CI value for this combinational therapy was found to be 0.86, indicating the synergistic anticancer effect of combination therapy with DOX and silibinin in B16F10 cells (Fig. 1C). As demonstrated in Fig. 1F, in B16F10 cells, the cell viability percentage decreased from 80.47 ± 1.8% in DOX-treated cells and 62.9 ± 2% in the silibinin monotherapy group to 27.8 ± 2.2%, in the cells treated with silibinin (85 µM) in combination with DOX (7 nM). There was a significant difference between the group treated with combination therapy and received monotherapy in B16F10 cells (P <0.0001). In CT26 cells, the optimum CI value for combination therapy of silibinin and DOX was 0.83 depicting synergistic effects of silibinin and DOX combination therapy (Fig. 1D). Likewise, treatment of the CT26 cell line with the selected combination therapy, silibinin (100 µM) in combination with DOX (50 nM), resulted in a significant reduction in the percentage of the cell viability in the combinational therapy group compared with the groups treated with each drug alone (P <0.0001) (Fig. 1G).
The optimum CI value for silibinin and OXP combination therapy was obtained to be 1.07, which indicates the additive effect (Fig. 1E). Cell viability declined from 53.36 ± 1.9 % in silibinin-exposed cells and 83.96 ± 1.4% in OXP-exposed cells to 33.8 ± 2.4% in CT26 cells exposed to the combination of silibinin (100 µM ) and OXP (0.75 µM) (P<0.05) (Fig. 1H).
Inhibitory effect of silibinin alone and in combinational treatment on pSTAT3 level
Several lines of previous studies have shown that silibinin suppresses the activity of STAT3, which is constitutively active in most human malignancies and plays a crucial role in cancer cell growth.19,20 The active form of STAT3 (pSTAT3) is a critical oncogenic protein, which promotes tumor progression by the induction of cancer cell proliferation and survival, development of resistance to chemotherapy drugs, and the induction of immunosuppression in TME.15,21,22 Previous studies have reported that silibinin can sensitize cancer cells harboring constitutively active STAT3 to chemotherapy by suppressing STAT3 activity. Therefore, we purposed to investigate whether silibinin can suppress the active form of STAT3 (pSTAT3) in hyperactive STAT3 selected cancer cell lines. As demonstrated in Fig. 2A and B, treatment with silibinin alone and in combination with DOX and OXP caused a remarkable reduction in the pSTAT3 level in both cancer cells when compared with the control group. These results were in line with the previous studies.23,24
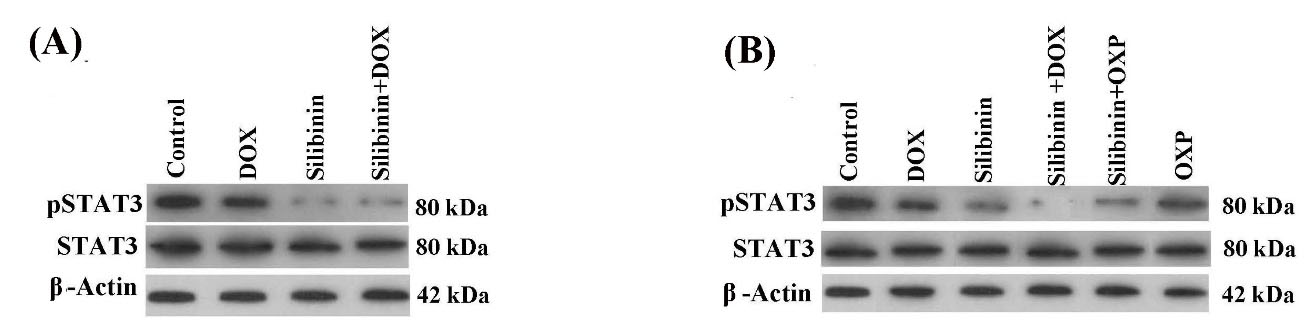
Fig. 2.
Western blotting analysis of pSTAT3 in (A) B16F10 cells, and (B) CT26 cells. The level of STAT3 activity (indicated by p-STAT3) was considerably reduced in the cancer cells following both treatment with silibinin alone or in combination with the chemotherapeutic drugs.
.
Western blotting analysis of pSTAT3 in (A) B16F10 cells, and (B) CT26 cells. The level of STAT3 activity (indicated by p-STAT3) was considerably reduced in the cancer cells following both treatment with silibinin alone or in combination with the chemotherapeutic drugs.
Apoptosis in the cancer cells exposed to silibinin and /or chemotherapy drugs
ICD is a kind of apoptosis, which can stimulate a Th1-type anticancer immune response.9 Thus, in this research, we proposed to evaluate whether silibinin in monotherapy or its combination with chemotherapy drugs can induce apoptosis in cancer cells. Fig. 3 shows that silibinin in monotherapy and its combination with DOX and OXP induced apoptosis in B16F10 and CT26 cancer cells. Of note, silibinin shifted the DOX-induced necrotic cell death to apoptosis in the groups exposed to the combination of silibinin and DOX in both cell lines (Fig. 3A and B). This observation was in line with the previous results achieved in prior studies.25,26
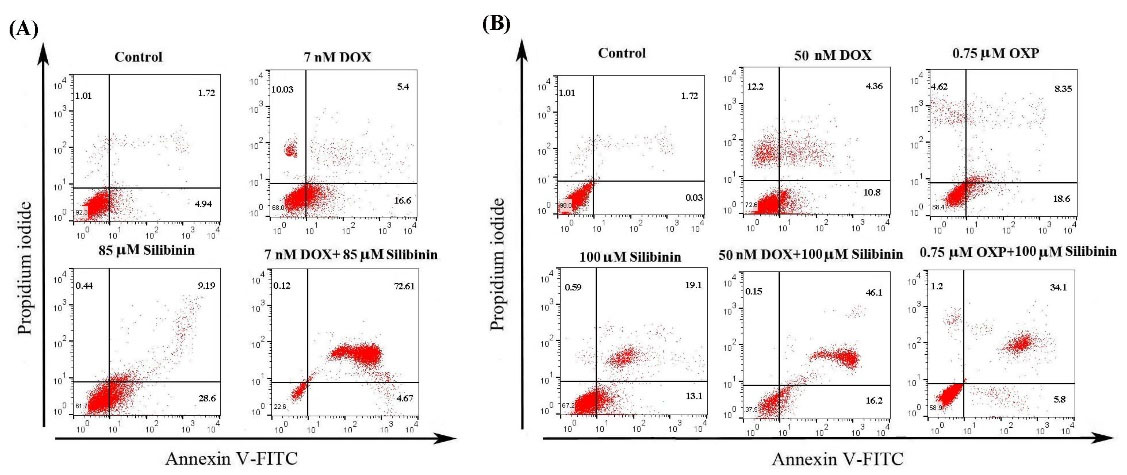
Fig. 3.
Representative flow cytometry analysis of apoptosis stained with Annexin-FITC/PI. (A) Treatment of B16F10 cells with silibinin, DOX, and silibinin+DOX and (B) treatment of CT26 cells with silibinin, DOX, OXP, silibinin+DOX, and silibinin+OXP. Silibinin alone and in combination with chemotherapeutic drugs induced apoptosis. Each experiment was performed in triplicate.
.
Representative flow cytometry analysis of apoptosis stained with Annexin-FITC/PI. (A) Treatment of B16F10 cells with silibinin, DOX, and silibinin+DOX and (B) treatment of CT26 cells with silibinin, DOX, OXP, silibinin+DOX, and silibinin+OXP. Silibinin alone and in combination with chemotherapeutic drugs induced apoptosis. Each experiment was performed in triplicate.
Evaluation of CRT expression on the surface of cells exposed to silibinin and/or chemotherapy drugs
The expression of CRT on the surface of cancer cells is an essential indicator for the induction of ICD. Previous studies have revealed that CRT surface exposure on the cancer cells triggers antigen-presenting cells' activation of phagocyte apoptotic bodies of dead cancer cells.5 In the present work, we evaluated the potential of silibinin in the induction or improvement of ICD by assessing the cell surface exposure of CRT. Cancer cells were exposed to monotherapy with silibinin or combination therapy with DOX or OXP for 48 h and were stained with fluorescently labeled anti-CRT. As depicted in Fig. 4A, while CRT expression level increased from 6.4% in the control group to 16.8% in the cells exposed to silibinin alone (85 µM), a remarkable increase (77%), about ten-fold as much as control, was observed in the level of CRT in the cells exposed to silibinin (85 µM) in combination with DOX (7 nM).
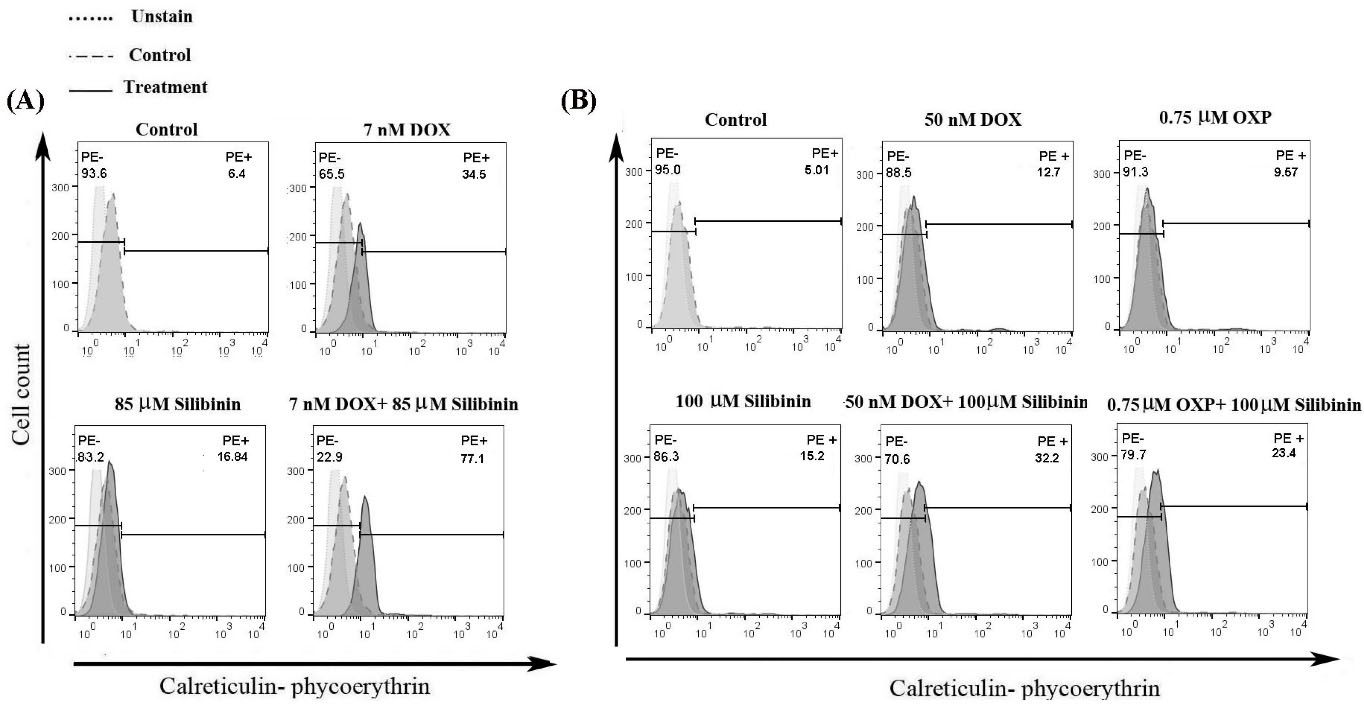
Fig. 4.
Representative flow cytometry histogram of CRT surface exposure on (A) B16F10 cells treated with silibinin, DOX, silibinin+DOX, and (B) CT26 cells treated with silibinin, DOX, OXP, silibinin+DOX, and silibinin+OXP. The cells were stained by PE-conjugated anti-CRT, and all data represent one out of three experiments.
.
Representative flow cytometry histogram of CRT surface exposure on (A) B16F10 cells treated with silibinin, DOX, silibinin+DOX, and (B) CT26 cells treated with silibinin, DOX, OXP, silibinin+DOX, and silibinin+OXP. The cells were stained by PE-conjugated anti-CRT, and all data represent one out of three experiments.
In CT26 cells (Fig. 4B), silibinin alone (100 µM) induced CRT expression on the cells (15.2%), and combinational treatment with silibinin (100 µM) and DOX (50 nM) resulted in a remarkable rise in CRT exposure as compared with group exposed to DOX alone (32.2% vs. 12.7%). On the other hand, we observed a slight rise in the cell surface exposure of CRT in the cells exposed to silibinin (100 µM) in combination with OXP (0.75 µM) as compared with the silibinin monotherapy group (23.4% vs. 15.2%).
Assessment of HMGB1 secreted from cancer cells exposed to silibinin and/or chemotherapy drugs
HMGB1 is a nuclear molecule, which is secreted by the cancer cells through the ICD. Prior studies showed that HMGB1 induces T cell-mediated anticancer immune responses.27 Therefore, to evaluate the induction of ICD in cancer cells, we examined the level of HMGB1 secretion in the supernatants of cancer cells exposed to silibinin alone or in combination with chemotherapy drugs. In the B16F10 cells, the secretion level of HMGB1 went up from 2.86 ± 108 ng/mL in the control group to 9 ± 1.4 and 14.4 ± 1.3 ng/mL in the silibinin and DOX groups, respectively (Fig. 5A). Interestingly, a significantly higher secretion level of HMGB1 (22.2 ±1.4 ng/mL) was found in the supernatant of B16F10 cells treated with the combination of DOX and silibinin as compared with what was observed in the cells exposed to DOX or silibinin alone (P<0.01 and P<0.0001). Likewise, in CT26 cells, silibinin and DOX combinational therapy significantly increased the HMGB1 level to 21.33 ± 1.1 ng/mL compared with each agent alone (P<0.0001). Of note, in both cell lines, the level of HMGB1 release in the cells exposed to combinational therapy of silibinin and DOX was significantly higher than that in DOX and silibinin monotherapies (Fig. 5A and B).
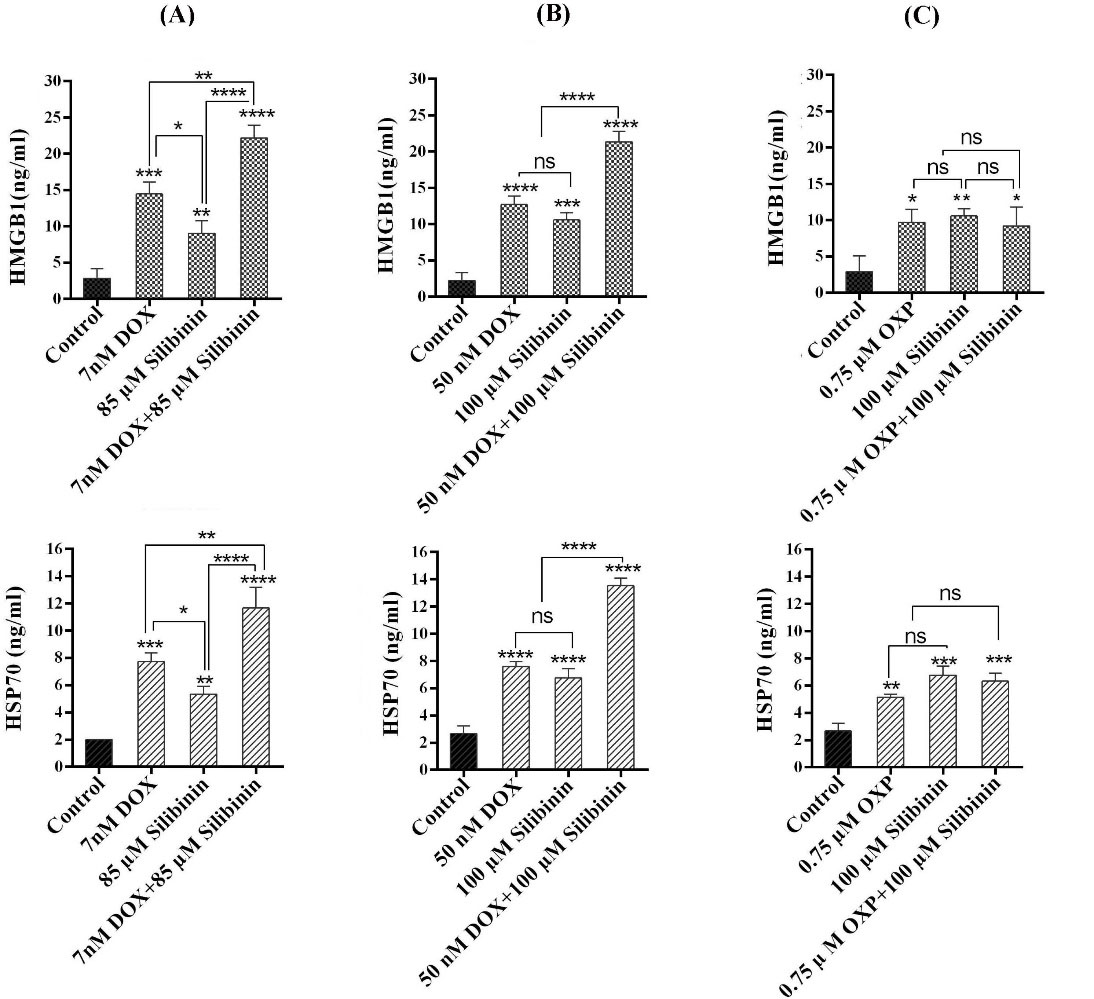
Fig. 5.
Release of HMGB1 and HSP70 analyzed by ELISA assay following treatment with (A) silibinin, DOX, and silibinin+DOX in B16F10 cell, (B) silibinin, DOX and silibinin+DOX, and (C) Silibinin, OXP, and silibinin+ OXP in CT26 cells. Each data is representative of the mean of triplicate ± SD. *P<0.05, **P<0.01 and ***P<0.001 and **** P<0.0001. Not significant, ns.
.
Release of HMGB1 and HSP70 analyzed by ELISA assay following treatment with (A) silibinin, DOX, and silibinin+DOX in B16F10 cell, (B) silibinin, DOX and silibinin+DOX, and (C) Silibinin, OXP, and silibinin+ OXP in CT26 cells. Each data is representative of the mean of triplicate ± SD. *P<0.05, **P<0.01 and ***P<0.001 and **** P<0.0001. Not significant, ns.
Next, we assessed the effects of OXP and silibinin combinational treatment on the induction of HMGB1 in CT26 cells. As shown in Fig. 5C, while treatment of CT26 cells with OXP (0.75 µM) or silibinin (100 µM) alone induced a significant increase in the level of HMGB1 in CT26 cells as compared to the control group, combinational therapy with silibinin (100 µM) and OXP did not result in a significantly higher level of HMGB1 compared to the monotherapy with each drug (P > 0.05) (Fig. 5C).
Assessment of HSP70 secreted from cancer cells exposed to silibinin and /or chemotherapy drugs
Prior studies demonstrate that the extracellular secretion of HSP70 protein frequently happens in cancer cells dying from ICD.7 Therefore, we examined the secretion level of HSP70 protein from cancer cells exposed to silibinin and/or chemotherapy drugs. As depicted in Fig. 5A, B, and C, similar to our observation on HMGB1 release, the HSP70 level in both CT26 and B16F10 cells exposed to silibinin and DOX was significantly higher than that in the control group. The combinational treatment with silibinin and DOX showed a significant increase in the level of HSP70 release in both cell lines compared with what was found in the cells exposed to each agent alone.
Examination of HSP70 level in CT26 cells following treatment with the combination of silibinin and OXP demonstrated a notable increase in the secretion of HSP70 in the cells exposed to OXP and silibinin compared with the control group (p<0.001). As shown in Fig. 5C, the level of HSP70 in cells that were exposed to both OXP and silibinin was not significantly higher than what was found in cells that were exposed to each agent alone (Fig. 5C).
Assessment of IL-12 secretion in BMDCs exposed to the CM from cancer cells
The secretion of IL-12 cytokine in DCs is the main indicator for DCs functional maturation and T cell-mediated immune response, a suitable form of the immune response against cancer.28 To determine whether the induced ICD by silibinin single-agent or in combination with chemotherapy drugs in cancer cells can stimulate DCs functional maturation and activate T cell responses, we assessed the IL-12 secretion in the supernatants of DCs exposed to the CM of cancer cells.
Analyzing the data obtained from the ELISA assay revealed a significant rise in the level of IL-12 secreted by BMDCs treated with the CM from cancer cells exposed to DOX (P<0.0001) in comparison to what was found for BMDCs exposed to CM from the untreated control group (Fig. 6A and B). Interestingly, the level of IL-12 significantly increased from 30 ± 1.7 pg/mL in the supernatant of DCs treated with CM of B16F10 cells exposed to silibinin to 85.2± 2.6 pg/mL in DCs treated with CM from B16F10 cells treated with a combination of silibinin and DOX (P<0.01). Similarly, the level of IL-12 in DCs treated with the supernatant of CT26 cells exposed to silibinin in combination with DOX was notably higher than that in the media culture of DCs treated with CM of CT26 exposed to DOX or silibinin alone (P<0.001 and P<0.01). The level of IL-12 in the supernatant of DCs treated with CM from CT26 received DOX and silibinin combination therapy was 63.6 ± 2.2 pg/mL, whereas the IL-12 concentration was found to be 43.3 ± 1.8 pg/mL and 41.06 ± 1.3 pg/mL in the media culture of DCs treated with CM from CT26 exposed to DOX and silibinin, respectively.
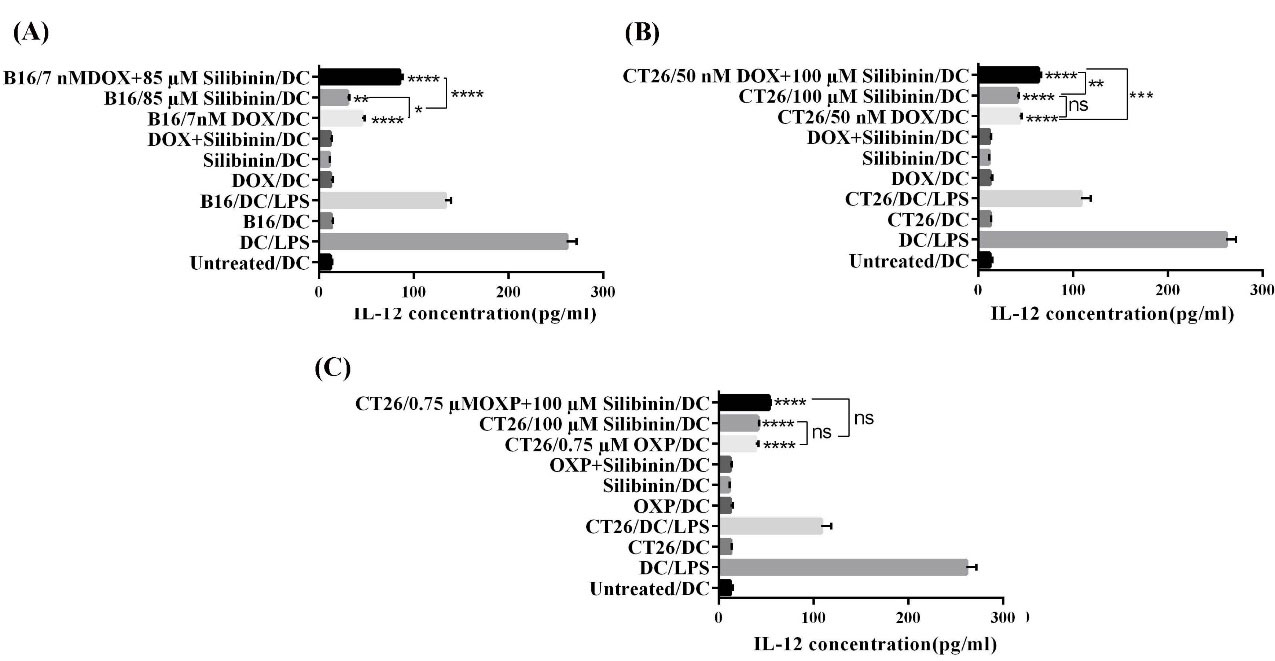
Fig. 6.
Assessment of IL-12 secretion by ELISA in the supernatants of BMDCs after the exposure to CM collected from (A) treated B16F10 cell, (B), and (C) treated CT26 cell. All data are representative of the mean of triplicate ± SD. *P<0.05, **P<0.01 and ***P<0.001 and ****P<0.0001. Not significant, ns.
.
Assessment of IL-12 secretion by ELISA in the supernatants of BMDCs after the exposure to CM collected from (A) treated B16F10 cell, (B), and (C) treated CT26 cell. All data are representative of the mean of triplicate ± SD. *P<0.05, **P<0.01 and ***P<0.001 and ****P<0.0001. Not significant, ns.
As depicted in Fig. 6C, treatment of DCs with CM of CT26 cells exposed to OXP or silibinin significantly enhanced the level of IL-12 secretion (P<0.0001). However, in comparison with the OXP and silibinin monotherapy groups, we did not observe a remarkable rise in the level of IL-12 in the supernatant of DCs treated with CM of CT26 exposed to OXP in combination with silibinin. We found that the level of IL-12 secretion in this study was in correlation with the results we obtained for the level of DAMPS (i.e., CRT, HSP70, and HGMB1).
Discussion
Induction of ICD is a promising strategy for overcoming cancer-induced immunosuppression in TME, which is believed to be one of the main reasons for treatment failure in cancer patients. In recent years, there has been a great interest in identifying natural compounds, which can induce or potentiate anticancer immune responses.3 The present study aims to evaluate the potential of silibinin, a known natural anticancer agent, in stimulating ICD in cancer cells. We also assessed its effects on augmenting ICD induced by two known immunogenic chemotherapy drugs (OXP and DOX). A recent report from our research group has demonstrated that inhibition of STAT3 with a selective inhibitor, stattic, increases the cytotoxicity of DOX in cancer cells and enhances ICD induced by DOX.18 Silibinin has been identified as a potential agent in the treatment of various types of cancers. As silibinin is shown to inhibit STAT3 and enhance the cytotoxicity of chemotherapy agents such as DOX,24,29 we hypothesized that silibinin can induce ICD and/or potentiate the DOX-induced ICD.
In this study, we found significantly higher anticancer activity resulting from the silibinin/DOX combination as compared to the silibinin/OXP combination. The reason behind this observation may be related to the fact that these DOX and OXP are known to have different mechanisms of action.11,30 The additive (rather than synergistic) anticancer effects generated by the combination of OXP and silibinin suggest that the two drugs likely work through different biological pathways/processes that are independent of each other. It will be of interest to define these pathways/processes in further studies. In contrast with the silibinin/OXP combination, results from both in vivo and in vitro studies have supported the concept that the silibinin/DOX combination exerts synergistic anticancer effects.23,29 One of the known molecular effects of silibinin is to suppress the NF-κB pathway, which is known to confer chemoresistance in cancer cells.15,31,32 This property of silibinin may provide one of the explanations for the synergism between DOX and silibinin. We would like to point out that the silibinin/DOX synergism is not restricted to the two cell lines we examined in this study; it has been shown that silibinin can sensitize breast cancer cells to DOX.23 We also speculate that the silibinin/DOX synergism is likely cell-type specific, as the biochemical and molecular deregulations that can be modulated by silibinin are expected to be variable among different cell types.
Several lines of previous studies have shown that the growth inhibitory effect of silibinin correlates with its suppressive effects on various oncogenic proteins such as Bcl2 and STAT3.15 The suppressive role of silibinin on STAT3 in cancer cells has been reported in several studies.19 Consistent with previous studies, we found that silibinin effectively suppressed the expression of pSTAT3 in CT26 and B16F10, both of which are known to express constitutively active STAT3. This effect was found when silibinin was used as a single agent or in combination with chemotherapy. STAT3, an essential oncogenic protein, is constitutively active in about 70% of cancers and this abnormality promotes cancer progression by stimulating cancer cell growth, survival, angiogenesis, and metastasis. Notably, STAT3 activity suppresses anticancer immune responses by modulating the TME.33,34 Considering the recent success in treating cancer by overcoming the immunosuppression in TME, STAT3 inhibitory agents such as silibinin can be promising anticancer drugs to induce potent anticancer immune responses in cancer patients.
Prior studies have shown that the modulation of various pro-apoptotic and anti-apoptotic molecules (i.e., BAX, Bcl2) is the main mechanism by which silibinin induces apoptosis in different types of cancers.35 In this research, we detected a small percentage of necrosis in the CT26 and B16F10 cells exposed to DOX, and this result was in line with previously published studies.25,26 Interestingly, the fraction of necrotic cells decreased when cancer cells were exposed to the combination therapy of silibinin and DOX. Prior studies have found a number of mechanisms by which silibinin can enhance the induction of apoptotic death by DOX in cancer cells. For instance, it has been shown that silibinin hinders the activation of DOX-induced NF-κB, which is responsible for cancer cells' resistance to DOX in A549 cancer cells.31 Consistent with this report, in xenograft mouse models, animals treated with DOX/silibinin combination showed significantly better responses than the negative-control mice and those who received DOX or silibinin alone.36
Next, we found that silibinin treatment alone or in combination therapy with DOX significantly enhances the level of DAMPs associated with ICD in both CT26 and B16F10 cell lines. Consistent with previous research introducing DOX as an ICD inducer,26,37,38 we found that DOX significantly augmented the CRT exposure on the cell surface and enhanced the secretion of HSP70 and HMGB1 in cancer cells. Importantly, we observed that silibinin can potentially induce the expression of CRT and the secretion of HSP70 and HMGB1 in cancer cells. These data suggested that silibinin has the potential to stimulate ICD in cancer cells.
Interestingly, the combinational treatment of cancer cells with silibinin and DOX caused a significantly higher CRT level, HMGB1, and HSP70, compared to the cells treated with each agent alone. The main reason behind this result may be a return to the suppressive role of silibinin on STAT3 activity in CT26 and B16F10 cells, both of which carry the constitutively active form of STAT3. In support of this notion, we and others have previously reported that inhibition of STAT3 in the cancer cells harboring constitutively active STAT3 enhances the induction of ICD by DOX.18,39
OXP is the other chemotherapy drug that has been known to ICD in various kinds of cancer cells.6,40 Our results also depicted that OXP can induce ICD in the CT26 colon cancer cell line, in line with previous reports. However, we did not find a significant rise in CRT expression of HSP70 and HMGB1 secretion in CT26 cells exposed to a combination of OXP and silibinin compared with the cells that received monotherapy with each agent. The better efficacy of combination therapy of DOX and silibinin for induction of ICD compared with the combinational treatment with OXP and silibinin might be related to the differences in the mechanism by which OXP and DOX induce cell death. Besides, in line with our observation, prior reports demonstrated that DOX is much more potent than OXP in inducing ICD.11,30,41
IL-12 secretion in DCs is an important indicator of DCs activation and a measure of their ability to induce Th1-type immune responses, which leads to cell-mediated immunity.42 Therefore, our findings suggest that silibinin single-agent or in combination with a chemotherapy drug (i.e., DOX) has the potential to induce Th1-type immune responses. In support of this perception, previous studies have shown that extracellular secretion of HSP70 and HMGB1 as an outcome of immunogenic chemotherapy persuades DCs to functional maturation through binding to TLR4, allowing for stimulation of Th1 anticancer immune response.7
Conclusion
In this research, we reported that silibinin enhances the anticancer effect of DOX synergistically (CI<1.1) in cancer cells with hyperactive STAT3 (B16F10 and CT26 cells). Importantly, silibinin induces ICD and significantly enhances the level of DAMPs such as CRT, HMGB1, and HSP70 induced by chemotherapy drugs (i.e., DOX). We also observed that CM from cancer cells exposed to silibinin alone or in combination with DOX significantly induces secretion of IL-12 in DCs as compared to the control group, indicating the potency of these treatments in priming cell-mediated anticancer immune response. These observations imply that silibinin not only increases the anticancer therapeutic efficiency of DOX but also enhances DOX immunogenicity as an ICD inducer. Our findings suggest that silibinin can be a promising candidate for the induction of ICD, which is believed to be a promising cancer immunotherapy strategy. Additional studies are needed to examine the different molecular pathways by which silibinin induces ICD and improves the induction of this type of cell death by chemotherapeutic agents in cancer cells. Given the profound effects of ICD on the induction of anticancer immune responses, further in vivo studies are suggested to investigate the anticancer effects of combinational therapy with silibinin and chemotherapeutic drugs in animal cancer models.
Research Highlights
What is the current knowledge?
√ ICD is a promising strategy to overcome cancer-induced immunosuppression in the tumor microenvironment, which is considered a major challenge to the success of cancer immunotherapy.
√ Silibinin is a natural nontoxic anticancer agent, which induces apoptosis in cancer cells.
What is new here?
√ Silibinin induces ICD and it significantly increases the induction of this type of cell death by DOX in CT26 and B16F10 cancer cells. The changes in ICD are associated with a remarkable rise in the level of DAMPs.
√ CM from the cancer cells exposed to silibinin and DOX, stimulates IL-12 secretion by DCs suggesting that such treatment can induce Th1 responses.
Acknowledgments
This study includes a part of research work submitted for a PharmD degree to the faculty of pharmacy. This project has been supported by the Biotechnology Research Center, Tabriz University of Medical Sciences (thesis No: 4130).
Authors’ contribution
SJ contributed to this research by investigation, writing and preparation of original draft; SH contributed by investigation; RL conceptualized this research and reviewed the manuscript; EMA also contributed by reviewing and editing the manuscript; OM conceptualized and supervised this research and reviewed the manuscript. All listed authors have read and approved the final manuscript.
Funding sources
This study was funded by Biotechnology Research Center, Tabriz University of Medical Sciences (Grant number: 4130).
Ethical statement
None to be declared.
Competing interests
The authors declare that they have no competing interests.
Supplementary Materials
Supplementary file 1 contains Figure S1.
(pdf)
References
- Aymeric L, Apetoh L, Ghiringhelli F, Tesniere A, Martins I, Kroemer G. Tumor cell death and ATP release prime dendritic cells and efficient anticancer immunity. Cancer Res 2010; 70:855-8. doi: 10.1158/0008-5472.CAN-09-3566 [Crossref] [ Google Scholar]
- Jafari S, Molavi O, Kahroba H, Hejazi MS, Maleki-Dizaji N, Barghi S. Clinical application of immune checkpoints in targeted immunotherapy of prostate cancer. Cell Mol Life Sci 2020; 77:3693-710. doi: 10.1007/s00018-020-03459-1 [Crossref] [ Google Scholar]
- Li X. The inducers of immunogenic cell death for tumor immunotherapy. TUMORI J 2018; 104:1-8. doi: 10.5301/tj.5000675 [Crossref] [ Google Scholar]
- Pitt JM, Kroemer G, Zitvogel L. Immunogenic and non-immunogenic cell death in the tumor microenvironment. Tumor Immune Microenvironment in Cancer Progression and Cancer Therapy. Springer; 2017. p. 65-79. 10.1007/978-3-319-67577-0-5.
- Panaretakis T, Joza N, Modjtahedi N, Tesniere A, Vitale I, Durchschlag M. The co-translocation of ERp57 and calreticulin determines the immunogenicity of cell death. Cell Death Differ 2008; 15:1499. doi: 10.1038/cdd.2008.67 [Crossref] [ Google Scholar]
- Radogna F, Diederich M. Stress-induced cellular responses in immunogenic cell death: Implications for cancer immunotherapy. Biochem Pharmacol 2018. 153: 12-23. 10.1016/j.bcp.2018.02.006.
- Fang H, Ang B, Xu X, Huang X, Wu Y, Sun Y. TLR4 is essential for dendritic cell activation and anti-tumor T-cell response enhancement by DAMPs released from chemically stressed cancer cells. Cell Mol Immunol 2014; 11:150. doi: 10.1038/cmi.2013.59 [Crossref] [ Google Scholar]
- Kepp O, Galluzzi L, Martins I, Schlemmer F, Adjemian S, Michaud M. Molecular determinants of immunogenic cell death elicited by anticancer chemotherapy. Cancer Metast Rev 2011; 30:61-9. doi: 10.1007/s10555-011-9273-4 [Crossref] [ Google Scholar]
- Montico B, Nigro A, Casolaro V, Dal Col J. Immunogenic apoptosis as a novel tool for anticancer vaccine development. Int J Mol Sci 2018; 19:594. doi: 10.3390/ijms19020594 [Crossref] [ Google Scholar]
- Devaud C, John LB, Westwood JA, Darcy PK, Kershaw MH. Immune modulation of the tumor microenvironment for enhancing cancer immunotherapy. Oncoimmunology 2013; 2:e25961. doi: 10.4161/onci.25961 [Crossref] [ Google Scholar]
- Diederich M. Natural compound inducers of immunogenic cell death. Arch Pharmacal Res 2019; 42:629-645. doi: 10.1007/s12272-019-01150-z [Crossref] [ Google Scholar]
- Paolini A, Pasi F, Facoetti A, Mazzini G, Corbella F, Di Liberto R. Cell death forms and HSP70 expression in U87 cells after ionizing radiation and/or chemotherapy. Anticancer Res 2011; 31:3727-31. [ Google Scholar]
- Khaledi S, Jafari S, Hamidi S, Molavi O, Davaran S. Preparation and characterization of PLGA-PEG-PLGA polymeric nanoparticles for co-delivery of 5-Fluorouracil and Chrysin. Journal of Biomaterials Science, Polymer Edition 2020; 31:1107-26. doi: 10.1080/09205063.2020.1743946 [Crossref] [ Google Scholar]
- Rad AH, Asiaee F, Jafari S, Shayanfar A, Lavasanifar A, Molavi O. Poly (ethylene glycol)-poly (ε-caprolactone)-based micelles for solubilization and tumor-targeted delivery of silibinin. BioImpacts 2020; 10:87. doi: 10.34172/bi.2020.11 [Crossref] [ Google Scholar]
- Bosch-Barrera J, Queralt B, Menendez JA. Targeting STAT3 with silibinin to improve cancer therapeutics. Cancer Treat Rev 2017; 58:61-9. doi: 10.1016/j.ctrv.2017.06.003 [Crossref] [ Google Scholar]
- Chou T-C. Theoretical basis, experimental design, and computerized simulation of synergism and antagonism in drug combination studies. Pharmacol Rev 2006; 58:621-81. doi: 10.1124/pr.58.3.10 [Crossref] [ Google Scholar]
- Garg SM, Vakili MR, Molavi O, Lavasanifar A. Self-Associating Poly (ethylene oxide)-block-poly (α-carboxyl-ε-caprolactone) Drug Conjugates for the Delivery of STAT3 Inhibitor JSI-124: Potential Application in Cancer Immunotherapy. Mol Pharm 2017; 14:2570-84. doi: 10.1021/acs.molpharmaceut.6b01119 [Crossref] [ Google Scholar]
- Jafari S, Lavasanifar A, Hejazi MS, Maleki-Dizaji N, Mesgari M, Molavi O. STAT3 inhibitory stattic enhances immunogenic cell death induced by chemotherapy in cancer cells. DARU 2020; 28:159-69. doi: 10.1007/s40199-020-00326-z [Crossref] [ Google Scholar]
- Bosch-Barrera J, Menendez JA. Silibinin and STAT3: A natural way of targeting transcription factors for cancer therapy. Cancer Treat Rev 2015; 41:540-6. doi: 10.1016/j.ctrv.2015.04.008 [Crossref] [ Google Scholar]
- Verdura S, Cuyàs E, Llorach-Parés L, Pérez-Sánchez A, Micol V, Nonell-Canals A. Silibinin is a direct inhibitor of STAT3. Food Chem Toxicol 2018; 116:161-72. doi: 10.1016/j.fct.2018.04.028 [Crossref] [ Google Scholar]
- Zhao C, Li H, Lin H-J, Yang S, Lin J, Liang G. Feedback activation of STAT3 as a cancer drug-resistance mechanism. Trends Pharmacol Sci 2016; 37:47-61. doi: 10.1016/j.tips.2015.10.001 [Crossref] [ Google Scholar]
- Jones LM, Broz ML, Ranger JJ, Ozcelik J, Ahn R, Zuo D. STAT3 establishes an immunosuppressive microenvironment during the early stages of breast carcinogenesis to promote tumor growth and metastasis. Cancer Res 2016; 76:1416-28. doi: 10.1158/0008-5472.CAN-15-2770 [Crossref] [ Google Scholar]
- Molavi O, Narimani F, Asiaee F, Sharifi S, Tarhriz V, Shayanfar A. Silibinin sensitizes chemo-resistant breast cancer cells to chemotherapy. Pharm Biol 2017; 55:729-39. doi: 10.1080/13880209.2016.1270972 [Crossref] [ Google Scholar]
- Byun HJ, Darvin P, Kang DY, Sp N, Joung YH, Park JH. Silibinin downregulates MMP2 expression via Jak2/STAT3 pathway and inhibits the migration and invasive potential in MDA-MB-231 cells. Oncol Rep 2017; 37:3270-8. doi: 10.3892/or.2017.5588 [Crossref] [ Google Scholar]
- Eom Y-W, Kim MA, Park SS, Goo MJ, Kwon HJ, Sohn S. Two distinct modes of cell death induced by doxorubicin: apoptosis and cell death through mitotic catastrophe accompanied by senescence-like phenotype. Oncogene 2005; 24:4765. doi: 10.1038/sj.onc.1208627 [Crossref] [ Google Scholar]
- Son K-j, ryung Choi K, Ryu C-K, Lee SJ, Kim HJ, Lee H. Induction of immunogenic cell death of tumors by newly synthesized heterocyclic quinone derivative. PloS One 2017; 12:e0173121. doi: 10.1371/journal.pone.0173121 [Crossref] [ Google Scholar]
- Kroemer G, Galluzzi L, Kepp O, Zitvogel L. Immunogenic cell death in cancer therapy. Annu Rev Immunol 2013; 31:51-72. doi: 10.1146/annurev-immunol-032712-100008 [Crossref] [ Google Scholar]
- Henry CJ, Ornelles DA, Mitchell LM, Brzoza-Lewis KL, Hiltbold EM. IL-12 produced by dendritic cells augments CD8+ T cell activation through the production of the chemokines CCL1 and CCL17. J Immunol 2008; 181:8576-84. doi: 10.4049/jimmunol.181.12.8576 [Crossref] [ Google Scholar]
- Dheeraj A, Tailor D, Singh SP, Singh RP. Anticancer Attributes of Silibinin: Chemo-and Radiosensitization of Cancer. Role of Nutraceuticals in Cancer Chemosensitization: Elsevier; 2018. p. 199-220. 10.1016/B978-0-12-812373-7.00010-3.
- Zhou J, Wang G, Chen Y, Wang H, Hua Y, Cai Z. Immunogenic cell death in cancer therapy: Present and emerging inducers. Cell Mol Med 2019; 23:4854-486. doi: 10.1111/jcmm.14356 [Crossref] [ Google Scholar]
- Raina K, Agarwal R. Combinatorial strategies for cancer eradication by silibinin and cytotoxic agents: efficacy and mechanisms. Acta Pharmacol Sin 2007; 28:1466. doi: 10.1111/j.1745-7254.2007.00691.x [Crossref] [ Google Scholar]
- Zhang Y, Ge Y, Ping X, Yu M, Lou D, Shi W. Synergistic apoptotic effects of silibinin in enhancing paclitaxel toxicity in human gastric cancer cell lines. Mol Med Rep 2018; 18:1835-41. doi: 10.3892/mmr.2018.9129 [Crossref] [ Google Scholar]
- Wang X, Crowe PJ, Goldstein D, Yang J-L. STAT3 inhibition, a novel approach to enhancing targeted therapy in human cancers. Int J Oncol 2012; 41:1181-91. doi: 10.3892/ijo.2012.1568 [Crossref] [ Google Scholar]
- Ilkovitch D, Lopez DM. Immune modulation by melanoma‐derived factors. Exp Dermatol 2008; 17:977-85. [ Google Scholar]
- Kauntz H, Bousserouel S, Gosse F, Marescaux J, Raul F. Silibinin, a natural flavonoid, modulates the early expression of chemoprevention biomarkers in a preclinical model of colon carcinogenesis. Int J Oncol 2012; 41:849-54. doi: 10.3892/ijo.2012.1526 [Crossref] [ Google Scholar]
- Singh RP, Mallikarjuna G, Sharma G, Dhanalakshmi S, Tyagi AK, Chan DC. Oral silibinin inhibits lung tumor growth in athymic nude mice and forms a novel chemocombination with doxorubicin targeting nuclear factor κB–mediated inducible chemoresistance. Clin Cancer Res 2004; 10:8641-7. doi: 10.1158/1078-0432.CCR-04-1435 [Crossref] [ Google Scholar]
- Mattarollo SR, Loi S, Duret H, Ma Y, Zitvogel L, Smyth MJ. Pivotal role of innate and adaptive immunity in anthracycline chemotherapy of established tumors. Cancer Res 2011; 71:4809-20. doi: 10.1158/0008-5472.CAN-11-0753 [Crossref] [ Google Scholar]
- Tongu M, Harashima N, Yamada T, Harada T, Harada M. Immunogenic chemotherapy with cyclophosphamide and doxorubicin against established murine carcinoma. Cancer Immunol Immunother 2010; 59:769-77. doi: 10.1007/s00262-009-0797-1 [Crossref] [ Google Scholar]
- Yang H, Yamazaki T, Pietrocola F, Zhou H, Zitvogel L, Ma Y. STAT3 inhibition enhances the therapeutic efficacy of immunogenic chemotherapy by stimulating type 1 interferon production by cancer cells. Cancer Res 2015; 75:3812-22. doi: 10.1158/0008-5472.CAN-15-1122 [Crossref] [ Google Scholar]
- Tesniere A, Schlemmer F, Boige V, Kepp O, Martins I, Ghiringhelli F. Immunogenic death of colon cancer cells treated with oxaliplatin. Oncogene 2010; 29:482. doi: 10.1038/onc.2009.356 [Crossref] [ Google Scholar]
- Bezu L, Gomes-da-Silva LC, Dewitte H, Breckpot K, Fucikova J, Spisek R. Combinatorial strategies for the induction of immunogenic cell death. Front Immunol 2015; 6:187. doi: 10.3389/fimmu.2015.00187 [Crossref] [ Google Scholar]
- Lee S, Margolin K. Cytokines in cancer immunotherapy. Cancers 2011; 3:3856-93. doi: 10.3390/cancers3043856 [Crossref] [ Google Scholar]