Bioimpacts. 14(3):25288.
doi: 10.34172/bi.2023.25288
Original Article
Micro-extraction, pre-concentration, and microfluidic-based separation of organophosphate insecticides followed by the miniaturized electrochemical detection system
Abdollah Abdollahi Aghdam Conceptualization, Formal analysis, Methodology, Validation, Writing – original draft, 1, 2
Mohsen Chamanara Project administration, 1, 3 
Reza Laripour Writing – review & editing, 4
Mohsen Ebrahimi Conceptualization, Methodology, Project administration, Supervision, Writing – review & editing, 1, 3, *
Author information:
1Department of Toxicology and Pharmacology, Faculty of Medicine, AJA University of Medical Sciences, Tehran, Iran
2Research Center for Pharmaceutical Nanotechnology, Biomedicine Institute, Tabriz University of Medical Sciences, Tabriz, Iran
3Toxicology Research Center, AJA University of Medical Sciences, Tehran, Iran
4Department of Social and Preventive Medicine, Faculty of Medicine, AJA University of Medical Sciences, Tehran, Iran
Abstract
Introduction:
A new analytical method based on the coupling of microextraction and microfluidics was developed and investigated for the pre-concentration, separation, and electrochemical detection of fenitrothion (FT) and parathion (PA) at the sub-ppm concentrations.
Methods:
In the first step, the microchip capillary electrophoresis technique was used to serve as a separation and detection system. Analytes were injected in the 40 mm long microchannel with 10 mm sidearms. Then, they were separated by applying a direct electrical field (+1800 V) between the buffer and detection reservoirs. 2-(n-morpholino)ethanesulfonic acid (MES) buffer (20 mM, pH 5) was used as a running buffer. The electrochemical detection was performed using three Pt microelectrodes with the width of working, counter, and reference electrodes (50, 250, and 250 µm, respectively) in the out-channel approach.
Results:
The system was devised to have the optimum detection potential equal to -1.2 V vs. pseudo-reference electrode. The dimensions of the SU-8 channel have 20 µm depth and 50 µm width. In the second step, an air-assisted liquid-liquid microextraction technique was used to extract and preconcentration of analytes from human blood plasma. Then, 1, 2 di-bromoethan was used as extractant solvent, the analytes were preconcentrated, and the sedimented solvent (50 µL) was evaporated in a 60 ˚C water bath followed by substitution of running buffer containing 10% ethanol. The optimal extraction cycles were found to be 8 with adding 1% NaCl to the aqueous phase. Analyzing time of the mentioned analytes was less than 100s, the precision range was 3.3 – 8.2 with a linear range of 0.8–100 ppm and 1.2–100 ppm for FT and PA, respectively. The extraction recoveries were about 91% and 87% for FT and PA, respectively. The detection limits for FT and PA were 240 and 360 ppb, respectively. Finally, the reliability of the method was investigated by GC-FID.
Conclusion:
The proposed method and device were validated and can be used as in situ and portable detection systems for detecting fenitrothion and parathion insecticides.
Keywords: Organophosphate, Insecticide, Fenitrothion, Parathion, Microextraction, Microfluidics
Copyright and License Information
© 2024 The Author(s).
This work is published by BioImpacts as an open access article distributed under the terms of the Creative Commons Attribution Non-Commercial License (
http://creativecommons.org/licenses/by-nc/4.0/). Non-commercial uses of the work are permitted, provided the original work is properly cited.
Introduction
Nowadays producing pest-free crops and enhanced quality is almost impossible. Various types of chemicals have been used as insecticides, pesticides, herbicides, etc., which have routine use in agriculture. Of these, pesticides as a wide spectrum of chemical compounds are widely used worldwide. The most important chemicals in the organophosphate (OPP) class of insecticides are esters of phosphoric acid.1 The mentioned compounds disrupt the neuro-transmitting process through irreversible covalent inhibition of acetylcholinesterase which is an essential process in insects and of course in human beings.2 These compounds can penetrate the matrices of the fruit and accumulate in the human body (in particular, farmers), which makes them the most toxic and carcinogenic chemicals widely used.3 Therefore, the precise detection of these toxic substances is of imminent importance. To date, various analytical methods have been developed for the determination of OPPs, including electrochemical methods,4-6 spectroscopy-based methods,7,8 HPLC,9-11 GC,12,13 and capillary electrophoresis.14,15 Microchip capillary electrophoresis (MCE), such as electrochemical detection (MCE-EC), is a powerful portable device, which is the first microdevices developed in the early years of the 1990 decade.16 Notably, the MCE devices are the most important devices for in situ analysis with more reduced reagent consumption and are considered as the new generation of modern environmental and biomedical analyses devices.17 In this line, different types of detection systems have been used, including conductivity detection system,18 stripping voltammetry,19,20 amperometry in different electrode positions,21-23 spectroscopy,24 and MS analyzers.25 Among them, the only miniaturized and portable system for point-of-care analysis is an electrochemical detection system (i.e., microelectrodes). Electrochemical systems can couple to various substrate materials such as PDMS,26 SU-8,27 PMMA,28 which are used as the substrate for liquid conduction.
Sample preparation is the most important step in isolating and concentrating target analytes before analyzing. Solid-phase extraction (SPE),29,30 and liquid-liquid extraction (LLE),31 are traditional methods of sample treatment. These techniques are very time and solvent-consuming techniques, especially toxic organic solvents that are pollutants and carcinogens. Furthermore, the mentioned methods need more cost, equipment, and a very qualified person. Recently various microextraction techniques have been developed for the pretreatment of samples, including solid-phase microextraction (SPME),32,33 and liquid-phase microextraction (LPME). These approaches use very low solvents, reagents and need a very short time to prepare samples. In 2006 a new generation of microextraction methods named dispersive liquid-liquid microextraction (DLLME) based on liquid-liquid extraction has been developed by Rezaee et al.34 This method uses two organic solvents, namely disperser which disperses the organic phase in the aqueous phase, and extractant organic phase to extract the analytes into the fine droplets. Lately, a new version of microextraction namely air-assisted liquid-liquid microextraction (AALLME) based on air agitation was developed by Farajzadeh et al.35 In this method, just a few microliters of organic solvent as extractors were used and dispersed in the aqueous phase with the assistance of air. Then, a cloudy solution will be produced and target analytes will extract from the droplets. By a centrifugation process, the organic phase is sedimented and concentrated, and finally, it is separated and detected by various detection systems. In this study, we aimed to extract and pre-concentrate OPP insecticides by the AALLME method from the blood plasma. Then, a portable microchip capillary electrophoresis system was applied to separate and detect OPPs in a time-effective manner with a low volume of reagents. The use of very low extractor solvents and high volume samples were found to result in high enrichment factors that might help to detect the analytes in really trace amounts.
Materials and Methods
Chemicals and reagents
Analytes (fenitrothion and parathion) were purchased from Exir corporation (Yazd, Iran) with purities > 98%. 1,1,2,2–tetrachloroethane (1,1,2,2–TCE) and 1,1,2–Trichloroethane (1,1,2–TCE) were from Janssen Chimica (Beerse, Belgium). Tetrachlorocarbon (TCC), 1,2–dibromoethane (DBE), hydrochloric acid, sodium hydroxide, and ethanol were purchased from Merck (Darmstadt, Germany). 2-(N-morpholino)ethanesulfonic acid was purchased from Sigma–Aldrich (St. Louis, USA). Ultra-pure water was from Shahid Ghazi pharmaceutical Co. Human blood plasma was obtained from the Iranian Blood Transfusion Organization (Tabriz, Iran).
A stock solution (1000 mg.L-1) of each analyte was prepared in an aqueous solution containing 20% ethanol in a 10 mL volumetric flask and stored at 4 ºC and in a dark place not more than a single week. The appropriate concentration of analytes was prepared daily by diluting with ultra-pure water. Running buffer (20 mM) was prepared by dissolving 2-(N-morpholino)ethanesulfonic acid in a volumetric flask, adjusting the pH by HCl/NaOH at 5. Running buffer passed through 0.45 µm syringe filter (Membrane solutions, Kent, USA) to remove the particles.
Apparatus
The microchips were purchased from Micrux Technologies (Oviedo, Spain) and consist of cross-shaped injection (10 mm) and separation (40 mm) channels. The depth and width of SU-8 on the glass were 20 and 50 respectively supported by a 2 mm glass substrate. Three Pt implanted electrodes in the reservoir detection with a width equal to 100 µm were used as working, counter, and pseudo-reference electrodes. A polymethyl methacrylate holder was used as a chip substrate and fixed with four screws. A high-voltage power supply that can apply a voltage between 0 and +2000 V with modulated switcher (Molian-Toos Co., Mashhad, Iran) to change the field direction was used to apply high voltages. More details on the setup design are described in our previous work.36 Dropsense µStat400 (Metrohm, Herisau, Switzerland) was used as a detector and a PC was used as a data recorder. A pH meter (Metrohm model 744, Herisau, Switzerland) was used for the pH measurements. A Sigma centrifuge (3-30KS, Germany) was used to separate the organic phase in the micro-extraction technique. To eliminate the environmental noises, all the experiments were carried out within a Faraday cage.
Electrophoretic procedure
Electrophoresis implementation was an unpinched method. The mentioned method consisted of two steps, as follows:
-
The injection step: an electrical field was applied between sample reservoir (SR) and sample-waste reservoir (SW) while others were floating for a definite time, and
-
The separation step: the direction of the electrical field was changed between buffer reservoir (BR) and detection reservoir (DR) and others were in the floating state.
In the injection step, analytes migrate to the cross-section of the chip, and by changing the direction of the electrical field, while the samples plug are passed through the channel according to their mass/charge (m/z). Finally, the analytes were reduced on the working electrode implemented end of the channel. In the current study, injection and separation voltages were +900 (Tinj=10s) and +1800 V respectively, -1.2 V vs. pseudo reference electrode applied for reduction of the analytes. Optimum pH and buffer concentrations were 5 and 20 mM, respectively.
Extraction procedure
The air-assisted liquid-liquid microextraction (AALLME) technique was used for the extraction of analytes. In this method, the organic solvent is dispersed into the aqueous solution by evoking and dispensing the solution via a glass syringe with stainless steel needle ( 90 mm × 1.8 mm i.d.). The microdroplets of organic solvents were produced through air-assisted turbulence occurring in the bulk of the aqueous solution. The analytes were extracted to the droplets and a cloudy solution was produced. The centrifuging of the sample was sedimented the organic phase containing extracted analytes and a clear solution. The sedimented phase was separated into a microtube and was heated in the water bath. After evaporation of the organic solvent, the running buffer was added to the microtube to solve the analytes. Finally, the solution was injected into the microchip for analysis. 7 mL de-ionized water containing 1 mg/L of target analytes was spiked into a 10 mL glass conical-end tube. Then 80 µL of 1,2–dibromoethane as extraction solvent was dispersed into the aqueous solution (containing 1% NaCl, pH 6). Microextraction cycles were performed 8 times after completing the process, and the cloudy solution was centrifuged at 10 000 rpm for 5 minutes. The sedimented phase was separated into a microtube and heated at 60 ˚C for 4 minutes. Organic solvent substituted by 50 µL running buffer containing 10% ethanol. Then, the solution was injected into the microchip and analyzed by electrophoresis technique.
Sample analyzing
GC analyzing conditions
A standard method (EPA Method 8141A, 1994, rev. 01) was performed by gas chromatography using a Shimadzu gas chromatograph GC–2014 (Shimadzu, Kyoto, Japan) equipped with a flame ionization detector (FID) was conducted. The chromatograph equipped with a split/splitless injector set at 250 ˚C in splitless mode with 1 min sampling time was used for analyte introduction. OPTIMA capillary column (0.53 mm ID × 30-meter length, the film thickness of 0.25 µm) with helium (Gulf Cryo, United Arab Emirates - purity of 99.99 %) as carrier gas was used for separation. A Shimadzu OPGU-1500S produced hydrogen at a flow rate of 30 mL min-1 then introduced to FID (300 ˚C). Temperature programming was set at 120˚C (3-min hold) to 270˚C (10-min hold) at 5˚C min-1.
MCE analyzing conditions
Before running the detection system, all the channels were conditioned by NaOH (0.1 M), deionized water, and running buffer for 15, 10, and 10 minutes respectively. Then, 2-(N-Morpholino)ethanesulfonic acid (20 mM, pH 5) containing 10 % ethanol was used as a running buffer in the capillaries. In the next section baseline, stabilization was carried out, in which the separation field was applied to the channel for 300 seconds while others kept at floating state. After the baseline stabilized, the sample reservoir was filled with the sample, and MCE was implemented. For injection of the analytes, +900 V electrical field applied between SR and SW. Then, the direction of the electrical field (+1800 V ) was changed for separation between BR and DR.
Safety consideration
To avoid electrical shocks, extreme care needs to be considered. All the parts, connectors, and devices must be properly discharged before touching. It is notable that, the electrical arc will occur in distances less than 1 cm, so keep distance between cables and connectors.
Results and Discussion
Optimization of separation and detection parameters
Amperometric detection
To achieve high sensitivity a hydrodynamic voltammogram was drawn and investigated. Target analytes were injected into the sample reservoir dissolved in the MES running buffer and the peak currents plotted vs. detection potential. The optimal potential has been chosen where the detection potential reached the plateau state. As shown in Fig. 1, the optimum potentials were -1.2 and -1.1 V vs. Pt pseudo-reference electrode for fenitrothion and parathion respectively. By decreasing the detection potential, the amount of the analytes which goes under reduction increased. So, the peak height will decrease. Furthermore, with the decreasing of the potential the baseline state was increased, rise and fall. Thus, -1.2 V was selected as the optimum detection potential.
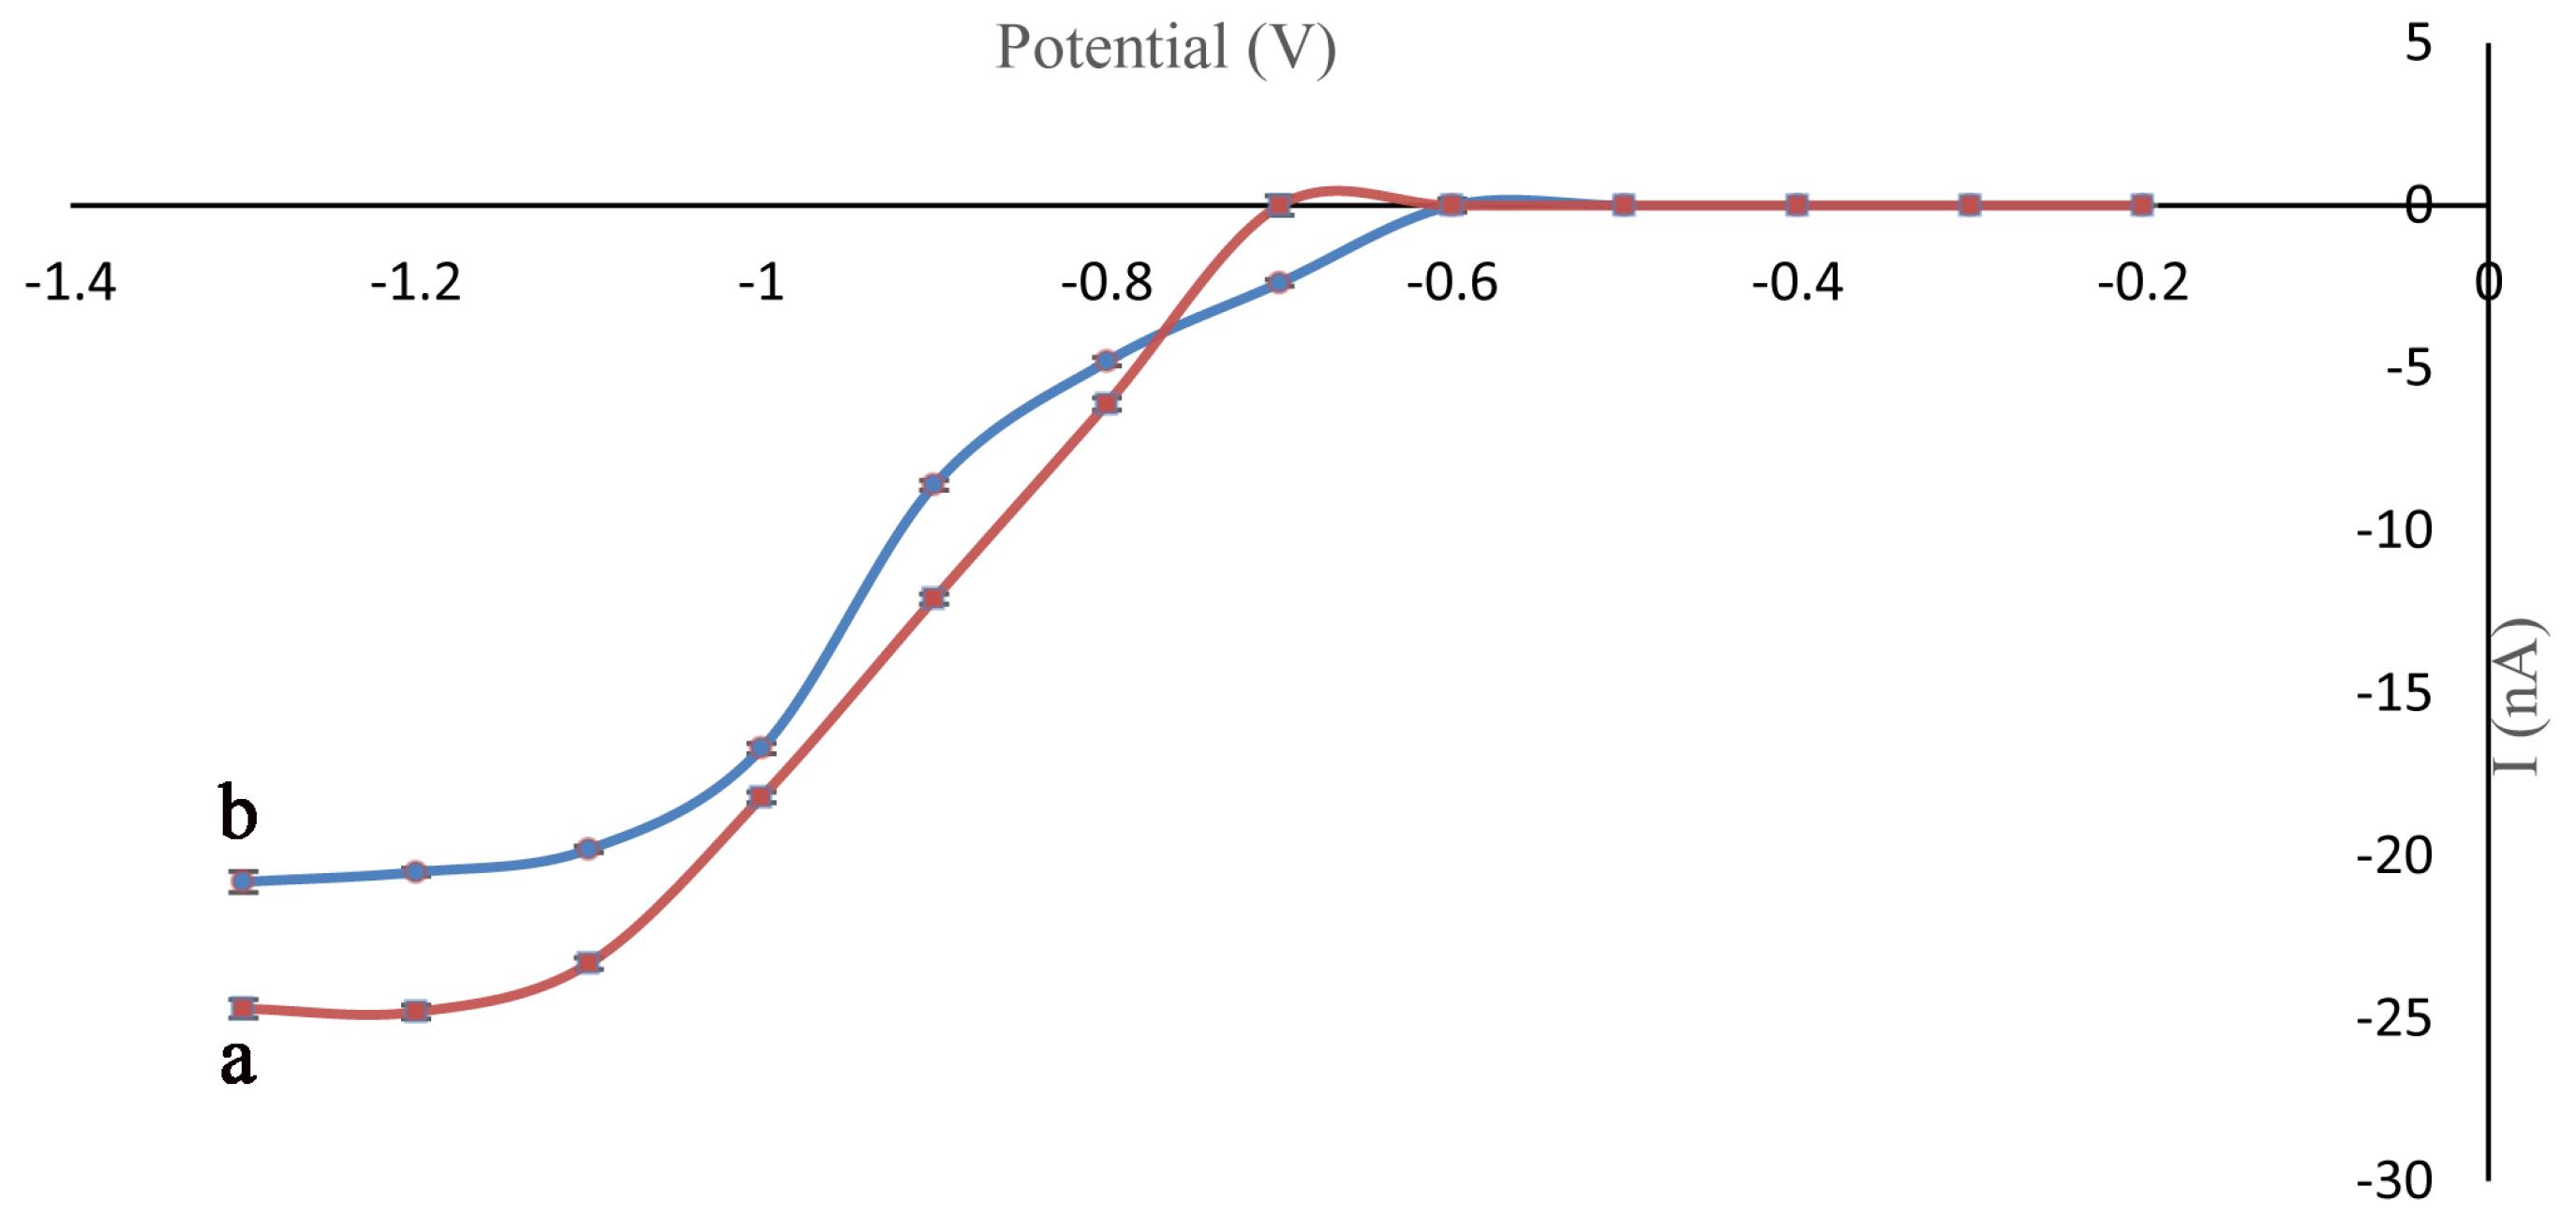
Fig. 1.
Hydrodynamic voltammograms for Fen (a), Par (b) obtained with a Pt working electrode. Other conditions: Concentrations= 100 µgmL-1, Vinj=+ 850 V, Tinj=8, Vsep = +1800 V, running buffer: MES (20 mM, pH 5).
.
Hydrodynamic voltammograms for Fen (a), Par (b) obtained with a Pt working electrode. Other conditions: Concentrations= 100 µgmL-1, Vinj=+ 850 V, Tinj=8, Vsep = +1800 V, running buffer: MES (20 mM, pH 5).
Effect of pH
One of the most important parameters that affect the detection is pH. Therefore, the pH value was investigated in the MES buffer between 5–7. At pH ranges above 7, color change of the sample solution occurred, which means that the analytes are not stable in that range. Furthermore, the pKa value for MES is about 6 and the best buffering area for the mentioned material is 5–7, out of this range it doesn’t have good buffering properties. With the decreasing of the pH value, increasing the analyte peaks was observed, while the time of analyzing was decreased. In the ranges below 5, pH 4 has been investigated and no peaks were observed. As shown in Fig. 2A, pH 5 was selected as the optimum pH value and other parameters were studied at the same pH.
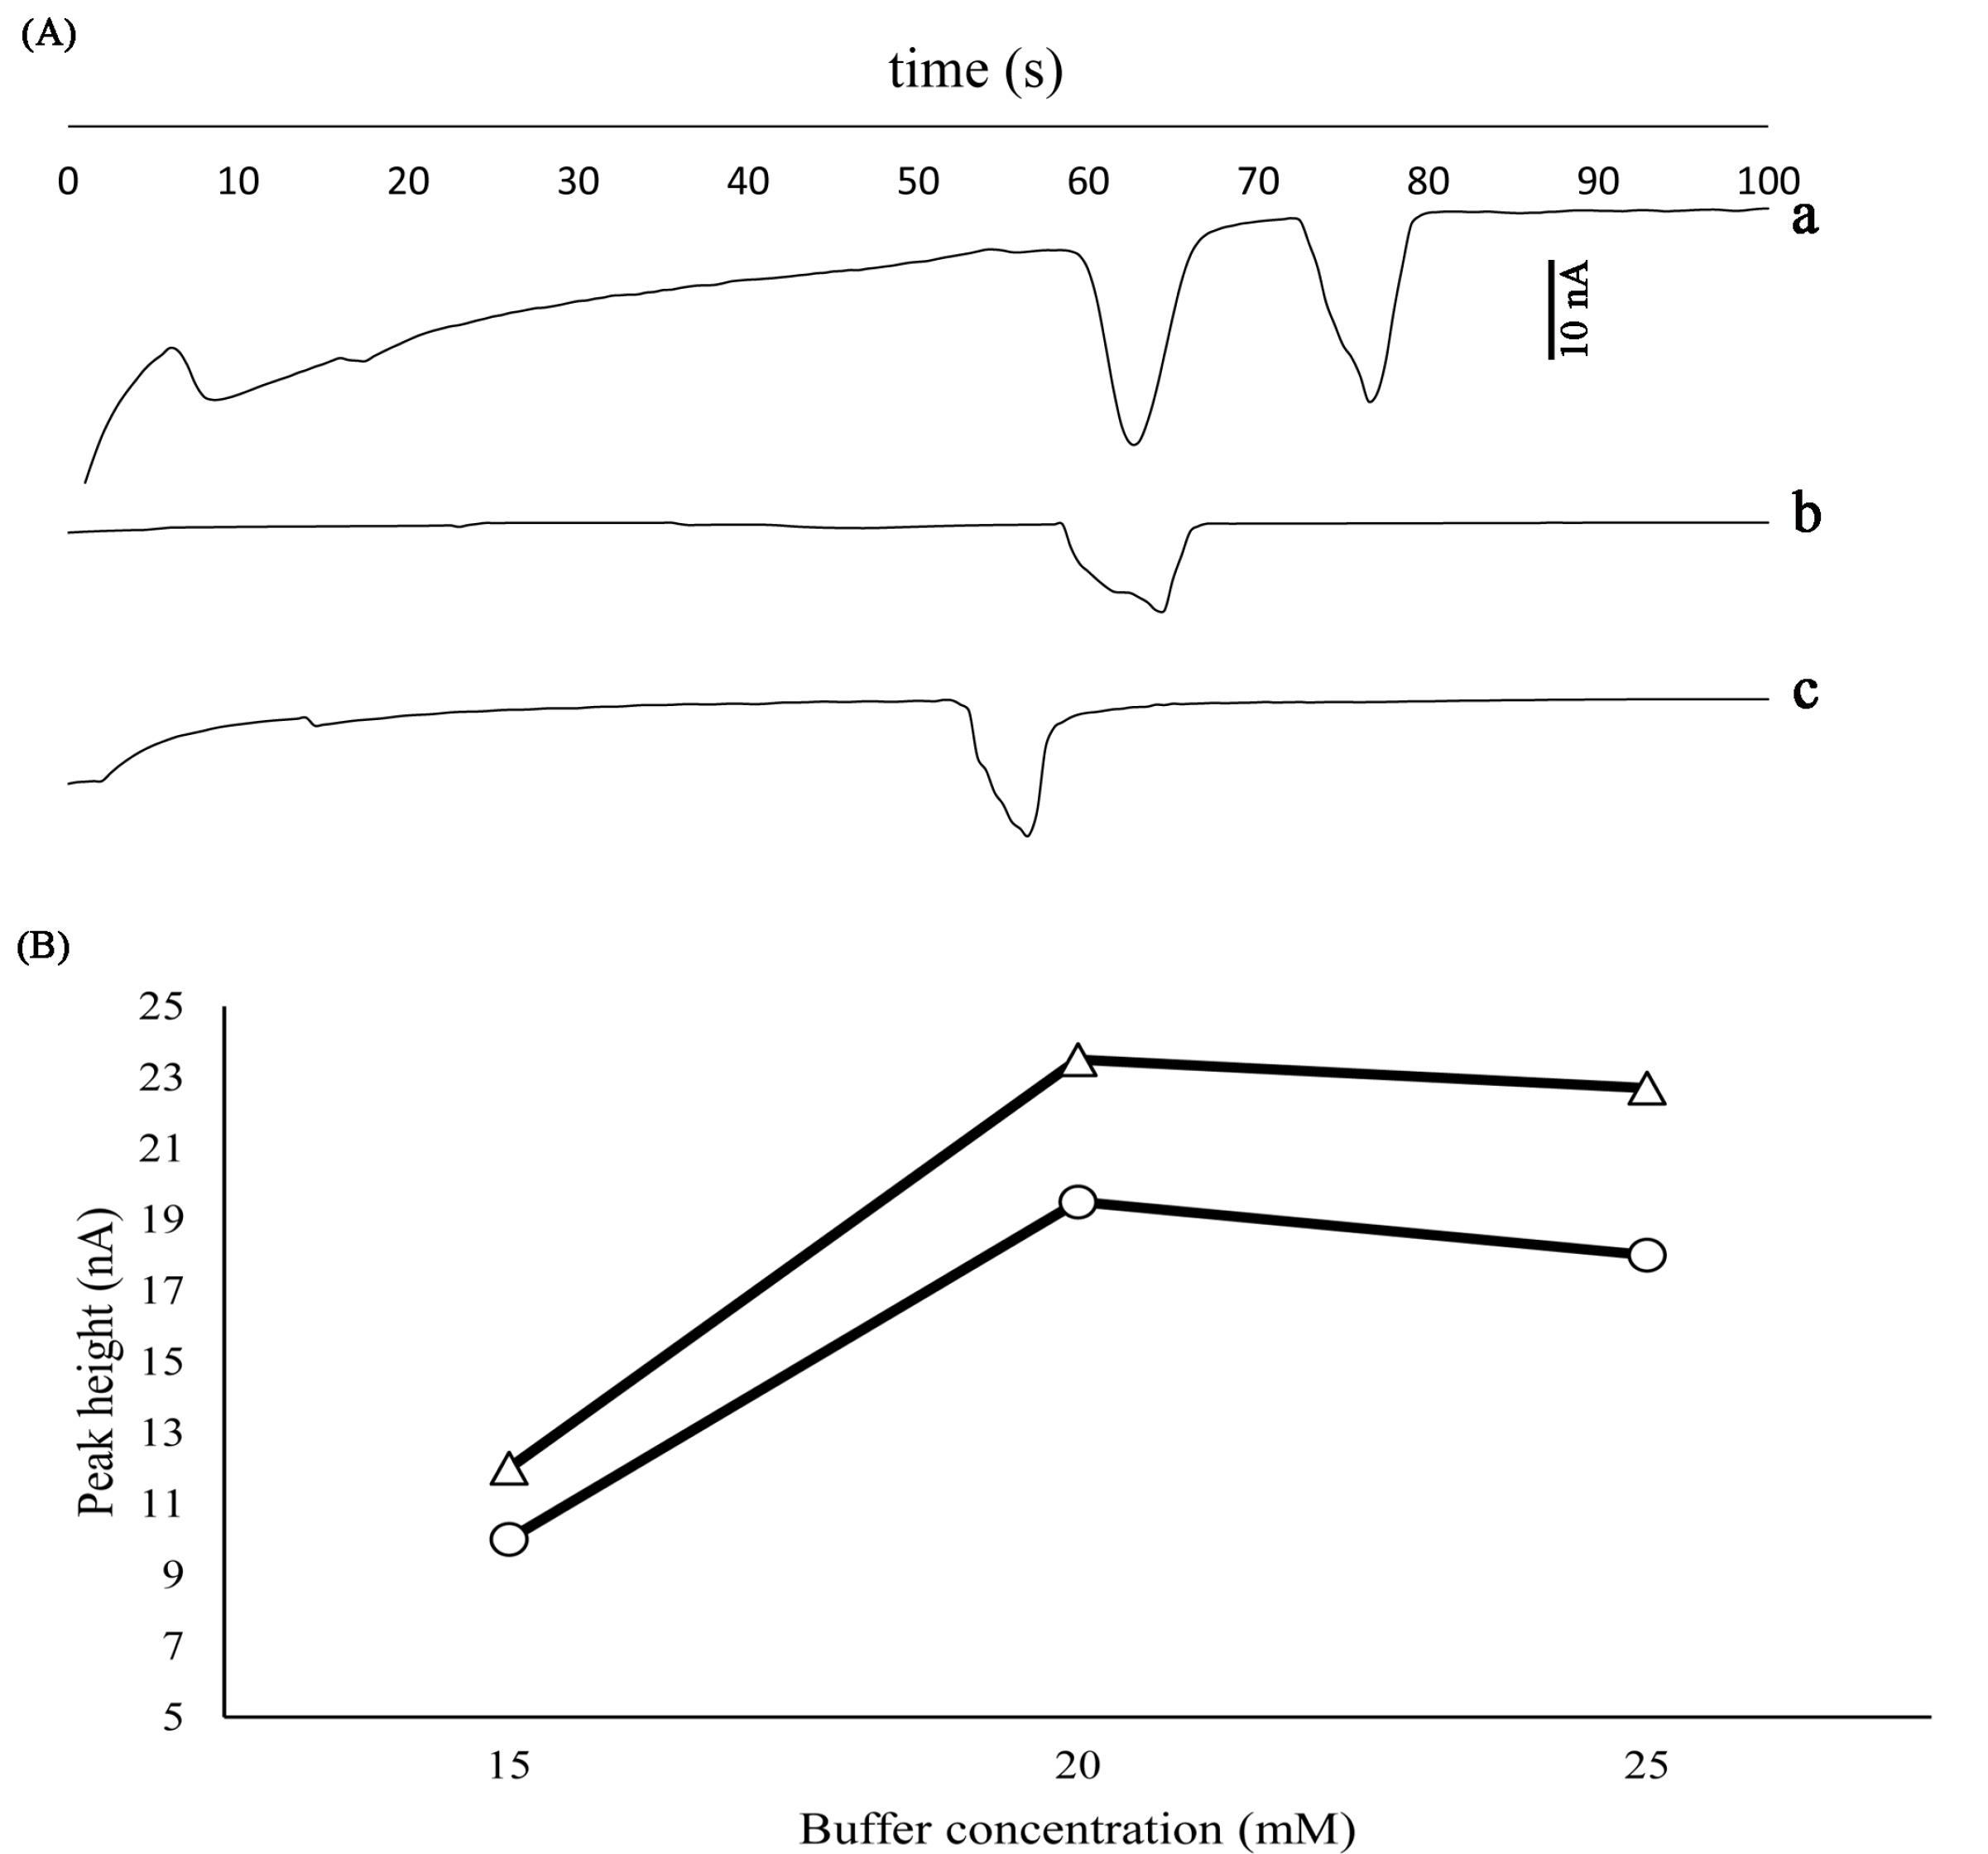
Fig. 2.
(A) Effect of pH on the separation of analytes at a) pH 5, b) pH 6 and c) pH 7. Other conditions: Concentrations: 100 µgmL-1, Vinj=+850 V, Tinj=8, Vsep = +1800 V, Ed= -1.2V vs. Pt pseudo-reference electrode, running buffer: MES (20 mM). (B) Effect of buffer concentration on the peak height for FT (∆), PA (○) obtained with a Pt working electrode. Other conditions: Concentrations: 100 µgmL-1, pH 5, Vinj=+ 850 V, Tinj=8, Vsep = +1800 V, Ed= -1.2 V v.s. Pt pseudo-reference electrode.
.
(A) Effect of pH on the separation of analytes at a) pH 5, b) pH 6 and c) pH 7. Other conditions: Concentrations: 100 µgmL-1, Vinj=+850 V, Tinj=8, Vsep = +1800 V, Ed= -1.2V vs. Pt pseudo-reference electrode, running buffer: MES (20 mM). (B) Effect of buffer concentration on the peak height for FT (∆), PA (○) obtained with a Pt working electrode. Other conditions: Concentrations: 100 µgmL-1, pH 5, Vinj=+ 850 V, Tinj=8, Vsep = +1800 V, Ed= -1.2 V v.s. Pt pseudo-reference electrode.
Effect of buffer concentration
Buffer concentration can affect the baseline current and separation factor and shape of the peaks. In the current study, the buffer concentration was investigated equals 10, 15, 20, and 25 mM. In the concentration of 10 mM, no peaks were observed (Fig. 2B). In the 15 mM, small and flat peaks were observed, with increases in the concentration sharp peaks appeared, and the time of analyzing decreased. This is proportional to ionic strength and electroosmotic flow (EOF). On the other hand, increasing the concentration increases the baseline level and noise. By considering all conditions, 20 mM was selected as the optimum buffer concentration for the background electrolyte (Fig. 2B).
Effect of injection voltage and time
Injection potential draws the sample from the sample reservoir (SR) to the opposite reservoir e.g sample waste reservoir (SW). Actually, by applying potential, the sample solution was conducted to the cross-section of separation and injection channel. The solution in this area creates a “sample plug” which will send to the end of the channel. When the area has been filled, more time and potential don’t affect the size of the sample plug. It was found that in periods less than 5 s no peaks were observed, with increasing the injection time peaks observed and increased to reach a stable state, this is there the sample plug size stabilized. By the way, increasing the injection potential has the same effect. In the current study injection voltages were applied between +600 to +900 V. The results showed that in the ranges less than +800 V no peaks were observed and above it, they appeared. By considering all parameters +900 V was selected as optimum injection voltage. Notably, applying potentials above +1000 V is impossible because of the arc generation.
Effect of separation voltage
The most important parameter in the capillary electrophoresis is separation voltage. In the low ranges, analytes don’t migrate to the end of the channel. By increasing the voltage, analytes started to migrate toward the detection electrodes. The range of separation potential was +1300 V to +2000 V. In the potentials equal to +1300 to +1500 the analytes do not migrate. In the range above +1700, the peaks appeared and in the +1800 V, both analytes appeared and separated. In addition, separation potential affects the baseline and relative separation of the analytes. In the potentials above +1800, the baseline becomes noisy and the peaks were combined. Applying above +2000 V was impossible because of our instrumental limits. Considering separation and stabilization of baseline +1800 V was selected as optimum potential. The results of the separation potential on the peak shapes are shown in Fig. 3.
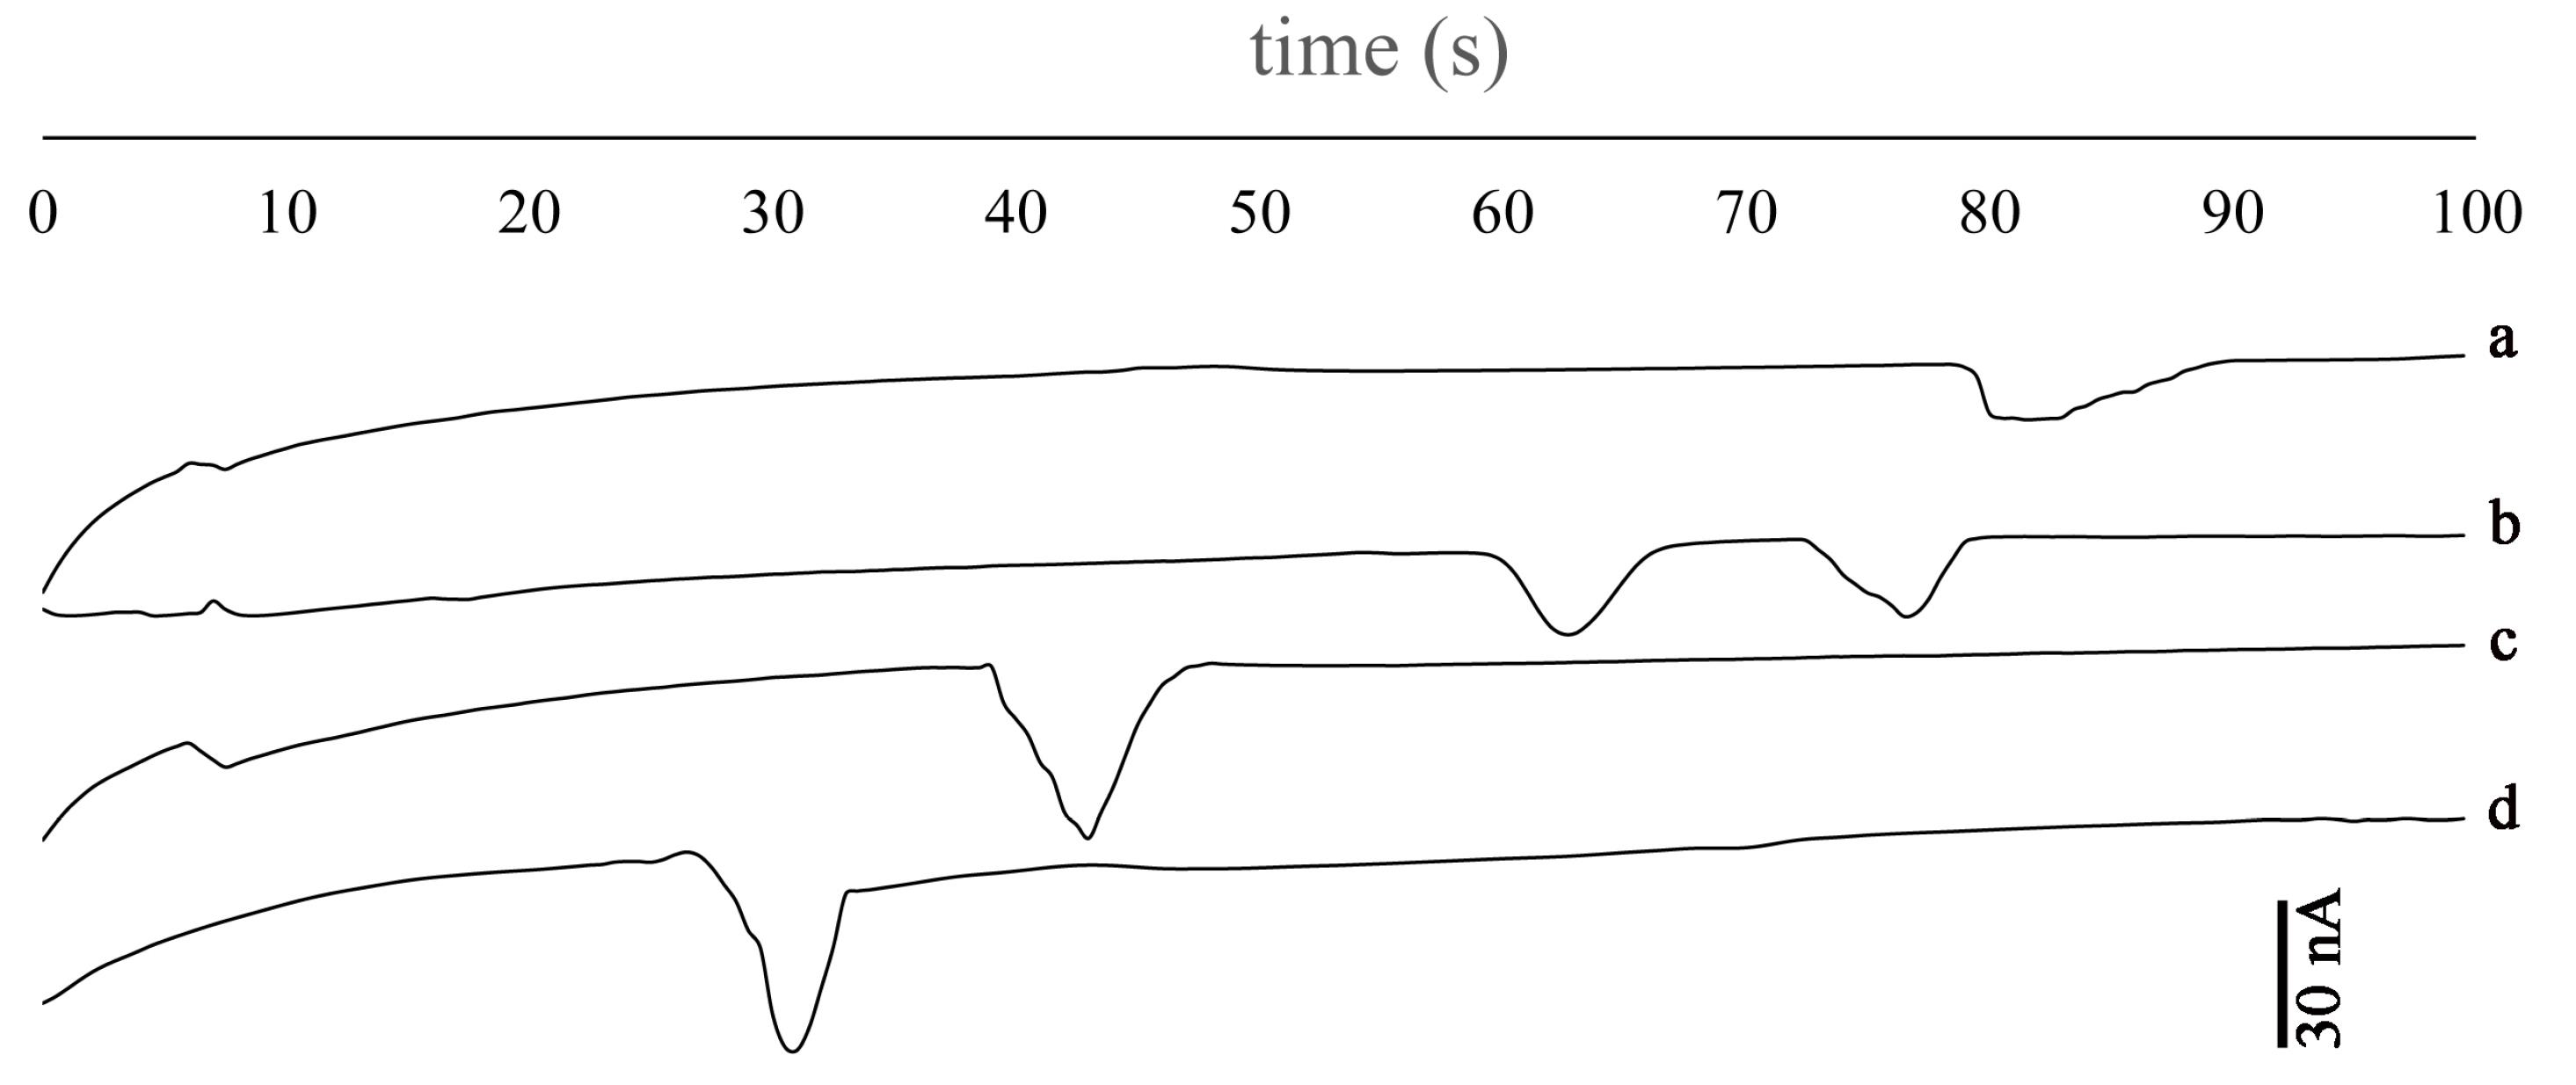
Fig. 3.
Effect of separation voltage a) +1700 V, b) +1800 V, c) +1900 V and d) +2000 V. Other conditions: Concentrations: 100 µgmL-1, Vinj= +900 V, Ed= -1.2 V vs. Pt pseudo-reference electrode, running buffer: 20 mM MES (pH 5).
.
Effect of separation voltage a) +1700 V, b) +1800 V, c) +1900 V and d) +2000 V. Other conditions: Concentrations: 100 µgmL-1, Vinj= +900 V, Ed= -1.2 V vs. Pt pseudo-reference electrode, running buffer: 20 mM MES (pH 5).
Calculation of theoretical plates and relative separation
In the optimum conditions, theoretical plates and relative separation for the analytes can be calculated by equations (1) and (2) that are described as follows.
Where, w1/2 and tm denote the half-peak width and migration time, respectively. The N values for fenitrothion and parathion were 1794.96 and 2616.16 Nm-1, respectively.
In the above equation, w and tm stand for peak width and migration time, respectively. The Rs value was calculated 2.1 for FT/PA, indicating the separation of analytes.
Optimization of micro-extraction parameters
In this section, various organic solvents were investigated for micro-extraction of analytes from the aqueous phase. For this purpose, analytes were extracted, preconcentrated, and analyzed by the MCE-EC method. Notably, electrophoretic operations were performed in the aqueous phase, so the organic phase was replaced by an optimized running buffer containing 10% ethanol as co-solvent.
Selection of extraction solvent
The selection of a solvent is the most important step in the microextraction technique. In the extraction step, various properties of the extraction solvent (e.g., density, extraction capacity, solubility, etc) should be considered. Taken all, 1,1,2,2–TCE, 1,1,2–TCE, TCC and DBE were investigated. To evaluate the extraction properties of the organic solvents, the volume of the sediment phase should be the same. For this purpose, 70, 75, 65, and 80 µL of 1,1,2,2–TCE, 1,1,2–TCE, TCC, and DBE were used, respectively (Fig. 4A). Extraction procedures were performed for 5 cycles and electrochemical signals were evaluated. The concentration of each analyte was 1 ng/mL and the aqueous phase volume was 5 mL. The magnitude of the electrochemical signals showed that DBE has the highest efficiency in the microextraction procedure. Thus, the latest solvent was chosen as an extractant.
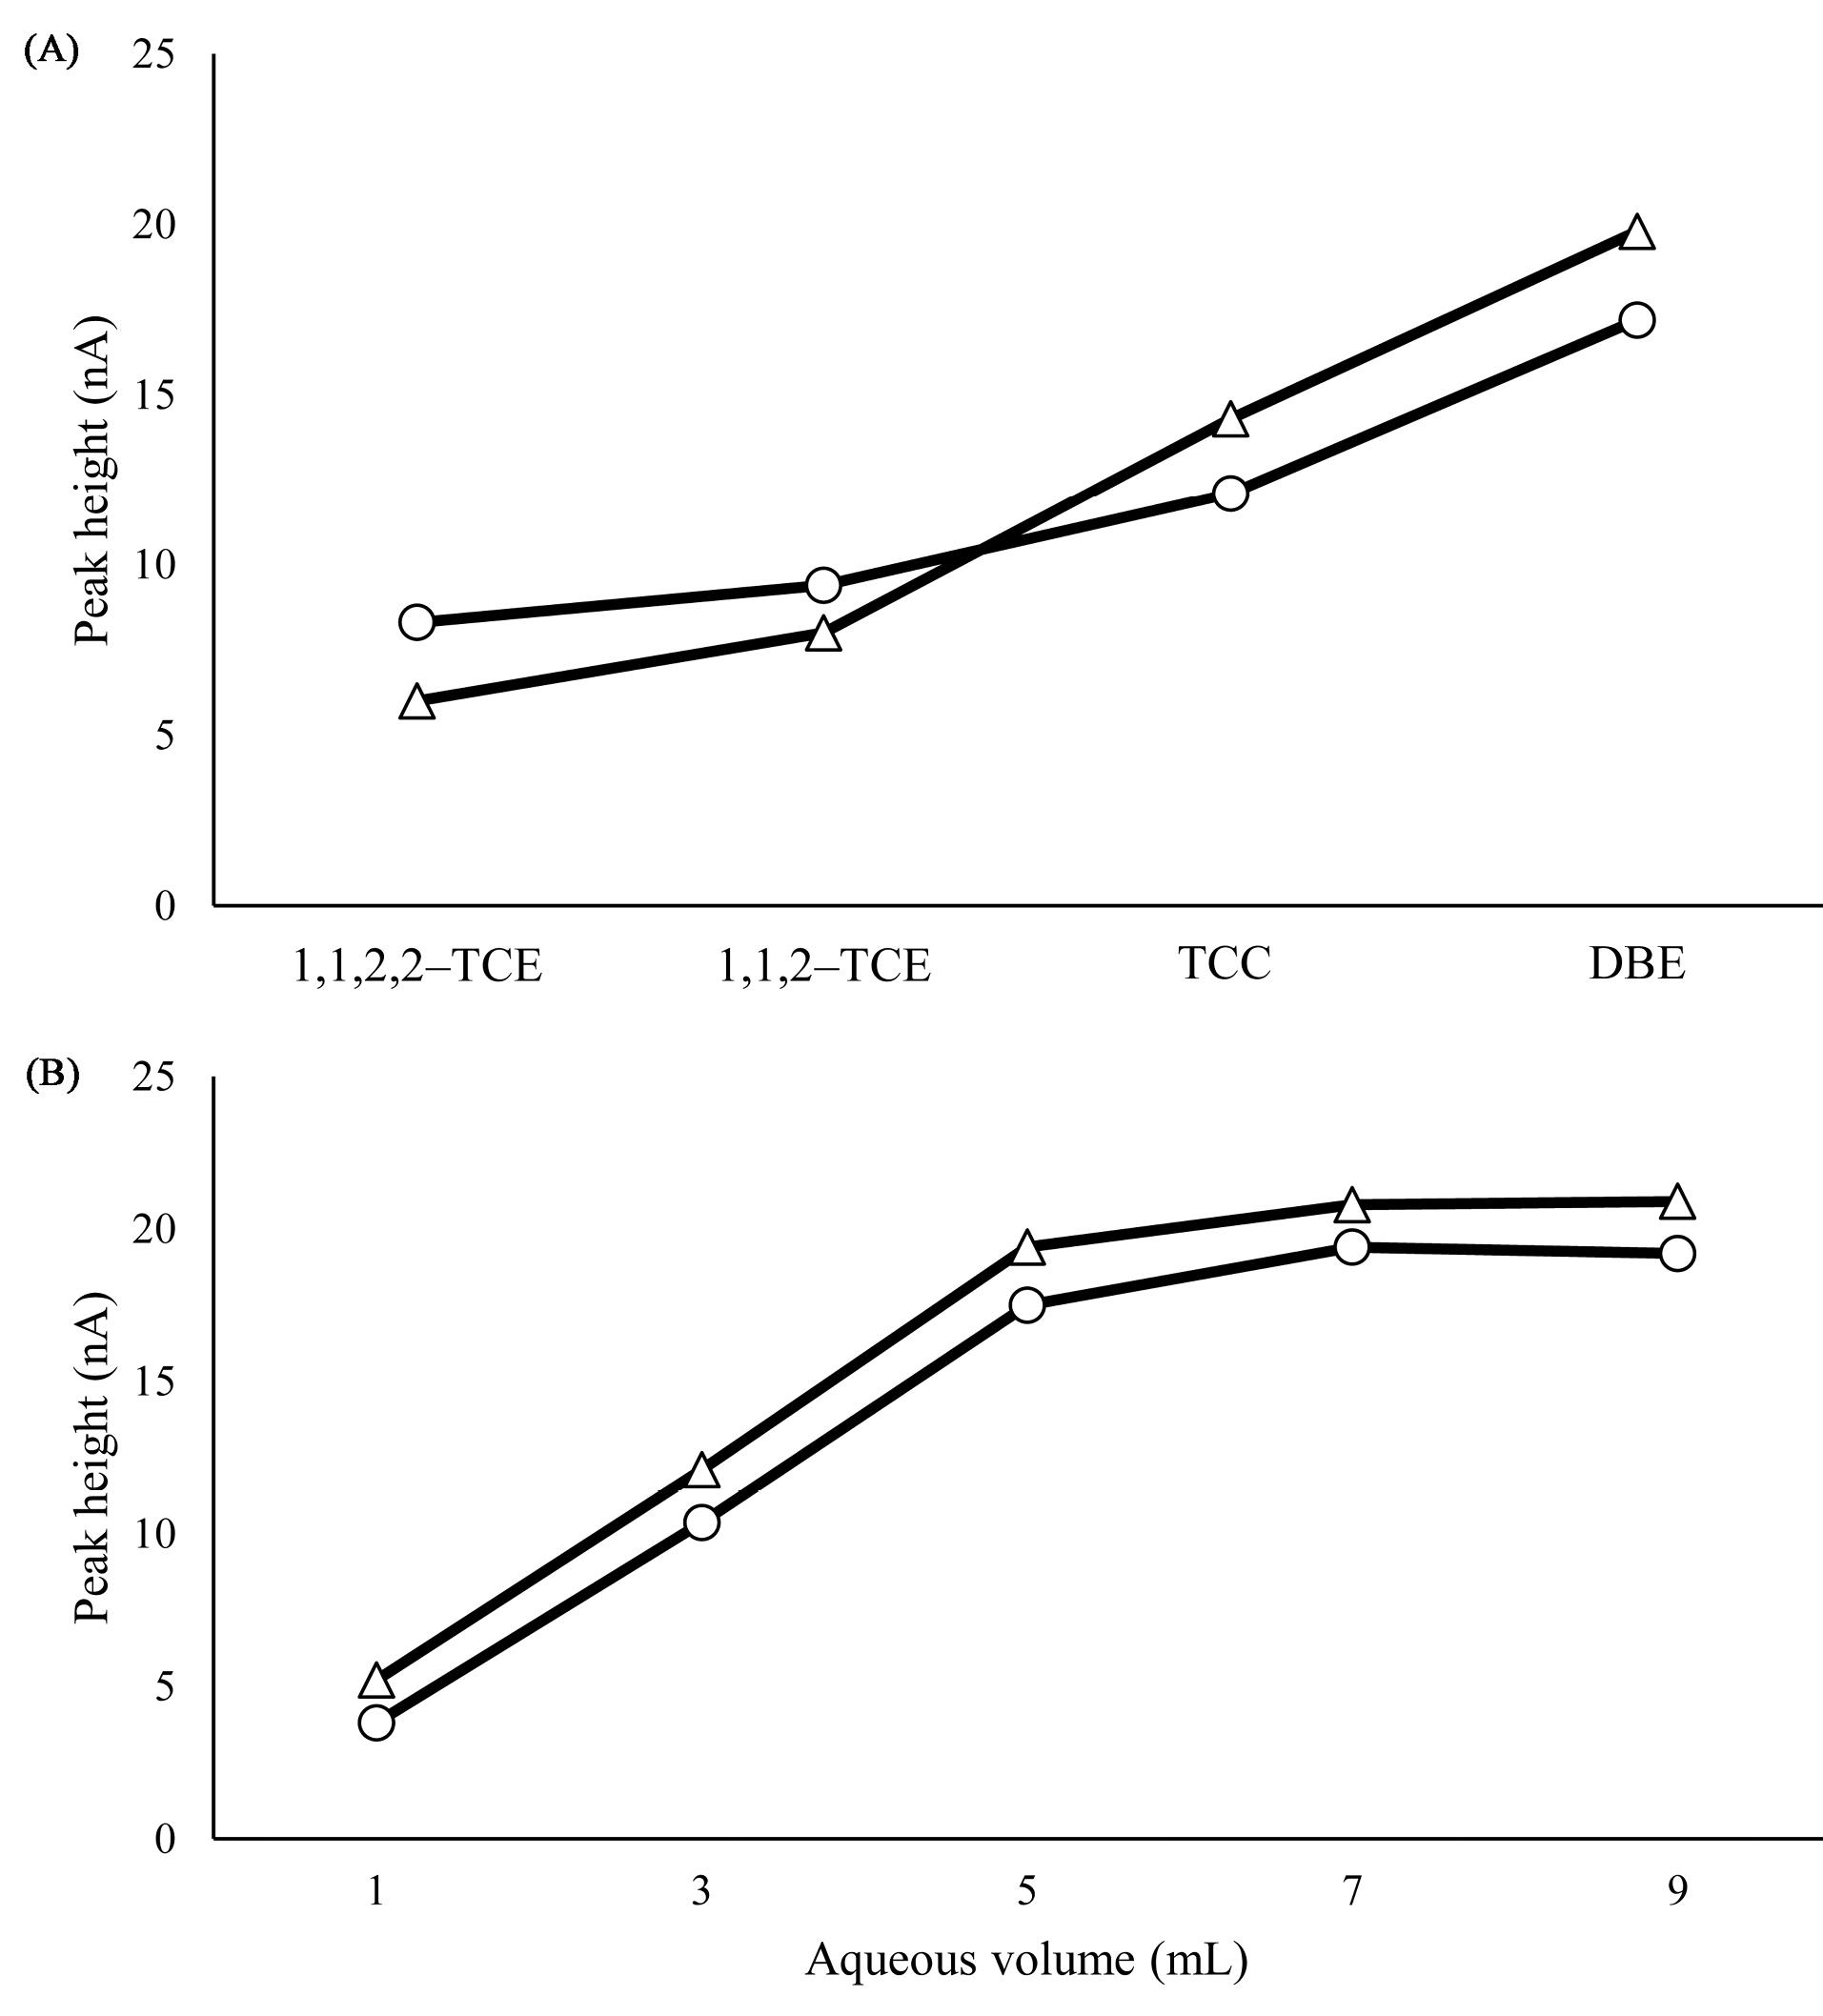
Fig. 4.
(A) Selection of extractant solvent 1,1,2,2 TCE (70), 1,1,2 TCE (75), TCC (65) and DBE (80) for FT (∆) and PA (○). Other conditions: sediment phase volume: 50 µL, aquas phase volume: 5 mL, number of extraction cycles: 5, centrifugation time: 5 min, centrifugation rate: 10000 rpm, electrophoretic conditions: as same as previous section. (B) Investigation of aqueous phase solvent for FT (∆) and PA (○). Other conditions: sediment phase volume: 50 µL, number of extraction cycles: 8, centrifugation time: 5 min, centrifugation rate: 10000 rpm, electrophoretic conditions: as same as the previous section.
.
(A) Selection of extractant solvent 1,1,2,2 TCE (70), 1,1,2 TCE (75), TCC (65) and DBE (80) for FT (∆) and PA (○). Other conditions: sediment phase volume: 50 µL, aquas phase volume: 5 mL, number of extraction cycles: 5, centrifugation time: 5 min, centrifugation rate: 10000 rpm, electrophoretic conditions: as same as previous section. (B) Investigation of aqueous phase solvent for FT (∆) and PA (○). Other conditions: sediment phase volume: 50 µL, number of extraction cycles: 8, centrifugation time: 5 min, centrifugation rate: 10000 rpm, electrophoretic conditions: as same as the previous section.
Optimization of extractant solvent volume and cycles
To obtain good enrichment factors, extractant volume is very important. Solvent volume should be as large as to extract quantitatively of the analytes from one side and should be small to avoiding of environmental pollution from the other side. Hence, the DBE was spiked into the aqueous sample in 90, 80, 60, 50, and 40 µL that result in 70, 50, 35, 20, and 0 µL sediment phases respectively. By increasing the volume, sediment phase volume increased and EF decreased, on the other hand, by decreasing the DBE volume no organic phase was observed i.e. 40 µL. On the other hand, by increasing the number of extracting cycles up to 8, the peak heights increased, by further increasing the sediment phase volume decreased and repeatability of the signals decreased. By considering all conditions, 50 µL and 8 cycles were selected as the optimum volume in the micro-extraction step.
Effect of substituted background-solvent volume, heating temperature, and time
In the current step, the organic phase is substituted by a background electrolyte e.g. 50 µL of MES buffer containing 10% ethanol. For this purpose, the organic phase was transferred into a microtube and heated for 2, 3, 4, 5, and 6 min at 60 ˚C. Organic phase evaporation is the main goal and it was observed that 5 min is enough for this purpose. To optimum the evaporating temperature, various heating temperatures were studied (i.e. 50, 60, 70, and 80 ˚C). At higher temperatures, the solvent evaporates very quickly but the repeatability of the results decreased. But at lower temperatures repeatable signals were observed. Considering all 4 minutes and 60 ˚C were optimum conditions for solvent evaporating.
Effect of salt addition
Commonly addition of salt increases the ionic strength of the aqueous solution so enhances the analyte partition in the organic phase. The efficiency of the method was evaluated by varying the salt concentration (0–5%, w/v) and the sediment phase volume adjusted on the optimum level (50 µL) by varying the initial volume of the organic phase. The obtained results indicated that electrochemical signals increased up to 1% w/v for the target analytes and then decreased by increasing the salt concentration. Probably, this is related to the aqueous phase ionic strength which decreases the diffusion of the analytes. Taken all, 1% was selected for further experiments.
Effect of pH
The pH of the sample was examined in the range of 3-8 using NaOH or HCL 1 M to adjust the pH value. Electrochemical signals showed that extraction increases in the range 3-5 and then the peak heights were constant up to 7. In the pH ranges above 7, the peak heights start to decrease which could be attributed to the hydrolysis of the analytes. Hence pH 6 was selected optimum pH and because the normal pH of deionized water is in the range of 6 - 6.5, there is no need for pH adjusting. On the other hand, as mentioned in section 3.2.1 the best detecting pH was 5, so the pH of the running buffer was the same (e.g., 5).
Effect of aqueous sample volume
One of the most important parameters that affect the ER is the aqueous phase volume. In the current study, various volumes were investigated e.g. 1, 3, 5, 7, and 9 mL. By increasing the volume, the ER increased up to 7 mL at the same level of the organic phase. After this volume, the peak height of the extracted analytes stays at an approximately constant level. This is related to the capacity of the sedimented phase that is saturated at higher volumes and excess amounts of analytes cannot be extracted. As a result, 7 mL was selected as optimum and the highest volume for extraction. The results of this section were shown in Fig. 4B.
Optimization of centrifuge time and rate
To accumulate the organic phase, all cloudy samples were centrifuged for a certain time and speed. 2-6 minutes and 5000–12000 rpm were investigated for time and speed, respectively. Analytical signals improved by increasing up to 5 minutes then reaches a plateau state. In addition, ER values and organic phase volume were in a steady-state in the ranges higher than 10 000 rpm. Thereby, 5 minutes and 10 000 rpm were selected as the optimum conditions.
Calculation of enrichment factor and extraction recovery
Enrichment factor (EF) shows that the concentration of the analytes how many times increased, in the other words, EF was calculated by dividing the organic phase concentration (Corg) to aqueous phase concentration (Caq).
If the extraction recovery (ER) is 100%, the EF can be calculated by dividing the aqueous phase volume into sediment phase volume. Otherwise, the Corg can be calculated by comparing the peak height of analytes, which was directly injected into the microchip. In the present study, the aqueous phase volume was 7 mL and the sediment phase volume was 50 µL. According to Eq. 3, the EF can be up to 140.
ER is determined by dividing the extracted analytes (norg) to total (nt) analytes multiple by 100. Notably, the electroactivity of the analytes can affect the ER calculations. Howe ever ER can be calculated by Eq. 4.
(4)
ER were 91% and 87% for FT and PA respectively.
Analytical figures of merit
The analytical features were evaluated under the optimized conditions, including repeatability, linearity, relative standard deviation, LOD, and LOQ.
Repeatability (inter-day and intra-day)
The repeatability of the method in two different modes (inter-/intra-days) was investigated by a 6-replicate analysis of the analytes in two levels of FT and PA. RSD for the peak areas calculated (Table 1) and were enough to guarantee the precision of the method.
Table 1.
RSD values for intraday results of six injections of the FT and PA at concentrations of 50 and 100 ppm and interday results of six mixture injections at 100 ppm level
|
RSD %
|
FT
|
PA
|
| Intraday, 50 µM level |
4.7 |
7.3 |
| Intraday, 100 µM level |
3.3 |
5.2 |
| Interday |
7.1 |
8.2 |
Calibration curves
To investigate the linearity, peak areas of the analytes were calculated and plotted vs. concentrations of the analytes. The conditions of the analysis were using the following optimal conditions for the separation and detection: MES running buffer (20 mM, pH 5), +1800, and +900 V for separation and injection voltages respectively. Calibration curves are shown in Fig. 5 and analytical parameters are summarized in Table 2.
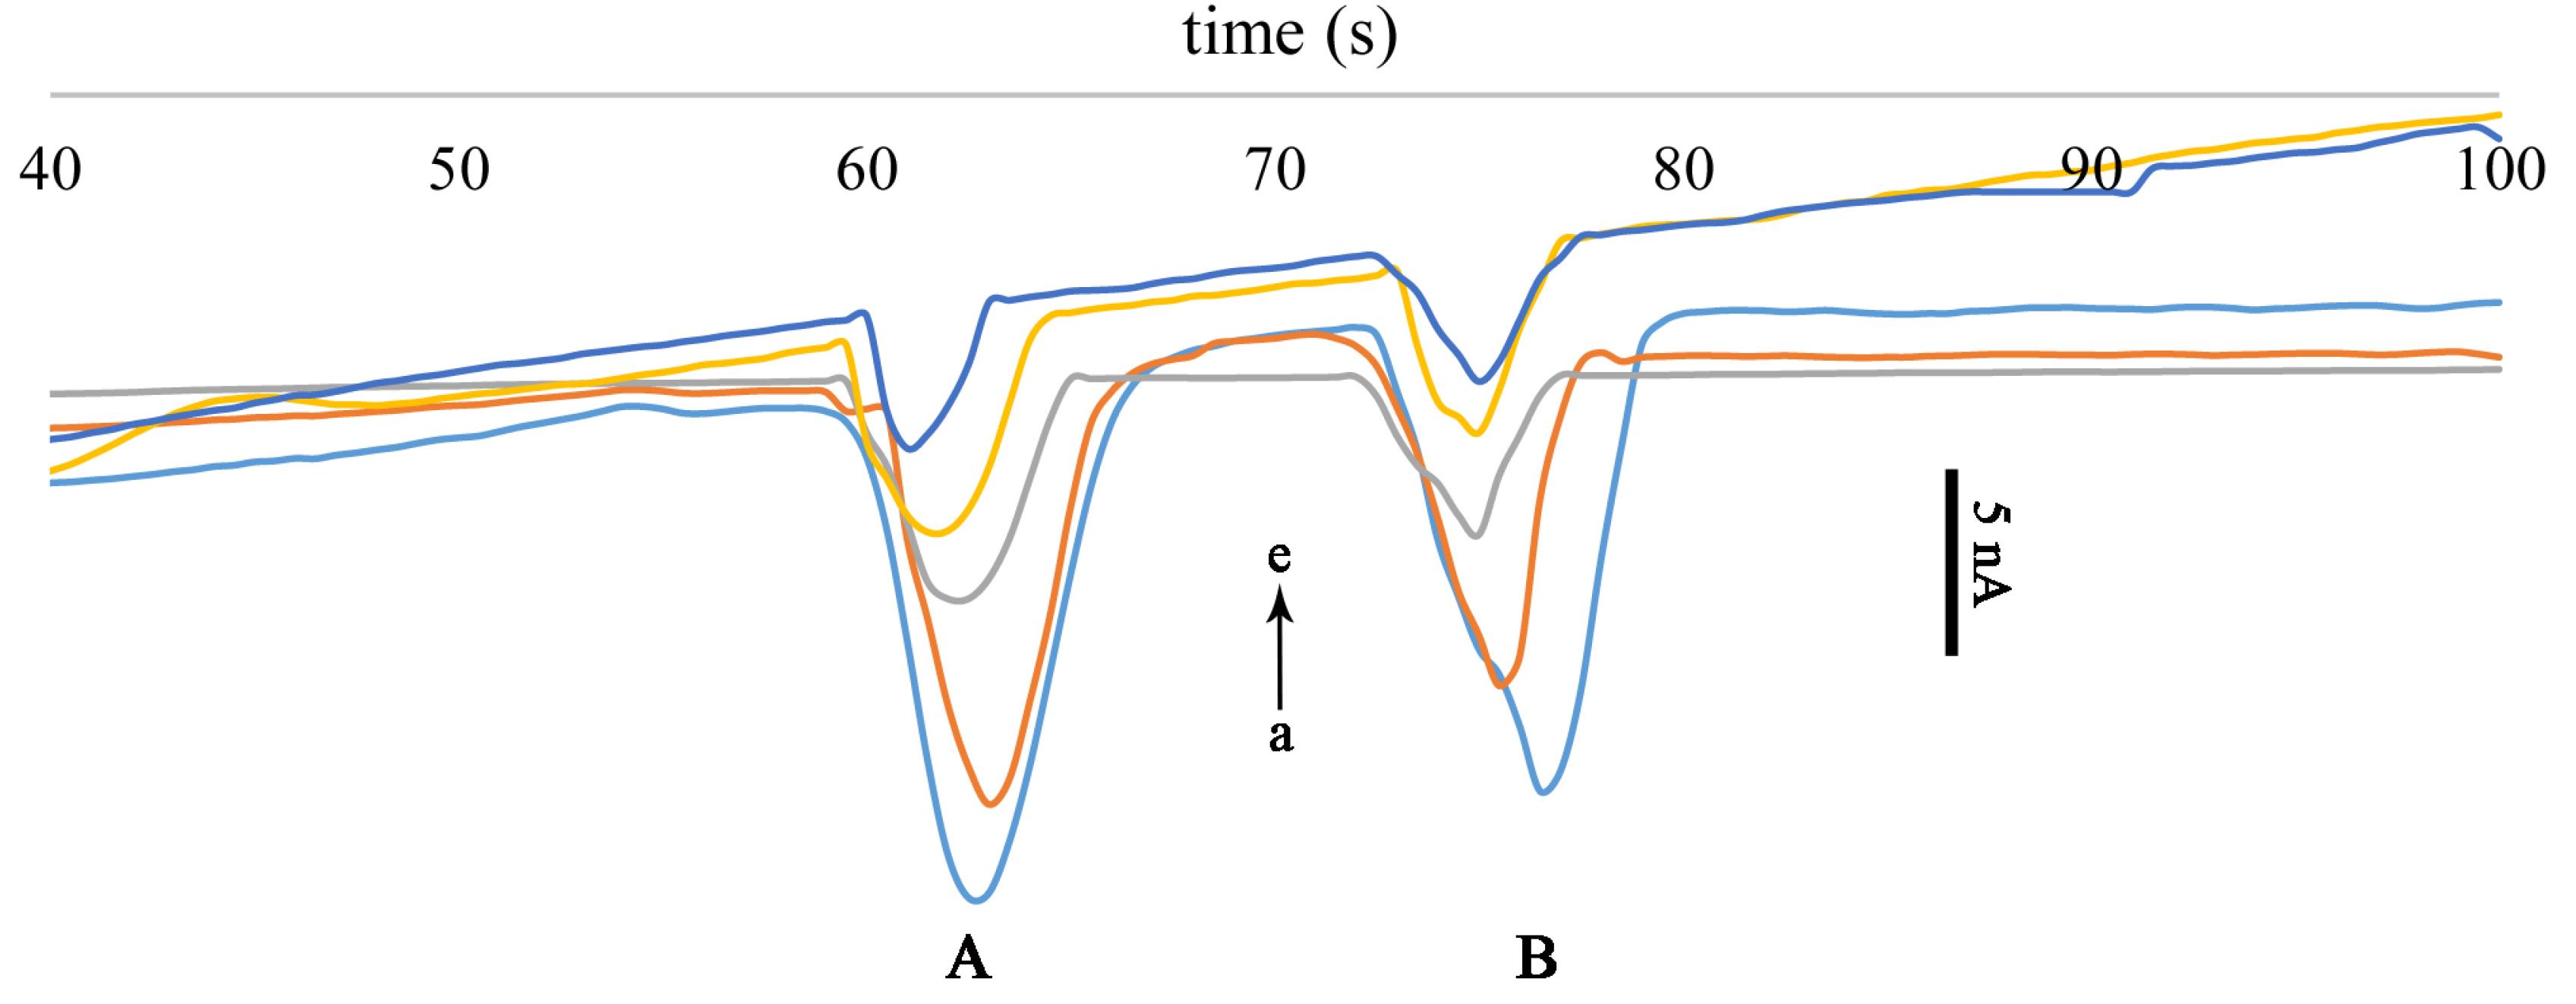
Fig. 5.
Calibration curves for FT (A) and PA (B). Vinj= +900 V, Ed= -1.2 V v.s. Pt pseudo-reference electrode, running buffer: 20 mM MES (pH 5). Concentration of analytes: 100, 75, 50, 25, 10 ppm (from a to e).
.
Calibration curves for FT (A) and PA (B). Vinj= +900 V, Ed= -1.2 V v.s. Pt pseudo-reference electrode, running buffer: 20 mM MES (pH 5). Concentration of analytes: 100, 75, 50, 25, 10 ppm (from a to e).
Table 2.
Analytical parameters corresponding to the calibration curves for FT and PA
|
|
tm (s)
|
Sensitivity
(nA×s /ppm)
|
Linear range
(µM)
|
R2
|
LOD (ppm)
|
| FT |
62.5±1 |
1.1 |
0.8-100 |
0.993 |
0.24 |
| PA |
76.5±1.2 |
0.8 |
1.2-100 |
0.991 |
0.36 |
tm: migration time of the analytes; LOD: limit of detection.
Evaluation of the developed method
The performance of the method was evaluated by other references that were reported in the literature considering analytes, LOD, Linear range, RSD, and relative cost, as shown in Table 3. RSD for the proposed method is appropriate and even better than other methods, LOD and LOQ are comparable to others. It is notable that in the other techniques very expensive equipment was used and the cost of the analysis is very high and there is a need for highly qualified personnel for conducting the experiments. The proposed method is a very reliable, cost-effective, rapid, and portable device for the in-site analysis of organophosphates.
Table 3.
Comparison of the proposed method with other references
|
Method
|
Analyte(s)
|
Sample
|
LRa
|
LODb
|
RSDc
|
Relative Cost
|
Ref.
|
UASE–DLLME–SFO–
HPLC–UVd |
Diazinon |
Summer crops |
5–500 (µg kg-1) |
2 (µg kg-1) |
5.5 |
High |
37
|
| Phosalone |
5–500 (µg kg-1) |
2 (µg kg-1) |
8.3 |
| Chlorpyrifos |
10–800 (µg kg-1) |
4 (µg kg-1) |
9.1 |
| Electrochemical (SWV e) |
Fenitrothion |
River water |
2–60 (µmol L-1) |
0.08 (µmol L-1) |
- |
Low |
4
|
| Bifenox |
| Electrochemical (DPV f) |
Fenitrothion |
Orange juice |
5–65 (µmol L-1) |
1.62 (µmol L-1) |
2.3 |
Low |
38
|
| LC-MS g |
Acephate |
Human plasma |
0.375 -8 (µg mL-1) |
0.25 (µg mL-1) |
1.5-8.4 |
Very high |
39
|
| Methidathion |
0.625–8 (µg mL-1) |
0.5 (µg mL-1) |
| Dichlorvos |
0.625–8 (µg mL-1) |
0.5 (µg mL-1) |
| Fenthion |
1.25–8 (µg mL-1) |
1 (µg mL-1) |
| EPN |
0.5–8 (µg mL-1) |
0.375 (µg mL-1) |
| Diazinon |
0.25–8 (µg mL-1) |
0.125 (µg mL-1) |
| Phenthoate |
0.375–8 (µg mL-1) |
0.25 (µg mL-1) |
| Malathion |
0.375–8 (µg mL-1) |
0.25 (µg mL-1) |
| Fenitrothion |
0.25–8 (µg mL-1) |
0.125 (µg mL-1) |
| Cyanophos |
0.25–8 (µg mL-1) |
0.125 (µg mL-1) |
| ALLME-MCE h |
Fenitrothion |
Human plasma |
0.8–100 (µg mL-1) |
0.24 (µg mL-1) |
3.3-7.3 |
Very low |
Current study |
| Parathion |
1.2–100 (µg mL-1) |
0.36 (µg mL-1) |
aLinear range.
bLimit of detection.
cRelative standard deviation.
dUltrasound-assisted solvent extraction–dispersive liquid-liquid microextraction–solidification of floating organic drop–high-performance liquid chromatography–ultraviolet detector.
esquare wave voltammetry (SWV).
fDifferential pulse voltammetry.
gliquid chromatography-mass spectrometry.
hAir assisted liquid-liquid micro-extraction – microchip capillary electrophoresis.
Real sample analysis
The proposed method was applied to human plasma at different concentration levels. To eliminate the matrices effect, the plasma was diluted by deionized water (5 % V/V). At first virgin, plasma was experimented with by the method and no peaks were observed. Then the analytes spiked to plasma in three levels e.g., 5, 10, and 15 ppm to study the matrices effect and recoveries. Relative recoveries by considering the analytical signals are summarized in Table 4. The signals showed good recoveries after dilution. To study the accuracy of the method same samples were analyzed by GC-FID. Acquired results were agreed quite well by those acquired by GC-FID. In addition, the paired t-test was applied to the results obtained with two methods. At a confidence level of 95%, t values were much smaller than critical values (i.e., 4.30, α=0.05), which indicates that there was no significant difference between the results. To evaluate the interferences, four other organophosphate compounds (e.g. malathion, chlorpyrifos, diazinon, dichlorvos) were analyzed by MCE-EC, and no signals were generated because they are not electroactive on the Pt bare electrodes (Fig. 6).
Table 4.
Study of matrices effect in the samples spiked at three different concentrations
|
Analyte
|
Relative recovery ± standard deviation (n=3)
|
Exp. t-values
|
|
5 ppm
|
10 ppm
|
15 pm
|
| FT |
93 ± 4 |
92 ± 4 |
97 ± 3 |
1.2, 1, 0.95 |
| PA |
92 ± 5 |
95 ± 3 |
96 ± 4 |
1.2, 1.1, 1.1 |
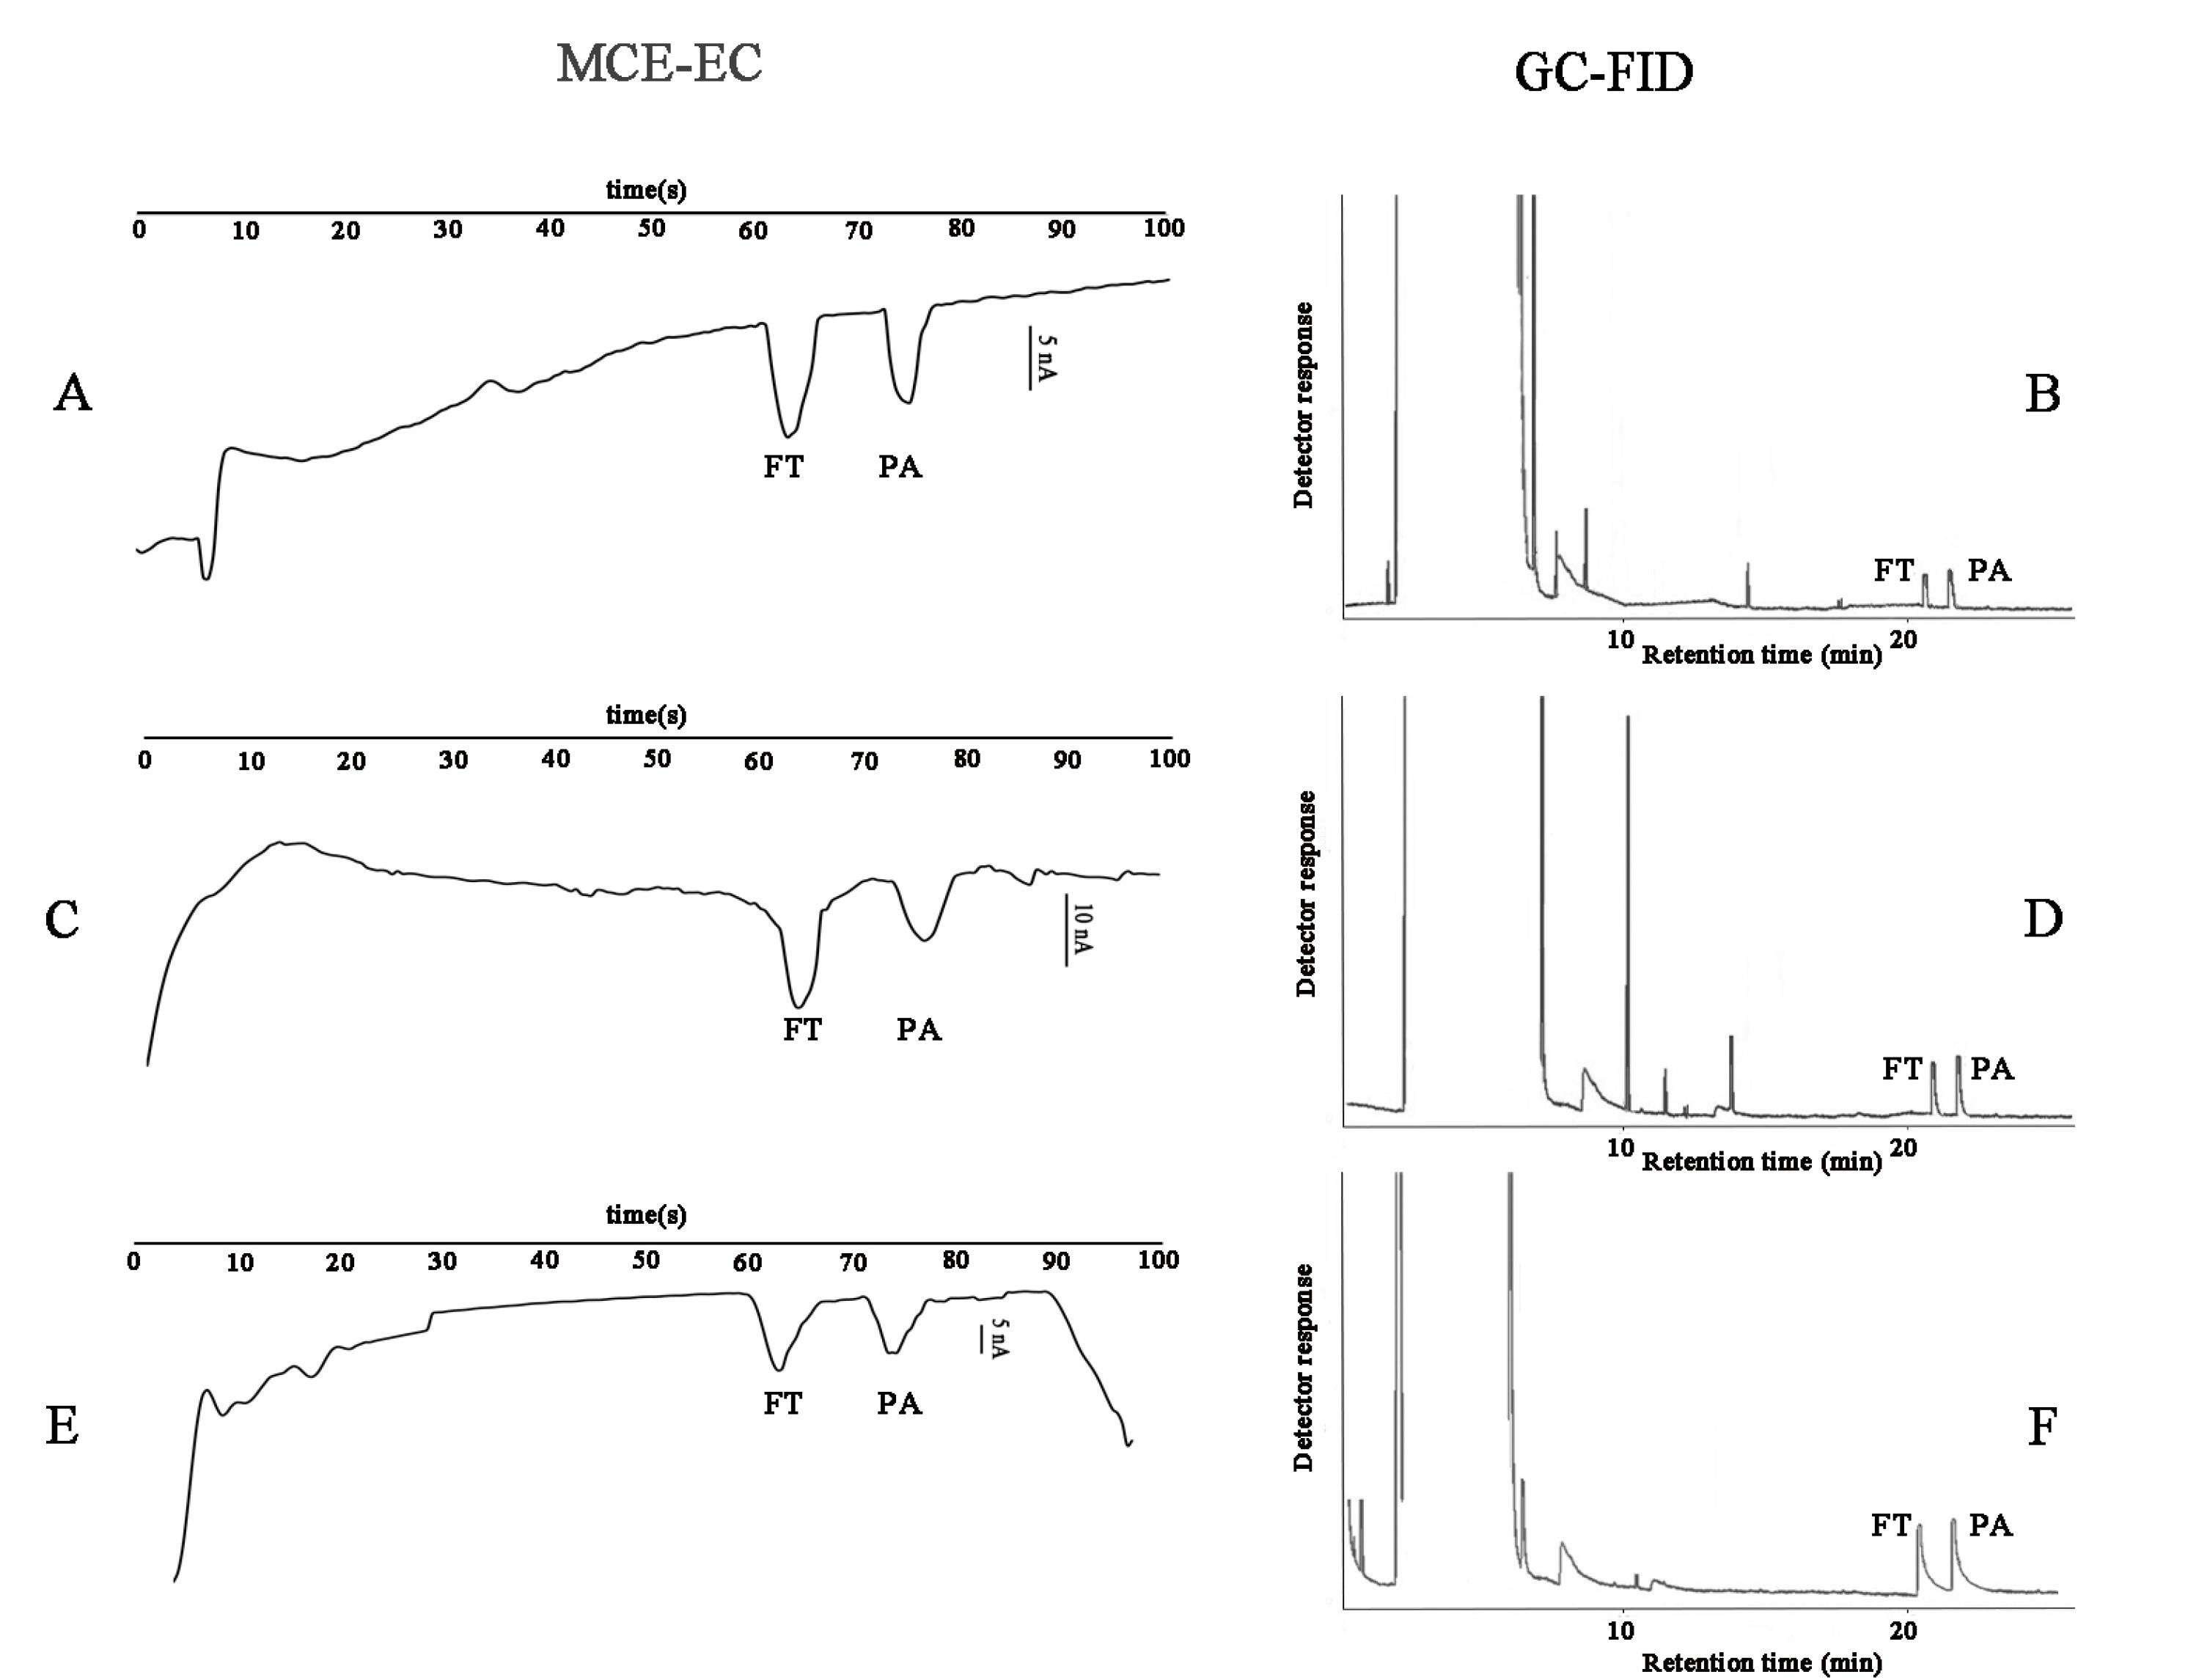
Fig. 6.
Real sample analysis of human plasma at three concentration levels, (A) 5 ppm by MCE-EC (B) 5ppm by GC-FID, (C) 10 ppm by MCE-EC, (D) 10 ppm by GC-FID, (E) 15 ppm by MCE-EC, and (F) 15 ppm by GC-FID.
.
Real sample analysis of human plasma at three concentration levels, (A) 5 ppm by MCE-EC (B) 5ppm by GC-FID, (C) 10 ppm by MCE-EC, (D) 10 ppm by GC-FID, (E) 15 ppm by MCE-EC, and (F) 15 ppm by GC-FID.
Conclusion
In the present study, a microextraction method was developed for preconcentration of the analytes before analyzing by MCE-EC. Microelectrodes were mounted in the microchannels, and the amperometric method was used for the detection of OPPs. Analytical concentrations can be sub-ppm within 100 s with high EFs, very low LODs, and reliable results. Finally, a microextraction method coupled with a new microfluidic-based setup has the capability of miniaturization and in situ analysis. Taken all, these miniaturized devices can analyze electroactive compounds such as pharmaceuticals, toxins and some other biological analytes. In fact, in medicinal diagnosis, we propose these cost and time-effective devices for in situ analyzing and detecting the cause of the disease.
Research Highlights
What is the current knowledge?
√ A portable lab-on-a-chip device was coupled to the AALLME microextraction method for the separation and detection of organophosphate insecticides.
What is new here?
√ A new detection system based on the coupling of microextraction and microfluidics was designed.
√ All the parameters of the proposed method were evaluated and validated according to standard analytical guidelines.
√ The designed set-up is a really portable and reliable device for in situ detection of organophosphate insecticides.
Acknowledgment
The authors are grateful to the AJA University of Medical Science (IR.AJAUMS.REC.1400.034) and members of the Nanomaterials Engineering Lab at Research Center for Pharmaceutical Nanotechnology at Tabriz University of Medical Sciences.
Competing Interests
There is none to be clarified.
Ethical Statement
There is none to be clarified.
Funding
There is none to be clarified.
References
- Greaves AK, Letcher RJ, Chen D, McGoldrick DJ, Gauthier LT, Backus SM. Retrospective analysis of organophosphate flame retardants in herring gull eggs and relation to the aquatic food web in the Laurentian Great Lakes of North America. Environ Res 2016; 150:255-63. doi: 10.1016/j.envres.2016.06.006 [Crossref] [ Google Scholar]
- Peter JV, Sudarsan TI, Moran JL. Clinical features of organophosphate poisoning: A review of different classification systems and approaches. Indian J Crit 2014; 18:735. doi: 10.4103/0972-5229.144017 [Crossref] [ Google Scholar]
- Yao Z-w, Jiang G-b, Liu J-m, Cheng W. Application of solid-phase microextraction for the determination of organophosphorous pesticides in aqueous samples by gas chromatography with flame photometric detector. Talanta 2001; 55:807-14. doi: 10.1016/S0039-9140(01)00504-5 [Crossref] [ Google Scholar]
- Salehzadeh H, Ebrahimi M, Nematollahi D, Salarian AA. Electrochemical study of fenitrothion and bifenox and their simultaneous determination using multiwalled carbon nanotube modified glassy carbon electrode. J Electroanal Chem 2016; 767:188-94. doi: 10.1016/j.jelechem.2016.02.011 [Crossref] [ Google Scholar]
- Mohd Razib MS, Latip W, Abdul Rashid JI, Knight VF, Wan Yunus WMZ, Ong KK, et al. An Enzyme-Based Biosensor for the Detection of Organophosphate Compounds Using Mutant Phosphotriesterase Immobilized onto Reduced Graphene Oxide. J Chem 2021; 2021. 10.1155/2021/2231089.
- Shamgsumova RV, Shurpik DN, Evtugyn VG, Stoikov II, Evtugyn GA. Electrochemical determination of malathion on an acetylcholinesterase-modified glassy carbon electrode. Anal Lett 2018; 51:1911-26. doi: 10.1080/00032719.2017.1396338 [Crossref] [ Google Scholar]
- Sulaiman IC, Chieng B, Osman M, Ong K, Rashid J, Yunus WW. A review on colorimetric methods for determination of organophosphate pesticides using gold and silver nanoparticles. Microchimica Acta 2020; 187:1-22. doi: 10.1007/s00604-019-3893-8 [Crossref] [ Google Scholar]
- Mia R, Cragg PJ, Wallace KJ. Low Molecular Weight Fluorescent probes for the detection of organophosphates. J Lumin 2021; 235:118053. doi: 10.1016/j.jlumin.2021.118053 [Crossref] [ Google Scholar]
- Behniwal PK, She J. Development of HPLC-MS/MS method for the simultaneous determination of metabolites of organophosphate pesticides, synthetic pyrethroids, herbicides and DEET in human urine. Int J Environ Anal Chem 2017; 97:548-62. doi: 10.1080/03067319.2017.1325881 [Crossref] [ Google Scholar]
- Mahajan R, Chatterjee S. A simple HPLC–DAD method for simultaneous detection of two organophosphates, profenofos and fenthion, and validation by soil microcosm experiment. Environ Monit 2018; 190:1-8. doi: 10.1007/s10661-018-6710-7 [Crossref] [ Google Scholar]
- Yin Xf, Fang B, Zhang Xx, Li Jw, Li Yx. Salt‐assisted acetonitrile extraction and HPLC‐QTOF‐MS/MS detection for residues of multiple classes of pesticides in human serum samples. J Sep Sci 2020; 43:3534-45. doi: 10.1002/jssc.201901223 [Crossref] [ Google Scholar]
- Polyiem W, Naksen W, Prapamontol T. Gas Chromatographic-Flame Photometric Detection of organophosphate pesticide residues and its application in real vegetable and fruit samples from Chiang Mai City, Thailand. Chiang Mai J Sci 2018; 45:1933-43. [ Google Scholar]
- Luo Q, Wang S, Sun L-n, Wang H. Simultaneous accelerated solvent extraction and purification for the determination of 13 organophosphate esters in soils by gas chromatography-tandem mass spectrometry. Environ Sci Pollut Res 2018; 25:19546-54. doi: 10.1007/s11356-018-2047-6 [Crossref] [ Google Scholar]
- Pyschik M, Winter M, Nowak S. Capillary Electrophoresis as Analysis Technique for Battery Electrolytes:(i) Monitoring Stability of Anions in Ionic Liquids and (ii) Determination of Organophosphate-Based Decomposition Products in LiPF6-Based Lithium Ion Battery Electrolytes. Separations 2017; 4:26. doi: 10.3390/separations4030026 [Crossref] [ Google Scholar]
- Jiang M, Wu S, Xu L, Qiao X, Xu Z. Determination of trichlorfon residues in vegetables using a quantum dot-labeled biomimetic immunoassay method followed by capillary electrophoresis. Food Agric Immunol 2017; 28:1242-55. doi: 10.1080/09540105.2017.1333579 [Crossref] [ Google Scholar]
- Manz A, Graber N, Widmer Há. Miniaturized total chemical analysis systems: a novel concept for chemical sensing. Sens Actuators B Chem 1990; 1:244-8. doi: 10.1016/0925-4005(90)80209-I [Crossref] [ Google Scholar]
- Tong R, Zhang L, Song Q, Hu C, Chen X, Lou K. A fully portable microchip real‐time polymerase chain reaction for rapid detection of pathogen. Electrophoresis 2019; 40:1699-707. doi: 10.1002/elps.201900090 [Crossref] [ Google Scholar]
- Kubáň P, Hauser PC. 20th anniversary of axial capacitively coupled contactless conductivity detection in capillary electrophoresis. Trends Analyt Chem 2018; 102:311-21. doi: 10.1016/j.trac.2018.03.007 [Crossref] [ Google Scholar]
- Khan WA, Arain MB, Yamini Y, Shah N, Kazi TG, Pedersen-Bjergaard S. Hollow fiber-based liquid phase microextraction followed by analytical instrumental techniques for quantitative analysis of heavy metal ions and pharmaceuticals. J Pharm Anal 2020; 10:109-22. doi: 10.1016/j.jpha.2019.12.003 [Crossref] [ Google Scholar]
- Costa BMDC, Griveau S, d'Orlye F, Bedioui F, da Silva JAF, Varenne A. Microchip Electrophoresis and Electrochemical Detection: a Review on a Growing Synergistic Implementation. Electrochim Acta 2021; 391:138928. doi: 10.1016/j.electacta.2021.138928 [Crossref] [ Google Scholar]
- Roychoudhury A, Francis KA, Patel J, Jha SK, Basu S. A decoupler-free simple paper microchip capillary electrophoresis device for simultaneous detection of dopamine, epinephrine and serotonin. RSC Adv 2020; 10:25487-95. doi: 10.1039/D0RA03526B [Crossref] [ Google Scholar]
- Schilly KM, Gunawardhana SM, Wijesinghe MB, Lunte SM. Biological applications of microchip electrophoresis with amperometric detection: In vivo monitoring and cell analysis. Anal Bioanal Chem 2020; 402:1-19. doi: 10.1007/s00216-020-02647-z [Crossref] [ Google Scholar]
- Ren Z, Zhou X, Gao X, Tan Y, Chen H, Tan S. Rapid detection of carbamate pesticide residues using microchip electrophoresis combining amperometric detection. Anal Bioanal Chem 2021; 413:3017-26. doi: 10.1007/s00216-021-03237-3 [Crossref] [ Google Scholar]
- Bosma R, Devasagayam J, Singh A, Collier CM. Microchip capillary electrophoresis dairy device using fluorescence spectroscopy for detection of ciprofloxacin in milk samples. Sci Rep 2020; 10:1-8. doi: 10.1038/s41598-020-70566-1 [Crossref] [ Google Scholar]
- Snyder CM, Zhou X, Karty JA, Fonslow BR, Novotny MV, Jacobson SC. Capillary electrophoresis–mass spectrometry for direct structural identification of serum N-glycans. J Chromatogr A 2017; 1523:127-39. doi: 10.1016/j.chroma.2017.09.009 [Crossref] [ Google Scholar]
- Zhang L, Zhang W, Chen W, Chen G. Simultaneous determination of five bioactive constituents in rhizoma chuanxiong by capillary electrophoresis with a carbon nanotube-polydimethylsiloxane composite electrode. J Pharm Biomed 2016; 131:107-12. doi: 10.1016/j.jpba.2016.08.031 [Crossref] [ Google Scholar]
- Abdollahi-Aghdam A, Majidi MR, Veladi H, Omidi Y. SU8/glass microchip capillary electrophoresis integrated with Pt electrodes for separation and simultaneous detection of phenylephrine and acetaminophen. BioImpacts 2021; 11:263. doi: 10.34172/bi.2021.35 [Crossref] [ Google Scholar]
- Bamshad A, Nikfarjam A, Khaleghi H. A new simple and fast thermally-solvent assisted method to bond PMMA–PMMA in micro-fluidics devices. J MicromechMicroeng 2016; 26:065017. doi: 10.1088/0960-1317/26/6/065017 [Crossref] [ Google Scholar]
- Du D, Wang M, Zhang J, Cai J, Tu H, Zhang A. Application of multiwalled carbon nanotubes for solid-phase extraction of organophosphate pesticide. Electrochemcommun 2008; 10:85-9. doi: 10.1016/j.elecom.2007.11.005 [Crossref] [ Google Scholar]
- Schindler BK, Förster K, Angerer J. Determination of human urinary organophosphate flame retardant metabolites by solid-phase extraction and gas chromatography–tandem mass spectrometry. J Chromatogr B 2009; 877:375-81. doi: 10.1016/j.jchromb.2008.12.030 [Crossref] [ Google Scholar]
- Jonsson OB, Nilsson UL. Miniaturized dynamic liquid–liquid extraction of organophosphate triesters from blood plasma using the hollow fibre-based XT-tube extractor. Anal Bioanal Chem 2003; 377:182-8. doi: 10.1007/s00216-003-2044-5 [Crossref] [ Google Scholar]
- Chen L, Jian Y, Cheng J, Yan L, Huang X. Preparation and application of graphene oxide-based surface molecularly imprinted polymer for monolithic fiber array solid phase microextraction of organophosphate flame retardants in environmental water. J Chromatogr A 2020; 1623:461200. doi: 10.1016/j.chroma.2020.461200 [Crossref] [ Google Scholar]
- Jian Y, Deng J, Zhou H, Cheng J. Fabrication of graphene oxide incorporated polymer monolithic fiber as solid phase microextraction device for determination of organophosphate esters in soil samples. J Chromatogr A 2019; 1588:17-24. doi: 10.1016/j.chroma.2018.12.034 [Crossref] [ Google Scholar]
- Rezaee M, Assadi Y, Hosseini M-RM, Aghaee E, Ahmadi F, Berijani S. Determination of organic compounds in water using dispersive liquid–liquid microextraction. J Chromatogr A 2006; 1116:1-9. doi: 10.1016/j.chroma.2006.03.007 [Crossref] [ Google Scholar]
- Farajzadeh MA, Khoshmaram L. Air-assisted liquid–liquid microextraction-gas chromatography-flame ionisation detection: A fast and simple method for the assessment of triazole pesticides residues in surface water, cucumber, tomato and grape juices samples. Food Chem 2013; 141:1881-7. doi: 10.1016/j.foodchem.2013.05.088 [Crossref] [ Google Scholar]
- Aghdam AA, Majidi MR, Veladi H, Omidi Y. Microfluidic-based separation and detection of synthetic antioxidants by integrated gold electrodes followed by HPLC-DAD. Microchem J 2019; 149:104059. doi: 10.1016/j.microc.2019.104059 [Crossref] [ Google Scholar]
- Pirsaheb M, Fattahi N, Shamsipur M. Determination of organophosphorous pesticides in summer crops using ultrasound-assisted solvent extraction followed by dispersive liquid–liquid microextraction based on the solidification of floating organic drop. Food Control 2013; 34:378-85. doi: 10.1016/j.foodcont.2013.05.013 [Crossref] [ Google Scholar]
- Canevari TC, Prado TM, Cincotto FH, Machado SA. Immobilization of ruthenium phthalocyanine on silica-coated multi-wall partially oriented carbon nanotubes: electrochemical detection of fenitrothion pesticide. Mater Res Bull 2016; 76:41-7. doi: 10.1016/j.materresbull.2015.12.007 [Crossref] [ Google Scholar]
- Inoue S, Saito T, Mase H, Suzuki Y, Takazawa K, Yamamoto I. Rapid simultaneous determination for organophosphorus pesticides in human serum by LC–MS. J Pharm Biomed 2007; 44:258-64. doi: 10.1016/j.jpba.2007.01.036 [Crossref] [ Google Scholar]