Bioimpacts. 14(3):28854.
doi: 10.34172/bi.2023.28854
Original Article
Non-invasive and probeless rapid in-vitro monitoring and quantification of HUVECs counts based on FFT impedimetery
Jalil Mirzazadeh Data curation, Formal analysis, Investigation, Methodology, Resources, Software, Visualization, Writing – original draft, 1 
Mir Reza Majidi Conceptualization, Formal analysis, Funding acquisition, Methodology, Project administration, Supervision, Validation, Writing – review & editing, 1, * 
Parviz Norouzi Formal analysis, Methodology, Project administration, Software, Supervision, Validation, Visualization, Writing – review & editing, 2, *
Reza Faridi-Majidi Formal analysis, Writing – review & editing, 3
Karim Asadpour-Zeynali Software, Writing – review & editing, 1, 4
Author information:
1Department of Analytical Chemistry, Faculty of Chemistry, University of Tabriz, Tabriz 51666-16471, Iran
2Center of Excellence in Electrochemistry, Faculty of Chemistry, University of Tehran, Tehran, Iran
3Department of Medical Nanotechnology, School of Advanced Technologies in Medicine, Tehran University of Medical Sciences, Tehran, Iran
4Pharmaceutical Analysis Research Center, Faculty of Pharmacy, Tabriz University of Medical Sciences, Tabriz 51664, Iran
Abstract
Introduction:
The endothelial cells derived from the human vein cord (HUVECs) are used as in-vitro models for studying cellular and molecular pathophysiology, drug and hormones transport mechanisms, or pathways. In these studies, the proliferation and quantity of cells are important features that should be monitored and assessed regularly. So rapid, easy, noninvasive, and inexpensive methods are favorable for this purpose.
Methods:
In this work, a novel method based on fast Fourier transform square-wave voltammetry (FFTSWV) combined with a 3D printed electrochemical cell including two inserted platinum electrodes was developed for non-invasive and probeless rapid in-vitro monitoring and quantification of human umbilical vein endothelial cells (HUVECs). The electrochemical cell configuration, along with inverted microscope images, provided the capability of easy use, online in-vitro monitoring, and quantification of the cells during proliferation.
Results:
HUVECs were cultured and proliferated at defined experimental conditions, and standard cell counts in the initial range of 12 500 to 175 000 were prepared and calibrated by using a hemocytometer (Neubauer chamber) counting for electrochemical measurements. The optimum condition, for FFTSWV at a frequency of 100 Hz and 5 mV amplitude, were found to be a safe electrochemical measurement in the cell culture medium. In each run, the impedance or admittance measurement was measured in a 5 seconds time window. The total measurements were fulfilled at 5, 24, and 48 hours after the seeding of the cells, respectively. The recorded microscopic images before every electrochemical assay showed the conformity of morphology and objective counts of cells in every plate well. The proposed electrochemical method showed dynamic linearity in the range of 12 500-265 000 HUVECs 48 hours after the seeding of cells.
Conclusion:
The proposed electrochemical method can be used as a simple, fast, and noninvasive technique for tracing and monitoring of HUVECs population in in-vitro studies. This method is highly cheap in comparison with other traditional tools. The introduced configuration has the versatility to develop electrodes for the study of various cells and the application of other electrochemical designations.
Keywords: HUVECs, FFT impedimetery, In vitro, Cell impedance, Cell proliferation
Copyright and License Information
© 2024 The Author(s).
This work is published by BioImpacts as an open access article distributed under the terms of the Creative Commons Attribution Non-Commercial License (
http://creativecommons.org/licenses/by-nc/4.0/). Non-commercial uses of the work are permitted, provided the original work is properly cited.
Introduction
Endothelial cells as a vascular system are important since they play a main role in transporting nutrients, hormones, oxygen, or any reciprocal material to adjacent cells or tissues and removing waste from them.1-3 The endothelial cells derived from the human vein cord (HUVECs) have been used as in-vitro models for studying cellular and molecular pathophysiology, drug and hormones transport mechanisms, or pathways.4-6 Meanwhile, this type of endothelial cell has been used for the finding and evaluation of new insights and methods for the treatment and cell therapy of some diseases and disorders.7,8 Thus, quantitative/qualitative measurement and tracing of these model cells in culture media in in-vitro studies seem necessary. Also, real-time, fast, low-cost, and reliable methods for this purpose are attractive.
Immunocytochemistry and immunofluorescence staining protocols are commonly used for the determination and characterization of cells and for HUVECs as well.9-11 These methods are mostly destructive or invasive and need biomarkers and specific devices.12 For example, flow cytometry,13 confocal microscopy,14 phase contrast image analysis,15,16 immunofluorescent staining imaging and polymerase chain reaction (PCR) gene expression techniques,2,17 are other methods that are traditionally used for cell analysis, particularly in HUVECs quantitative/qualitative assessments. Nowadays electrochemical methods are widely used for the characterization and analysis of various cells and biological media. Utagawa et al have reported a review on the application of in vitro electrochemical assays on vascular cells (VCs) and organs.18 They have categorized 7 strategies of electrochemical structures for VCs and models that mainly involve HUVECs.
Some strategies include the electrochemical measurement of nitric oxide (NO), reactive oxygen species (ROS), and O2 produced by enzymatic mitochondrial metabolism. Due to the transient and low life time of the produced analytes, this strategy should be used as an in-situ method with the chronoamperometry technique. This approach is used for the evaluation of cells respiratory and some functionalities of VCs and, in fact, is a qualitative assay. Another strategy is used for evaluating VCs permeability for materials like rugs, water, ions, and blood cells. The cells are cultured between two layers of a semi-permeable membrane, and permeability of VCs is evaluated by traditional fluorescence tracers or by the quantification of passed redox compounds through vascular layer cells.4 Also, electric cell substrate impedance sensing (ECIS) has been used for tracing stem cell differentiation and proliferation as well,19 and impedance spectroscopy has been used for determining barrier function, motility transepithelial electrical resistance (TEER) measurements,20 and the determination of vascular endothelial growth factor (VEGF) in cell culture.21 In the ECIS technique, a small current is applied to cell content media, and the potential between the electrodes across the cells is measured. Insulating properties of cells and resistance to current flow is analyzed to find qualitative aspects such as cell adherence, morphology, growth, motility, and functions.22 Scanning ion-conducting microscopy (SICM) is used for topographic imaging and mapping of the mechanical properties of cells.22 Another electrochemical technique that is used for studying vascular cells is the double-barrel carbon probe (DBCP).23 In this technique, the RNA of a single cell is gathered on an electrode for consequent gene expression analysis. Electrochemical syringes, are another tool developed in recent years for extracting and collecting cellular materials for gene expression purposes and cell analysis.24 Micro electrode array (MEA)25 and light-addressable potentiometric sensor (LAPS)26 are other types of cell based electrochemical techniques that have been used for the biological study of live cells as in-vitro. Though these techniques provide valuable electrophysiological information about some cells and help scientists to find facts of cell behavior, microenvironment effects, drug’s effects, and analyses, they imply the application of complicated designs and complicated configurations and the use of electronic microchips with suitable adherence to cells in some cases. On the other hand, these methods are applicable only to excitable cells, and thus, the outputs of these techniques usually lead to qualitative results.
Here, a new technique is shown for measuring and quantifying HUVECs, an essential acknowledged model cell, employing optical microscopic morphological pictures as a calibration tool and fast Fourier transform continuous square wave voltammetry (FFTCSWV). The simplicity of the setup, which uses a standard culture plate without any modification and provides a sensitive tool for studying HUVECs by focusing on their proliferation and quantification, is the main benefit of the inventively constructed electrochemical cell configuration. This method is regarded as a non-invasive in vitro cell count method, and it uses two platinum plates as a measuring device with electrical excitation applied at a very low potential with minimal impact on the cell culture. Based on the current produced between two electrodes, which is dependent upon the concentration of HUVECs, the electrodes' impedance is determined.
Materials and Methods
Materials
Dulbecco's Modified Eagle Medium Nutrient Mixture F-12 (DMEM/F12) DMEM/High Glucose), fetal bovine serum (FBS), phosphate-buffered saline (PBS) were purchased from Gibco, Tripsin-EDTA from Sigma, Merck 96% Ethanol, Invitrogen Alamar Blue, Pen/Strep antibiotic, T25 culture flask, sterile 15 and 50 falcons, and 24 wells plate were used in the culture process.
Cell culture
Human umbilical endothelium vein cells were cultured at 5% CO2, 37 °C, and 95% humidity in DMEM/F12+FBS 10% culture medium. The flasks were monitored by phase contrast microscopy in aspects of growth, proliferation, morphology and bacterial or fungicidal infection every day. The culture medium was exchanged every bi-day by fresh medium. The trypsin enzyme was used for detaching of cells from the plate. After cell confluence, the subculture was done.
Cell counting setup
Before electrochemical experiments, standard samples, including a definite number of cells counted in each well, were prepared. Neobauer Lam (hemocytometer) was used for this purpose. The cells were detached from the plate enzymatically by trypsin. Then the solution was centrifuged, separated, and suspended homogeneously. 10 µL of suspension was transferred to a well, and 10 µL Trypan Blue was added. The mixture was pipettaged several times to get homogeneous separated cells. 10 µL of mixture was transferred onto Neobauer lam as complete coverage of lamella, consequently. The number of cells was calculated by microscopic focusing according to the Neobauer chamber procedure. With adjusting the micro and macro screws of the microscope, the number of alive and dead cells was counted on 16 square sets, and the mean value of four 16 square sets was crossed to 20 000, which was considered the cell count (see Scheme 1). For the preparation of a definite concentration of cells in each cell, a definite factor of 10 µL of Neobauer chamber was transferred to each well, and the overall volume was 600 µL with PBS. The computer aided design (CAD) data of an electrode holder was used according to the dimensions of the culture plate. The constructed CAD data was made from ABS (Acrylonitrile Butadiene Styrene) material by a 3D printer, entirely fixed to the wells. Two 12×6 mm and 300µ platinum plates were made of pure platinum sheet and inserted in the ABS body as illustrated in Fig. 1. The dimensions of two platinum plates were precisely the same. A standard 24 well culture plate was used in all experiments. Scheme 1 shows the steps of construction and the details of the measurement setup. Scheme 1 shows a schematic image of this procedure and the Neobauer chamber.
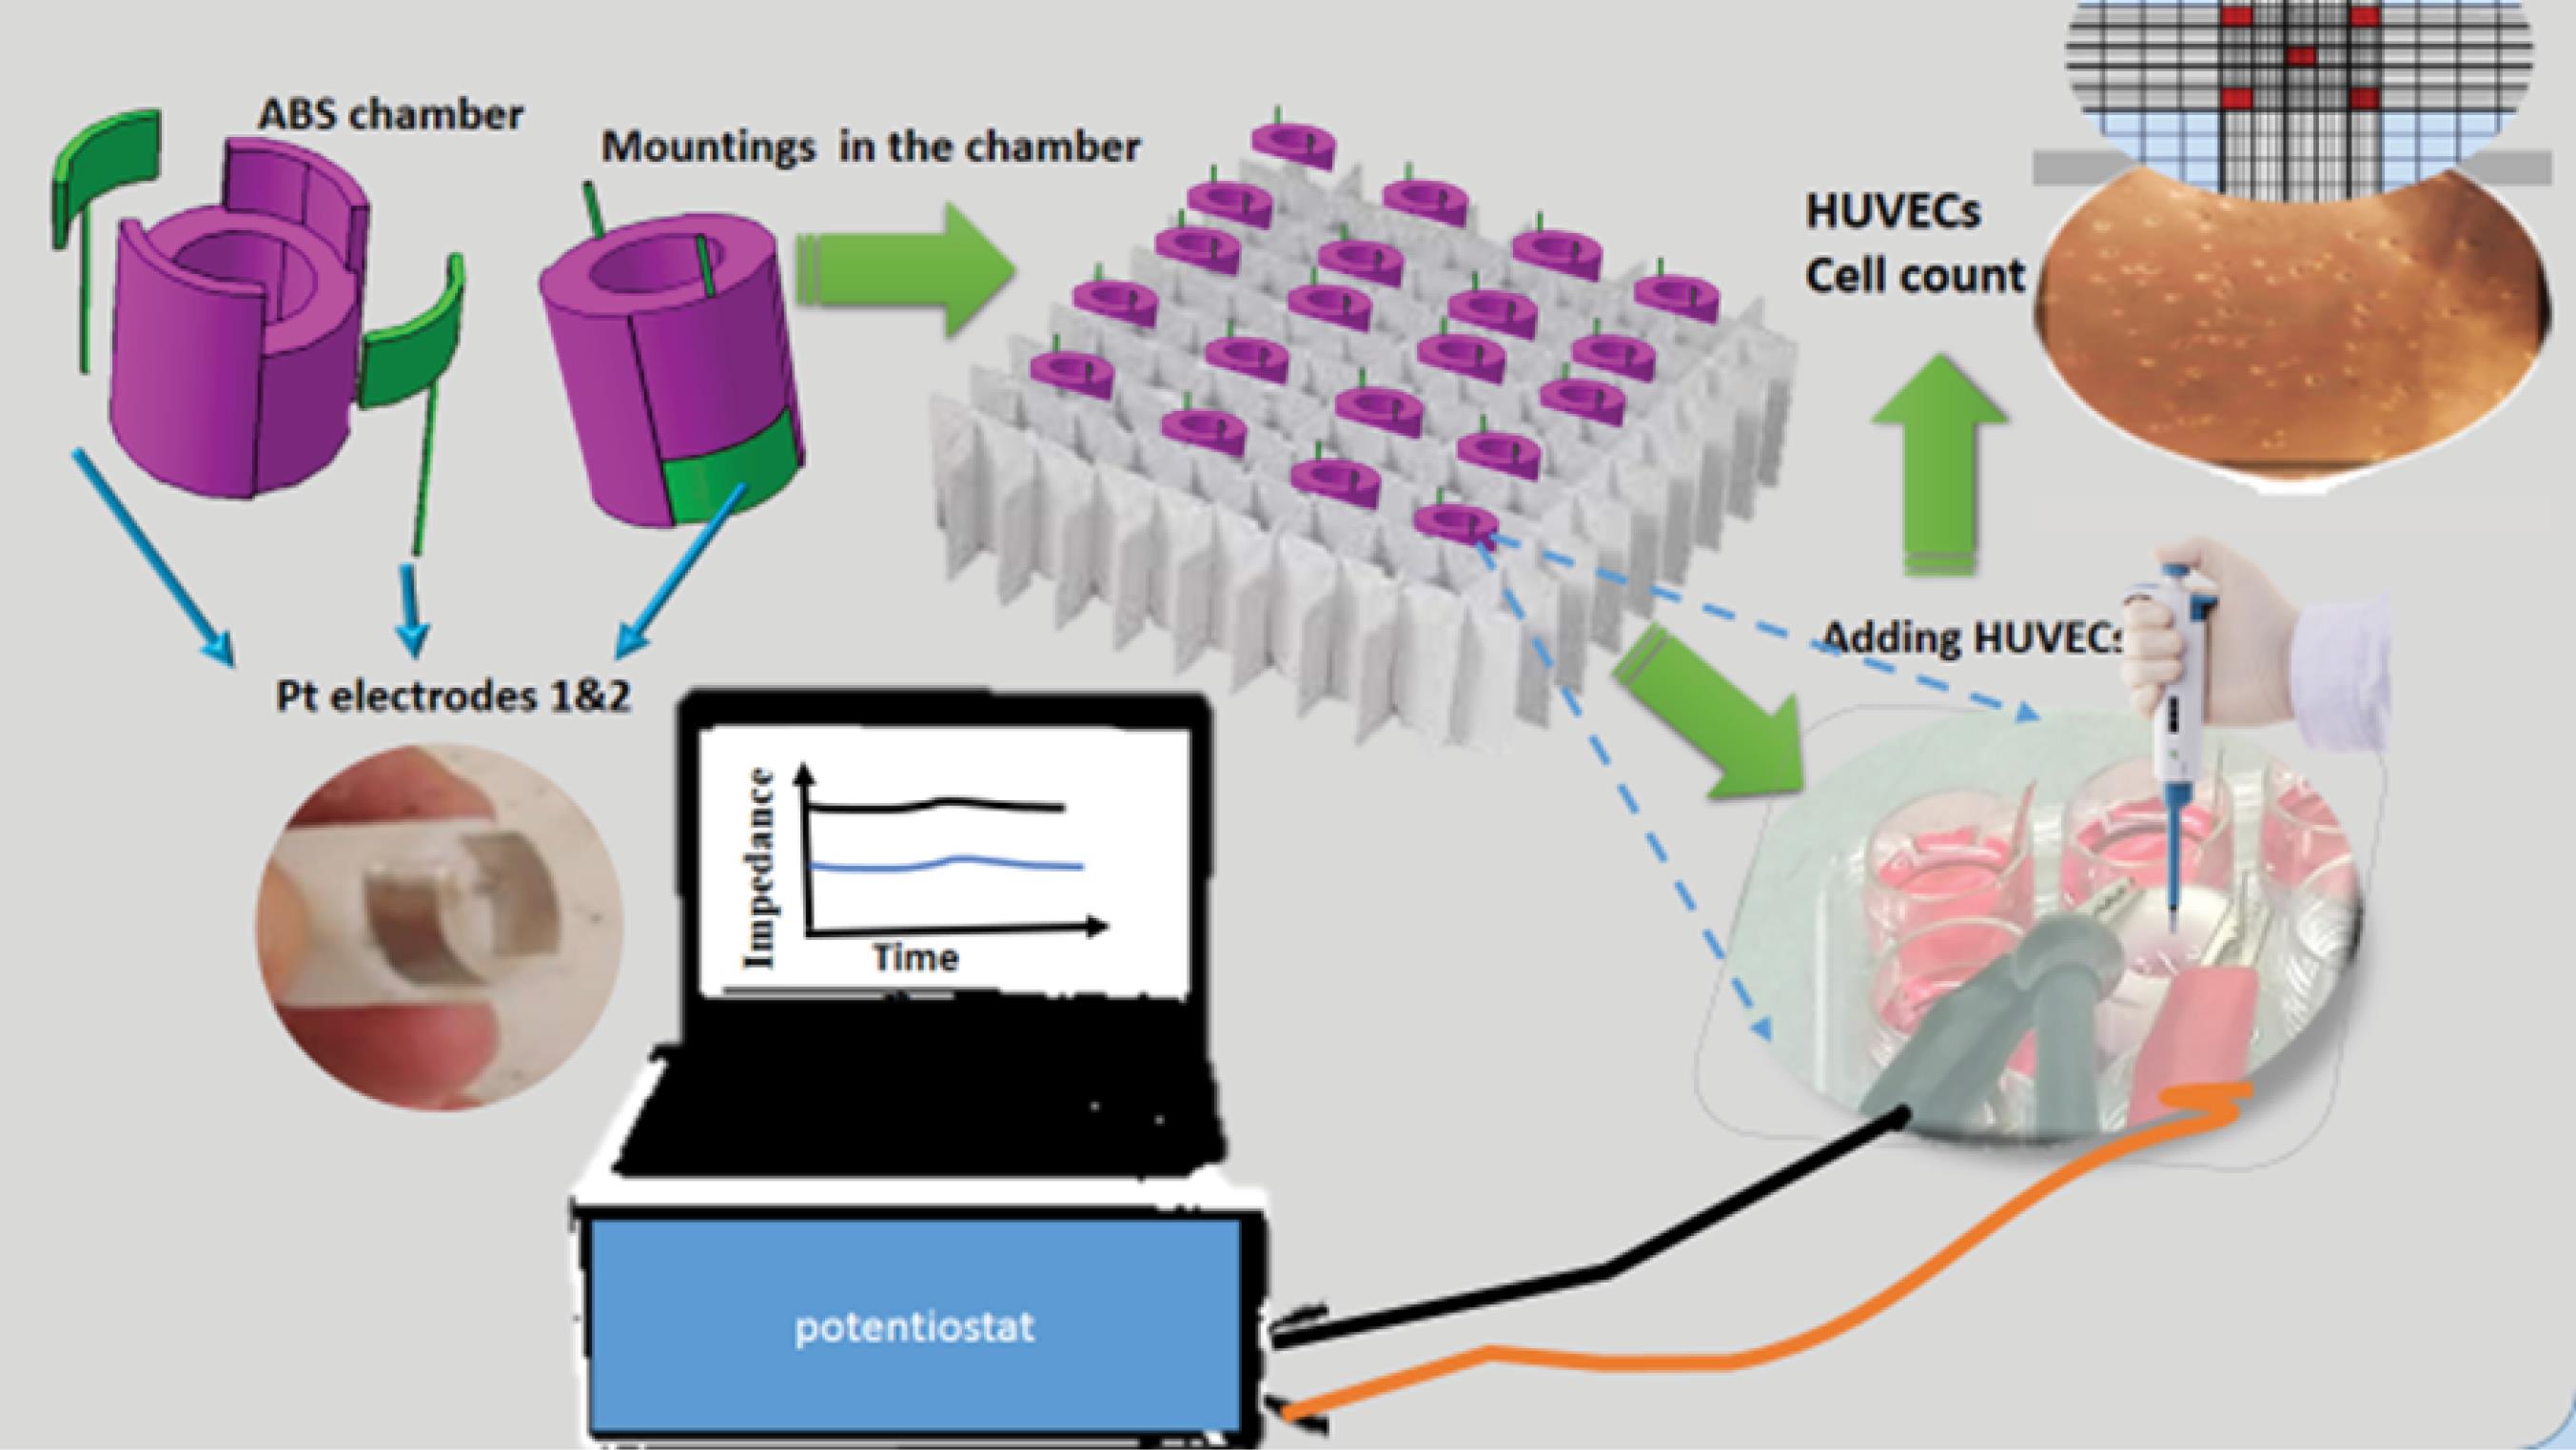
Scheme 1.
The steps of construction and the details of the measurement setup.
.
The steps of construction and the details of the measurement setup.
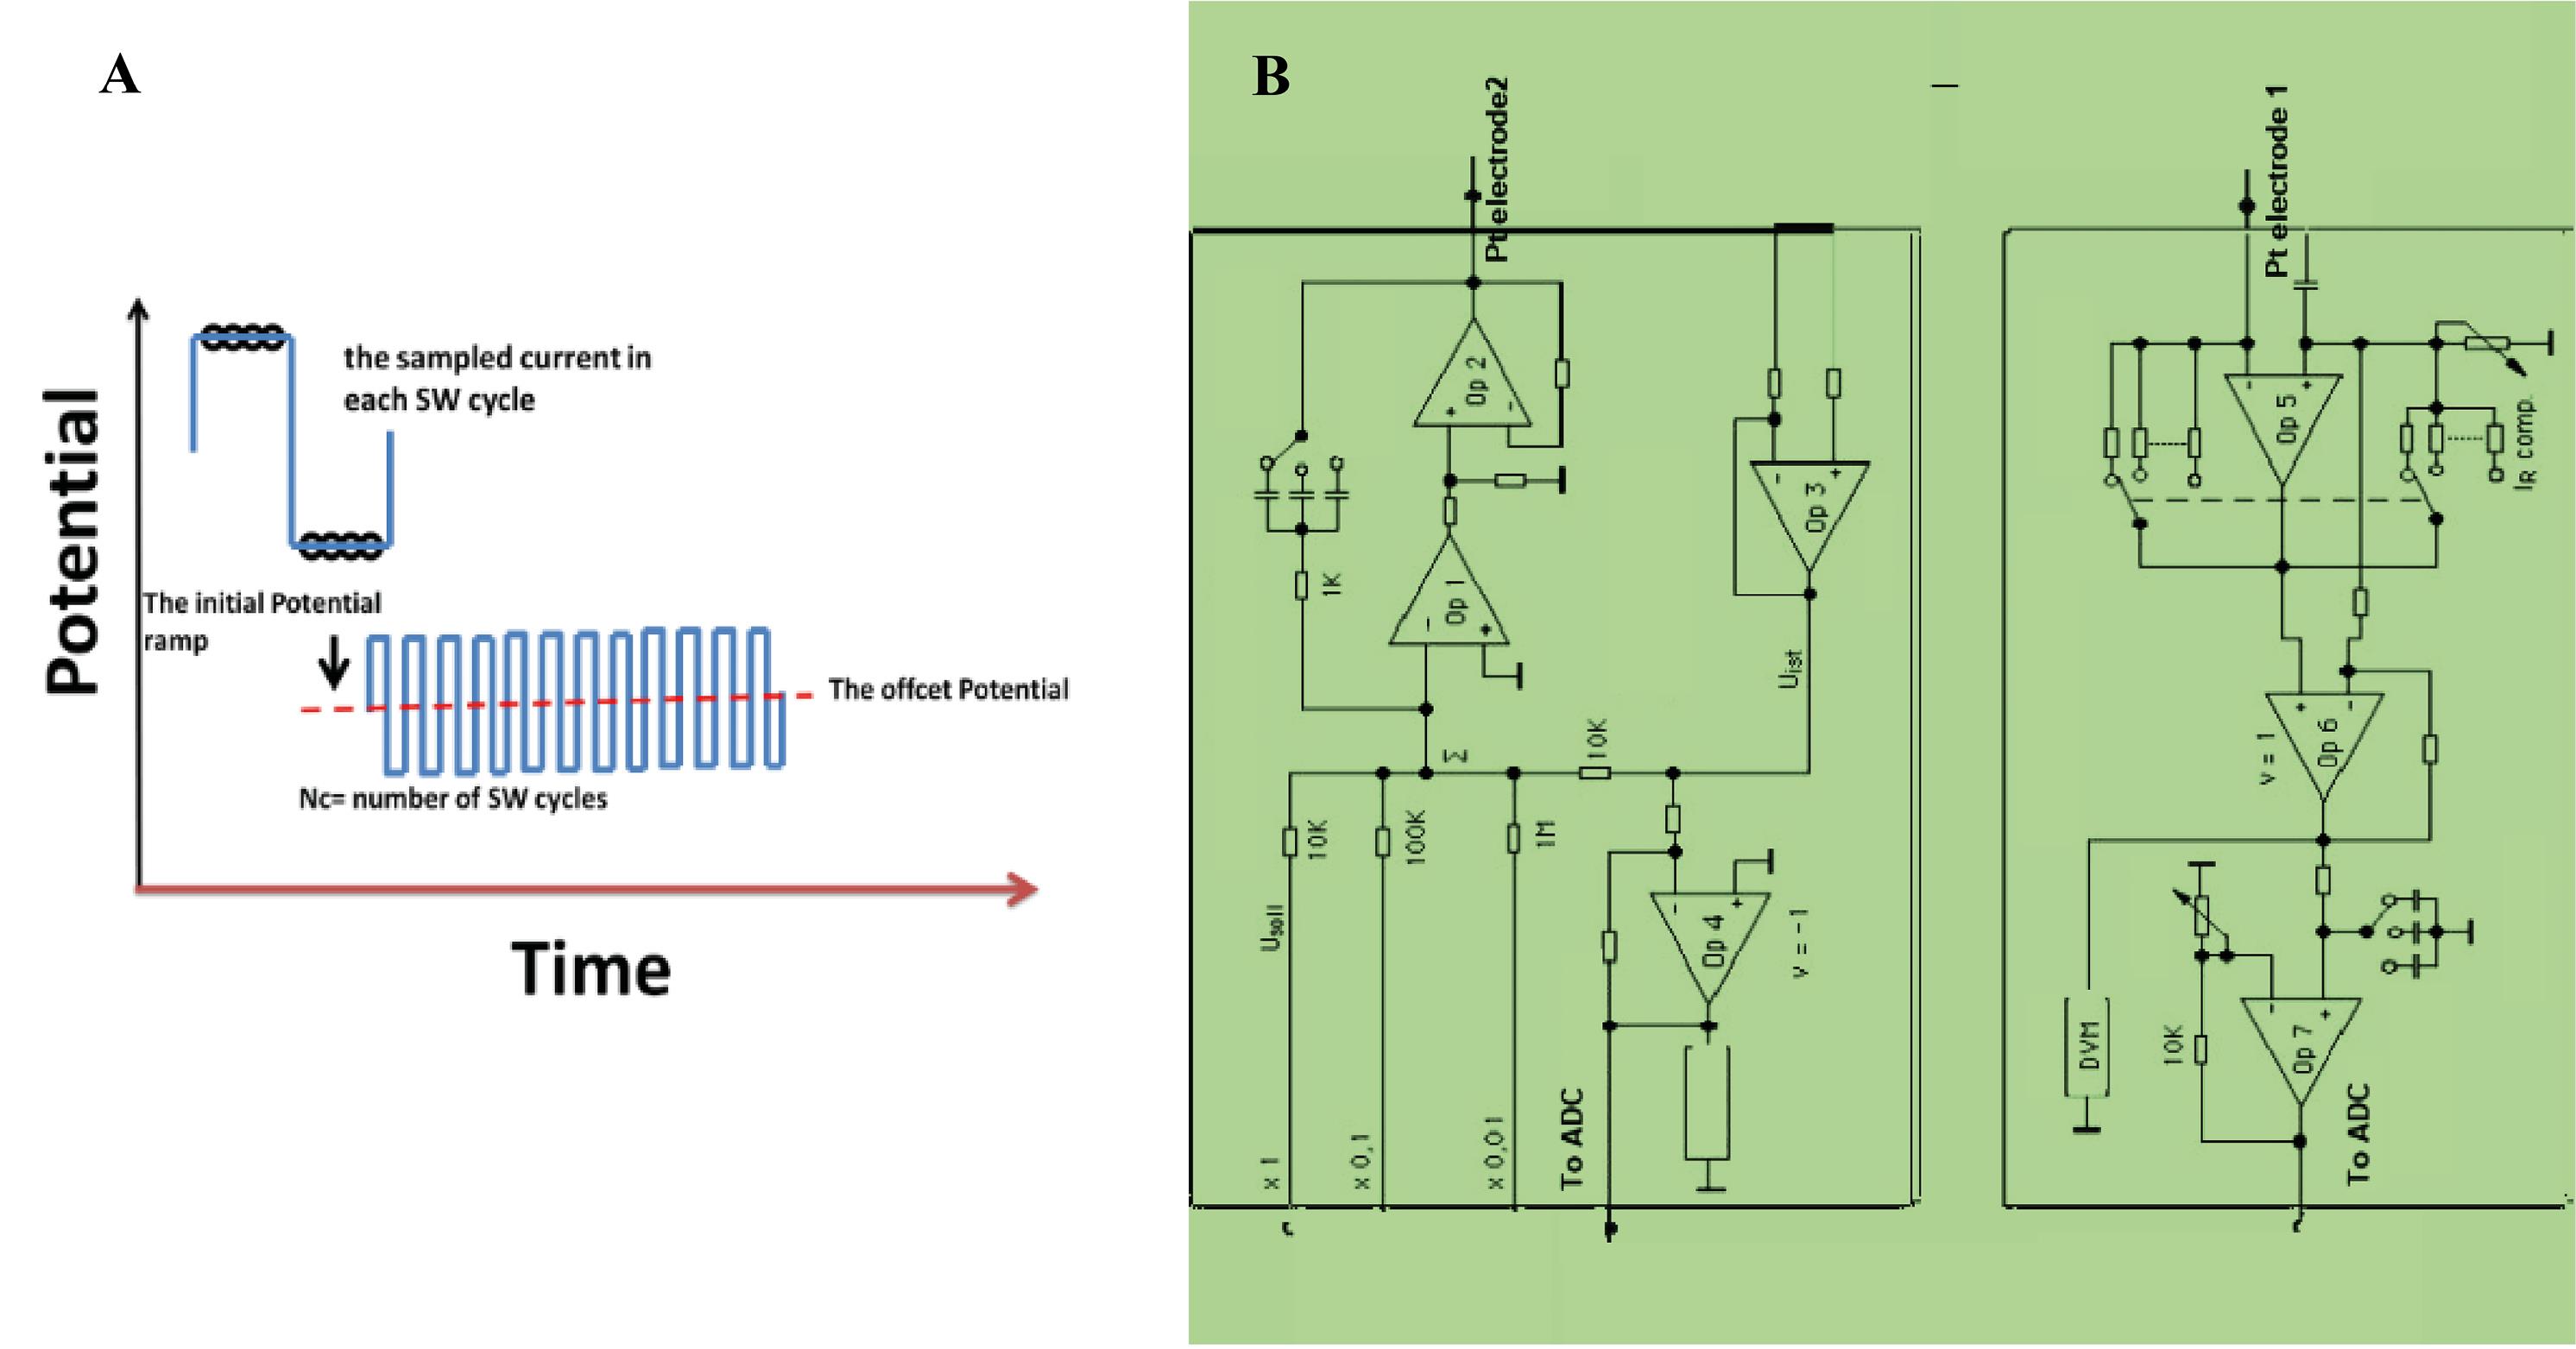
Fig. 1.
(A) The potential waveform and (B) the circuit diagram used for FFTCI measurement.
.
(A) The potential waveform and (B) the circuit diagram used for FFTCI measurement.
Electrochemical Measurement setup
The electrochemical setup for FFTCI measurement comprised a computer equipped with a data acquisition board (PCL-818PG, PC-Labcard Co.), which was connected to a cell, which consisted of two Pt plate electrodes (1×2 cm) (Scheme 1). The diagram of the applied potential waveform during FFTCSWV measurements is shown in Fig. 1A. The circuit of the potentiostat (Fig. 1B) and controlling program were developed in our lab. All data acquisition and processing programs were developed on the Microsoft VB platform in our laboratory.
Phase contrast images and cell counting experiment
Before starting every electrochemical measurement, the phase contrast image of every electrochemical cell (see Fig. 2) was recorded by an Olympus inverted microscope. Because one of the most important issues in in-vitro research is fabrication of electrochemical cell compatible with cell growth media, reserves, and vitality conditions, for evaluating of cell proliferation correlation with electrochemical signals, the assessments were performed at three steps: 5, 24, and 48 hours after the seeding of HUVECs. Cultured cells show fixed confluence, morphology, and adherence on the plate at 5 hours after seeding. Thus, after seeding, the first starting point of the monitoring experiments was 5 hours. For calibration, the standard samples containing 12 500, 25 000, 50 000, 75 000, 100 000, 125 000, 150 000, and 175000 cells were prepared in a 24-well culture plate filled with identical numbers of cells in every 3 adjacent wells with blank culture media for greater reproducibility and accuracy in every experiment. This configuration was selected according to initial assessments of the method. As already mentioned, the image of every well is recorded before electroanalytical experiments. Fig. 2 shows demonstrational images of 3 wells, including a defined prepared number of HUVECs.
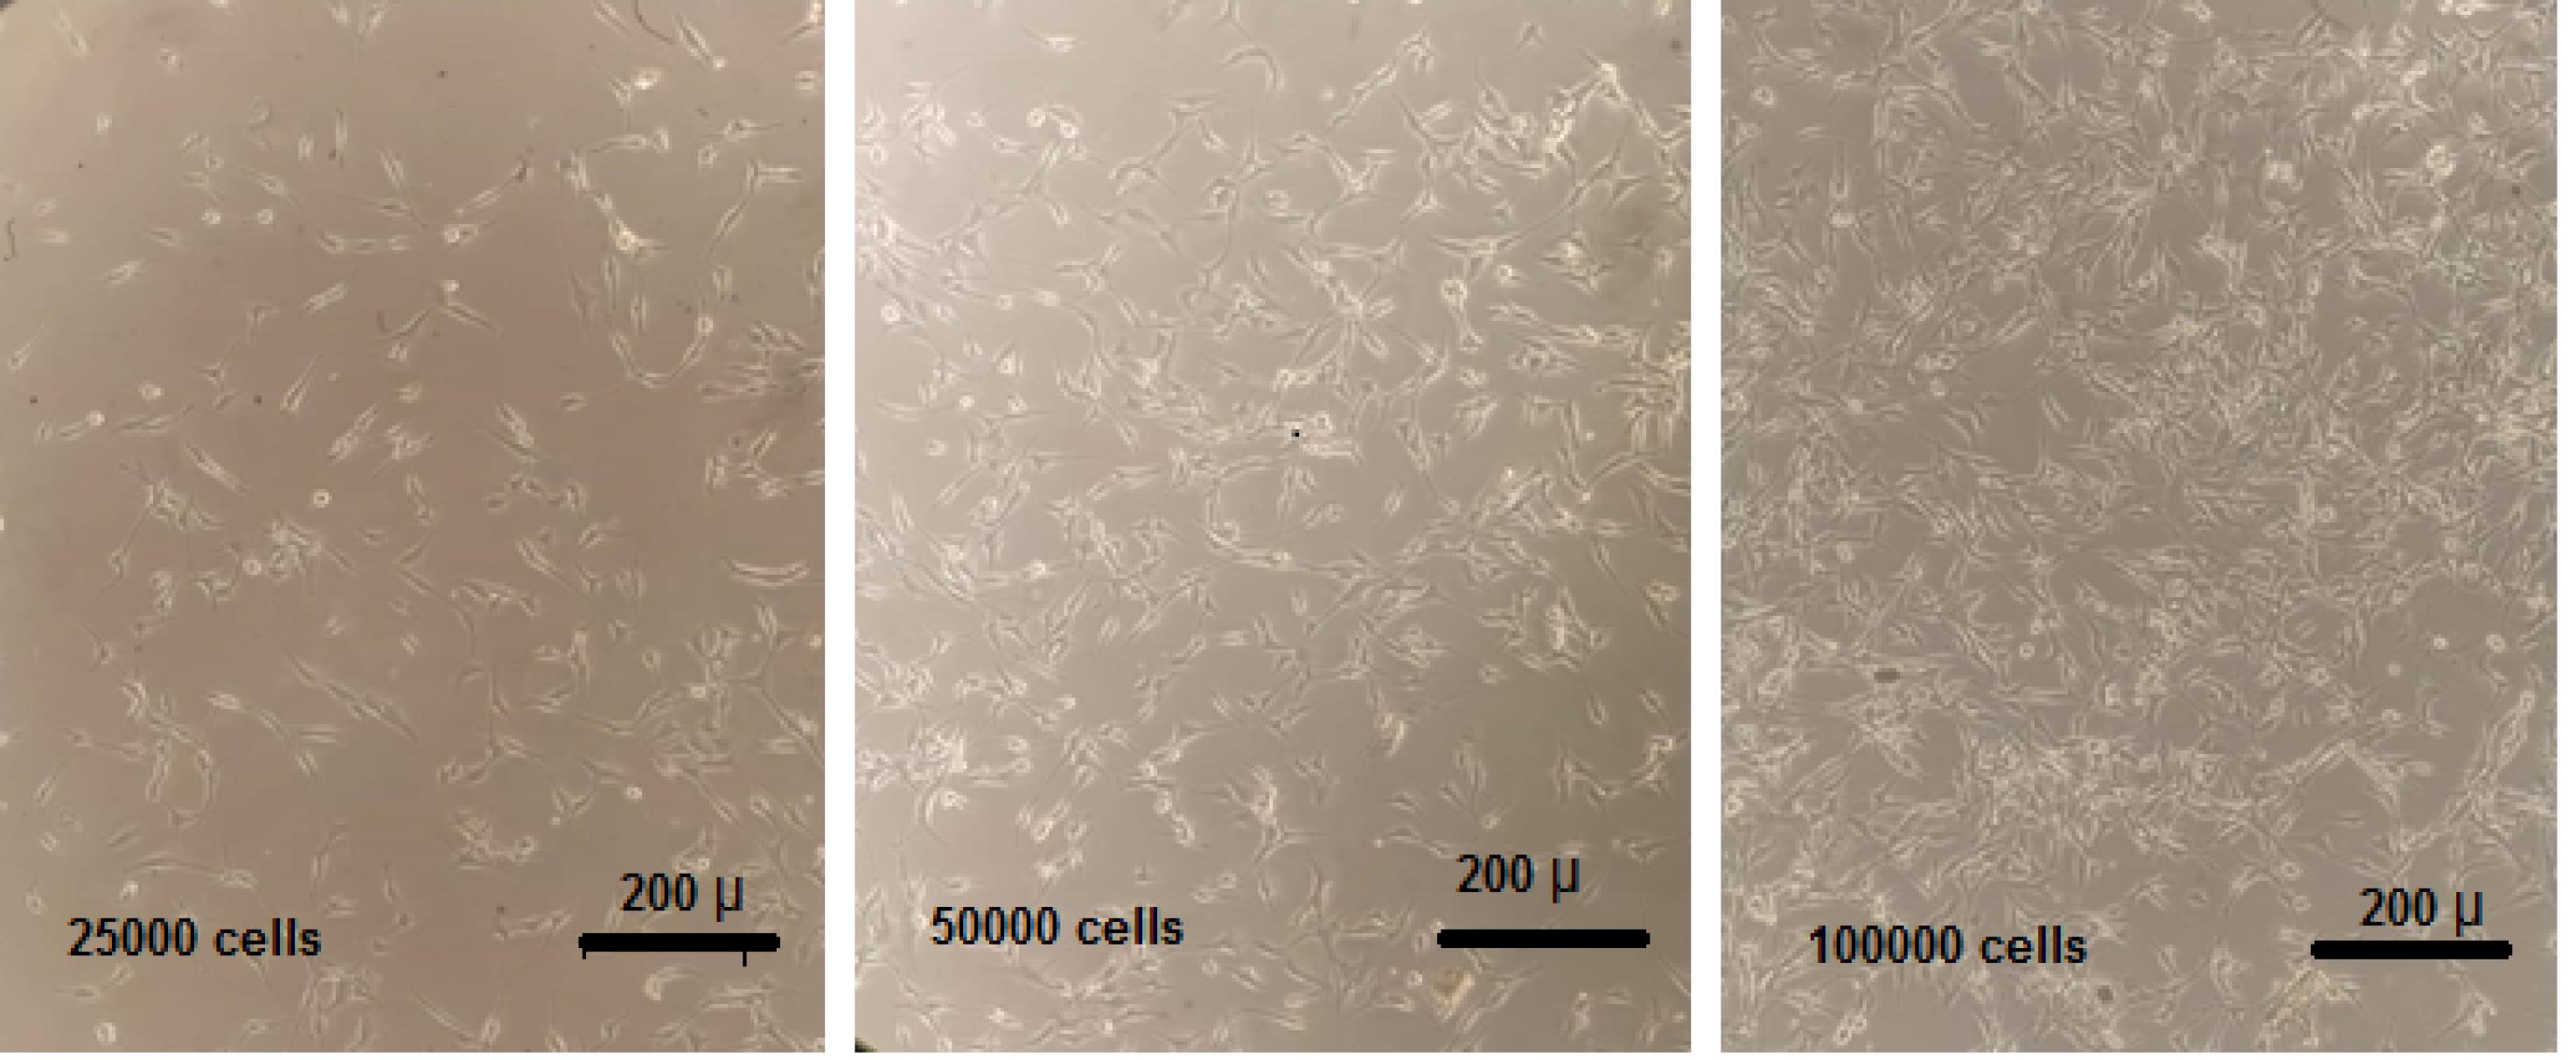
Fig. 2.
Demonstrative images of wells containing 25 000, 50 000 and 100 000 number of HUVECs.
.
Demonstrative images of wells containing 25 000, 50 000 and 100 000 number of HUVECs.
Electrochemical impedimetric measurements
Following is a brief overview of the principals involved in the data acquisition processing used in the FFTCI method, and more original, detailed discussions of these principles can be found elsewhere.27 The potential waveform and the sampling time in each SW cycle are shown in Fig. 2A. As shown, in each cycle, eight data points were collected, and stored in a two-dimensional matrix. Where the SW current was initially filtered by a low-pass filter with a special cut-off frequency twice the applied SW potential frequency. This can produce a sine wave. During the measurement, in one potential SW cycle, the currents were sampled 8 times, which are labeled as I0, I1, I2,I4, Ii5, I6and I7. Also, as shown in Fig. 2A, for the total number of current, correspond, the potential E0 to E7 are the electrode potentials were recorded, and at the end of each experiment run, the current and potential data were stored in an array matrix. As shown in the figure, the measurement potential waveform contains several SW pulse cycles with an amplitude of Esw and frequency of fi, were superimposed on an offset potential of E (the dash line). The values of the amplitude square of SW (Esw) are in the range of 2 to 5 mV. Theoretically, the current output filtration is
(1)
In Eq. 1, I1is the magnitude of the ac current, ω is the angular frequency of the applied potential waveform (ω = 2πf), φ is the phase shift of the SW current with respect to the applied ac potential, and the subscripts refer to a particular harmonic of the current response. The second and third terms in Eq. 1 describe the higher harmonics generated by the electrode process. The most important term in Eq. 2 is the first term (called the fundamental response of the electrode), which describes the current at the same frequency as the applied potential. Whereas impedance of the electrode numerical calculation based on FFT was used to calculate the current. Consequently, after filtration in digital form, the calculation is,
(2)
Where, is is the sampled at time intervals of currents. (at even time intervals, ts, ts+1/8f0, to ts+n/8f0, s is an integer number of current in each SW cycle a. k is the total number of the sampled current, and n is equal to 8. The magnitude of the current, In, and the phase shift, φ depend on the electrode impedance:
Where Zrel and Zimg are real and imaginary components of the electrode impedance, and total impedance, (
) is the total value of the electrode impedance. Mathematically, the ac current can be represented as a vector with a magnitude described by Ik. The real part of the impedance is equal to the solution resistance, and the imaginary part is dependent on the double layer capacitance of the electrode (Cdl) and the frequency:
Where Zdl is the impedance of the double layer at the electrode surfaces, j is
, A is the electrode area, and ω is 1/f. Based on these equations, the total impedance is strongly affected by changes in the double capacitance or electrode surface concentration. Theoretically, the phase shift for the background current can be between 0 and to 90 degrees, depending on the SW frequency (f), the size of the electrode, and the conductivity of the supporting electrolyte. In general, in the FFTCI response over time, the detector response reflects changes in the electrochemical cell impedance. As mentioned, the live cells on the electrode surface cause a change in the impedance by changing the capacitance of the electrodes. It should be noted that changes in impedance can be observed if the total number of cells in the solution changes. Norouzi et al,25 Osaka and Naoi28 and Virbickas et al29 have reported several studies using of FFTCSWV techniques.
Impedimetric parameters optimization
As previously stated, crucial factors like the frequency and amplitude of the applied SW may have an impact on the sensitivity of the impedimetric measurement. As a result, measurements were made in PBS containing 25 000 HUVEC cells in the frequency range of 10 to 500 Hz and the amplitude range of 1 to 20 mV in order to determine the parameters' ideal values. The electrode's response increased with the SW frequency up to 88 Hz and an amplitude of 5 mV before decreasing, as seen in Fig. 3. The solution resistance and the rate limitation of the processes at the electrode surface may both contribute to a lesser response being obtained at other frequency levels. The SW potential waves with a frequency of 100 Hz and an amplitude of 5 mV were therefore used for the best results.
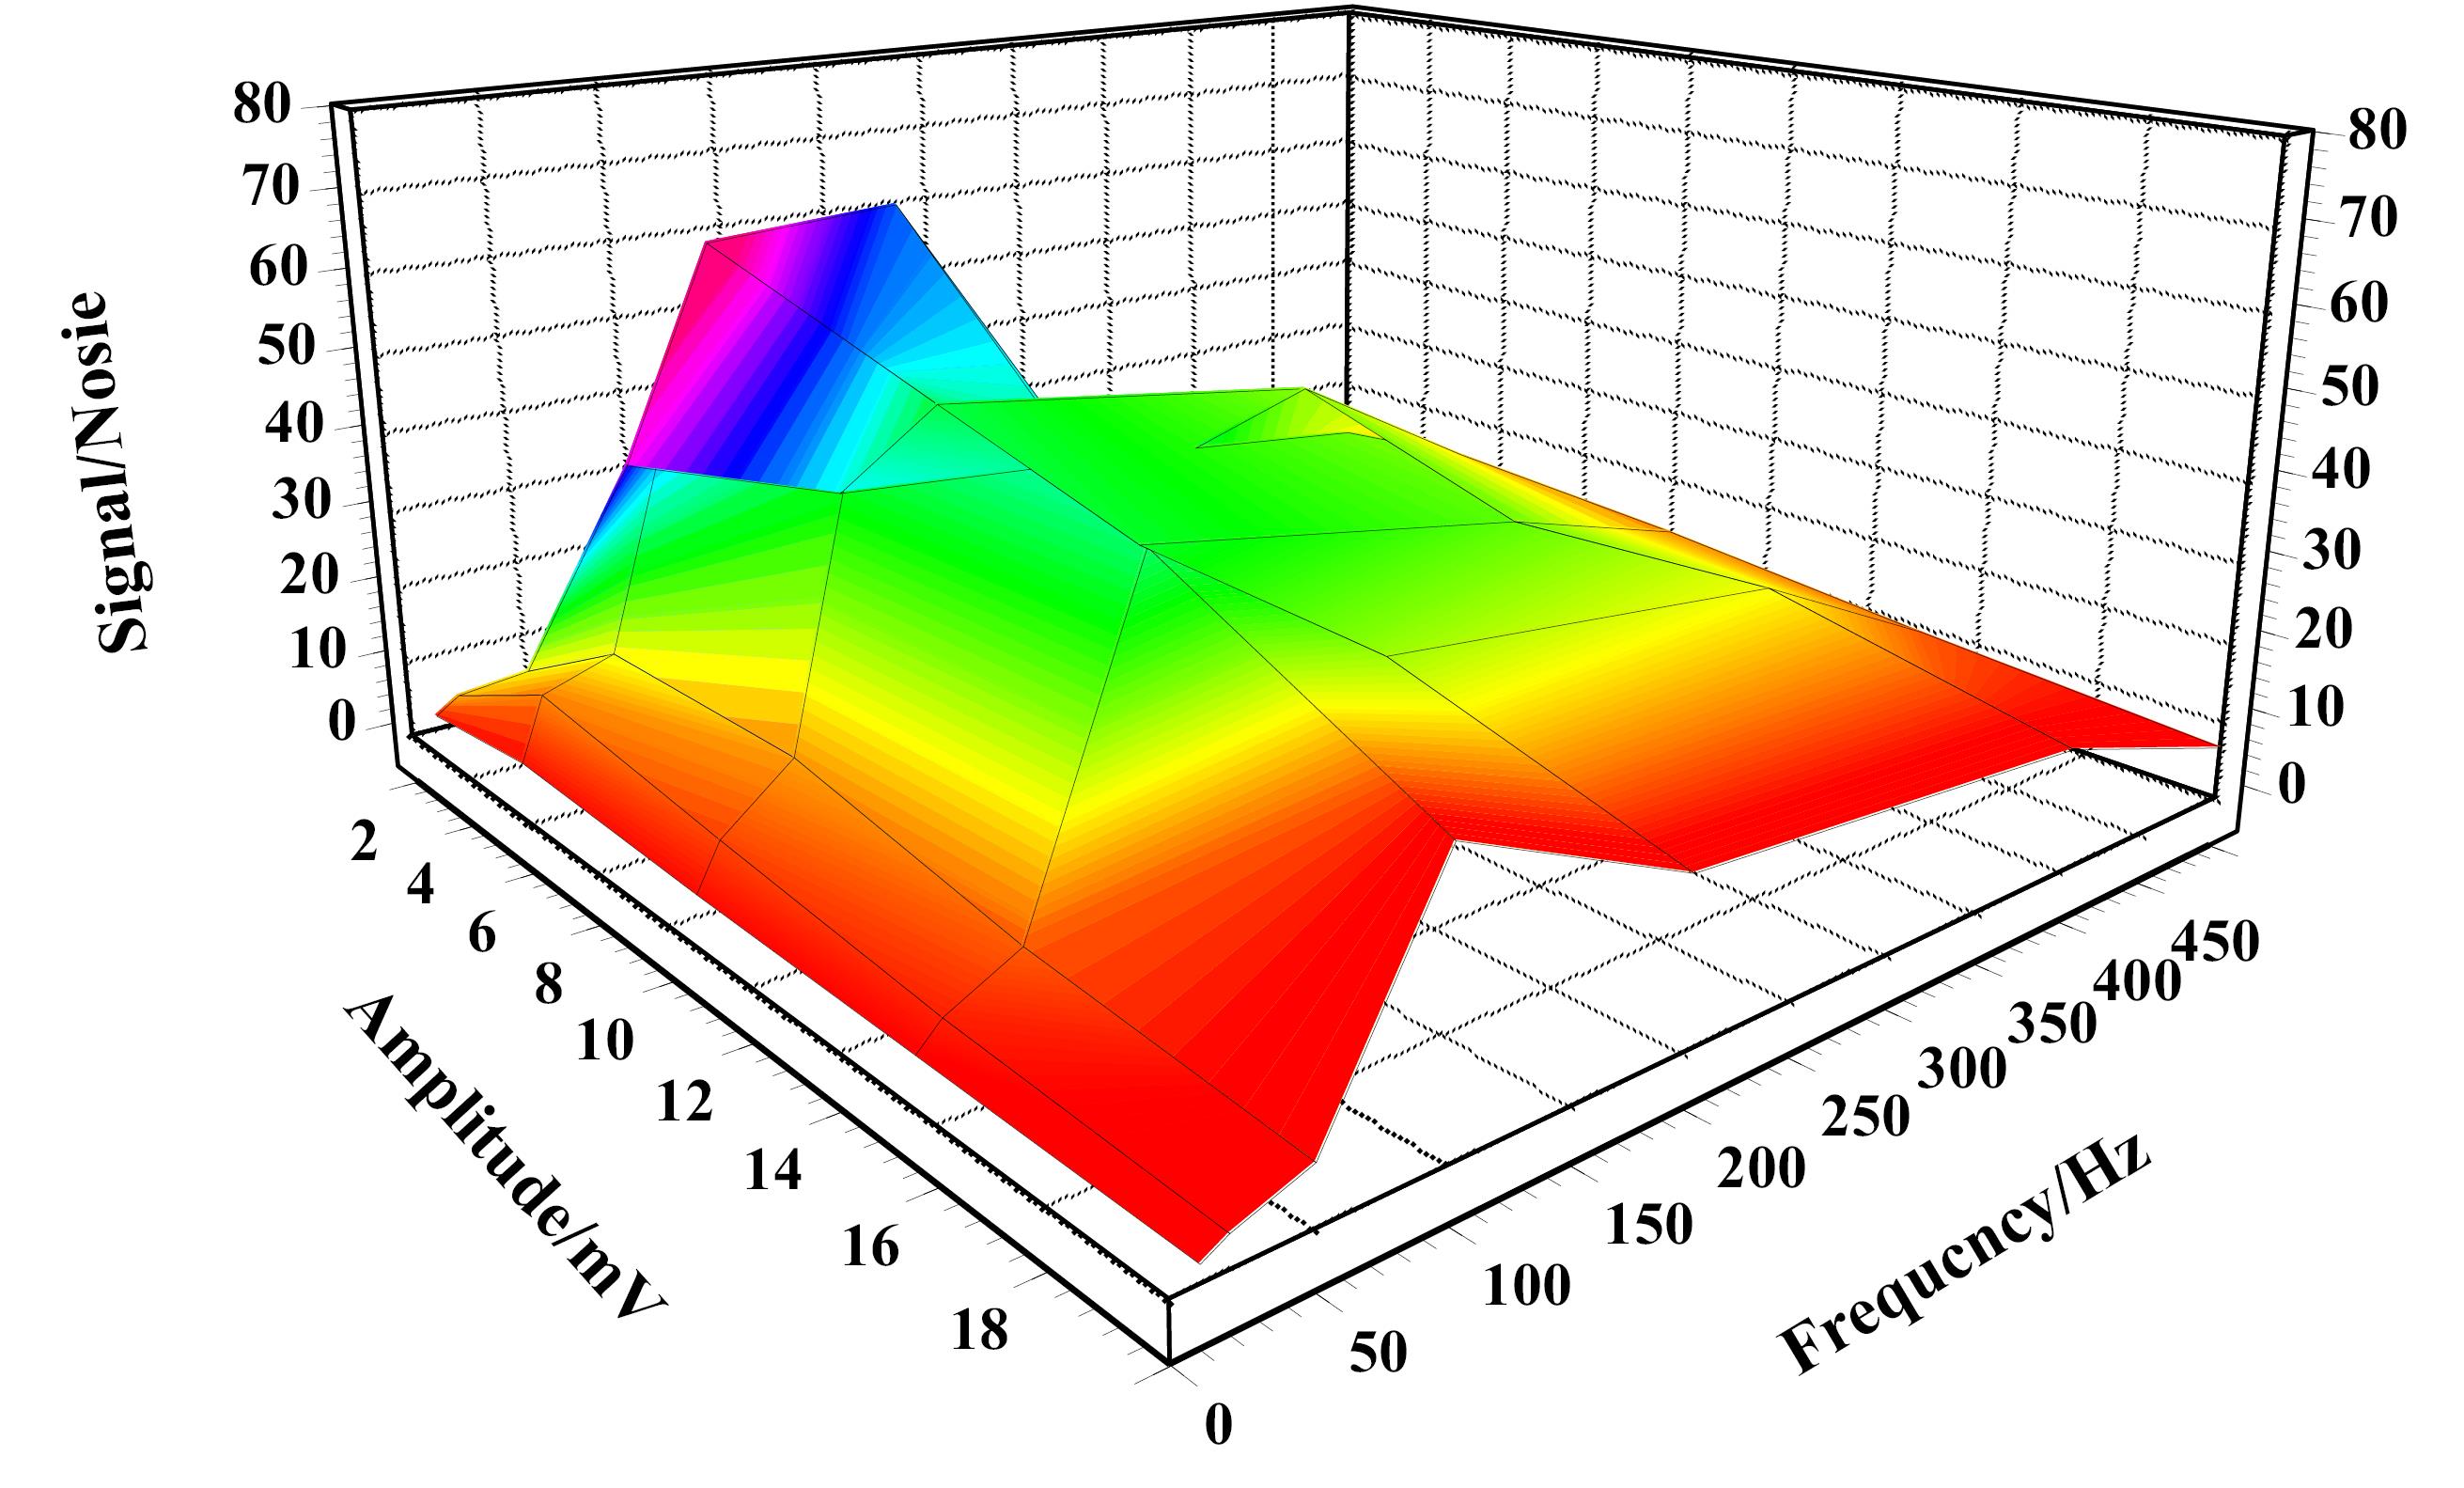
Fig. 3.
The Effect of frequency and amplitude on the electrode signal, frequency range of 10 to 500 Hz and amplitude of 1 to 20 mV, in PBS containing 25000 HUVEC cells.
.
The Effect of frequency and amplitude on the electrode signal, frequency range of 10 to 500 Hz and amplitude of 1 to 20 mV, in PBS containing 25000 HUVEC cells.
Electrochemical measurement
Five hours after cell seeding, the impedance variations are seen in Fig. 4. The measurements were carried out by triggering the voltage during the five seconds of recording. The background resistivity has been subtracted from the recorded impedance values, which are pure quantities. In every set of measurements, two 24-well culture plates with identical materials were utilized concurrently. Six repeats of each measurement were performed, and a standard deviation of 2.75% was calculated. The impedance rises with increasing cell count in all phases of testing, as seen in Fig. 5, as predicted.
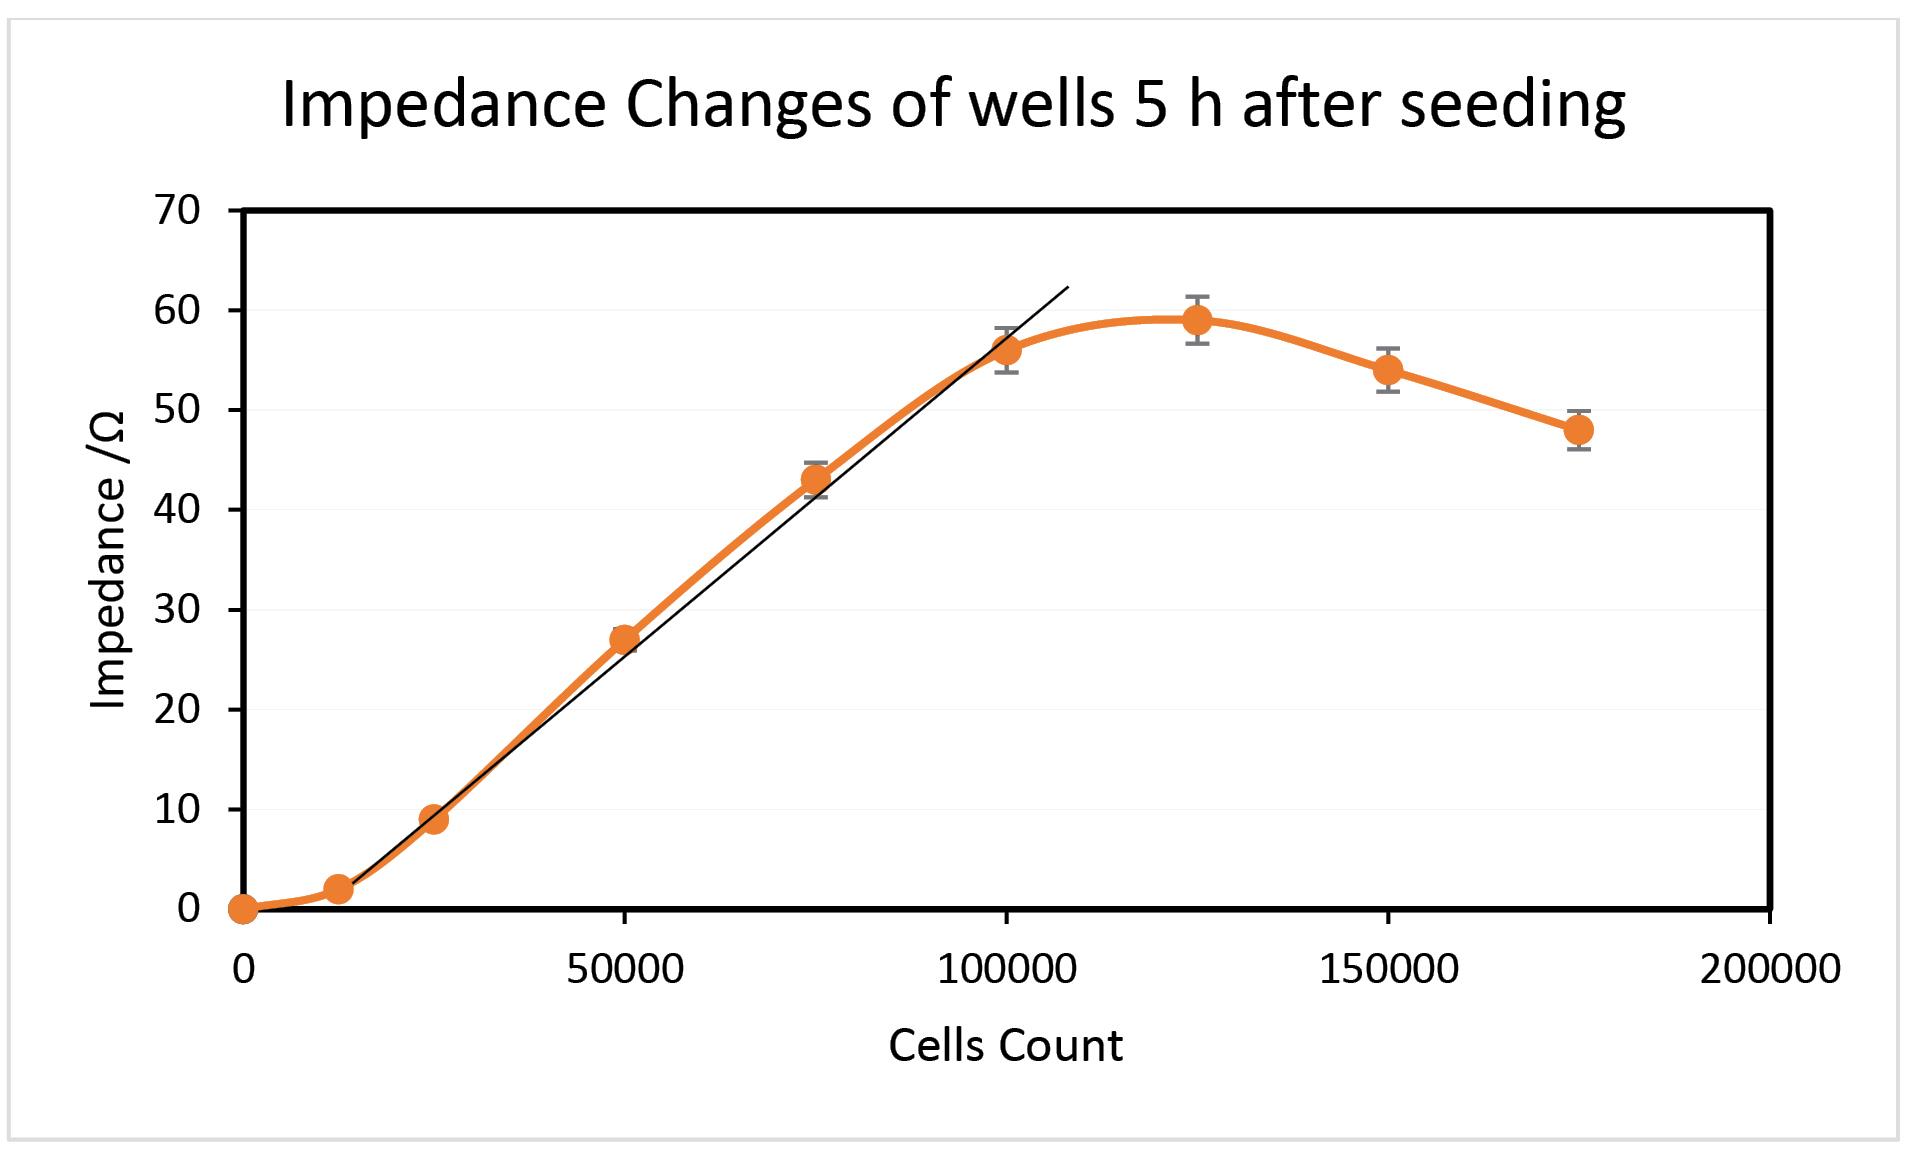
Fig. 4.
Impedance changes at 5 Hours after seeding, at frequency range of 100 Hz and amplitude of 5 mV, in PBS.
.
Impedance changes at 5 Hours after seeding, at frequency range of 100 Hz and amplitude of 5 mV, in PBS.
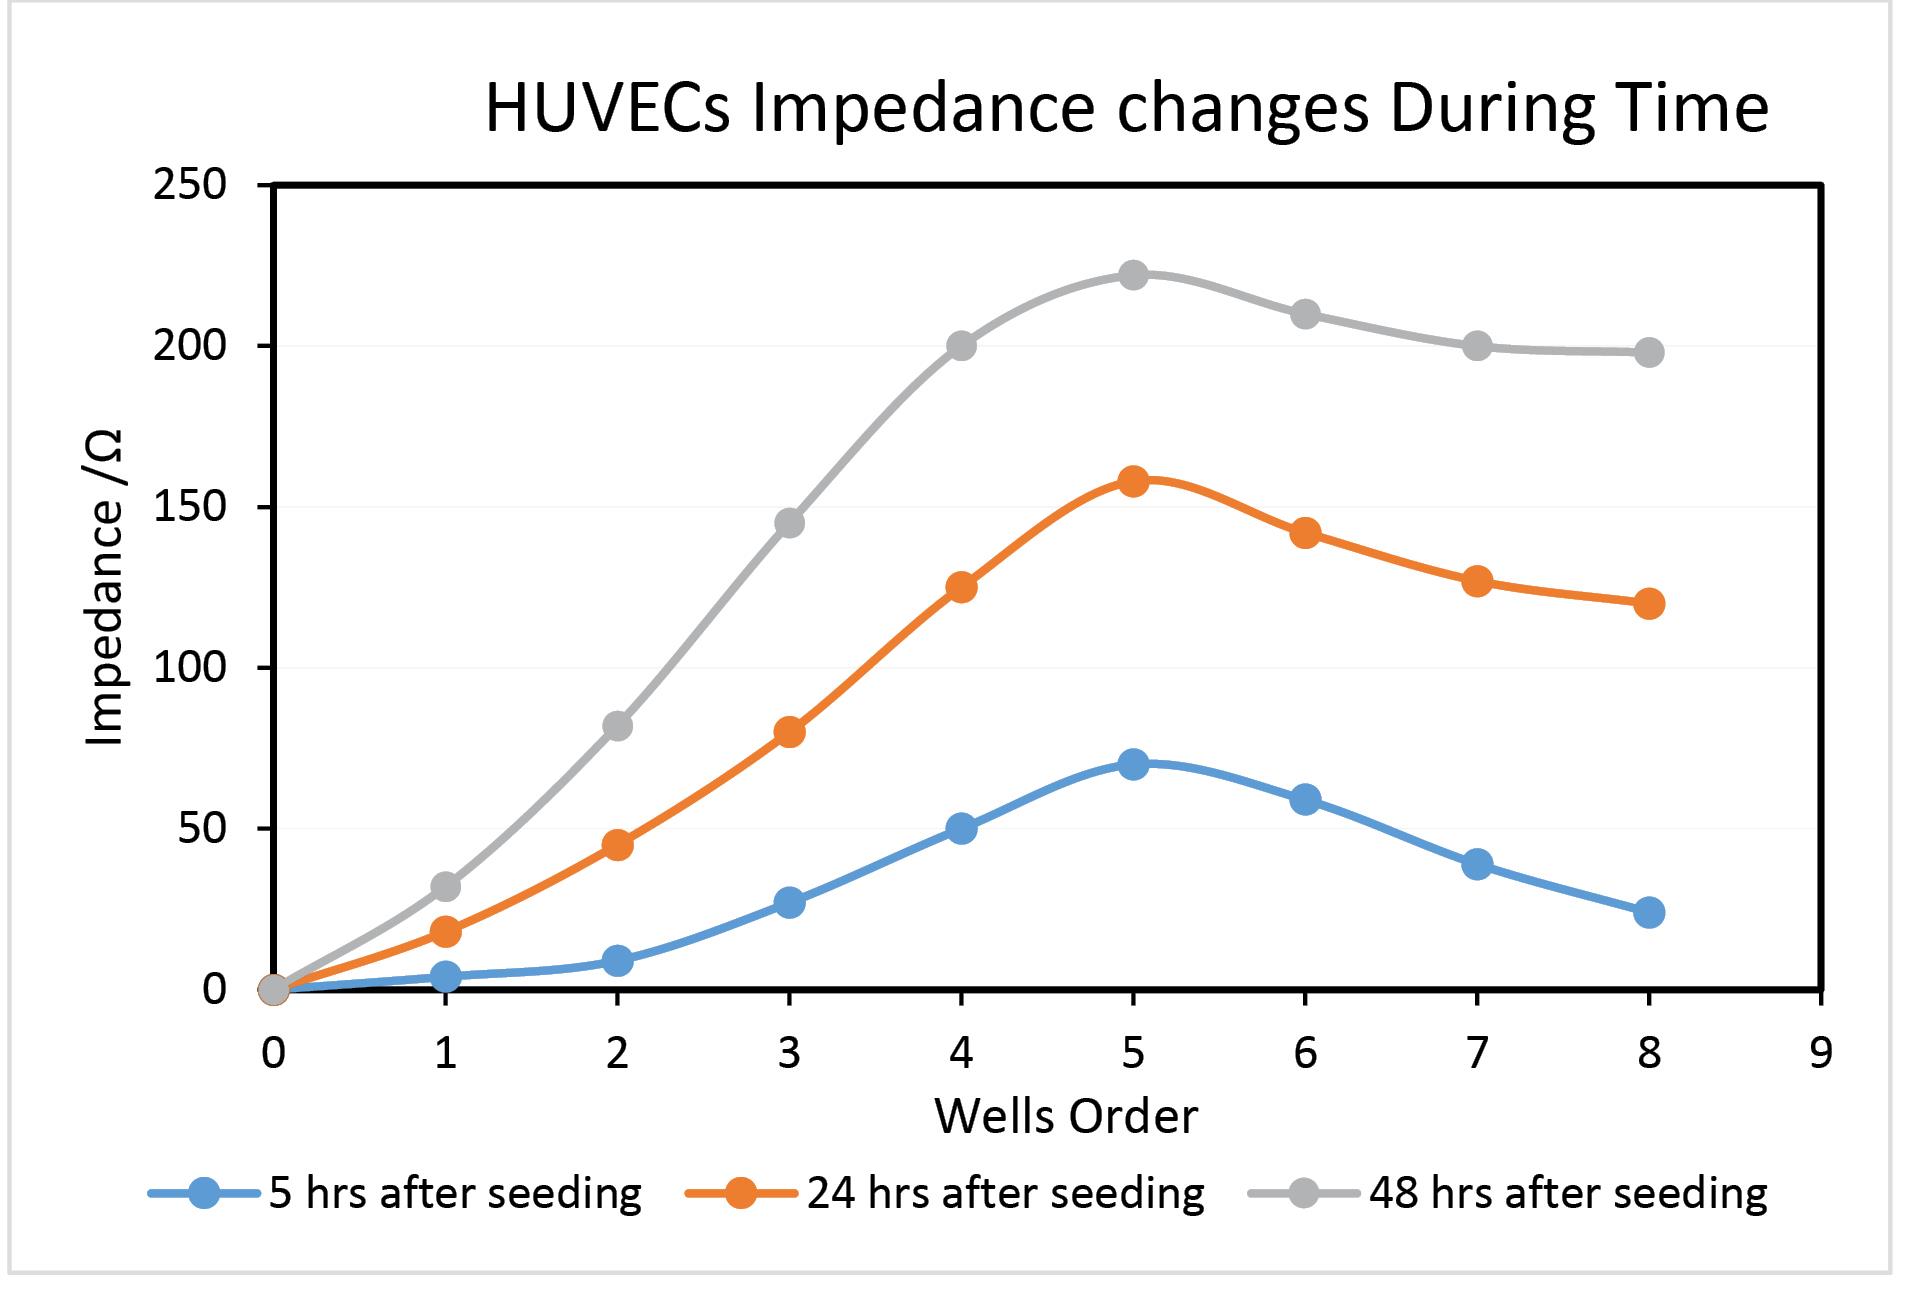
Fig. 5.
Comparative impedance measurements at a 48 hours’ period at frequency range of 100 Hz and amplitude of 5 mV, in PBS.
.
Comparative impedance measurements at a 48 hours’ period at frequency range of 100 Hz and amplitude of 5 mV, in PBS.
Discussion
The method shows a linear dynamic response in the range of 12 500 to 100 000 cells count at the time 5 hours after seeding. In a larger number of cells, the impedance alteration tends to diminish. Indeed, the overall impedance is affected by intracellular and extracellular bioactivities. The cell membrane potential originates from faradaic and nonfaradaic electrochemical phenomenon.30 Nonfaradaic electrochemical processes such as ionic exchanges of cations like Na+, K+ and Ca+ across the membrane lead to changes in the ionic conductance of the cell’s microenvironment. This happens via the ionic channels of the cell membrane. On the other hand, faradaic currents produced by intracellular redox activities lead to electron flow on both sides of the cell membrane. This happens through the redox electron mediator’s migration across the cell membrane. Intracellular enzymatic mitochondrial activities release some molecules, like NO species, that migrate through the membrane and possess the electrochemical properties of the cell environment.13,31,32 Sometimes some of the cells are damaged or mortal. In such cases, live, proliferated cells migrate toward death or damaged cell positions. This is the same event that is named "wound healing". The cells implement this action via bioelectric signaling. The membrane potential of damaged cells changes and makes bioelectric signals via charge fluxes with other adjacent cells to trigger migration or healing. When the junctional gaps are minimal (high cell population), the signaling is facilitated, and charge fluxes are more feasible. This event can act as an opposite agent versus impedance increasing. In fact, this movement of electrons and ionic charges, is a constituent of cell communication routes and bioelectric signaling between cells that correlates with cell behavior and tissue regeneration. At the stages times of cell proliferation, the distance of adjacent cells is not enough to effectively make electrical signaling and extracellular charge exchange, while the progress of cell proliferation causes to minimize the cell gap and leads to ramp up the cell signaling and communication. So it is expected to face down the measured electrochemical signal of impedance in proliferative cell counts. In a brief, two dynamic agents compete together to yield the overall impedance of the sample, including a defined number of HUVECs. 1: the growing number of cells that determine the linear incremental impedance; and 2: controversial agents that oppose the expected impedance enhancement.
Moreover, the above-listed reasons for results deviation from ideal expectations, cell counting by hemocytometer and staining with Tripan Blue, showed that some cells go toward mortality and the real number of cells decreases and detached from other cells adhered together.
At 24 and 48 hours after seeding, measurements were taken using the following procedures: This diagram's crucial conclusion is that the impedance increases proportionately with how quickly cells grow and multiply in any well. The fact that the composition and milieu of the media move toward complexity is insurmountable, even at increased cell densities. Accordingly, for analytical purposes, the impedance alteration continues to be a reliable indicator of the proliferation of cells.
Another separate experiment was arranged to count the cell numbers by the Neobauer Lam (hemocytometer) method at the same time as parallel analysis. The obtained results are shown in Table 1. The one-tailed t-test at the 95% confidence level showed that cell counts increased with time.
Table 1.
Cell counting results measured by Neobauer lam
|
Time (h)
|
Cells Count
|
| 5 |
12500 |
25000 |
50000 |
75000 |
100000 |
125000 |
150000 |
175000 |
| 24 |
20500 |
45000 |
81500 |
132400 |
189000 |
248600 |
298700 |
289500 |
| 48 |
32700 |
101000 |
175000 |
265000 |
355000 |
448000 |
501000 |
462000 |
As seen at the bowed end of the curve in the Fig. 6, the mortality of cells can be another origin of impedance diminishing, moreover, conductive chemical production in a higher number of cells.
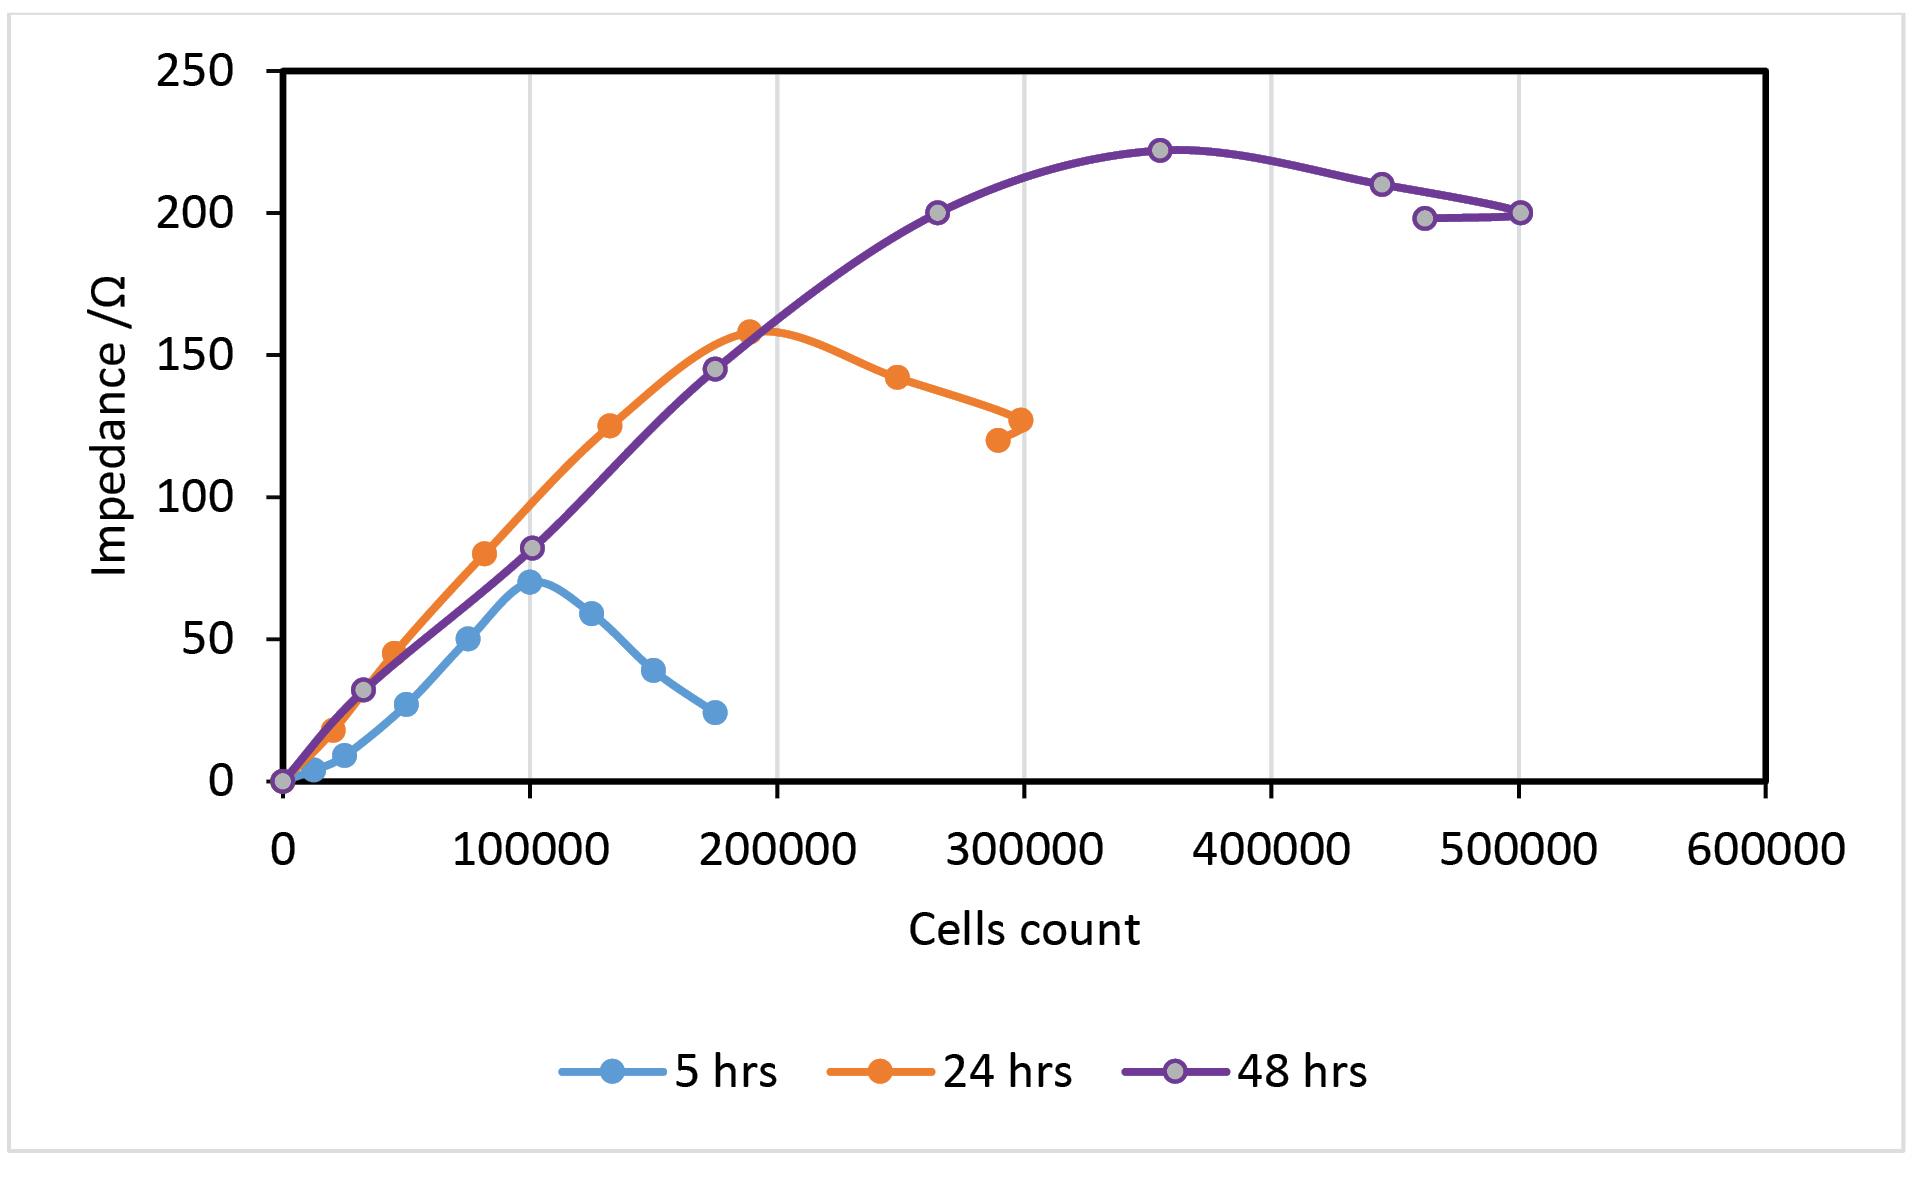
Fig. 6.
Comparative impedance measurements at a 48 hours’ period at frequency range of 100 Hz and amplitude of 5 mV, in PBS.
.
Comparative impedance measurements at a 48 hours’ period at frequency range of 100 Hz and amplitude of 5 mV, in PBS.
The dynamic linear range of every step of measurements showed that the method shows high sensitivity for a low number of cell counts at the initial proliferation procedure and a broader dynamic linear range at extended proliferation times. Both of these facts are favorable for the use of fabricated tools for monitoring and quantifying HUVECs. Fig. 7 shows the linear range of measurements.
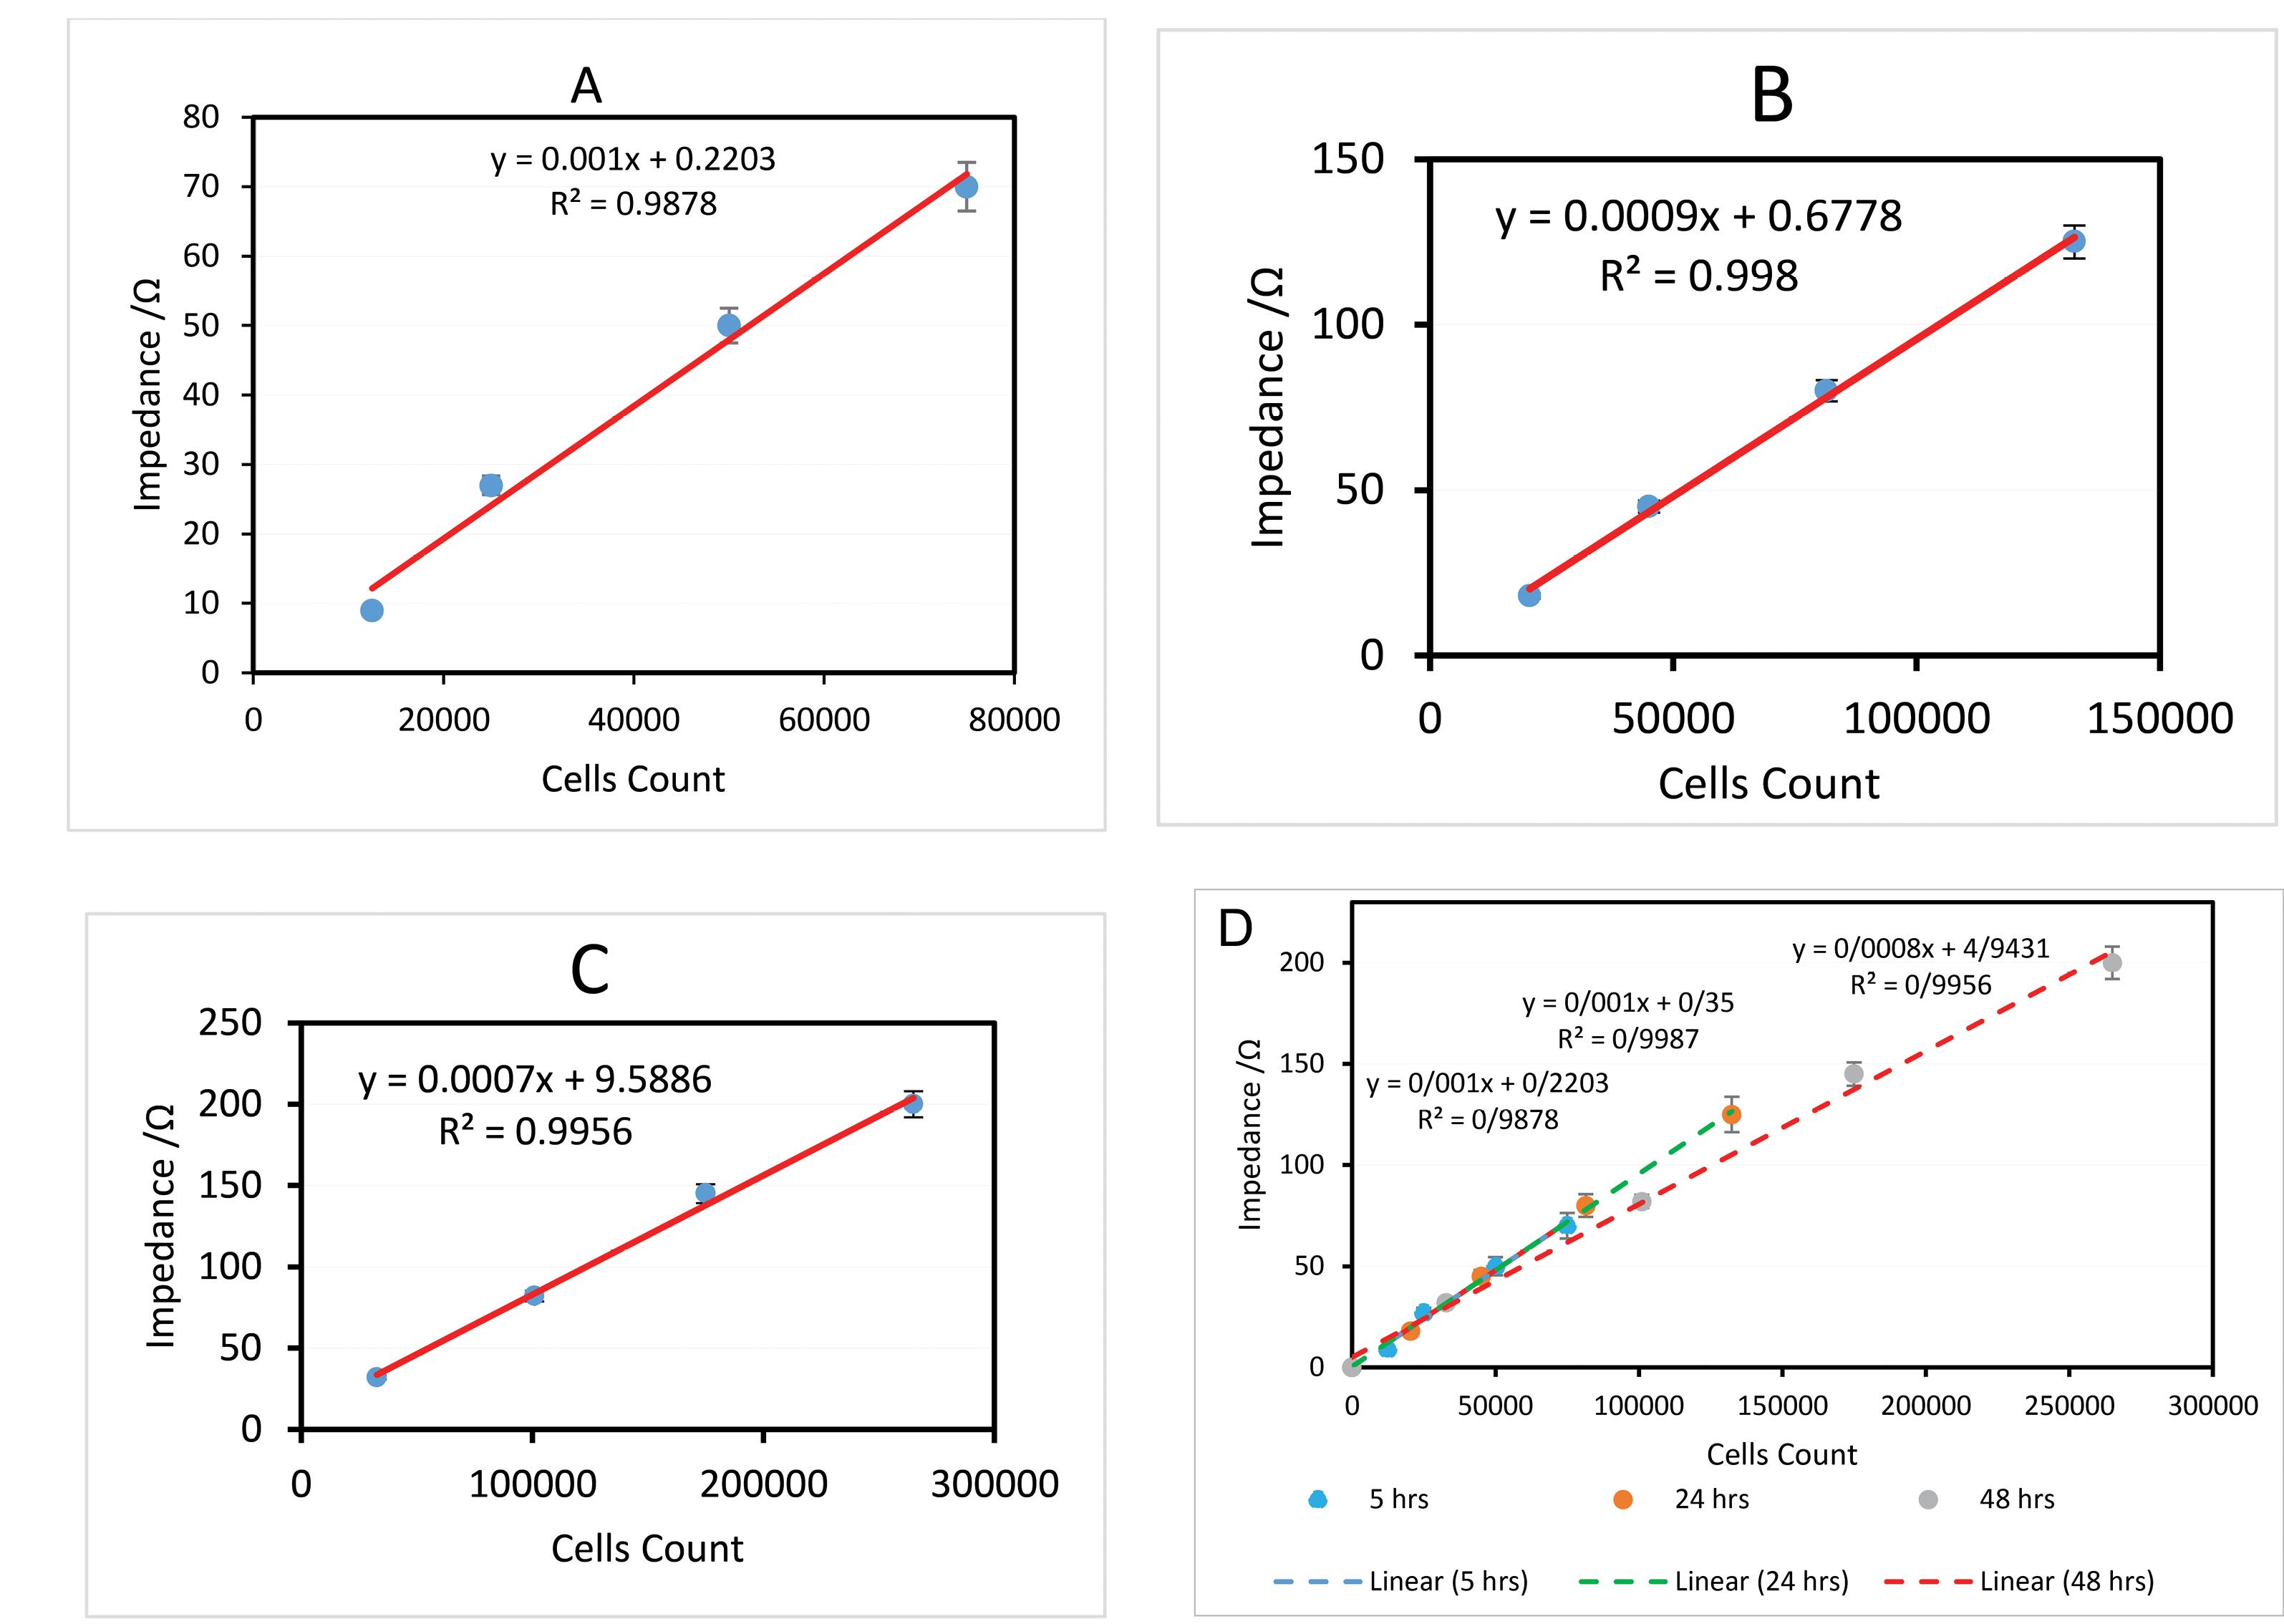
Fig. 7.
Calibration curves based on impedance analysis at 3 steps measurement times, A) Dynamic Linear Range of Impedance 5 hours After Seeding, B) Dynamic linear range of Admittance 24 hours after Seeding, C) HUVECs Impedance changes 48 hours after seeding, D) Overall linear ranges during 3 steps measurements at 48 hours.
.
Calibration curves based on impedance analysis at 3 steps measurement times, A) Dynamic Linear Range of Impedance 5 hours After Seeding, B) Dynamic linear range of Admittance 24 hours after Seeding, C) HUVECs Impedance changes 48 hours after seeding, D) Overall linear ranges during 3 steps measurements at 48 hours.
According to the calculated number of cells by using this method, the cells population changes versus time will be shown in the diagram in Fig. 8. So the proliferation rate of HUVECs would be available by means of the proposed device and technique.
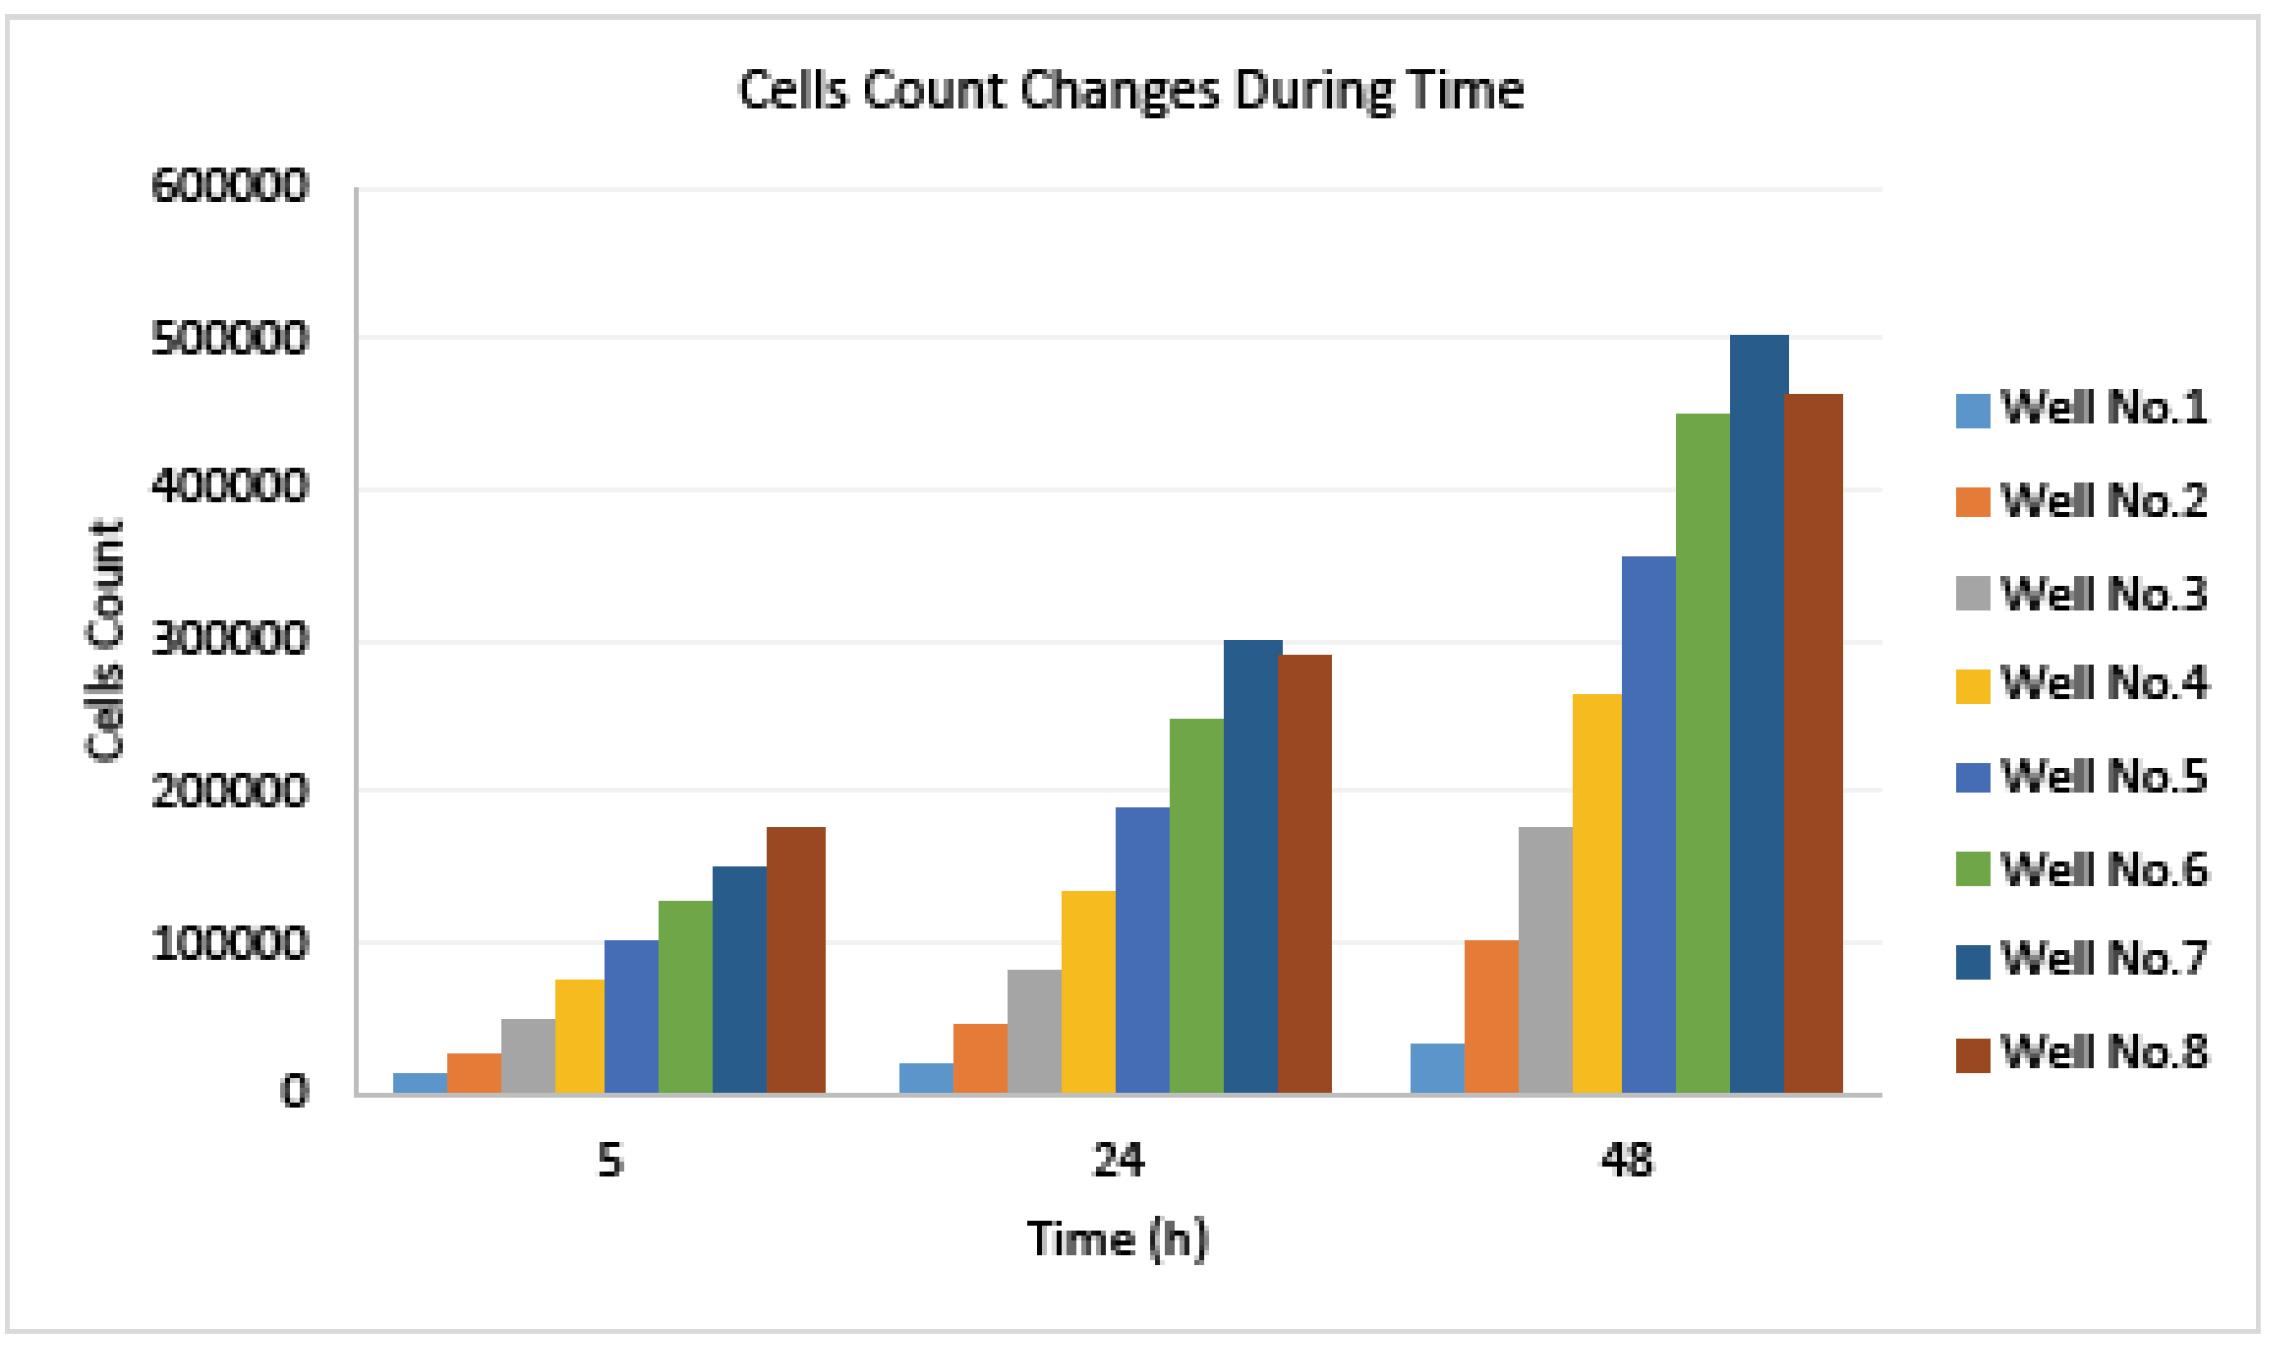
Fig. 8.
The HUVECs population changes during proliferation time in each well of culture plate, at frequency range of 100 Hz and amplitude of 5 mV, in PBS.
.
The HUVECs population changes during proliferation time in each well of culture plate, at frequency range of 100 Hz and amplitude of 5 mV, in PBS.
The accuracy of the proposed method, was evaluated by paired t-test analysis of the results, obtained in 6 independent experiments conducted by impedimetery and hemocytometer chamber as the most reasonable method considering overall accuracy and precision aspects. The comparison of mean values and variances of two methods, showed that the FFT impedimetery technique represents good conformity with hemocytometer cell counting procedure. As seen in Table 2, the calculated value of t for 5 degrees of freedom is smaller than critical value of T. So there is no significant difference between two methods. Meanwhile the amount of P-value is greater than 0.05 that confirms the difference of two methods mean values is not significant. So the proposed method has good conformity with the Neobauer cell counting method.
Table 2.
Representative HUVECs counts, measured by two impedimetery and Neobauer chamber methods, at 24 hours after seeding of a well containing 75000 primary cells
|
HUVECs counts
|
|
Proposed Method (Impedimetery)
|
Reference Method (Neobauer Chamber)
|
| 138000 |
134000 |
| 128000 |
131800 |
| 133500 |
137800 |
| 140400 |
139000 |
| 135500 |
135000 |
| 136800 |
130500 |
Table 2. Representative HUVECs counts, measured by two impedimetery and Neobauer chamber methods, at 24 hours after seeding of a well containing 75000 primary cells.
Conclusion
Here, it is shown that the application of the FFT impedimetric method for cell monitoring is a powerful tool for tracing and measuring the HUVECs population, which provides many advantages over the previously presented methods for other similar cells. Considering that this method is configured with common and traditional standard culture plates, its simplicity of it is advantageous. Regarding the good sensitivity of the method at low cell counts of HUVEC and the vast linear dynamic responsibility range, the proposed method is a competent technique for quantitative and proliferative cell-based properties in real-time in vitro studies. Also, preserving the cells vitality is an important necessity of in vitro studies. The proposed method is low-cost, and in comparison to other quantification methods like flow cytometry and PCR, there is no need for expensive instrumentation and materials. FFTCI provides safe experimental conditions by applying nondestructive electrical signals for noninvasive studies. The comparative paired t-test analysis, showed that the proposed method has good conformity with standard Neobauer cell counting method. The technique can be scaled up for studying other cells and versatile applications like drug screening and stem cell differentiation. The most important disadvantage of this technique is its time dependence on proliferation and non-selectivity in coculture and complex cellular cultivations, including two or more cell lines.
Research Highlights
What is the current knowledge?
√ Immunocytochemistry, immunofluorescence staining protocols, and PCR are commonly used for the determination and characterization of HUVECs.
√ These procedures are reliable, but they also cause damage, cost a lot of money, and require skilled workers that take a lot of time.
√ Current electrochemical methods mostly use indirect data for qualitative characterization of vascular cells and assert their functionality.
What is new here?
√ A new electrochemical method based on fast Fourier transform impedimetric along with phase contrast imaging has been used for quantifying and studying HUVECs in-vitro.
Acknowledgments
The authors wish to thank the financial support from the University of Tabriz, Tabriz, Iran. The authors are thankful to Dr. Somayeh Ebrahimi and the School of Advanced Technologies in Medicine, Tehran University of Medical Sciences, Center of Excellence in Electrochemistry, University of Tehran, and Allen Minasian director of Arka Engineering Services, for their supports.
Competing Interests
The authors declare that they have no competing interests.
Ethical statement
Not applicable.
Funding
Not Applicable.
References
- Cao Y, Gong Y, Liu L, Zhou Y, Fang X, Zhang C. The use of human umbilical vein endothelial cells (HUVECs) as an in vitro model to assess the toxicity of nanoparticles to endothelium: a review. J Appl Toxicol 2017; 37:1359-69. doi: 10.1002/jat.3470 [Crossref] [ Google Scholar]
- Chen G, Zhao L, Feng J, You G, Sun Q, Li P. Validation of reliable reference genes for real-time PCR in human umbilical vein endothelial cells on substrates with different stiffness. PLoS One 2013; 8:e67360. doi: 10.1371/journal.pone.0067360 [Crossref] [ Google Scholar]
- Chen T, Li T, Wang J. p53 mediates PEDF-induced autophagy in human umbilical vein endothelial cells through sestrin2 signaling. Mol Med Rep 2019; 20:1443-50. doi: 10.3892/mmr.2019.10319 [Crossref] [ Google Scholar]
- Claesson-Welsh L, Dejana E, McDonald DM. Permeability of the endothelial barrier: identifying and reconciling controversies. Trends Mol Med 2021; 27:314-31. doi: 10.1016/j.molmed.2020.11.006 [Crossref] [ Google Scholar]
- DeStefano JG, Williams A, Wnorowski A, Yimam N, Searson PC, Wong AD. Real-time quantification of endothelial response to shear stress and vascular modulators. Integr Biol 2017; 9:362-74. doi: 10.1039/c7ib00023e [Crossref] [ Google Scholar]
- Gerasimenko T, Nikulin S, Zakharova G, Poloznikov A, Petrov V, Baranova A, et al. Impedance spectroscopy as a tool for monitoring performance in 3D models of epithelial tissues. Front Bioeng Biotechnol 2020. 7: 474. 10.3389/fbioe.2019.00474.
- Holton M, Mohamed TM, Oceandy D, Wang W, Lamas S, Emerson M. Endothelial nitric oxide synthase activity is inhibited by the plasma membrane calcium ATPase in human endothelial cells. Cardiovasc Res 2010; 87:440-8. doi: 10.1093/cvr/cvq077 [Crossref] [ Google Scholar]
-
Holy CE, Shoichet MS, Davies JE. Engineering three‐dimensional bone tissue in vitro using biodegradable scaffolds: Investigating initial cell‐seeding density and culture period. J Biomed Mater Res 2000; 51: 376-82. 10.1002/1097-4636(20000905)51:3<376::AID-JBM11>3.0.CO;2-G.
- Ino K, Nashimoto Y, Taira N, Azcon JR, Shiku H. Intracellular electrochemical sensing. Electroanalysis 2018; 30:2195-209. doi: 10.1002/elan.201881003 [Crossref] [ Google Scholar]
- Ino K, Pai H-J, Hiramoto K, Utagawa Y, Nashimoto Y, Shiku H. Electrochemical Imaging of Endothelial Permeability Using a Large-Scale Integration-Based Device. ACS Omega 2021; 6:35476-83. doi: 10.1021/acsomega.1c04931 [Crossref] [ Google Scholar]
-
Ishaug SL, Crane GM, Miller MJ, Yasko AW, Yaszemski MJ, Mikos AG. Bone formation by three‐dimensional stromal osteoblast culture in biodegradable polymer scaffolds. J Biomed Mater Res 1997; 36: 17-28. 10.1002/(SICI)1097-4636(199707)36:1<17::AID-JBM3>3.0.CO;2-O
- Ito H, Nashimoto Y, Zhou Y, Takahashi Y, Ino K, Shiku H. Localized gene expression analysis during sprouting angiogenesis in mouse embryoid bodies using a double barrel carbon probe. Anal. Chem 2016; 88:610-3. doi: 10.1021/acs.analchem.5b04338 [Crossref] [ Google Scholar]
- Kabirian F, Amoabediny G, Haghighipour N, Salehi‐Nik N, Zandieh‐Doulabi B. Nitric oxide secretion by endothelial cells in response to fluid shear stress, aspirin, and temperature. J Biomed Mater Res A 2015; 103:1231-7. doi: 10.1002/jbm.a.35233 [Crossref] [ Google Scholar]
- Kempers L, van der Bijl I, van Stalborch A-MD, Ponsioen B, Margadant C. Fast in vitro protocol for the visualization and quantitative high-throughput analysis of sprouting angiogenesis by confocal microscopy. STAR Protocols 2021; 2:100690. doi: 10.1016/j.xpro.2021.100690 [Crossref] [ Google Scholar]
- Kocherova I, Bryja A, Mozdziak P, Angelova Volponi A, Dyszkiewicz-Konwińska M, Piotrowska-Kempisty H. Human umbilical vein endothelial cells (HUVECs) co-culture with osteogenic cells: from molecular communication to engineering prevascularised bone grafts. J Clin Med 2019; 8:1602. doi: 10.3390/jcm8101602 [Crossref] [ Google Scholar]
- Laforge FO, Carpino J, Rotenberg SA, Mirkin MV. Electrochemical attosyringe. Proceedings of the National Academy of Sciences 2007; 104:11895-900. [ Google Scholar]
- Li T, Diao H, Zhao L, Xing Y, Zhang J, Liu N. Identification of suitable reference genes for real-time quantitative PCR analysis of hydrogen peroxide-treated human umbilical vein endothelial cells. BMC Mol Biol 2017; 18:1-8. doi: 10.1186/s12867-017-0086-z [Crossref] [ Google Scholar]
- Utagawa Y, Hiramoto K, Nashimoto Y, Ino K, Shiku H. In vitro electrochemical assays for vascular cells and organs. Electrochemical Science Advances 2021; e2100089. 10.1002/elsa.202100089.
- Liang T, Qiu Y, Gan Y, Sun J, Zhou S, Wan H. Recent developments of high-resolution chemical imaging systems based on light-addressable potentiometric sensors (LAPSs). Sensors 2019; 19:4294. doi: 10.3390/s19194294 [Crossref] [ Google Scholar]
- Liu L, Huang S, Xu M, Gong Y, Li D, Wan C. Isoquercitrin protects HUVECs against high glucose-induced apoptosis through regulating p53 proteasomal degradation. Int. J Mol Med 2021; 48:1-11. doi: 10.3892/ijmm.2021.4955 [Crossref] [ Google Scholar]
- Zhou Y, Wan Y, He M, Li Y, Wu Q, Yao H. Determination of Vascular Endothelial Growth Factor (VEGF) in Cell Culture Medium by Gold-Coated Magnetic Nanoparticle Based Label-Free Electrochemical Impedance Spectroscopy (EIS). Anal Lett 2022; 55:596-608. doi: 10.1080/00032719.2021.1951750 [Crossref] [ Google Scholar]
- Medina-Leyte DJ, Domínguez-Pérez M, Mercado I, Villarreal-Molina MT, Jacobo-Albavera L. Use of human umbilical vein endothelial cells (HUVEC) as a model to study cardiovascular disease: A review. Appl Sci 2020; 10:938. doi: 10.3390/app10030938 [Crossref] [ Google Scholar]
- Norouzi P, Garakani TM, Rashedi H, Zamani H, Ganjali M. Ultrasensitive Flow-Injection Electrochemical Method Using Fast Fourier Transform Square-Wave Voltammetry for Detection of Vitamin B-1. Int J Electrochem Sci 2010; 5:639-52. doi: 10.1016/S1452-3981(23)15312-0 [Crossref] [ Google Scholar]
- Norouzi P, Ghaheri N, Aghazadeh M, Mofidi Z, Larijani B. Sensitive electrochemical measurement of thiamethoxam on nanocomposite coated carbon paste using FFT coulometric admittance voltammetry and flow injection analysis. Int J Electrochem Sci 2017; 12:8847. doi: 10.20964/2017.10.45 [Crossref] [ Google Scholar]
- Norouzi P, Larijani B, Bidhendi ME, Eshraghi M, Ebrahimi M. A sensitive biosensor for acrylamide detection based on polyaniline and au nanoparticles using FFT admittance voltammetry. Anal Bioanal Electrochem 2018; 10:18-32. [ Google Scholar]
- Onat D, Brillon D, Colombo PC, Schmidt AM. Human vascular endothelial cells: a model system for studying vascular inflammation in diabetes and atherosclerosis. Curr Diab Rep 2011; 11:193-202. doi: 10.1007/s11892-011-0182-2 [Crossref] [ Google Scholar]
- Sluyters-Rehbach M, Sluyters J. Electroanalytical Chemistry. New York: Marcel Dekker;1970. p. 4.
- Osaka T, Naoi K. Application of on-line impedance measurement using fast fourier transform to electrochemical systems. Bull Chem Soc Jpn 1982. 55: 36-40. 10.1246/bcsj.55.36.
- Virbickas P, Valiūnienė A, Baryševa D, Popkirov G, Ramanavičius A. Determination of cyanide concentration by chronoamperometry, cyclic voltammetry and fast Fourier transform electrochemical impedance spectroscopy. J Electroanal Chem 2021; 895:115449. doi: 10.1016/j.jelechem.2021.115449 [Crossref] [ Google Scholar]
- Yang WJ, Yang YN, Cao J, Man ZH, Li Y, Xing YQ. Paxillin regulates vascular endothelial growth factor A-induced in vitro angiogenesis of human umbilical vein endothelial cells. Mol Med Rep 2015; 11:1784-92. doi: 10.3892/mmr.2014.2961 [Crossref] [ Google Scholar]
- Holton M, Mohamed TM, Oceandy D, Wang W, Lamas S, Emerson M. Endothelial nitric oxide synthase activity is inhibited by the plasma membrane calcium ATPase in human endothelial cells. Cardiovasc Res 2010; 87:440-8. doi: 10.1093/cvr/cvq077 [Crossref] [ Google Scholar]
- Mullins G, Sunden‐Cullberg J, Johansson AS, Rouhiainen A, Erlandsson‐Harris H, Yang H. Activation of human umbilical vein endothelial cells leads to relocation and release of high‐mobility group box chromosomal protein 1. Scand J Immunol 2004; 60:566-73. doi: 10.1111/j.0300-9475.2004.01518.x [Crossref] [ Google Scholar]