Bioimpacts. 2025;15:30340.
doi: 10.34172/bi.30340
Original Article
An efficient hybrid filter-wrapper method based on improved Harris Hawks optimization for feature selection
Jamshid Pirgazi Conceptualization, Data curation, Formal analysis, Investigation, Methodology, Project administration, Supervision, Validation, Writing – review & editing, , * 
Mohammad Mehdi Pourhashem Kallehbasti Data curation, Formal analysis, Investigation, Project administration, Validation, Visualization, Writing – original draft, Writing – review & editing,
Ali Ghanbari Sorkhi Data curation, Formal analysis, Investigation, Supervision, Visualization, Writing – review & editing,
Ali Kermani Investigation, Methodology, Validation, Visualization, Writing – original draft, Writing – review & editing,
Author information:
Department of Electrical and Computer Engineering, University of Science and Technology of Mazandaran, Behshahr, Iran
Abstract
Introduction:
High-dimensional datasets often contain an abundance of features, many of which are irrelevant to the subject of interest. This issue is compounded by the frequently low number of samples and imbalanced class samples. These factors can negatively impact the performance of classification algorithms, necessitating feature selection before classification. The primary objective of feature selection algorithms is to identify a minimal subset of features that enables accurate classification.
Methods:
In this paper, we propose a two-stage hybrid method for the optimal selection of relevant features. In the first stage, a filter method is employed to assign weights to the features, facilitating the removal of redundant and irrelevant features and reducing the computational cost of classification algorithms. A subset of high-weight features is retained for further processing in the second stage. In this stage, an enhanced Harris Hawks Optimization algorithm and GRASP, augmented with crossover and mutation operators from genetic algorithms, are utilized based on the weights calculated in the first stage to identify the optimal feature set.
Results:
Experimental results demonstrate that the proposed algorithm successfully identifies the optimal subset of features.
Conclusion:
The two-stage hybrid method effectively selects the optimal subset of features, improving the performance of classification algorithms on high-dimensional datasets. This approach addresses the challenges posed by the abundance of features, low number of samples, and imbalanced class samples, demonstrating its potential for application in various fields.
Keywords: Feature selection, High-dimensional data, Harris Hawks optimization, Global search
Copyright and License Information
© 2025 The Author(s).
This work is published by BioImpacts as an open access article distributed under the terms of the Creative Commons Attribution Non-Commercial License (
http://creativecommons.org/licenses/by-nc/4.0/). Non-commercial uses of the work are permitted, provided the original work is properly cited.
Introduction
In recent years, machine learning models have been facing overfitting problems in high-dimensional datasets with a low number of samples. High-dimensional features lead to low accuracy and high model complexity. Among all features, only a few are relevant and important. Using feature selection methods is an approach to address this problem. Feature selection is the process of manually or automatically selecting features that have the highest effects on prediction variables or outputs. The presence of irrelevant features in a dataset drastically reduces the accuracy of the model trained by them. The main objective of feature selection algorithms is to choose a minimal set of features to achieve accurate classification.
Feature selection methods can be broadly categorized into four groups: Filter, Wrapper, Embedded, and Hybrid method. Filter methods employ a set of statistical rules to evaluate the subsets of features.1 As they are not directly involved in the classification process, filter methods exhibit relatively low computational complexity. However, their results may not always be highly accurate, as some selected features may not be well-suited to the classifier algorithm.2 Wrapper methods utilize classifier algorithms to assess the fitness of selected features.1,2 While more effective than filter methods due to their direct integration with a classifier algorithm, wrapper methods exhibit high computational complexity. Embedded methods incorporate a search method within a classifier algorithm to identify the optimal feature subset. These methods offer the advantage of being tailored to a specific classifier model and exhibit lower computational complexity than wrapper methods. Hybrid methods typically combine elements of both filter and wrapper methods and have garnered considerable attention in recent years for their utility in feature reduction and selection.
Masoudi-Sobhanzadeh et al3 introduced a software for feature selection that employs filter methods, optimization algorithms, and three types of classifiers. Their software, entitled Feature Select, utilizes filter, wrapper, and hybrid methods for feature selection. During the classification phase, this software ranks sets of features rather than individual features. In Pirgazi et al study,4 a hybrid method for effective feature selection is proposed, based on Incremental Wrapper Subset Selection with Replacement (IWSSr) and Shuffled Frog Leaping Algorithm (SFLA). This method comprises two sections: filter and wrapper. In the filter section, the Relief method is used to assign weights to features. Subsequently, in the wrapper section, the search for effective features is conducted using SFLA and IWSSr algorithms.
In Taghian and Nadimi-Shahraki study,5 a binary wrapper algorithm, entitled “Wrapper-based Binary Sine Cosine Algorithm” (WBSCA), is proposed for feature selection, based on the Sine Cosine Algorithm (SCA). This algorithm is compared with three binary algorithms on seven datasets from the UCI machine learning repositories. The results demonstrate that this algorithm successfully selects important features. In Li et al study,6 a feature selection method, entitled Weighted K-Nearest Neighbors Genetic Algorithm Feature Selection (WKNNGAFS), is proposed, which calculates the importance of each feature. In this method, a Genetic Algorithm (GA) is employed to search for the optimal weight vector, and Weighted K-Nearest Neighbors (WKNN) is used for classification.
A mechanism for feature selection is proposed in Thejas et al7 that utilizes both filter and wrapper methods. This hybrid method, based on a two-phase process, ranks the features and then selects the best feature subset based on this ranking. The data is clustered using the K-Means algorithm, and the ranking process is conducted using the Normalized Mutual Information (NMI) method. Subsequently, a greedy search method based on Random Forest (RF) is employed to obtain the optimal set of features.
A feature ranking metric, termed as Max-Relevance-Max-Distance (MRMD), is introduced in Zou et alstudy8 that is specifically designed for high-dimensional data sets. Contrary to conventional methods that prioritize classification accuracy exclusively, MRMD strikes a balance between accuracy and stability in the feature ranking process. By amalgamating measures of relevance and redundancy, MRMD adeptly identifies informative features whilst preserving stability. This innovative approach tackles the daunting task of dimensionality reduction, proving particularly beneficial in domains such as bioinformatics and image classification.
An approach is suggested within Analysis of variance (ANOVA) to enhance the predictive accuracy of mitochondrial proteins in the malaria parasite. Initially, protein samples are structured using the g-gap dipeptide composition. Subsequently, ANOVA is employed to identify the optimal subset of features. Finally, SVM is utilized for prediction purposes.9
An Embedded Chaotic Whale Survival Algorithm (ECWSA) is introduced in Guha et al,10 where an embedded version of the Whale Optimization Algorithm (WOA) is used. This algorithm employs a wrapper method for accurate classification and a filter method for further refinement of the selected subset of features with low computational complexity.
In Ramjee and Gamal 11, a computational and efficient feature selection method, based on a wrapper entitled “Autoencoder and Model-Based Elimination of features using Relevance and Redundancy scores” (AMBER), is proposed. Initially, features are ranked using a filter method, and then redundant and irrelevant features are removed using autoencoders.
A hybrid binary method for feature selection based on gray wolf optimization and particle swarm optimization is proposed in Al-Tashi et al.12 This algorithm combines the strengths of both gray wolf optimization and particle swarm optimization.
A hybrid feature selection approach for processing high-dimensional data is introduced in Venkatesh et al.13 This approach, based on mutual information and recursive feature elimination, benefits from both of them. Hybrid methods reduce data dimensionality by first using filter methods, and then using classification methods to choose the optimal feature subset.
To avoid classification model overfitting, a hybrid method is employed in Kamala et al.14 This method benefits from both filter and wrapper methods and finds the optimal feature subset. Improved Hybrid Feature Selection (IHFS) is proposed in this work that produces a learning model. Two filters are considered as the initial step to remove redundant and unimportant features. Chi-square (CHI), FStatistic (FStat), and Mutual Information (MI) are the methods that evaluate the importance of features.
The Gravitational Search algorithm (GSA) is a population-based metaheuristic algorithm. A GSA-based algorithm, with evolutionary crossover and mutation operators, is proposed in.15 The authors used K-Nearest Neighbors (KNN) and Decision Tree (DT) as classifiers. A feature selection method, based on a filter called ReliefF, a wrapper Support Vector Machines backward (SVM-b), and the embedded Random Forest, is proposed in Taradeh et al.16 Initially, features are ranked using the ReliefF method, and then data are classified using the two classifiers.
A hybrid method, based on gray wolf optimization and crow search algorithm, is proposed in Arora et al17 to strengthen local search. This method combines the strengths of both algorithms to achieve global optima. Zheng et al18 claimed that feature selection and removing redundant features increase classification accuracy and play an important role in data mining and pattern recognition. They proposed a feature selection algorithm entitled “Maximum Pearson Maximum Distance Improved Whale Optimization Algorithm” (MPMDIWOA). First, they proposed a filter algorithm based on Pearson’s correlation coefficient and correlation distance. The modified whale optimization algorithm is then used to select features.
A two-step feature selection approach is proposed in Amini et al,19 based on a wrapper and an embedded method in constructing the optimal feature subset. In the first step, GA is used to search for the optimal subset to reduce the number of features and prediction errors. However, GA does not guarantee the global optimum. To address this problem, the second step, based on Elastic Net (EN), is added to remove redundant and irrelevant features.
A two-step feature selection strategy is introduced in Dao et al20 to eliminate redundant and noisy data in the identification of the origin of replication in Saccharomyces cerevisiae. Initially, feature weights are computed using the F-score technique. Subsequently, the Minimum Redundancy Maximum Relevance (MRMR) technique is applied to enhance the correlation between features and class labels while reducing the correlation between features themselves.
In El-Kenawy and Eid study,21 a hybrid method based on gray wolf optimization and Particle Swarm Optimization (PSO) is proposed. In this method, the KNN classifier is used for evaluating selected features. Additionally, gray wolf optimization is used to search a larger space, and PSO is used to increase population diversity and maximize production efficiency.
A hybrid method based on PSO with a spiral-shaped mechanism for feature selection is proposed in Chen et al.22 This method makes three improvements: First, it benefits from a logistic map sequence to enhance the search process. Second, the position quality of the next generation is highly improved due to two new parameters. Third, a local search operator based on a spiral-shaped mechanism is used. In Georges et al study,23 a framework entitled “FS-Select” is proposed that explores the relationships among different FS methods. Different FS methods are evaluated according to three criteria: feature reproducibility power, average accuracy, and feature stability.
In Abdel-Basset et al study,24 the authors used Harris Hawks Optimization (HHO) and Simulated Annealing (SA) algorithms for feature selection. A method based on HHO, SA, and chaotic maps is used in Elgamal et al.25 This method employs chaotic maps to better detect hawk positions. They suggested two improvements to the standard HHO algorithm: applying the chaotic maps to enhance population diversity in the search space and using the SA algorithm to find the best solution. The particles are then evolved using HHA and SA.
In Bermejo et al study,26 a hybrid method based on a metaheuristic and filter method is presented to speed up feature selection and improve its accuracy. This paper also investigates Grasp-based methods and compares them with one another. Various classifier models based on filter methods, HHO, and GA are used in this paper to efficiently select features and improve the detection rate. To this end, important and efficient features are first detected using F-Score. This helps reduce computational complexity and the search space for selecting the optimal feature set.
The ability to search the entire search space is reduced due to the nature of the HHO algorithm and a small population. To address this issue, crossover and mutation operators from GA are used to improve exploration and exploitation in this algorithm. The proposed algorithm is not trapped in the local optimum and selects the optimal feature subset owing to combining these two operators with HHO.
The rest of this paper is organized as follows: Section 2 explains the HHO algorithm; Section 3 elaborates on the proposed algorithm; Section 4 examines the proposed algorithm from different perspectives and presents experimental results on different datasets; Finally, Section 5 concludes the paper.
Harris Hawks Optimization Algorithm
HHO is a population-based algorithm. In this approach, multiple hawks collaboratively attempt to surprise and attack their prey from various angles. The algorithm operates in three distinct phases: exploration, transition, and exploitation.
Exploration phase
In each iteration of HHO, multiple solutions are generated, and the best one is considered as the prey in the vicinity of the optimal point. Harris hawks employ two strategies randomly. They may opt to perch at a vantage point, awaiting the sighting of their prey. If we define q as the probability of a hawk choosing to perch in each strategy, the hawks’ positioning is determined by the location of the prey and the positions of other family members, given they are within sufficient proximity to the prey, as illustrated in Eq. 1.
(1)
In Eq. 1, X(t + 1) denotes the position vector of the hawks at iteration t + 1, while Xprey (t) signifies the position of the prey. The term X(t) represents the current position vector of the hawks. The variables r1, r2, r3, r4, and q are random numbers within the interval (0, 1), all of which are updated at each iteration. The parameters LB and UB correspond to the lower and upper bounds of the variables, respectively. Xrand(t) is a hawk that is randomly selected from the current population. Lastly, Xm symbolizes the average position of the hawks in the current population, computed as per Eq. 2.
Transition phase
The HHO algorithm transitions from the exploration phase to the exploitation phase, adopting various exploitation behaviors contingent on the escaping energy of the prey. The energy of the prey undergoes significant depletion during the escape process. The energy of the prey is modeled as follows.
In Eq. 3, E denotes the escaping energy of the prey, T is the maximum number of iterations, E0 is the initial energy, and t is the iteration number at which the energy is calculated. As previously stated, the escaping energy exhibits a decreasing trend over time. When |E| ≥ 1, hawks explore different regions in search of the prey. Conversely, when |E| < 1, the algorithm attempts to detect the solution neighborhood. The exploration phase commences when |E| ≥ 1, and the exploitation phase is initiated when |E| < 1.
Exploitation phase
In this phase, four strategies are conceptualized for the hawk’s attack, predicated on the prey’s escaping behavior and the hawks’ chasing strategies. Let us denote r as the probability of a successful escape by the prey. Hawks perform either a soft or hard besiege, irrespective of the prey’s reaction.27
Soft besiege
When r ≥ 0.5, the prey retains sufficient energy and attempts to deceive the hawks by performing random jumps. Concurrently, as the prey exhibits this behavior, hawks implement a soft besiege to further deplete the prey’s energy, followed by a surprise attack. The subsequent Eqs. model this behavior.
In Eqs. 4 and 5, ∆X(t) signifies the positional difference between the prey and the current position at iteration t. J = 2(1 - r5) symbolizes the random jumping strength of the prey during the escape process, where r5 is a random value within the interval (0, 1). The value of J undergoes random changes in each iteration to emulate the natural movement of the prey.
Hard besiege
When r ≥ 0.5 and |E| < 0.5, the prey is tired and has a low energy for escaping. Therefore, hawks surround the prey to perform a surprise pounce. Hawks’ positions are updated as follows.
Soft besiege with progressive rapid dives
When |E| ≥ 0.5 and r < 0.5, the prey has enough energy to escape and soft besiege is still used before a surprise pounce. In this stage, it is supposed that hawks can identify their next movement using Eq. 7 to perform a soft besiege.
The results of each dive are compared with those of the preceding one to ascertain the efficiency of the subsequent dive. If the forthcoming move is deemed unwise, as in instances where the prey exhibits a higher frequency of deceptive maneuvers, hawks respond by executing rapid and erratic dives, as delineated in the following.
In Eq. 8, the variable D represents the dimension of the problem under consideration, while S denotes a random vector of size 1 × D. The Levy flight function (LF) is defined as follows in Eq. 9.
(9)
Here, u and v are random numbers within the interval (0, 1), and β is a constant set to 1.5. The final strategy for updating the positions of the hawks during the soft besiege phase is given by Eq. (10).
(10)
The variables Y and Z are calculated using Eqs. 7 and 8, respectively.
Hard besiege with progressive rapid dives
When |E| < 0.5 and r < 0.5, the prey lacks sufficient energy to evade capture. Under these circumstances, a hard besiege is executed before a surprise pounce. This scenario mirrors that of the soft besiege, but in this case, the hawks strive to minimize the average distance to the prey. The position vector of the hawks is updated using Eq. 11.
(11)
Z′ and Y ′ are calculated as follows.
(12)
Xm(t) is calculated using Eq. 2. S is a random value in the interval (0, 1). HHO is illustrated in Algorithm S1 (see Supplementary file 1).27
Proposed algorithm
In the realm of feature selection, numerous methodologies have been put forth. However, these methods often grapple with a multitude of limitations, including low accuracy, high computational complexity, and a lack of applicability in scenarios where the sample size is insufficient or the class samples are imbalanced. In this paper, we introduce a hybrid approach tailored for feature selection in high-dimensional datasets. Our proposed method incorporates the F-score criterion during the filter stage to allocate weights to the features. Following this, in the wrapper stage, we employ the Harris Hawks and Grasp algorithms, which are predicated on the Random Forest, to search for the optimal subset of features. The process of selecting the feature subset using our proposed algorithm is depicted in Fig. 1.
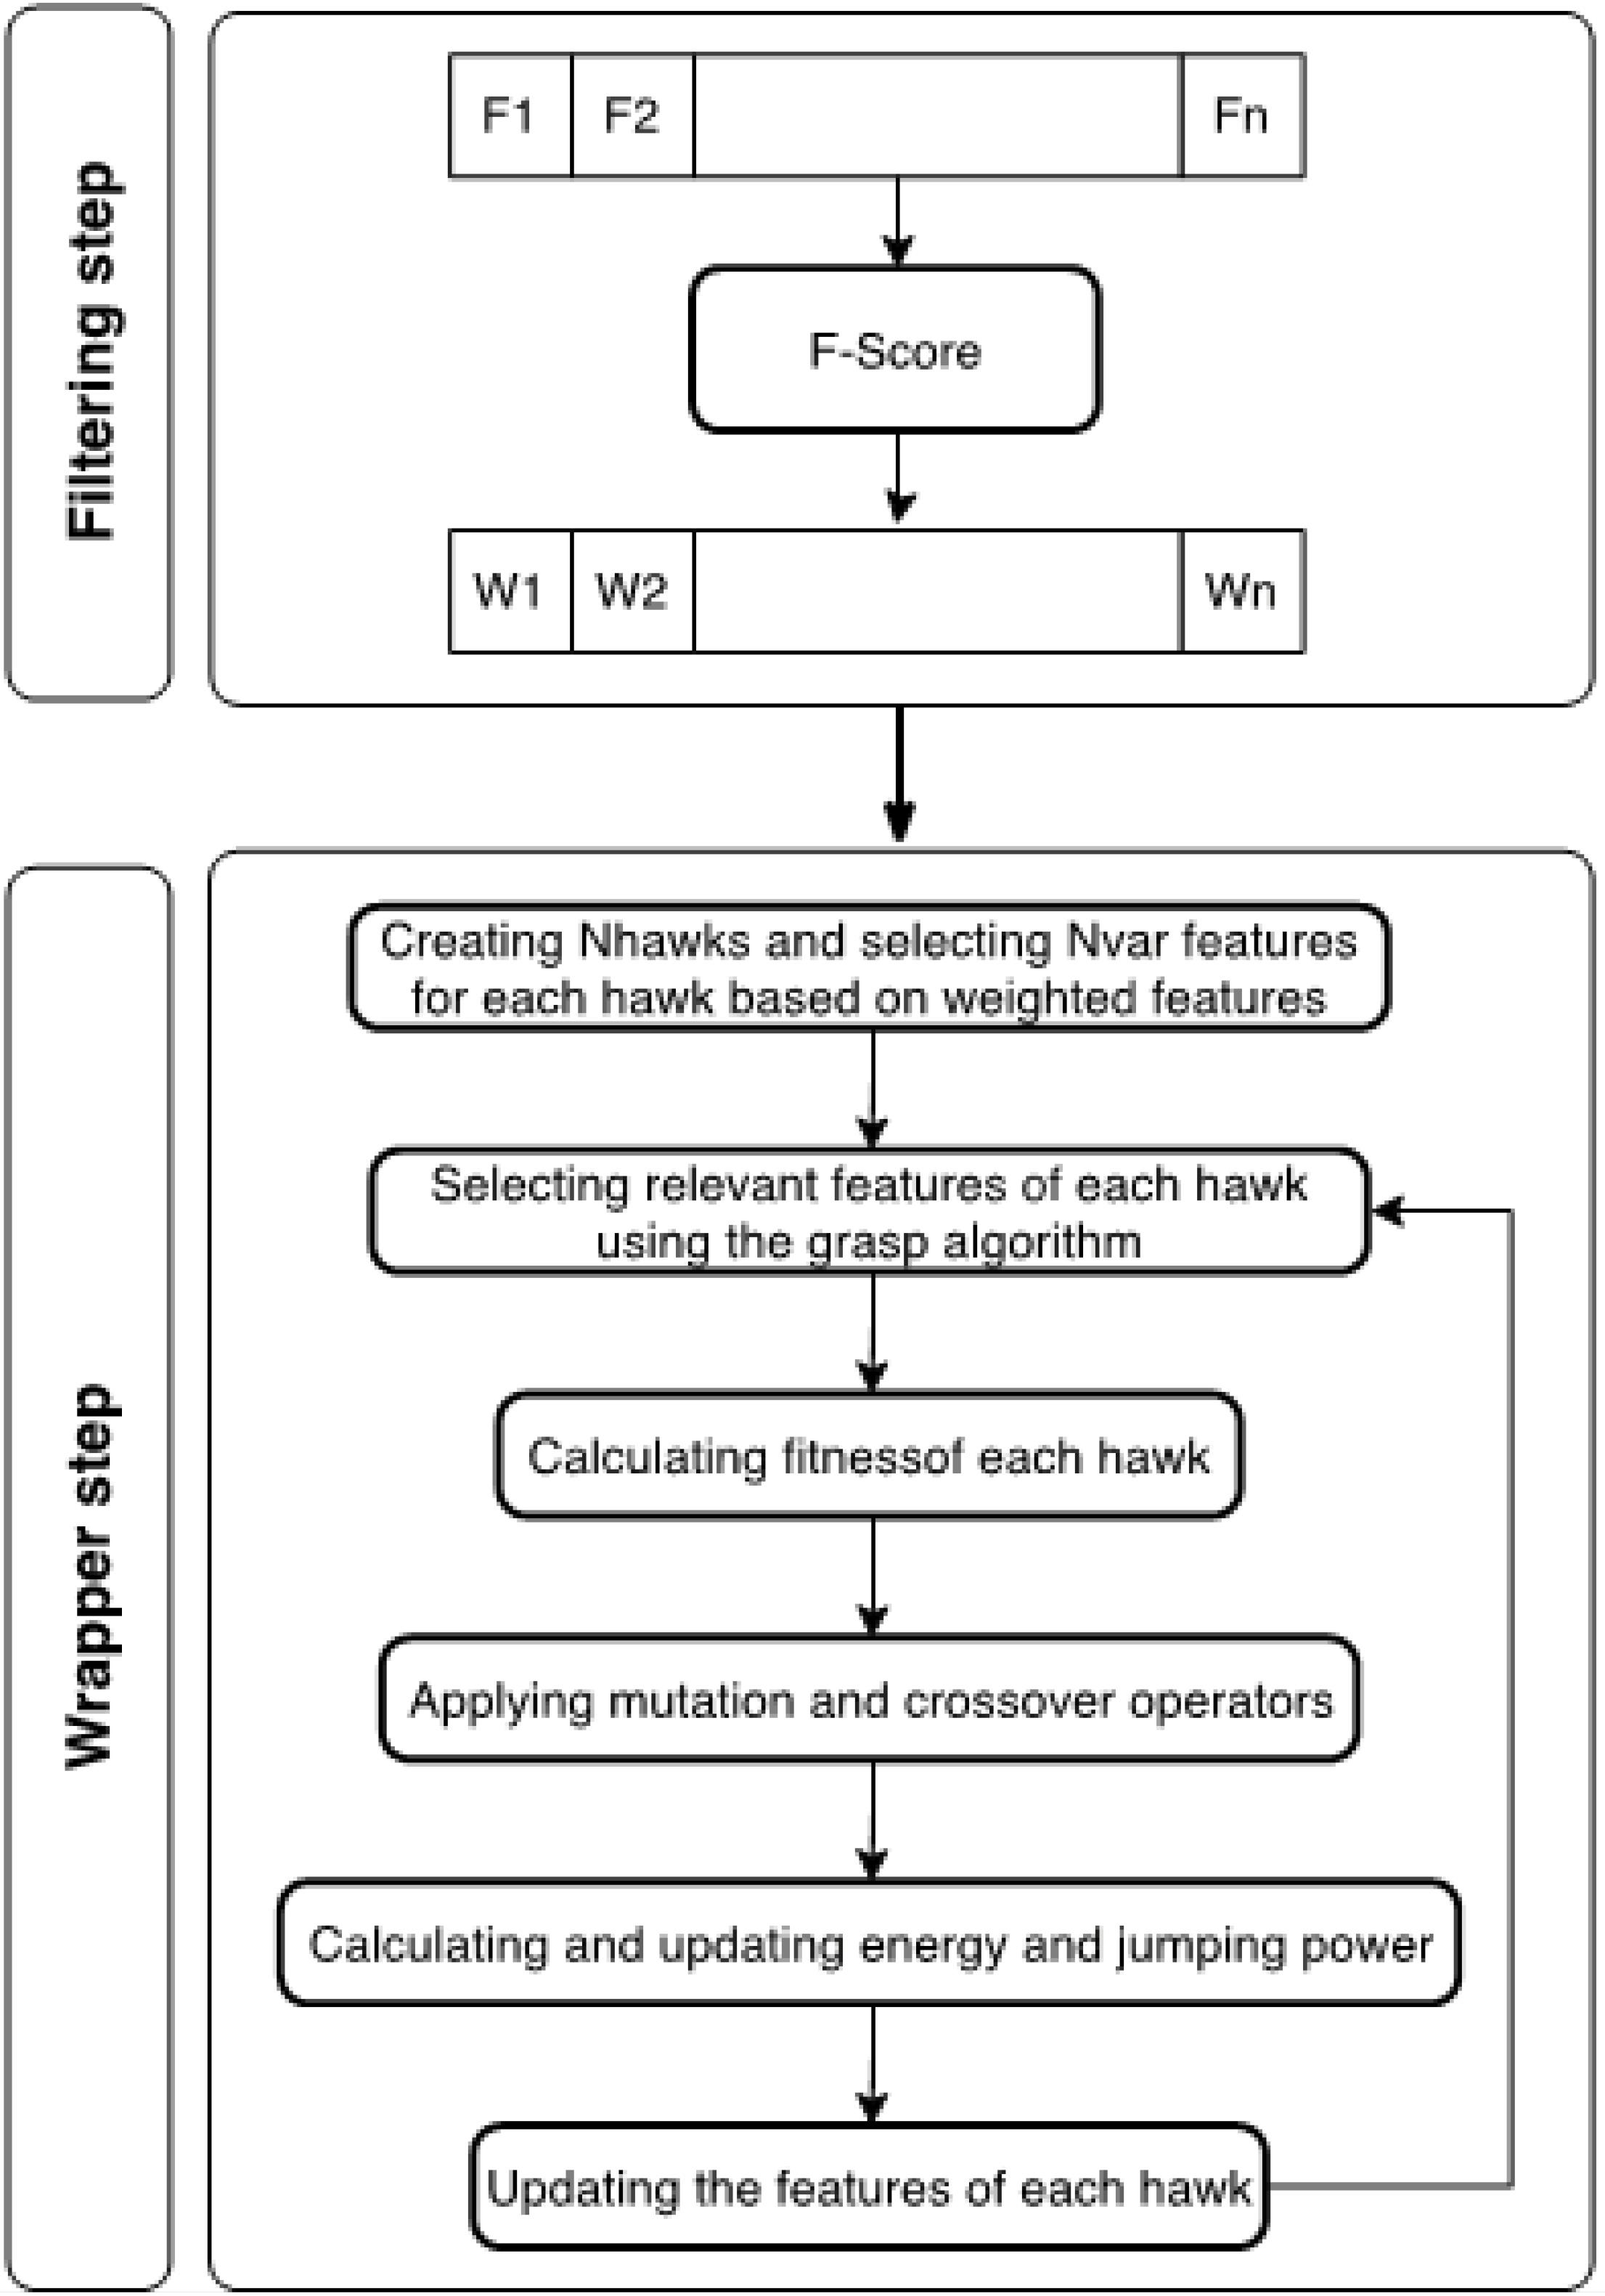
Fig. 1.
The two steps of selecting a subset of features in the proposed algorithm.
.
The two steps of selecting a subset of features in the proposed algorithm.
Filtering stage
In this study, as previously stated, a filter method is employed to assign weights to features. The rationale behind utilizing a filter method is to eliminate redundant and unrelated features. The presence of such features in a dataset can lead to a decrease in classification accuracy, an increase in execution time, and potential overfitting in machine learning models, particularly when the number of samples is limited. Furthermore, the removal of these features allows for the selection of appropriate features via filter methods, thereby enhancing the convergence speed and accuracy of the model. By assigning higher weights to relevant and significant features, the accuracy rate of the classification model is increased. In this paper, the F- Score method, as outlined in Eq. 14, is used to assign weights to features.
(14)
x̄i represents the average of the ith feature. The average of the ith feature for negative samples is represented by x̄i -, and the value of the ith feature of the kth sample is denoted by xk,i(-). Similarly, x̄i+ and xk,i(+) represent the average of the ith feature and the value of the ith feature of the kth sample, for positive samples respectively. n + and n− are the number of positive and negative samples, respectively. Upon assigning the weights, several features that possess a higher F-Score weight are selected based on the number of features in the dataset, while the remaining features are discarded.
Wrapper stage
In the wrapper stage, Harris Hawk and Grasp algorithm based on Random Forest, are employed to identify effective feature subsets. The HHO serves as the principal algorithm in this procedure. During the implementation of the HHO algorithm, the Grasp algorithm is invoked for feature selection and the elimination of redundant features. The ensuing stages of the wrapper phase are elaborated below.
Particle Initialization: In the process of generating each particle (hawk), a distinct set of weighted, random features is derived from the features preserved during the filtering phase. Specifically, in every iteration, m particles are produced, and for each particle, d features are randomly chosen based on their corresponding weights. In the proposed methodology, due to the weighted random selection procedure, features with higher weights have an increased probability of being selected, while those with lower weights have a diminished chance of selection. Consequently, each particle consists of a subset of features randomly selected from the original dataset’s feature set.
The quantity of features is dictated by the size of the dataset’s features.
Following the selection of each particle’s features, the Grasp algorithm is utilized to remove redundant features from each hawk. Upon the execution of this algorithm, the fitness of each particle is calculated. The fitness of each particle is determined using the available features, bearing in mind that the feature removal operation was performed based on the Grasp. Consequently, the accuracy of the Random Forest is regarded as the fitness measure for each particle.
During the construction phase of the Grasp algorithm, the Random Forest algorithm is used to eliminate redundant features associated with each particle. Subsequently, a classifier is trained based on each particle, and the particle exhibiting the highest accuracy is selected as the best particle for the current iteration and proceeds to the local search phase. In the local search phase, the best particle obtained in this iteration is merged with the particle selected from the previous stage (initially, the selected particle is devoid of any features). The redundant features of the merged particle are independently removed using Random Forest methods, and the classifier is trained with the remaining features. At this stage, the Random Forest classifier assigns importance scores and weights to the features, with low-weight features being considered as redundant and subsequently removed. If the accuracy of the classifier generated with the merged particle exceeds that of the selected particle, then the merged particle replaces the selected particle. This process is repeated until all iterations are completed, and ultimately, the best-selected particle is introduced as the final particle.
Evaluation criterion: A pivotal element in any feature selection algorithm is the evaluation criterion that plays an important role in effectively selecting relevant features. There have been many attempts to evaluate selected features. In this paper, the accuracy criterion is used for evaluating each particle. Several classifiers are used in each generation in order to evaluate the accuracy of each particle. SVM, KNN, DT, RF, and Naive Bayes (NB) are the classifiers used in this paper according to the essence of the feature selection problem. The criteria used in all classifiers are accuracy, sensitivity, specificity, and balance rate.
The accuracy criterion is used for particle evaluation and is calculated as shown in Eq. 15.
(15)
Termination condition: The algorithm’s termination is contingent upon several conditions. One such condition is the number of iterations, which is user-determined. In this paper, the optimal number of iterations is set to 200 or 500 with respect to the given dataset that is obtained based on experimental results. Another condition that precipitates the termination of the algorithm is the stability of the average particle detection rate over several generations. Given the high number of parameters inherent to the Harris Hawks algorithm, it necessitates a correspondingly high number of iterations. This aspect is further elaborated upon in the results section. The implementation of an extensive number of iterations guarantees the robust establishment of these parameters’ optimal values, thereby augmenting the efficacy of the proposed methodology.
Applying Harris Hawks Optimization Algorithm: As introduced in Section. This algorithm has three phases: exploration, transition, and exploitation. Within each phase, hawks attempt to besiege the prey, which is represented by the best particle within each generation. This attack is based on simulated mathematical models, with the fitness function guiding the hawks’ actions. The specific phase that the algorithm enters is determined by the energy level of the prey at the commencement of each iteration.
During each phase of the HHO algorithm, a set of random values is initially generated. These include the probability of a hawk successfully taking down its prey, the likelihood of the prey escaping, the remaining energy of the prey, and the prey’s jumping power.
It is important to note that the energy level of the prey, its chances of escape, and its jumping power are all dependent on the number of iterations. As the algorithm progresses through its iterations, these values decrease accordingly.
In the context of the algorithm’s execution, the phase it enters dictates the update of all particle features. Following each particle’s update, redundant features are removed via the Grasp method, and the fitness function is subsequently recalculated. Moreover, during phases where a new feature is generated based on a predefined formula, if the feature value exceeds the specified range or is repetitive, it is replaced by a new feature selected from the highest F-scores. The objective of this methodology is to optimize the search throughout the entirety of the problem space.
At the end of this phase, should an updated hawk exhibit a fitness value superior to that of the prey, it will supplant the prey. Consequently, hawks of the ensuing generations will endeavor to besiege this newly established prey. The accuracy value of each hawk is calculated based on various classification methods. Given that the classification of test and training data varies with each execution, the accuracy of each hawk is calculated five times. The average value is then considered in order to achieve a precise evaluation criterion for each classifier. This approach ensures a robust and accurate assessment of the algorithm’s performance.
To enhance the explorability of the proposed algorithm and to more effectively search the feature space, a pair of superior hawks are selected as parents via the application of crossover and mutation operators. Subsequently, two offspring are generated and replace the two least effective members of the previous generation at the end of each generation. If a redundant feature is produced during the crossover or mutation operation, a random value from the highest F-Score is utilized instead of this feature. This process preserves randomness and helps to search more comprehensively in the problem space. The proposed algorithm is delineated in Algorithm S2 (Supplementary file 1).
Experimental evaluation
This section presents an in-depth examination of the algorithm proposed, ensuring its robustness and applicability. It encompasses an introduction to the datasets employed, the criteria for evaluation, the initialization of parameters, the influence of these parameters on efficiency, and a comparative analysis of classifier accuracy. This meticulous analysis serves to validate the effectiveness and practicality of our research findings.
Datasets
The algorithm proposed herein has been subjected to rigorous testing across multiple datasets. Detailed descriptions of these datasets are as follows.
Colon Dataset: This dataset encompasses 2000 genes across 62 samples, with 40 samples indicative of colon cancer and the remaining 22 deemed normal.
Arcene and Prostate1 Datasets: These datasets comprise 100 and 88 data points, respectively. Each class within these datasets has a high feature count of 10,000 and 12,625, respectively, which is substantial given the limited number of samples.
Diffuse Large B-cell Lymphoma (DLBCL) Dataset: This dataset includes 5469 genes and 77 lymphoma tissue samples. Of these samples, 58 are classified as large cell B, with the remaining 19 identified as Follicular lymphoma.
Lung Dataset: This dataset contains 181 samples, each with 12533 features. It should be noted that there is an imbalance in the number of samples between class 1 and class 2 in this dataset.
Dorothea Dataset: This dataset is composed of 800 samples, each with a dimensionality of 10000. An imbalance is observed in the number of samples across the two classes.
Prostate Dataset: This dataset, with a feature count of 12600, includes 77 entries in class 1 and 59 entries in class 2.
Central Nervous System (CNS) Dataset: This dataset comprises 7129 genes and 60 samples. Among these samples, 21 are benign and 39 are malignant.
Leukemia Dataset: This dataset, containing 7129 genes and 72 samples, categorizes blood cancer diseases into two sets: Acute Lymphoblastic Leukaemia (ALL) and Acute Myeloid Leukaemia (AML). The dataset includes 47 ALL and 25 AML samples.
Breast Dataset: This dataset, with a high feature count of 24481, is noteworthy due to the small number of samples.
Evaluation criteria
Different criteria are used to evaluate the proposed algorithm. It should be noted that each criterion demonstrates the strength of the proposed algorithm from a specific point of view.
(16)
(19)
In the application of feature selection methods, it is imperative to ensure that there is no overlap between the training and test data. Cross-validation (CV) has been identified as an effective technique for partitioning data, which aids in the evaluation of feature selection and classification methodologies. This strategy assesses the effectiveness of the proposed methods based on multiple categories derived from the original dataset.
Initially, the entire dataset is partitioned into k subsets in a random manner for the purpose of training and testing. Throughout k iterations, k-1 subsets are employed for model training, while one subset is set aside for testing. In each iteration, the features and parameters required for testing the model are obtained from the training phase, utilizing samples from the training subsets. The overall effectiveness of the proposed method is then determined based on the outcomes from the k iterations of the training and testing phases.
In this study, we employ the CV method to train and subsequently test classifiers using selected features. The aim is to determine the recognition percentage of test data, with k set to 10. Given that the 10-fold CV method involves the random partitioning of samples into 10 categories, the results can vary depending on the grouping of samples. To mitigate this variability, the samples are randomly divided into 10 groups in an iterative manner, repeating the process 10 times. This approach ensures a more robust evaluation by reducing the influence of the initial grouping on the results.
The final count of features is determined by the average number of selected features, while other criteria are established by averaging the metrics within the selected subset after executing the proposed method 10 times. The performance metrics of the proposed method are also derived from the average of 10-fold CV repetitions.
Initialization of hyperparameters in the proposed algorithm
To enhance the efficiency of the proposed algorithm, it is essential to optimize various parameters. The algorithm’s performance is directly contingent on the value of each hyperparameter, necessitating their optimal configuration. These hyperparameters have been selected after conducting numerous tests and remain consistent across all datasets. The Random Search method is employed to ascertain the optimal values for these hyperparameters. This process involves selecting a set of hyperparameters, constructing a model using the training data, and subsequently evaluating its performance on the evaluation data. This iterative process is repeated with different sets of hyperparameters until the optimal configuration is identified. The initial values of the hyperparameters for the proposed method are as follows:
The number of hawks in each generation: 10
The number of features of each hawk: 5-40
The number of features produced from datasets with respect to the F-Score algorithm: 300
The number of hawks produced using crossover and mutation operations: 2
Impact of hyperparameters on the efficiency of the proposed algorithm
Considering the inherent characteristics of HHO, the number of iterations and the population of hawks exert substantial influence on the performance of the proposed method. This section is dedicated to examining the effects of these parameters on the implementation of the proposed method.
The first step focuses on the influence of the iteration count on the efficacy of the proposed algorithm. To investigate this, the algorithm is applied to four distinct datasets, each with a varying number of iterations. The results, depicted in Fig. 2, are derived from the execution of the algorithm across a range of iterations on these datasets.
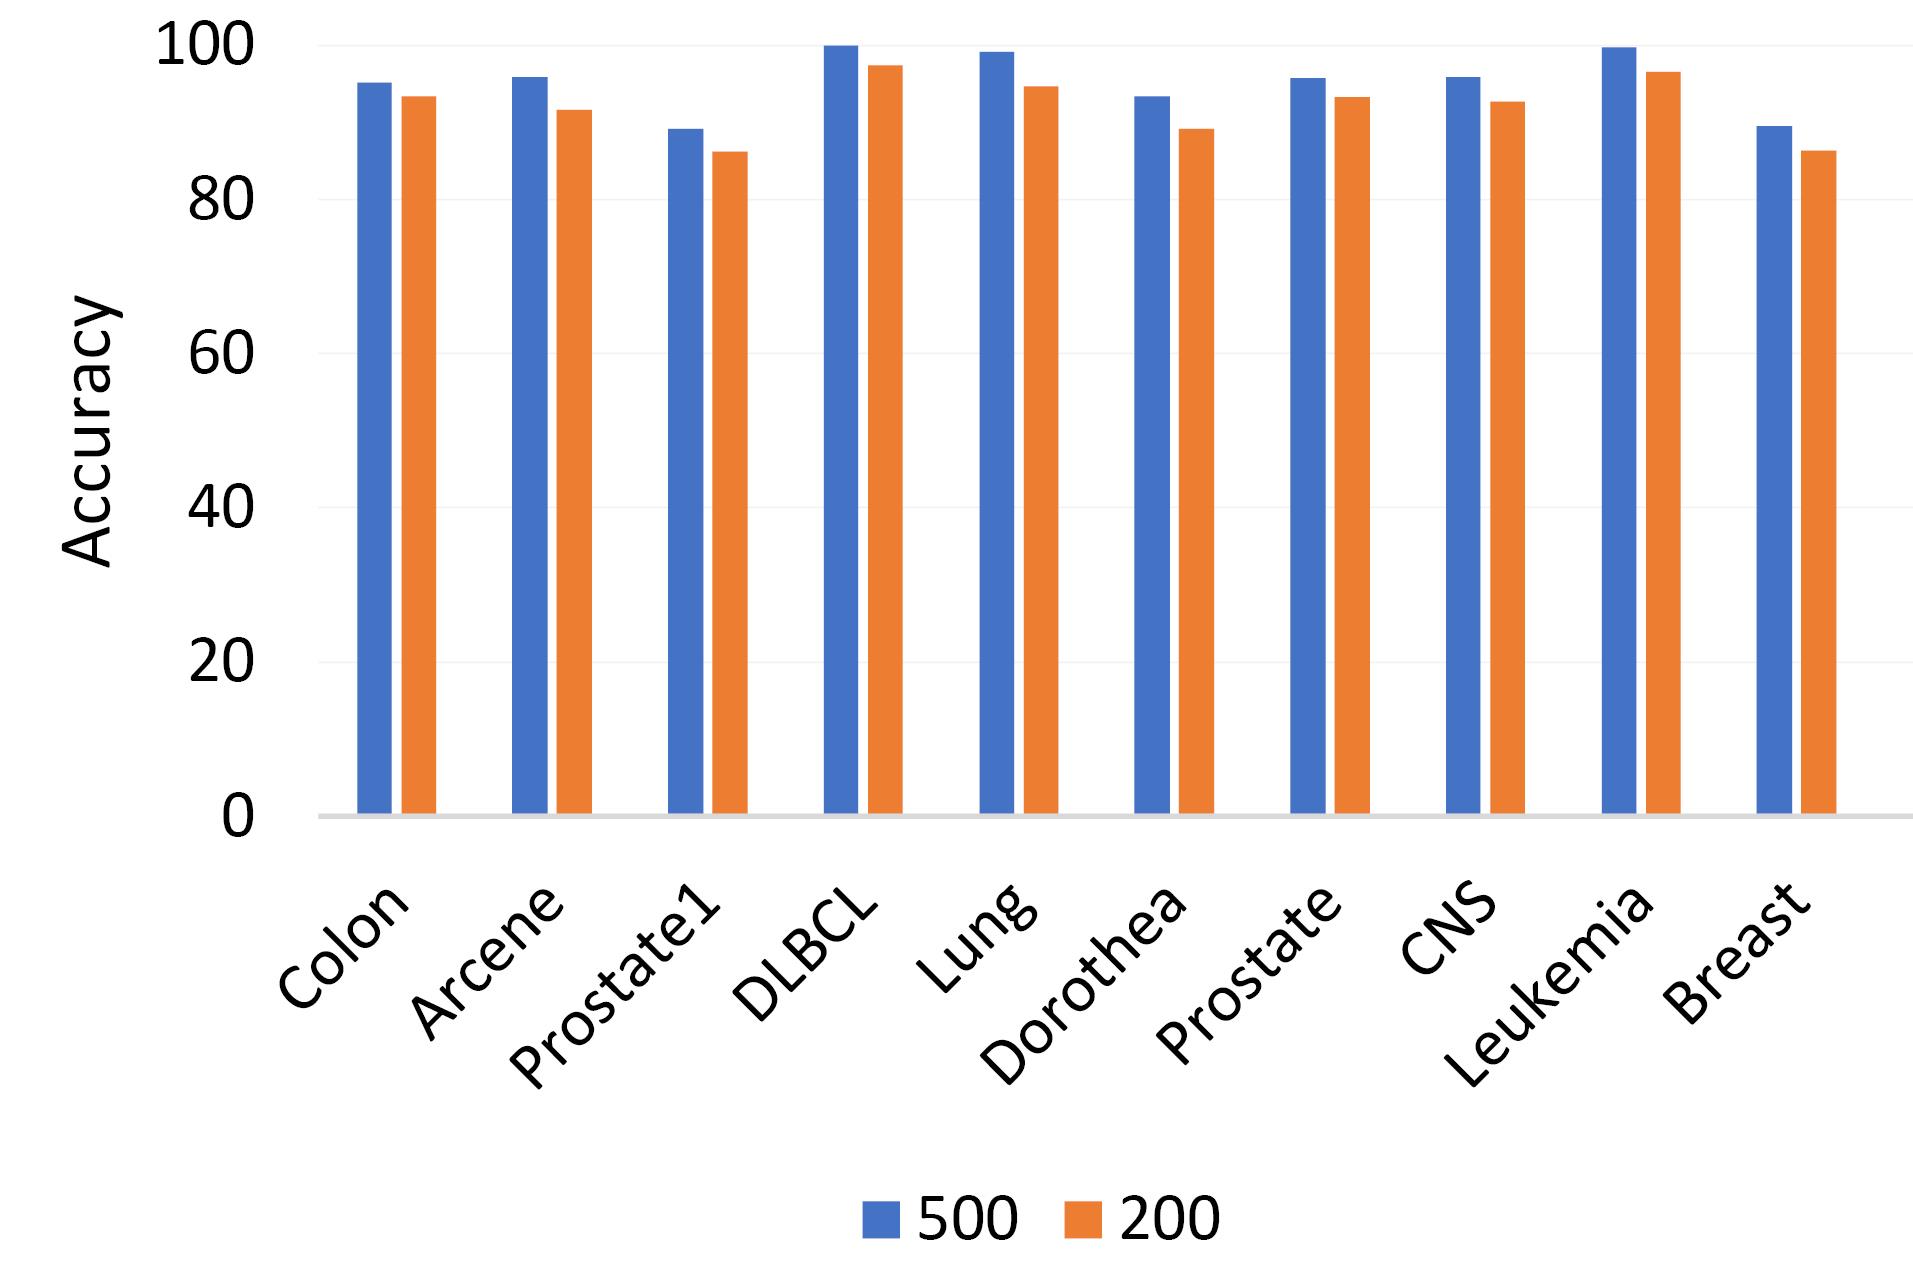
Fig. 2.
Comparison of highest accuracy based on the number of iterations.
.
Comparison of highest accuracy based on the number of iterations.
Given the inherent tendency of the HHO algorithm to randomly select a large parameter set during its initial phase, it is recommended to consider a high number of iterations for more effective parameter learning and optimization. As evidenced by the results, optimal performance is achieved when the iteration count is set to either 200 or 500. This high iteration requirement aligns with the nature of the HHO algorithm, which necessitates numerous iterations to reach convergence.
It is important to note that the results presented in this section pertain to the Random Forest classifier, which emerged as the superior classifier based on the experimental evaluation of the proposed algorithm.
In the next step, the proposed algorithm is evaluated with respect to the number of particles. As depicted in Fig. 3, the algorithm exhibits optimal performance when the particle count is either 7 or 10. Given the cooperative nature of hawks during prey besiegement, it is advantageous to maintain a minimal hawk population. Contrary to other evolutionary methods, the experimental results demonstrate that the proposed algorithm enhances performance with a reduced particle count. It is noteworthy that when the particle count escalates to 40 or beyond, there is a significant decline in both execution speed and peak accuracy.
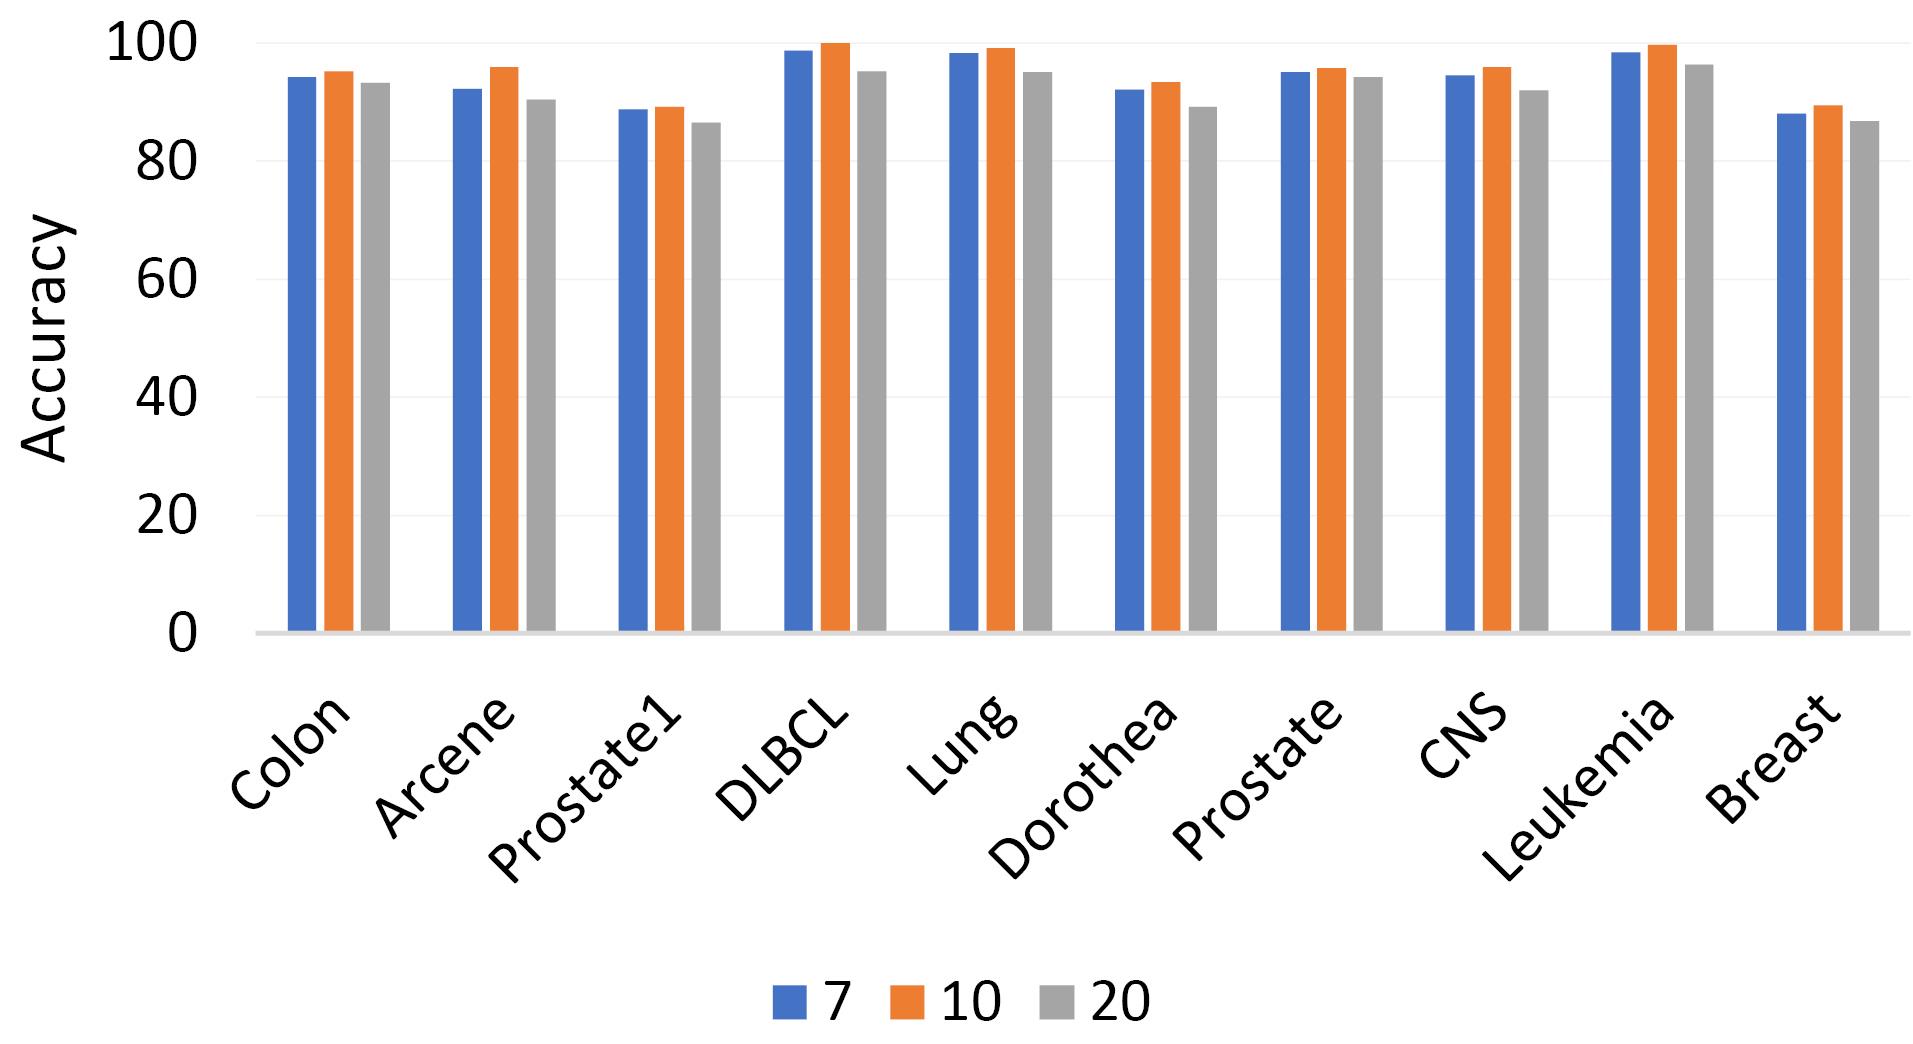
Fig. 3.
Comparison of highest accuracy based on the number of particles.
.
Comparison of highest accuracy based on the number of particles.
Accuracy of different classifiers
Given that the proposed algorithm is a hybrid and its performance is contingent on the classifier employed, it is imperative to evaluate its efficiency with various classifiers. This section of the experiment is conducted to ascertain that appropriate feature selection does not significantly impact the method’s efficiency, irrespective of the classifier used. The proposed algorithm was implemented using a range of classifiers, specifically K-Nearest Neighbors (KNN), Decision Tree (DT), Support Vector Machine (SVM), Random Forest (RF), and Naive Bayes (NB). These classifiers were applied across four distinct datasets. The evaluation was carried out based on multiple criteria, the outcomes of which are delineated in Table 1. Owing to its generalizability, the RF classifier outperforms in nearly all datasets. RF conducts feature selection in an embedded manner and eliminates a substantial number of redundant features. Furthermore, RF is a hybrid method that reaps the benefits of estimates from multiple classifiers. DT also exhibits relatively high generalizability compared to other classifiers. The number of neighbors for the KNN classifier is set to three, and this classifier demonstrates satisfactory accuracy in this experiment. As depicted in Table 1, the accuracy of the proposed algorithm consistently surpasses 85%, regardless of the dataset and classifier utilized. These results suggest that the algorithm’s performance is not dependent on the classifier, maintaining high accuracy consistently. In addition, the values of other criteria are also advantageous for the proposed algorithm, indicating that it is not biased toward the majority class.
Table 1.
Evaluation criteria of the proposed method using different classifiers
|
Dataset
|
Classifier
|
Feature No.
|
Accuracy
|
Sensitivity
|
Specificity
|
Balance Rate
|
| Colon |
SVM |
7 |
93.88 |
89.46 |
98.67 |
94.06 |
| KNN |
7 |
92.34 |
88.21 |
97.82 |
93.02 |
| DT |
7 |
94.36 |
89.87 |
99.37 |
94.62 |
| RF |
7 |
95.12 |
90.23 |
100 |
95.12 |
| NB |
7 |
92.45 |
88.45 |
97.78 |
93.13 |
| CNS |
SVM |
9 |
95.09 |
89.76 |
98.32 |
94.04 |
| KNN |
9 |
94.44 |
89.83 |
97.83 |
93.83 |
| DT |
9 |
95.21 |
90.43 |
98.96 |
94.7 |
| RF |
9 |
95.89 |
90.81 |
99.73 |
95.27 |
| NB |
9 |
93.92 |
89.13 |
97.15 |
93.14 |
| DLBCL |
SVM |
8 |
98.96 |
98.07 |
98.56 |
98.31 |
| KNN |
8 |
98.64 |
97.32 |
97.87 |
97.59 |
| DT |
8 |
99.86 |
98.34 |
99.18 |
98.76 |
| RF |
8 |
100 |
100 |
100 |
100 |
| NB |
8 |
98.73 |
97.86 |
98.67 |
98.26 |
| Breast |
SVM |
7 |
86.1 |
80.00 |
95.23 |
87.61 |
| KNN |
7 |
85.96 |
79.67 |
94.46 |
87.06 |
| DT |
7 |
87.71 |
81.56 |
97.08 |
89.32 |
| RF |
7 |
89.46 |
82.19 |
97.18 |
89.68 |
| NB |
7 |
87.12 |
80.67 |
96.14 |
88.40 |
As a result, the proposed algorithm demonstrates resilience when dealing with imbalanced datasets.
In this study, each dataset is split into two distinct subsets: a training set and an independent set. The training set, constituting 80% of the original data, is selected at random, while the remaining 20% forms the independent set. The training set serves the purpose of training, evaluating, and validating the proposed methodology, while the independent set is reserved for the ultimate performance assessment.
To ascertain robustness and reliability, the samples undergo random partitioning into two groups, a process repeated ten times. The outcomes are then averaged across these ten iterations. The results of these experiments are encapsulated in Table 2. The findings corroborate the robustness of the proposed method and its ability to achieve a high accuracy rate. As a result, the method proves its effectiveness in classifying gene expression data with remarkable precision.
Table 2.
Performance results of the proposed method in training and independent data
|
|
Training data
|
Independent data
|
|
Accuracy
|
Sensitivity
|
Specificity
|
Balance rates
|
Accuracy
|
Sensitivity
|
Specificity
|
Balance rates
|
| Colon |
96.72 |
97.82 |
96.26 |
97.04 |
94.38 |
95.5 |
91.21 |
93.355 |
| Arcene |
96.81 |
93.45 |
97.44 |
95.445 |
95.72 |
92.78 |
95.84 |
94.31 |
| Prostate1 |
91.06 |
89.84 |
93.72 |
91.78 |
89.08 |
88.34 |
92.43 |
90.385 |
| DLBCL |
100 |
100 |
100 |
100 |
100 |
100 |
100 |
100 |
| Lung |
99.43 |
99.93 |
99.91 |
99.92 |
98.24 |
99.86 |
99.79 |
99.825 |
| Dorothea |
94.17 |
94.42 |
92.18 |
93.3 |
92.86 |
92.43 |
90.08 |
91.255 |
| Prostate |
96.71 |
99.24 |
94.73 |
96.985 |
95.09 |
96.78 |
92.56 |
94.67 |
| CNS |
96.43 |
94.69 |
98.80 |
96.745 |
95.24 |
93.27 |
96.89 |
95.08 |
| Leukemia |
99.78 |
100.00 |
98.92 |
99.46 |
98.67 |
99.23 |
98.54 |
98.885 |
| Breast |
89.34 |
93.77 |
89.63 |
91.7 |
88.44 |
90.23 |
87.43 |
88.83 |
To investigate the meaningfulness of the results of the proposed method, the violin plot for the Random Forest classifier is shown in Fig. 4. The length of the violin in this plot is inversely proportional to the variance in the results of the proposed method. A shorter violin length signifies less variance, which in turn indicates the significance of the results and negates the possibility of them being randomly generated. As observed in Fig. 4, the detection rate variance for the Random Forest is low, thereby affirming the reliability and meaningfulness of the results.
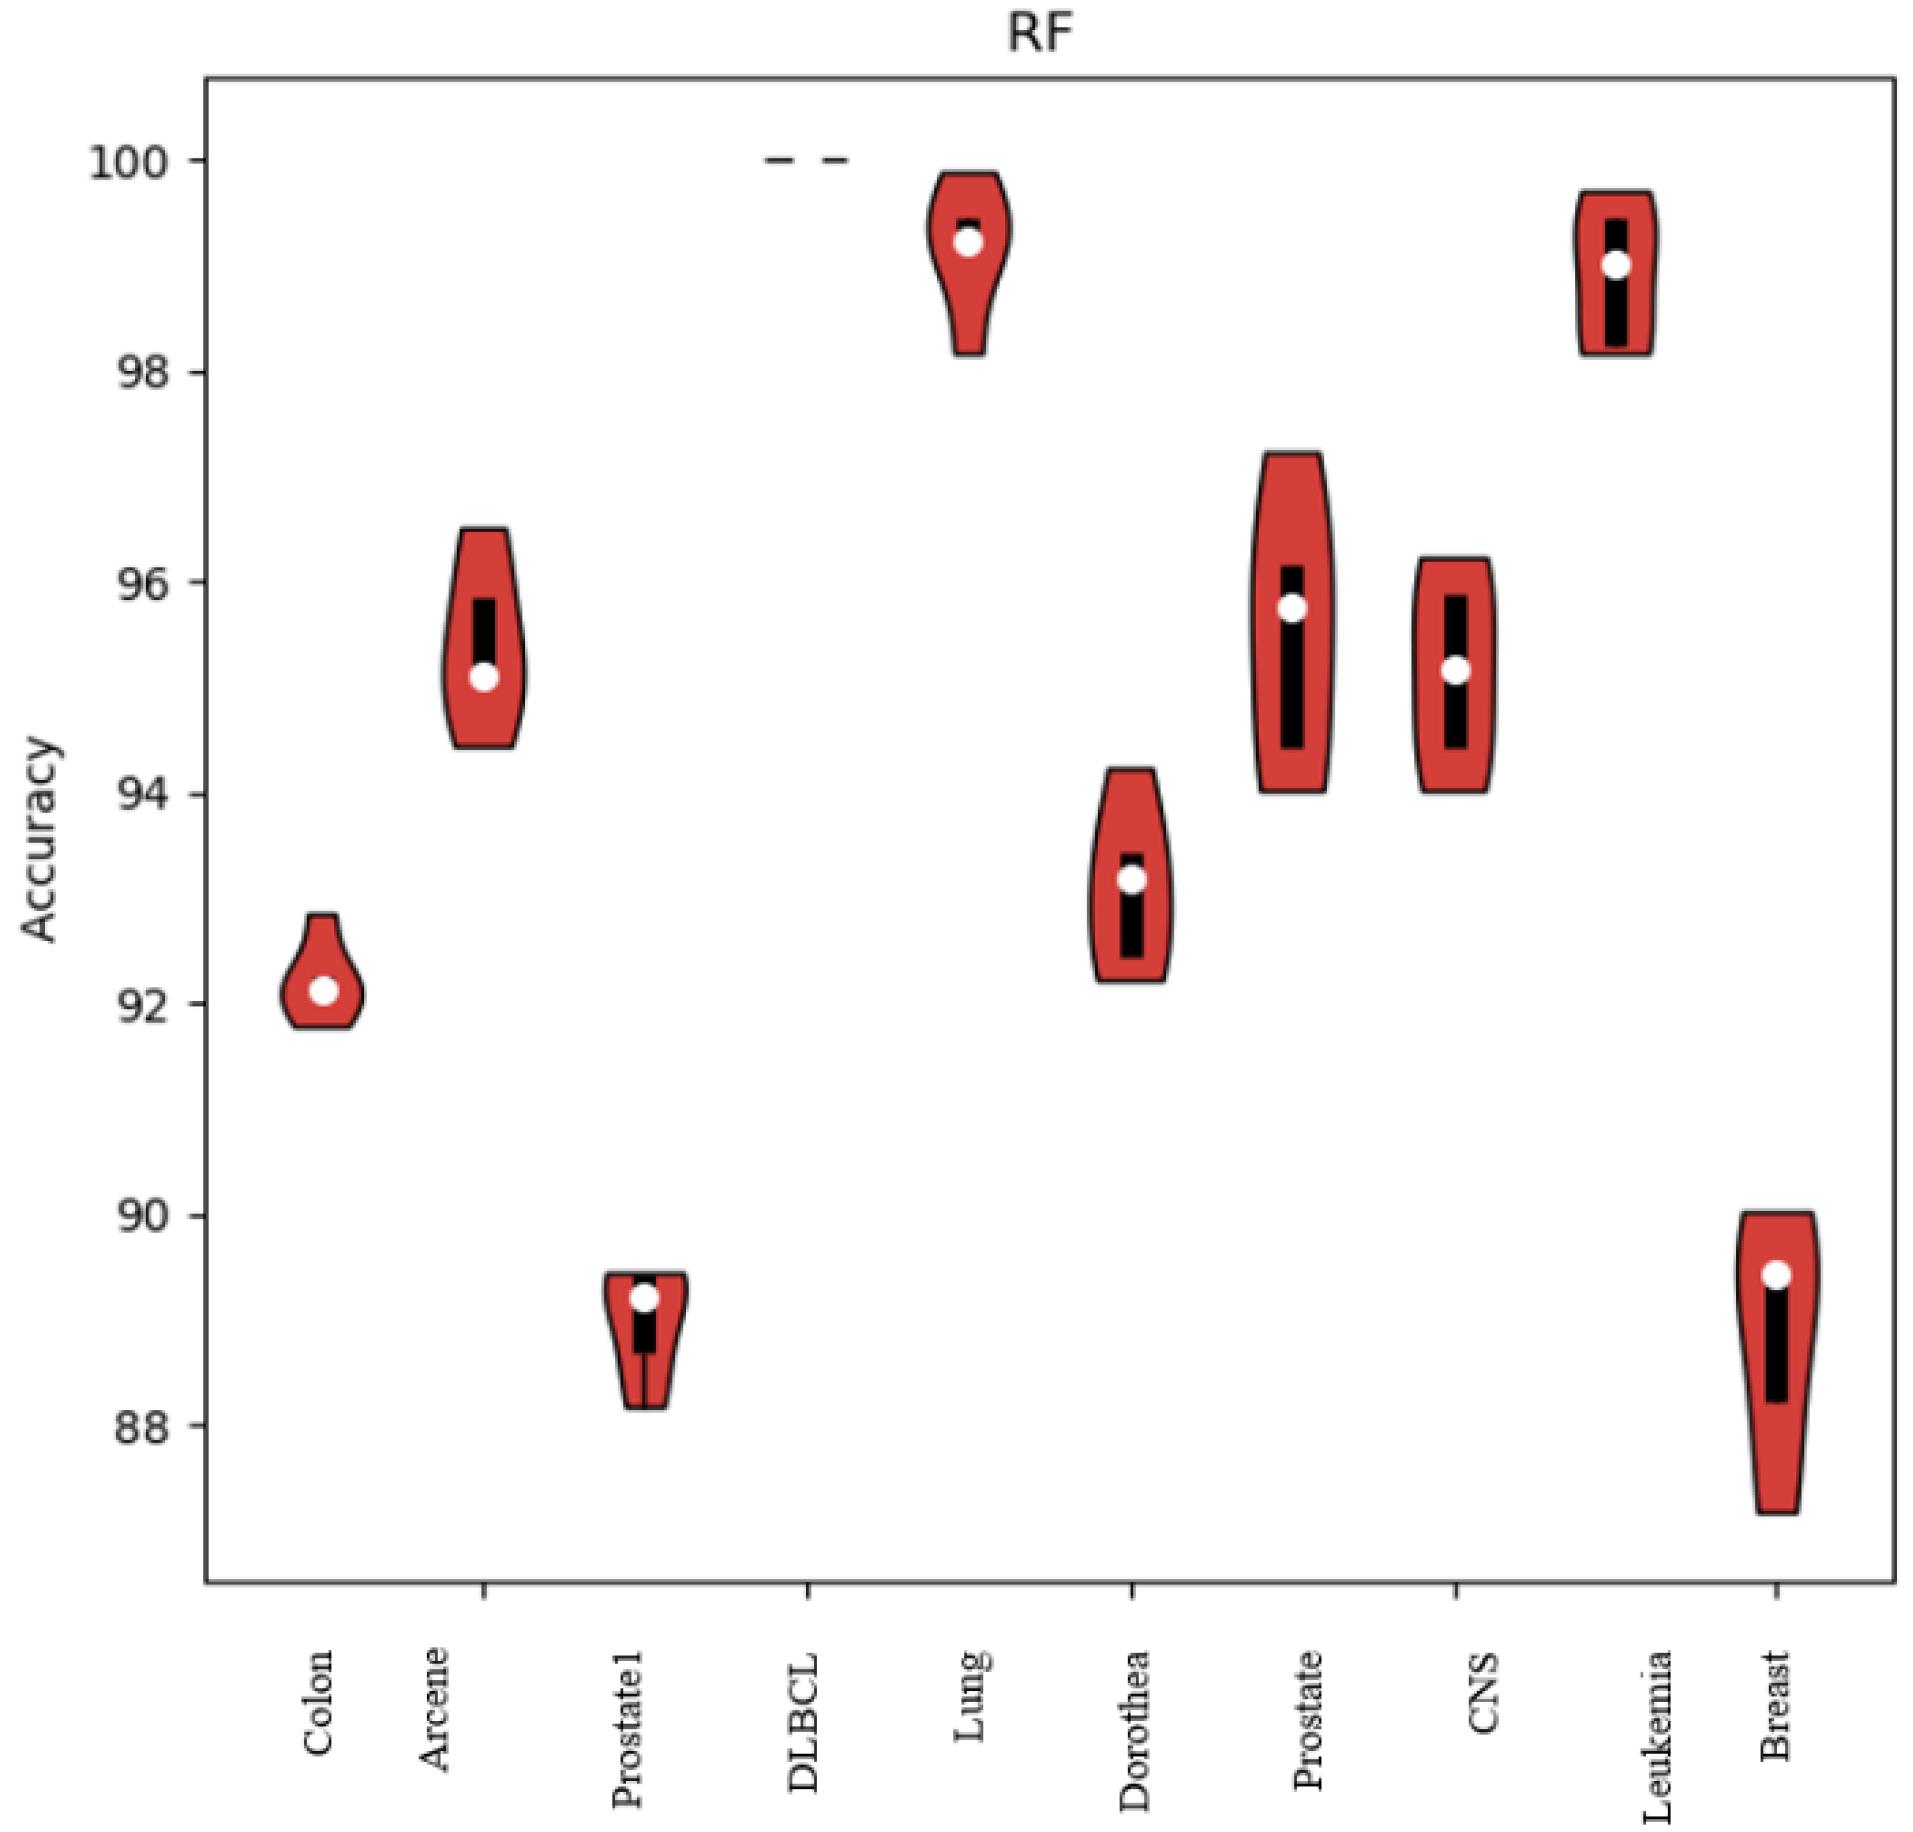
Fig. 4.
Violin plot for random forest classifier on different dataset.
.
Violin plot for random forest classifier on different dataset.
The datasets employed in this study are characterized by their high-dimensionality and the challenge of class imbalance. In this situation, the majority class, encompassing a considerable number of data points, stands in contrast to the minority class, which includes markedly fewer data points. Consequently, the proposed model is designed to not only diminish the number of features but also to exhibit satisfactory performance on imbalanced data. Under these circumstances, there is a risk that the classifier may exhibit bias towards the majority class. Therefore, an evaluation criterion is required for the proposed method that accurately reflects its performance in these conditions. To this end, the receiver operating characteristic (ROC) curves for various classifiers are depicted in Fig. 5. As observed, the area under both the ROC curves is substantial and approximates one for all classifiers, indicating that the proposed model maintains a low false positive rate across all classifications.
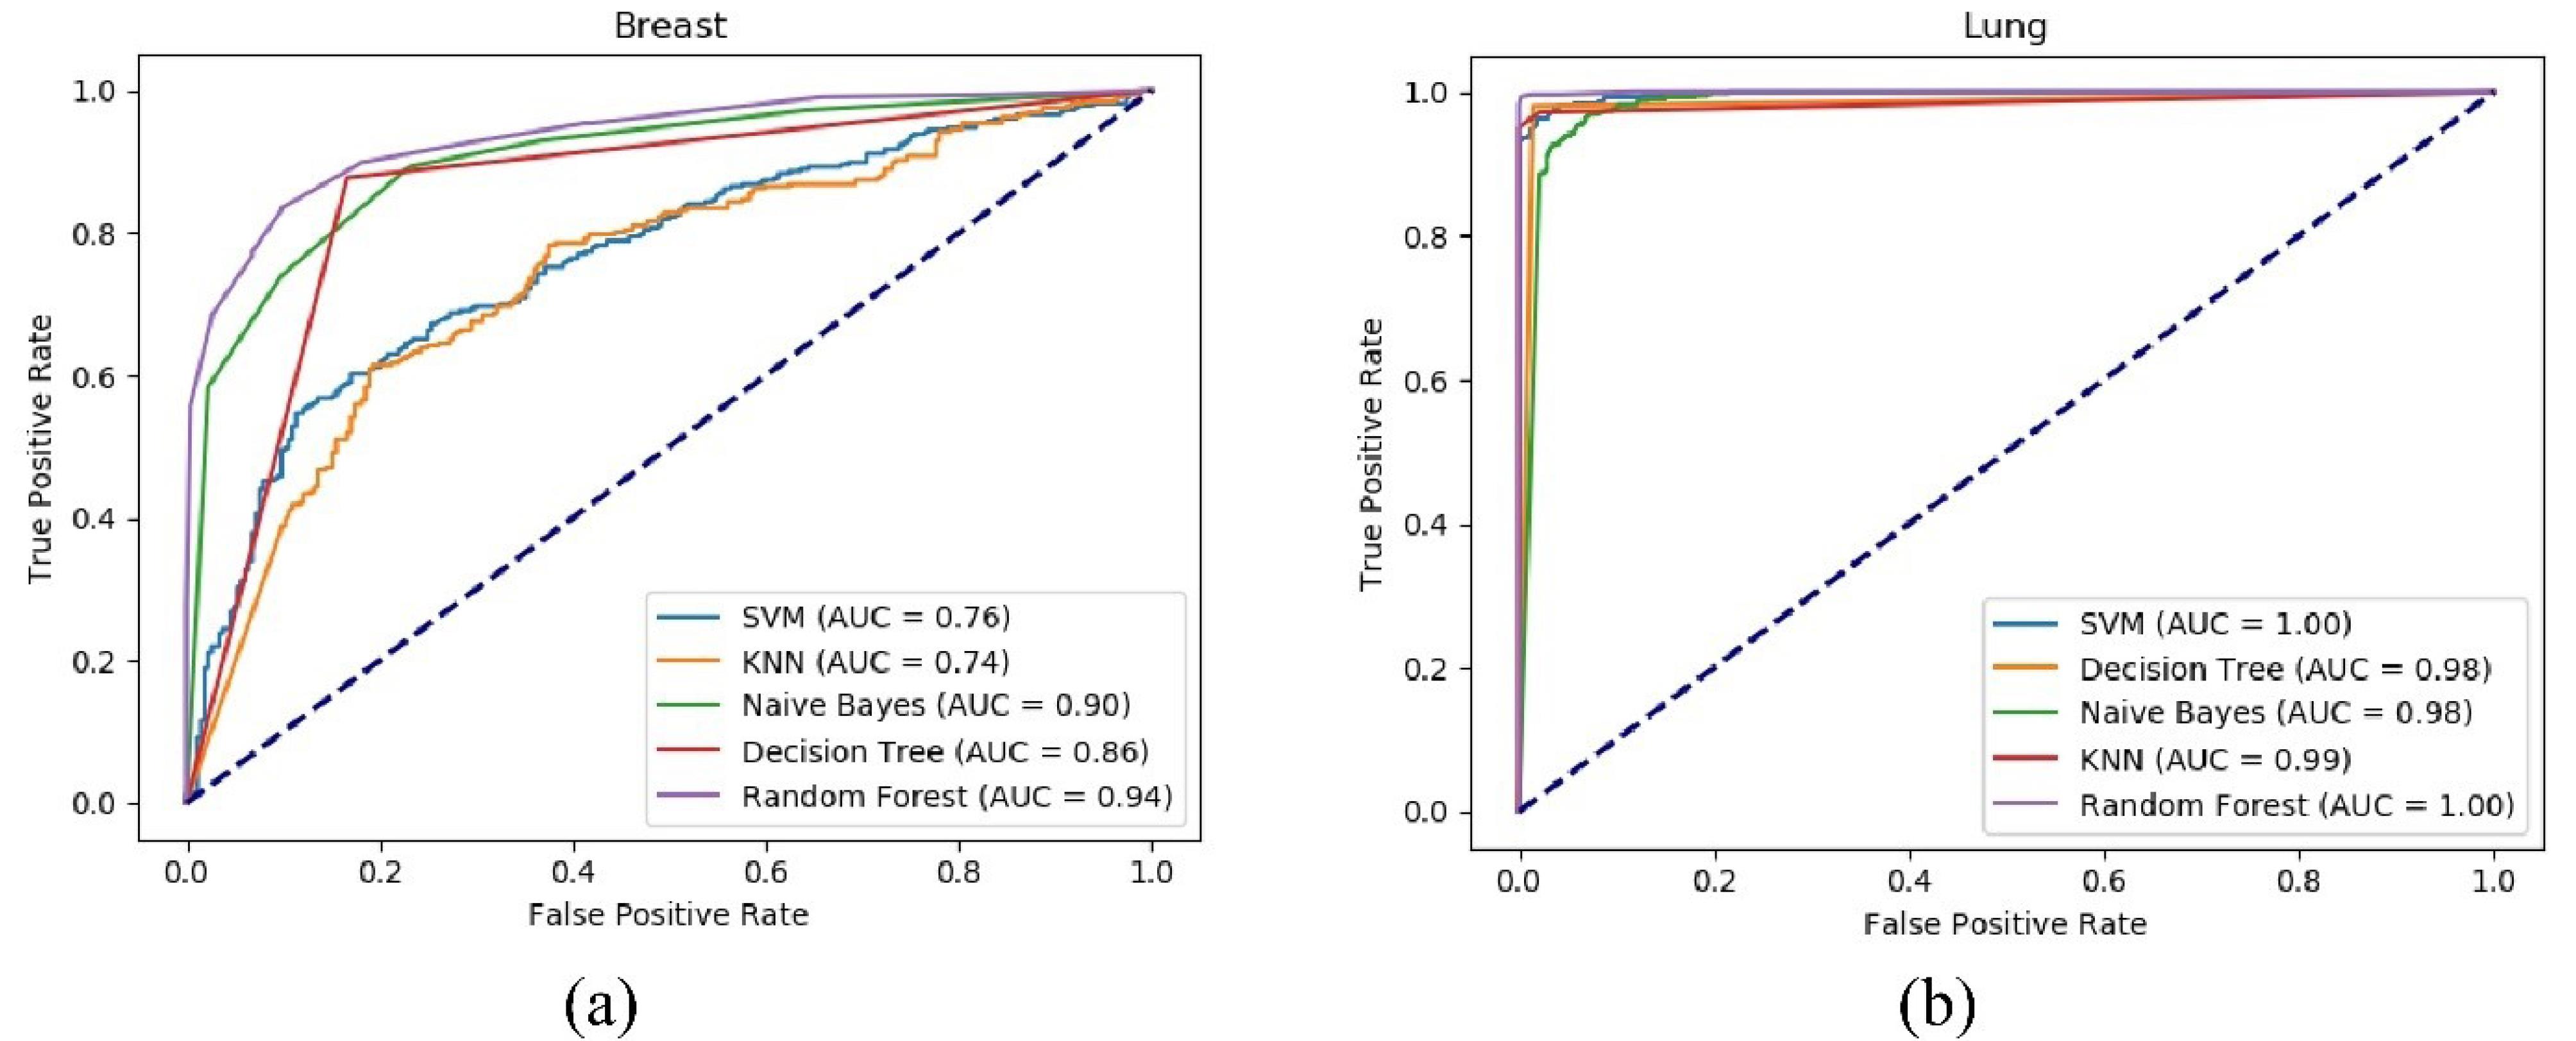
Fig. 5.
ROC curve for the proposed method using various classifiers on the breast (a) and Lung (b) datasets.
.
ROC curve for the proposed method using various classifiers on the breast (a) and Lung (b) datasets.
Convergence of the proposed algorithm
Convergence is indeed a prevalent concern in evolutionary algorithms. The convergence process is shown in Fig. 6. It presents the accuracy of the SVM classifier across various datasets over the course of 500 iterations. Given the iterative nature of the HHO algorithm and its numerous random parameters, a substantial number of iterations are necessitated to attain convergence. The experimental results reveal a high degree of random movements during the initial iterations, attributable to the multitude of random parameters inherent in the HHO algorithm. The fluctuation and randomness of the algorithm’s behavior diminish after the initial iterations, and following 250 iterations, the algorithm exhibits an upward trend in accuracy.
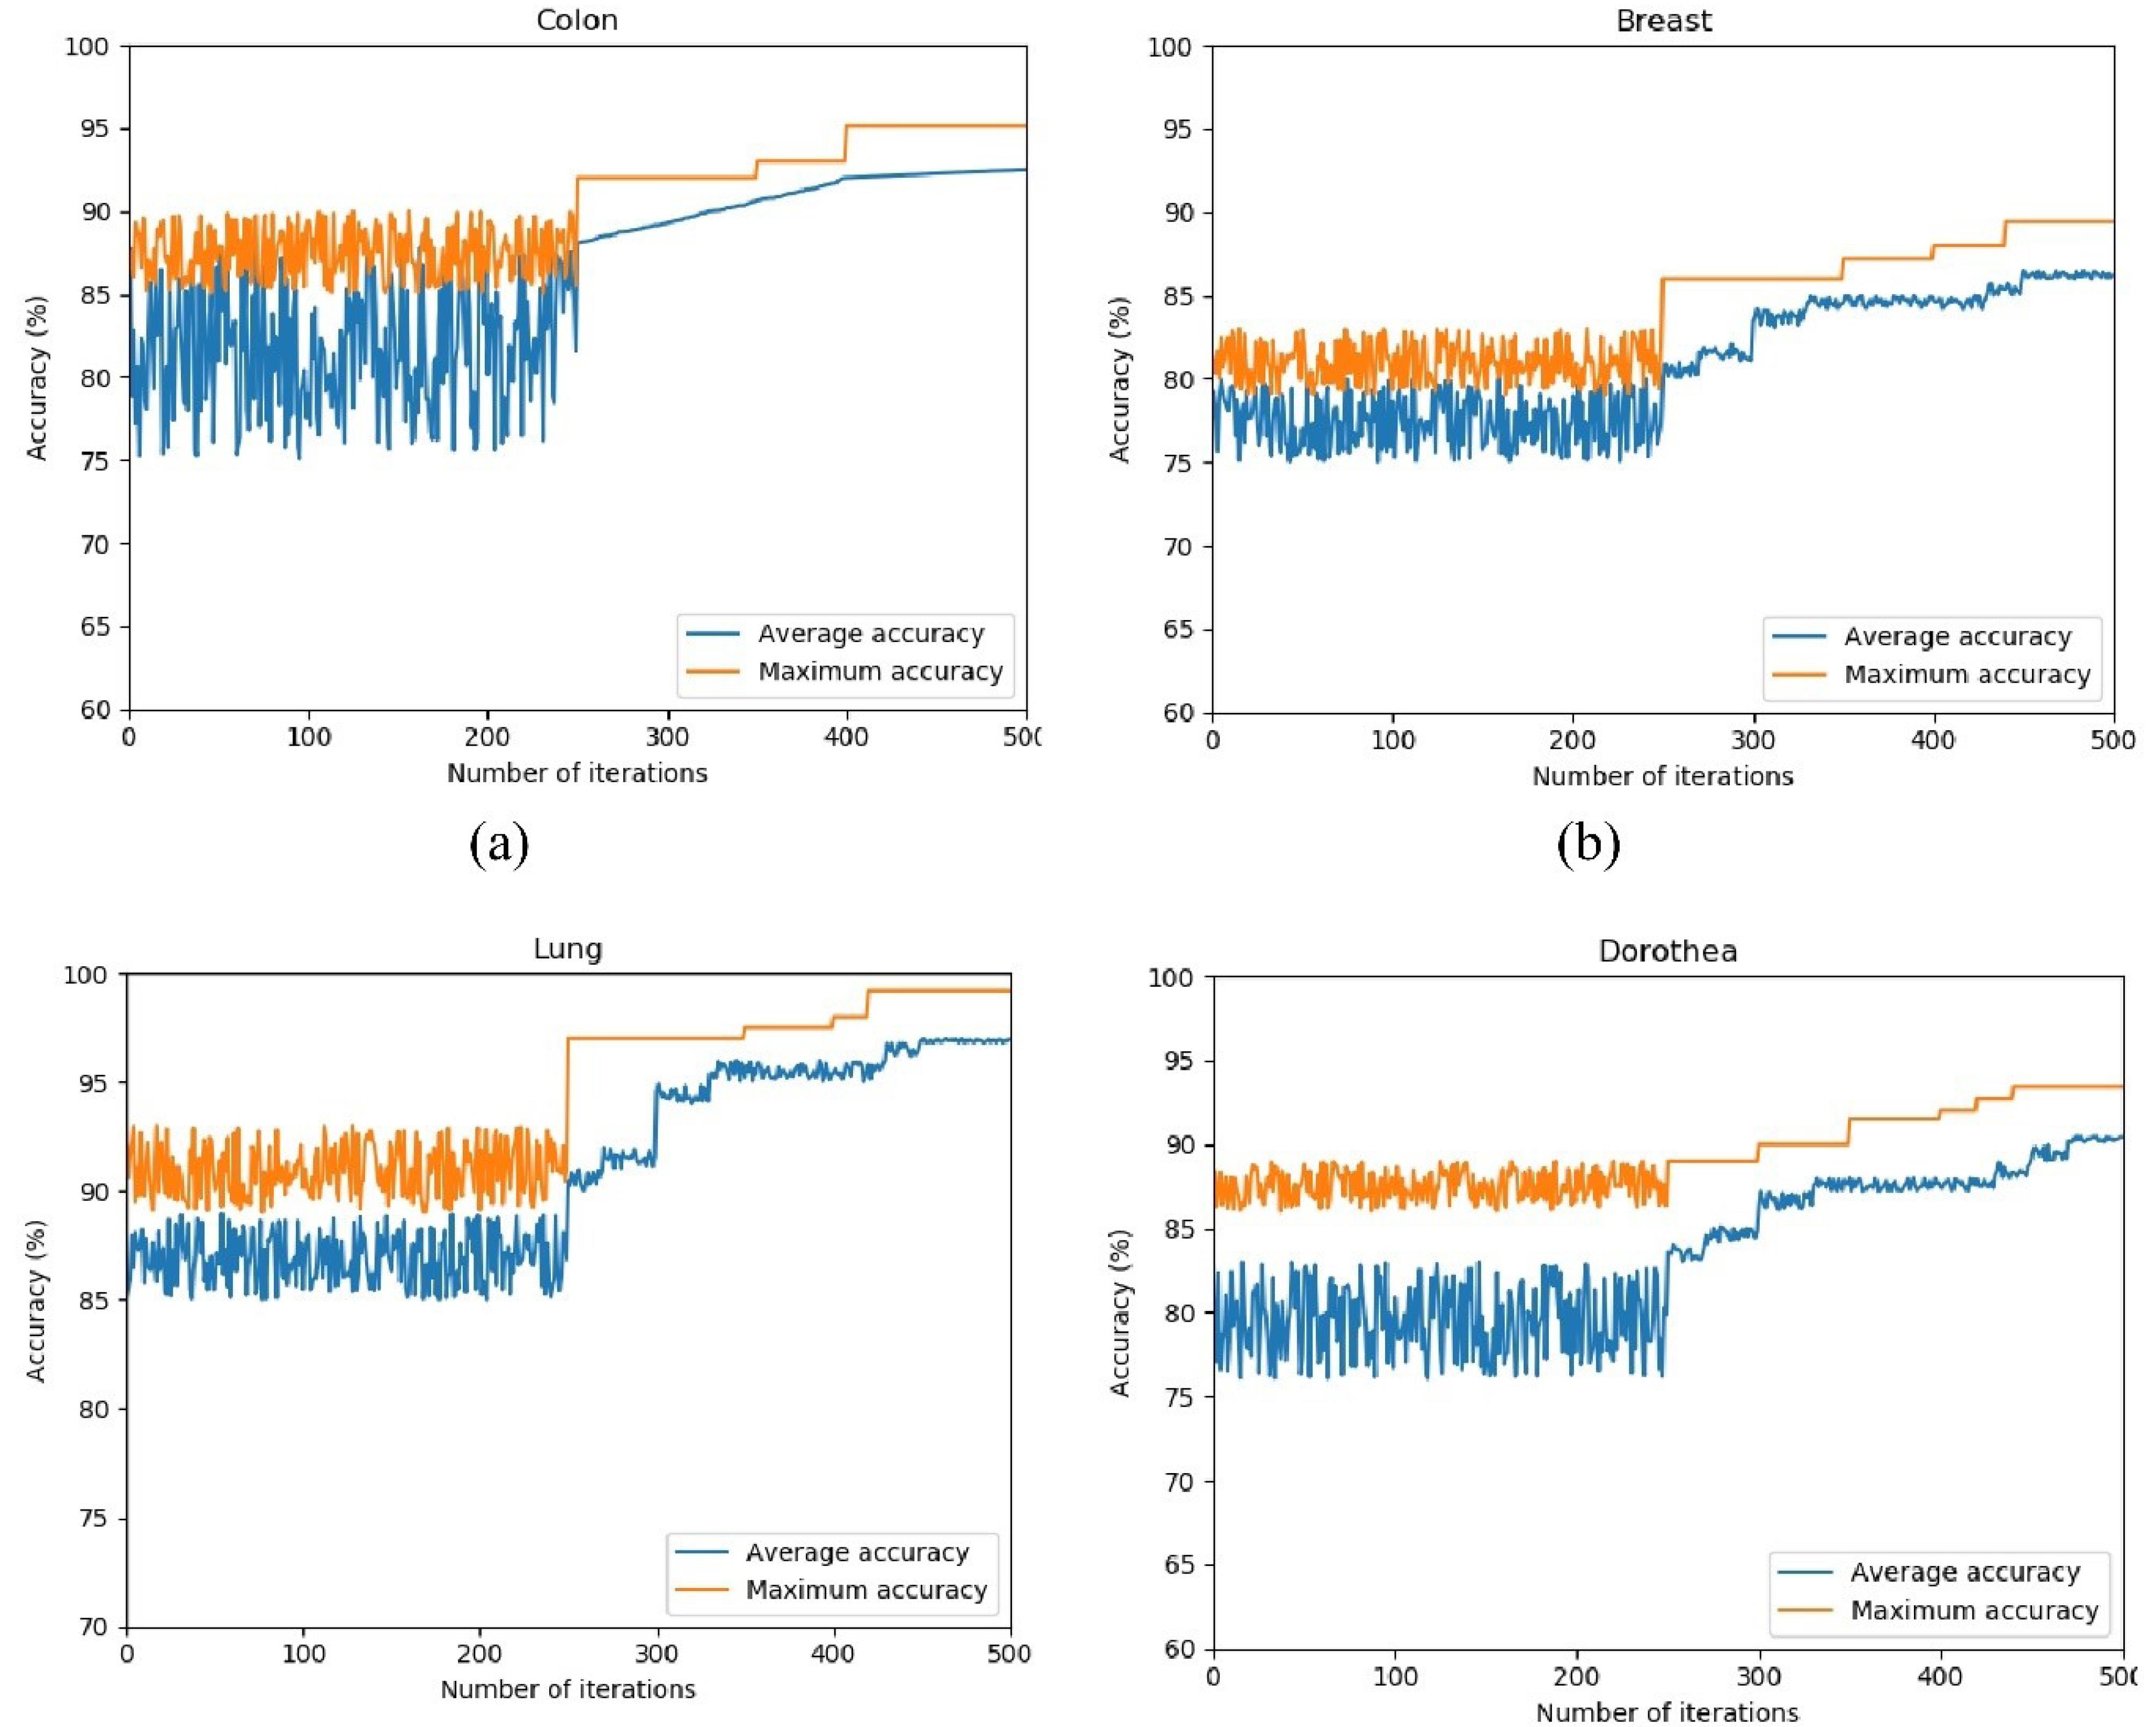
Fig. 6.
Maximum and average accuracy for 10 hawks in 500 iterations in colon (a), breast (b), lung (c), and Dorothea (d) datasets.
.
Maximum and average accuracy for 10 hawks in 500 iterations in colon (a), breast (b), lung (c), and Dorothea (d) datasets.
Comparison of the proposed algorithm with other methods
This section provides a comparative analysis of the proposed algorithm against a range of existing methods, evaluating both accuracy and the number of selected features. In this following tables, acc refers to the accuracy and atts refers to the number of selected features. The comparison is structured in three parts: (1) a comparison with non-evolutionary algorithms, (2) a comparison with evolutionary algorithms, and (3) a comparison with HHO-based algorithms. Table 3 presents a comparison of the proposed algorithm with non-evolutionary and evolutionary algorithms. As evidenced by the results, the proposed algorithm demonstrates superior accuracy compared to the other algorithms. The superior performance of the proposed algorithm can be attributed to its feature selection process, which is based on inter-feature relationships, and its utilization of a combination of two efficient search algorithms.
Table 3.
Comparison of the proposed algorithm with non-evolutionary and evolutionary algorithms
|
Method\Dataset
|
|
Colon
|
Arcene
|
Prostate1
|
DLBCL
|
Lung
|
Dorothea
|
Prostate
|
CNS
|
Leukemia
|
Breast
|
Mean
|
| IWSS |
Acc |
80.65 |
70 |
76.23 |
83.11 |
97.2 |
93.5 |
77.9 |
85.2 |
87.5 |
69.21 |
82.05 |
| Atts |
3.8 |
13.4 |
12.8 |
3.2 |
2.7 |
7.4 |
11.1 |
3.2 |
2.5 |
11.1 |
7.122 |
| IWSSr |
Acc |
83.87 |
72 |
77.42 |
81.23 |
97.2 |
92.9 |
78.7 |
86.1 |
87.5 |
70.21 |
82.71 |
| Atts |
2.8 |
6.2 |
8.3 |
2.7 |
2.4 |
6.3 |
7 |
3.1 |
3 |
9.2 |
5.1 |
| LFS |
Acc |
80.8 |
73 |
73.12 |
88.67 |
93.6 |
90.3 |
75.4 |
83.2 |
93 |
70.43 |
82.15 |
| Atts |
4.1 |
4.5 |
3.6 |
4.1 |
2.5 |
5.5 |
4.5 |
3.4 |
3.2 |
10.1 |
4.55 |
| BARS |
Acc |
85.7 |
74 |
85.34 |
75.21 |
98.3 |
93.8 |
86.8 |
89.1 |
90.5 |
72.81 |
85.15 |
| Atts |
3 |
4.9 |
4.1 |
2.8 |
3 |
7.3 |
3.7 |
2.8 |
2.3 |
9.34 |
4.32 |
| FCBF |
Acc |
95.12 |
95.86 |
89.21 |
100 |
99.2 |
93.42 |
95.76 |
95.9 |
99.71 |
89.46 |
95.36 |
| Atts |
14.6 |
34.2 |
32.4 |
56.2 |
115 |
92.8 |
35.8 |
42.2 |
45.8 |
107.3 |
57.65 |
| PCA |
Acc |
72.5 |
- |
59.12 |
68.11 |
85.6 |
- |
57.35 |
77.3 |
79.1 |
63.1 |
70.27 |
| Atts |
28.9 |
- |
37.1 |
42.7 |
125 |
- |
36.6 |
44.1 |
53.8 |
96.3 |
58.09 |
| HC |
Acc |
81.1 |
80 |
80.45 |
85.65 |
95.6 |
93.3 |
77.8 |
91.5 |
92.6 |
79.63 |
85.75 |
| Atts |
3 |
5.7 |
4.3 |
2.1 |
2.2 |
3.7 |
5 |
2.6 |
2.7 |
4.3 |
3.56 |
| Grasp IWSS |
Acc |
79.6 |
79.3 |
79.12 |
84.6 |
95.1 |
93.3 |
78.6 |
93.1 |
93.7 |
80.11 |
85.65 |
| Atts |
3.4 |
6 |
4.1 |
2.2 |
2.2 |
4.2 |
5.7 |
2.8 |
2.7 |
3.1 |
3.6 |
| Grasp IWSSr |
Acc |
82.2 |
78.5 |
78.49 |
85.61 |
95.7 |
92.9 |
77.5 |
87.3 |
91.6 |
78.38 |
84.82 |
| Atts |
3.1 |
5.7 |
3.7 |
2.1 |
2.4 |
3.8 |
4.6 |
2.8 |
2.8 |
3.5 |
3.45 |
| Grasp BARS |
Acc |
80 |
79 |
81.12 |
89.11 |
96 |
93.5 |
78.6 |
92.1 |
93.3 |
81.24 |
86.4 |
| Atts |
2.9 |
5.2 |
4.7 |
2.2 |
2.3 |
5 |
5.1 |
3.1 |
2.8 |
2.7 |
3.6 |
| SFS |
Acc |
80 |
79.3 |
78.43 |
85.7 |
96.2 |
93.2 |
78.1 |
91.1 |
93.6 |
80.91 |
85.65 |
| Atts |
3.5 |
6.3 |
6.3 |
2.4 |
2.4 |
4.4 |
5.6 |
3.1 |
3.3 |
3.6 |
4.09 |
| FICA + IWSSr |
Acc |
93.6 |
93.4 |
- |
99.1 |
98.9 |
75.8 |
92.4 |
- |
99.6 |
- |
- |
| Atts |
4.5 |
7.1 |
- |
4.5 |
3 |
3 |
4.4 |
- |
1.8 |
- |
- |
| F-Score |
Acc |
83.74 |
73.25 |
68.74 |
93.11 |
82.2 |
76.24 |
54.33 |
66.5 |
75.57 |
73.82 |
74.74 |
| Atts |
55 |
110 |
105 |
100 |
105 |
310 |
250 |
90 |
70 |
120 |
131 |
| SVM-RFE |
Acc |
93.7 |
89.11 |
82.71 |
95.23 |
98.7 |
84.32 |
92.2 |
77 |
100 |
86.09 |
89.9 |
| Atts |
9.8 |
13.5 |
17.2 |
15.7 |
9.4 |
21.7 |
14.4 |
16.3 |
8.6 |
17.3 |
14.39 |
| Proposed method |
Acc |
95.12 |
95.86 |
89.21 |
100 |
99.2 |
93.42 |
95.76 |
95.9 |
99.71 |
89.46 |
95.36 |
| Atts |
6.7 |
9.2 |
7.3 |
8.1 |
5.4 |
7.9 |
9.2 |
8.2 |
7.5 |
13.2 |
8.27 |
While deterministic and non-heuristic algorithms are capable of accurately identifying the optimal feature set, they lack efficiency when dealing with complex optimization problems.
Following this, the proposed algorithm is compared with evolutionary algorithms. Grasp is a renowned algorithm in this domain. Despite the fact that the number of selected features in the proposed algorithm is less than others, the accuracy and the convergence rate of the proposed algorithm are markedly superior to other algorithms.
The next step involves a comparison of the proposed algorithm with HHO-based methods. Table 4 provides a comparison of the proposed algorithm with two HHO-based algorithms. The comparative experimental results indicate a relative superiority of the proposed algorithm over the other methods. The HHO Algorithm-Based Simulated Annealing (HHOBSA) algorithm employs a combination of HHO and SA algorithms for feature selection.24 The primary drawback of this algorithm is the excessive number of selected features. Furthermore, the convergence time of HHOBSA is significantly high due to the utilization of two evolutionary algorithms. The Chaotic Harris Hawks Optimization (CHHO) algorithm25 finds application in the pharmaceutical domain.
Table 4.
Comparison of the proposed algorithm with two HHO based methods
|
Dataset
|
Proposed algorithm
|
HHOBSA
|
CHHO
|
|
Max Accuracy
|
Feature No.
|
Max Accuracy
|
Feature No.
|
Max Accuracy
|
Feature No.
|
| Colon |
95.12 |
6.7 |
0.84 |
926 |
0.60 |
3 |
| DLBCL |
100 |
8.1 |
- |
- |
- |
- |
| CNS |
95.89 |
8.2 |
- |
- |
- |
- |
| Leukemia |
99.71 |
7.5 |
0.91 |
3702 |
- |
- |
As the iterations advance, two factors in the proposed algorithm, namely the jumping strength and the escaping chance, exhibit a decreasing trend. The experimental results underscore that this process exerts a positive influence on the performance of the HHO algorithm. Furthermore, the crossover and mutation operators significantly contribute to the efficiency of the proposed algorithm.
Conclusion
This paper presents an efficient feature selection approach that combines filter and wrapper methods. Initially, the F-Score is employed to assign weights to features and rank them. Subsequently, the HHO and GRASP algorithm is utilized to select the optimal feature subset. To enhance the search capability of the HHO, crossover and mutation operators from the GA are incorporated. The proposed algorithm is evaluated against both evolutionary and non-evolutionary methods using various criteria. Experimental results demonstrate the efficacy of the proposed algorithm in successfully selecting the optimal feature subset.
Research Highlights
What is the current knowledge?
What is new here?
Competing Interests
Authors declare no conflict of interests.
Ethical Statement
Not applicable.
Supplementary files
Supplementary file 1 contains algorithms S1 and S2.
(pdf)
References
- Liu H, Zhou M, Liu Q. An embedded feature selection method for imbalanced data classification. IEEE/CAA J Autom Sin 2019; 6:703-15. doi: 10.1109/jas.2019.1911447 [Crossref] [ Google Scholar]
- Pes B. Ensemble feature selection for high-dimensional data: a stability analysis across multiple domains. Neural Comput Appl 2020; 32:5951-73. doi: 10.1007/s00521-019-04082-3 [Crossref] [ Google Scholar]
- Masoudi-Sobhanzadeh Y, Motieghader H, Masoudi-Nejad A. FeatureSelect: a software for feature selection based on machine learning approaches. BMC Bioinformatics 2019; 20:170. doi: 10.1186/s12859-019-2754-0 [Crossref] [ Google Scholar]
- Pirgazi J, Alimoradi M, Esmaeili Abharian T, Olyaee MH. An Efficient hybrid filter-wrapper metaheuristic-based gene selection method for high dimensional datasets. Sci Rep 2019; 9:18580. doi: 10.1038/s41598-019-54987-1 [Crossref] [ Google Scholar]
- Taghian S, Nadimi-Shahraki MH. A binary metaheuristic algorithm for wrapper feature selection. Int J Comput Sci Eng 2019; 8:168-72. doi: 10.13140/rg.2.2.34937.90722 [Crossref] [ Google Scholar]
- Li S, Zhang K, Chen Q, Wang S, Zhang S. Feature selection for high dimensional data using weighted k-nearest neighbors and genetic algorithm. IEEE Access 2020; 8:139512-28. doi: 10.1109/access.2020.3012768 [Crossref] [ Google Scholar]
- Thejas GS, Joshi SR, Iyengar SS, Sunitha NR, Badrinath P. Mini-batch normalized mutual information: a hybrid feature selection method. IEEE Access 2019; 7:116875-85. doi: 10.1109/access.2019.2936346 [Crossref] [ Google Scholar]
- Zou Q, Zeng J, Cao L, Ji R. A novel features ranking metric with application to scalable visual and bioinformatics data classification. Neurocomputing 2016; 173:346-54. doi: 10.1016/j.neucom.2014.12.123 [Crossref] [ Google Scholar]
- Ding H, Li D. Identification of mitochondrial proteins of malaria parasite using analysis of variance. Amino Acids 2015; 47:329-33. doi: 10.1007/s00726-014-1862-4 [Crossref] [ Google Scholar]
- Guha R, Ghosh M, Mutsuddi S, Sarkar R, Mirjalili S. Embedded chaotic whale survival algorithm for filter–wrapper feature selection. Soft Comput 2020; 24:12821-43. doi: 10.1007/s00500-020-05183-1 [Crossref] [ Google Scholar]
- Ramjee S, Gamal AE. Efficient wrapper feature selection using autoencoder and model-based elimination. ArXiv [Preprint]. May 28, 2019. Available from: https://arxiv.org/abs/1905.11592.
- Al-Tashi Q, Abdul Kadir SJ, Rais HM, Mirjalili S, Alhussian H. Binary optimization using hybrid grey wolf optimization for feature selection. IEEE Access 2019; 7:39496-508. doi: 10.1109/access.2019.2906757 [Crossref] [ Google Scholar]
- Venkatesh B, Anuradha J. A hybrid feature selection approach for handling a high-dimensional data. In: Saini H, Sayal R, Govardhan A, Buyya R, eds. Innovations in Computer Science and Engineering: Proceedings of the Sixth ICICSE 2018. Singapore: Springer; 2019. p. 365-73. 10.1007/978-981-13-7082-3_42.
- Kamala R, Thangaiah RJ. An improved hybrid feature selection method for huge dimensional datasets. IAES Int J Artif Intell 2019; 8:77-86. doi: 10.11591/ijai.v8.i1.pp77-86 [Crossref] [ Google Scholar]
- Taradeh M, Mafarja M, Heidari AA, Faris H, Aljarah I, Mirjalili S. An evolutionary gravitational search-based feature selection. Inf Sci 2019; 497:219-39. doi: 10.1016/j.ins.2019.05.038 [Crossref] [ Google Scholar]
- Kiala Z, Mutanga O, Odindi J, Viriri S, Sibanda M. A hybrid feature method for handling redundant features in a Sentinel-2 multidate image for mapping parthenium weed. IEEE J Sel Top Appl Earth Obs Remote Sens 2020; 13:3644-55. doi: 10.1109/jstars.2020.3001564 [Crossref] [ Google Scholar]
- Arora S, Singh H, Sharma M, Sharma S, Anand P. A new hybrid algorithm based on grey wolf optimization and crow search algorithm for unconstrained function optimization and feature selection. IEEE Access 2019; 7:26343-61. doi: 10.1109/access.2019.2897325 [Crossref] [ Google Scholar]
- Zheng Y, Li Y, Wang G, Chen Y, Xu Q, Fan J. A novel hybrid algorithm for feature selection based on whale optimization algorithm. IEEE Access 2019; 7:14908-23. doi: 10.1109/access.2018.2879848 [Crossref] [ Google Scholar]
- Amini F, Hu G. A two-layer feature selection method using Genetic Algorithm and Elastic Net. Expert Syst Appl 2021; 166:114072. doi: 10.1016/j.eswa.2020.114072 [Crossref] [ Google Scholar]
- Dao FY, Lv H, Wang F, Feng CQ, Ding H, Chen W. Identify origin of replication in Saccharomyces cerevisiae using two-step feature selection technique. Bioinformatics 2019; 35:2075-83. doi: 10.1093/bioinformatics/bty943 [Crossref] [ Google Scholar]
- El-Kenawy ES, Eid M. Hybrid gray wolf and particle swarm optimization for feature selection. Int J Innov Comput Inf Control 2020; 16:831-44. doi: 10.24507/ijicic.16.03.831 [Crossref] [ Google Scholar]
- Chen K, Zhou FY, Yuan XF. Hybrid particle swarm optimization with spiral-shaped mechanism for feature selection. Expert Syst Appl 2019; 128:140-56. doi: 10.1016/j.eswa.2019.03.039 [Crossref] [ Google Scholar]
- Georges N, Mhiri I, Rekik I. Identifying the best data-driven feature selection method for boosting reproducibility in classification tasks. Pattern Recognit 2020; 101:107183. doi: 10.1016/j.patcog.2019.107183 [Crossref] [ Google Scholar]
- Abdel-Basset M, Ding W, El-Shahat D. A hybrid Harris Hawks optimization algorithm with simulated annealing for feature selection. Artif Intell Rev 2021; 54:593-637. doi: 10.1007/s10462-020-09860-3 [Crossref] [ Google Scholar]
- Elgamal ZM, Mohd Yasin NB, Tubishat M, Alswaitti M, Mirjalili S. An improved Harris Hawks optimization algorithm with simulated annealing for feature selection in the medical field. IEEE Access 2020; 8:186638-52. doi: 10.1109/access.2020.3029728 [Crossref] [ Google Scholar]
- Bermejo P, Gámez JA, Puerta JM. A GRASP algorithm for fast hybrid (filter-wrapper) feature subset selection in high-dimensional datasets. Pattern Recognit Lett 2011; 32:701-11. doi: 10.1016/j.patrec.2010.12.016 [Crossref] [ Google Scholar]
- Heidari AA, Mirjalili S, Faris H, Aljarah I, Mafarja M, Chen H. Harris Hawks optimization: algorithm and applications. Future Gener Comput Syst 2019; 97:849-72. doi: 10.1016/j.future.2019.02.028 [Crossref] [ Google Scholar]