Bioimpacts. 2025;15:30467.
doi: 10.34172/bi.30467
Original Article
Assessment of the biocompatibility and biodistribution of fluorescent oleic acid capped ZnSe/CdS/ core shell quantum dots after intravenous injection in Balb/c mice
Aakriti Tyagi Data curation, Formal analysis, Methodology, Validation, Writing – original draft, Writing – review & editing, 1, # 
Disha Mittal Data curation, Formal analysis, Methodology, Validation, Writing – original draft, Writing – review & editing, 1, 2, #
S. Bhanoth Methodology, 3
Ankita Leekha Formal analysis, Methodology, 1, 4
Anita K. Verma Conceptualization, Investigation, Project administration, Resources, Supervision, Visualization, Writing – review & editing, 1, 5, *
Author information:
1Nanobiotech lab, Kirori Mal College, University of Delhi, 110007, Delhi, India
2School of Biological and Life Sciences, Galgotias University, Greater Noida, Uttar Pradesh, India
3Department of Applied Chemistry, Defence Institute of Advanced Technology,Ministry of Defence Govt. of India
4Department of Chemical and Biomolecular Engineering, University of Houston, Houston, TX, USA
5Fellow, Delhi School of Public Health, Institution of Eminence, University of Delhi, 110007, Delhi, India
#Both authors contributed equally to this work.
Abstract
Introduction:
Quantum dots (QDs) are semiconductor nanocrystals with inherent fluorescence having several advantages over traditional fluorescent probes including their small size (5–10 nm), tunable excitation and emission spectra, ease of surface functionalization, and robust photostability that makes them ideal candidates for in vivo imaging. The behavior of QDs is highly dependent on the surface functionality. In vivo toxicity of QDs in biological systems is the major limitation hindering their translation to clinics.
Methods:
In the present study, cytotoxicity of water soluble ZnSe/CdS core shell QDs capped with oleic acid was evaluated against human hepatocellular carcinoma cell line-Hep3B, Human Embryonic Kidney cell line-HEK 293 and Ehlrich Ascitic cells-EAC. To assess its in vivo therapeutic efficacy, the initial animal toxicity studies of OA capped ZnSe/ CdS QDs were done in Balb/c mice. Serum stability, pharmacokinetics, biodistribution and γ-scintigraphic imaging were observed in mice after intravenous (i.v) injection of QDs at a dose of 10 nM/kg/200 µL/mice up to 28 days.
Results:
IC50 of OA capped QDs against Hep3B was 29.85 µg/mL at 24 hours. QDs toxicity was primarily due to the generation of reactive oxygen species as observed by LDH release in Hep3B cells. Negligible haemolysis indicated that OA capped QDs were biocompatible. OA capped QDs mainly accumulated in the liver and spleen with no retention in kidneys.
Conclusion:
OA capped ZnSe/ CdS QDs exhibited enhanced anti-cancer efficacy against Hep3B and EAC cell line. Further, minimum accumulation and retention were observed in vital organs in Balb/c mice protecting them from potential adverse side effects, underlining their potential for biomedical applications.
Keywords: Quantum dots, Radiolabelling, Biodistribution, Pharmacokinetics, γ-Scintigraphic imaging
Copyright and License Information
© 2025 The Author(s).
This work is published by BioImpacts as an open access article distributed under the terms of the Creative Commons Attribution Non-Commercial License (
http://creativecommons.org/licenses/by-nc/4.0/). Non-commercial uses of the work are permitted, provided the original work is properly cited.
Funding Statement
The funders had no role in study design, data collection and analysis, decision to publish, or preparation of the manuscript, and this is purely academic research work.
Introduction
Quantum dots (QDs) are nanoscale materials with zero-dimension because charged carriers are tightly confined in three directions.1 QDs are semiconductor crystals that have gained considerable attention in the field of nanomedicine due to their unique optical and physical properties. Their advantages include size-tunable light emission, wide absorption/extinction coefficients, and high fluorescent quantum yields. The surface of the QDs can be modified chemically for altering their emission spectra or enhance their solubility in water and biocompatibility.2 Semiconductor QDs can uniquely regulate their energy by tailoring their size, shape and composition. QD fluorescence emission wavelength is proportional to the particle’s size as per which longer wavelengths are emitted by larger particles. The size of QDs range from 2–10 nm, and are mostly synthesized from II–VI group materials.3 QDs have distinctive optical properties like high fluorescence, sharp and symmetric emission spectra and photostability.4 QD utilization has attracted significant attention in areas of biomedical applications. Various efforts have been devoted to tune the properties of semiconductor for developing smaller and more complex devices having better performance.5
Quantum dots are employed either in their pure core form or as core/shell structures. While these core quantum dots dictate the optical characteristics of the composite, they are inherently unsuitable for biological applications due to their instability and low quantum yield.6 Indeed, the quantum yield of core quantum dots is highly sensitive to specific ions present in solution.7 A bare nanocrystal core exhibits high reactivity and toxicity, leading to an unstable structure prone to photochemical degradation. This reactivity stems from its significant surface area-to-volume ratio, making it particularly susceptible to degradation under photochemical conditions. Encapsulating the core with a semiconductor material of a higher band gap enhances stability and quantum yield while also reducing core toxicity by shielding reactive ions from exposure to photo-oxidative environments, such as UV light and air. Conventionally, typical quantum dots consist of a core made of II–IV, IV–VI, or III–V semiconductors (such as CdTe, CdSe, PbSe, GaAs, GaN, InP, and InAs), surrounded by a wide-bandgap semiconductor shell such as zinc sulfide (ZnS) or cadmium sulfide (CdS) typically with a thickness of approximately 1.5 nm.8 Quantum dots lack inherent aqueous solubility as they are typically synthesized in organic solvents, with the outermost surface coated with organic ligands. To render them water-soluble and improve biocompatibility, various surface modifications, or "caps," were applied. In the display industry, the key components of core-shell quantum dots comprised of the core, shell, and ligand.9
In the biomedical field, QDs offer numerous advantages over traditional organic dyes and fluorescent compounds.10 At the cellular level, QDs serve as valuable tools for visualizing intracellular components. When incubated with target cells, QDs are efficiently internalized owing to their small size. Upon excitation, their emission spectra can be readily detected using fluorescence microscopes. A notable advantage of QDs is their unique blinking behaviour, allowing for the detection of individual QDs and enabling the visualization of specific subcellular components such as proteins with continuous emission unlike conventional fluorescent probes that are hindered by photobleaching. Additionally, QDs find utility in in vivo imaging of various organs and tissues. Functionalized QDs, equipped with specific ligands, exhibit enhanced affinity towards desired organs or tissues post-administration. QDs offer promising alternatives to antibodies commonly used for staining cell surface markers due to their superior stability and cost-effectiveness. Functionalization with targeting ligands enables QDs to recognize target markers efficiently. Unlike antibodies, QDs can penetrate cells easily, facilitating staining of intracellular markers without the need for permeabilization buffers, thereby preserving the cell viability and simplifying experimental protocols. Moreover, QDs present several advantages as drug delivery systems, including facile fabrication, versatility of conjugation with diverse drugs, tunable physico-chemical properties, and tunable optical characteristics, allowing for easy monitoring post-administration. Furthermore, QDs have been used as photosensitizers in photodynamic therapy and can be integrated into biosensor systems to offer combined selectivity, efficiency, accuracy, and high detection sensitivity. Such QDs-containing biosensors hold promise for a wide range of diagnostic, toxicological, and biomedical applications.11
Presently in vivo distribution, clearance, metabolism, and toxicity of QDs have not been exhaustively investigated. Various cell lines (HeLa, K562, HK293T, PC12, VeroN9, EL-4 and HepG2, Hep3B, and EAC) have been used to document the toxicological effects of QDs,12 but in vivo studies are superior, since the results validate the probable toxicities at the target organs and non-target tissues. However, partial data obtained from inadequate animal studies are not convincing enough.13 Many reports show that oxidative stress was induced by Cadmium (Cd), as Cd disturbs the antioxidant defense systems.13,14 The distribution mechanisms of QDs into organs are difficult to elucidate and is not entirely dependent on the physico-chemical properties of the QDs but also on reticuloendothelial system (RES) of the animal. In bio-distribution one of the major concerns is the size of QDs because the pores of endothelium vary according to type and functionality.15
We report QDs with ZnSe core and CdS as the shell, capped with oleic acid to render it biologically compatible. Various Zn and Se induced toxicities like hepatic, renal, neurological and genetic are well documented. Degradation of QDs in vivo can lead to unwarranted exposure to these metals. Our past efforts have resulted in successful synthesis of ZnSe/CdS QDs. Hence, we extended the study the biocompatibility of QDs both in in-vitro and in-vivo.
Materials and Methods
3-(4,5-Dimethyathiazol-2-yl)-2,5-diphenyltetrazolium bromide (MTT), Dimethyl sulphoxide (DMSO), sodium bicarbonate, hydroxy ethyl piperazineethanesulphonic acid (HEPES), Hoechst 33342,2’,7’-dichlorofluorescin diacetate (DCFH-DA) and Dihydroethidium (DHE) were supplied by Sigma-Aldrich Chemical Co., USA. The growth medium Dulbecco’s minimum essential media (DMEM) and fetal bovine serum (FBS) were supplied by Gibco, BRL. Trypsin was supplied by HiMedia, India. All the chemicals purchased were of analytical grade and used without further purification. QDs were a kind gift from Department of Applied Chemistry, DIAT, Pune. Mouse Ehrlich Ascitic Carcinoma (EAC), Human Embryonic Kidney (HEK-293), Human Hepatocellular Carcinoma- Hep3B cell lines were procured from National Centre for Cell Sciences (NCCS), India.
Experimental
Quantum dots
Our past efforts have resulted in successful synthesis of ZnSe/CdS QDs.17-20 Characterisation and in-vitro efficacy of these QDs was detailed in our previous reports.12,18,19 The core/shell QDs have a spherical morphology and are nearly 4 nm-5 nm in size.18,19 In our report QDs were capped with oleic acid and by virtue of the excellent optical properties of ZnSe/CdS QDs, they were subjected to bio-evaluation in terms of cytotoxicity and in vivo therapeutic efficacy.
Biotoxicity assay
Biotoxicity of QDs was assessed by MTT assay.21 The MTT assay is based on the reduction of the yellow tetrazolium salt MTT (3-(4,5-dimethylthiazol-2-yl)-2,5-diphenyltetrazolium bromide) to purple formazan crystals by metabolically active cells. This reduction process is facilitated by mitochondrial enzymes, specifically succinate dehydrogenase, indicating that only living cells with intact mitochondria can reduce MTT. In a 96 well plate, exponentially growing HEK 293, Hep3B, and EAC cells were plated at a density 5 × 10³ cells per well in complete media. Cells were incubated with various concentrations of QDs for certain time points (24 hours and 48 hours) and 20 µl MTT (5 mg/mL) was added to each well, followed by incubation at 37 ºC and for dissolving the formazan crystals 150 µL DMSO was added. The plate was read at 540 nm by an ELISA plate reader (TECAN, Switzerland). By plotting the drug concentration versus the mortality percent of the QDs treated cells, the IC50 values were determined.
Lactate dehydrogenase (LDH) release assay
The LDH release assay is a reliable method used to assess cell membrane integrity and resulting cytotoxicity. 5 × 10³ cells/well are seeded in 96-well plate with DMEM containing 10% Foetal Bovine Serum. After 24 hours the cells were treated with various concentrations of QDs. After 24 hours of treatment, the 96-well plates were shaken briefly to homogenize the released LDH in the medium which was then transferred to 1.5 mL microcentrifuge tubes and centrifuged at 12000 × g at 4 °C for 15 minutes. 100 μL of supernatant, was added to the substrate solution (30 mM sodium pyruvate) and then 6.6 mM NADH was added and the absorbance at 340 nm was measured using a spectrophotometer (TECAN, Switzerland). The LDH release in the samples was obtained by measuring the rate of NADH absorbance over time.22
Intracellular ROS detection by DCFDA assay
Reactive oxygen species (ROS) were estimated as per the method of Leekha et al23 using the cell permeable fluorescent and chemiluminescent probes. 2'-7'-Dichlorodihydrofluorescein diacetate (DCFH-DA) that directly measures the redox state of a cell. Briefly, 1 × 10⁶ Hep3B cells were seeded in a 6 well plate and treated with QDs for 24 hours followed by a 30 minutes incubation with DCFH-DA that indicates the intracellular ROS generation within the cell. The cells are incubated at 37 °C and kept in the dark. After incubation, the cells were washed with PBS and immediately the green fluorescence of cells was quantified in the fluorescence plate reader at a wavelength filter of excitation and emission between 485 nm-529 nm (TECAN, Switzerland). Qualitative analysis of ROS generation after 24 hours exposure of QDs was done using fluorescence microscopy. Briefly, Hep3B cells were cultured in 24 well culture plates over cover slips till they attained 90% confluence and treated with QDs at a concentration of 10 µg/mL for 24 hours. The treated cells were washed with PBS and DCFDA was added, then incubated for 30 minutes in dark at 37 °C, which was followed by washing with PBS and fixation with 4% paraformaldehyde, DPX mounting and visualization under fluorescent upright microscope (Nikon Eclipse 90i) at 20x.
Ex vivo hemolysis
Ex vivo hemolysis refers to the assessment of destruction red blood cell (RBC) outside the living organism. It provides insights into the safety and compatibility of these substances with blood cells. Hemolytic activity was assessed using whole blood, and the percentage of hemolysis was calculated according to a previously published protocol. In summary, heparinized blood obtained from normal Balb/c mice was washed twice with PBS (pH 7.4) before the assay. Then, 100 μL of red blood cells from the washed blood were suspended in PBS at a 1:1 ratio and treated for up to 2 hours at 37 °C with different concentrations of QDs (2.5 μg/mL, 5 μg/mL and 10 μg/mL). Post-incubation for 2 hours, the colour of lysed RBC were quantified using UV visible spectrophotometer (Bio-Tek, USA) and absorbance taken at 600nm. Triton X-100 was taken as a positive control while saline (pH 7.4) was used as the negative control.
Radiolabelling of QDs
Direct labelling method was used for radiolabelling of inverted core/shell QDs with 99mTcO4-. In brief, to 10-50 μL stannous chloride (2 mg/mL in 0.1 M acetic acid), 300 μL of QDs were added (300 μg/ml); then the pH was adjusted to 6.5 by 0.1M NaOH, and 100μL of 99mTcO4- (5 mCi; obtained by solvent extraction method from 99Mo) in saline was added to the resulting solution and it was incubated for 15 minutes. For subsequent studies, the so-obtained labelled formulations were stored in sterile evacuated sealed vials. The radiolabeled formulations were purified from free99mTcO4- and radiocolloids (reduced and hydrolyzed 99mTc) by passing them through a Sephadex G-20 column and then eluting with normal saline. Silica gel-coated fiber sheets (Gelman Science Inc., USA) were used for performing the ascending instant thin-layer chromatography (ITLC) to confirm the purity of the labelled formulations. The mobile phase used was Acetone. The so formed radiocolloids and the complex formulations were retained at the point of application, and the free 99mTcO4- was found to have the Rf of 0.9-1.0. Further, using well-type γ ray spectrometer, the radioactivity was counted (Type CRS 23 C, Electronic Corporation of India Ltd., India). The net amount of labelled formulation was calculated by subtracting the activity migrated with solvent front using acetone (corresponding to 99mTcO4-) from the counts at the base.24
In vitro stability evaluation
Evaluation of stability of 99mTc-labeled QD in human sera was performed by the method of Kaul A.25 To check for any dissociation of the radiolabelled complex, 99mTc radiolabelled QDs were incubated with Human serum at 37 °C, and then analysed by ITLC at different time-intervals. Acetone was used as a mobile phase and to estimate the percentage of free pertechnetate at a particular time point that represented the percentage dissociation of the complex at that particular time point in serum.
Pharmacokinetics
All the experiments carried out on animals were in accordance with the protocol approved by the Institutional Animal Ethical Committee (IAEC) under protocol number. Inbred, female Balb/cmice (20–25 g), 6 to 8 weeks old, were obtained from Animal Holding Facility and experiments were conducted under protocol number DU/KR/IAEC/2018/07. The studies were conducted as per the previously published standardized procedures.26 Female Balb/c mice were divided in three groups of four mice each and treated with Group I- PBS, Group II- ZnSe/CdSe, and Group III- CdS/CdSe, byintravenous routes. 100µCi of the 99mTc-QDs at a dose of 10 mg/kg body weight were administered via tail vein injection, after the animals were anesthetized. At predetermined intervals of 30 minutes, 1 hour, 1.5 hours, 2 hours, 3 hours, 4 hours, 20 hours, and 24 hours, blood was drawn in heparinised tubes. Well-type γ ray spectrometer was used to measure the count (Type CRS 23 C, Electronic Corporation of India Ltd., India).
Biodistribution
Inbred, female Balb/cmice (20–25 g), 6-to 8- weeks-old were procured from animal holding facility and studies were conducted by published standardized procedures.27 Female Balb/cmice divided in two groups of four mice each and treated with Group I- PBS and Group II- ZnSe/CdSe QDs byintravenous routes. All the experiments carried out on animals were adhered to the protocol approved by the IAEC. 2 × 10⁶ EAC cells were injected subcutaneous in the thigh of the right hind leg of female Balb/c mice and were allowed to grow into tumor. Measurable tumor appeared 7 days post inoculums (0.08 cm3). When palpable tumors were observed, 99mTc-labeled QDs at a dose of 10 mg/kg body weight of the animal were administered via tail vein injection. In this study, groups of 3 mice per 99mTc-formulation QDs were used. After 1 hour, 4 hours, and 24 hours, the mice were sacrificed by cervical dislocation, followed by dissection to obtain various tissues (lung, intestine, heart, liver, kidney, tail, spleen, muscle, stomach, and tumor) and blood. Thus obtained tissues were washed with PBS, pH 7.4 and were made free from adhering tissues. These tissues were then weighed and counted in a gamma counter calibrated for 99mTc energy. In each tissue, uptake of the radiotracer was calculated. Uptake of the radiotracer was expressed as percentage injected dose per gram of the tissue (% ID/g). A shielded well-type γ ray spectrometer was used to measure the radioactivity (Caprac-R, USA).
Gamma scintigraphic imaging
To enable qualitative estimation of 99mTc formulation QDs localization over time, imaging was performed in EAC cell line implanted tumour bearing mice. 100 μCi of the 99mTc labelled QDs. was administered through the tail vein injection. The mice were fixed on a board and imaging was performed after 2 hours and 24 hours post-administration of formulations, using a micro-single photon emission computerized tomography (Triumph Animal SPECT system, USA).
Statistical analysis
The results were expressed as mean ± SD. Group comparisons were analyzed using one-way ANOVA, and means were separated by Tukey’s test using Prism 5.0 software (Prism Software Inc., CA). Significance levels were accepted at P ≤ 0.05. All results are presented as replicates of three sets of experiments.
Results
The percent cytotoxicity of ZnSe/ CdS on HEK-293 was 8.09 ± 0.27%, 6.72 ± 0.19%, 6.49 ± 0.13% at 24 hours and 18.95 ± 0.24%, 17.10 ± 0.27%, 14.75 ± 0.09% at 48 hours at 10 µg/mL, 5 µg/mL and 2.5 µg/mL, respectively. Similarly, the percent cytotoxicity of ZnSe/ CdS on Hep3B was 25.61 ± 0.10%, 22.14 ± 0.08%, 16.01 ± 0.08% post 24 hours and 27.67 ± 0.01 %, 22.76 ± 0.09%, 18.06 ± 0.09% post 48 hours were observed at different concentrations i.e 10 µg/mL, 5 µg/mL and 2.5 µg/mL, respectively. Furthermore, in-vitro cytotoxicity of QDs was assessed using on murine cell line- Ehlrich Ascitic Carcinoma cell line.
In EAC cells, the percent cytotoxicity of ZnSe/ CdS QDs at 10 µg/mL, 5 µg/mL and 2.5 µg/mL was 50.02 ± 0.25%, 4.24 ± 0.13%, 1.00 ± 0.10 % post 24 hours and 54.62 ± 0.87%, 14.66 ± 0.72%, 2.16 ± 0.04% post 48 hours of incubation.
In this study, negligible LDH release was observed when HEK-293 cells were treated with 10 µg/mL ZnSe/CdS QDs (Fig. 1), thereby indicating that QDs were non-toxic towards normal cells.
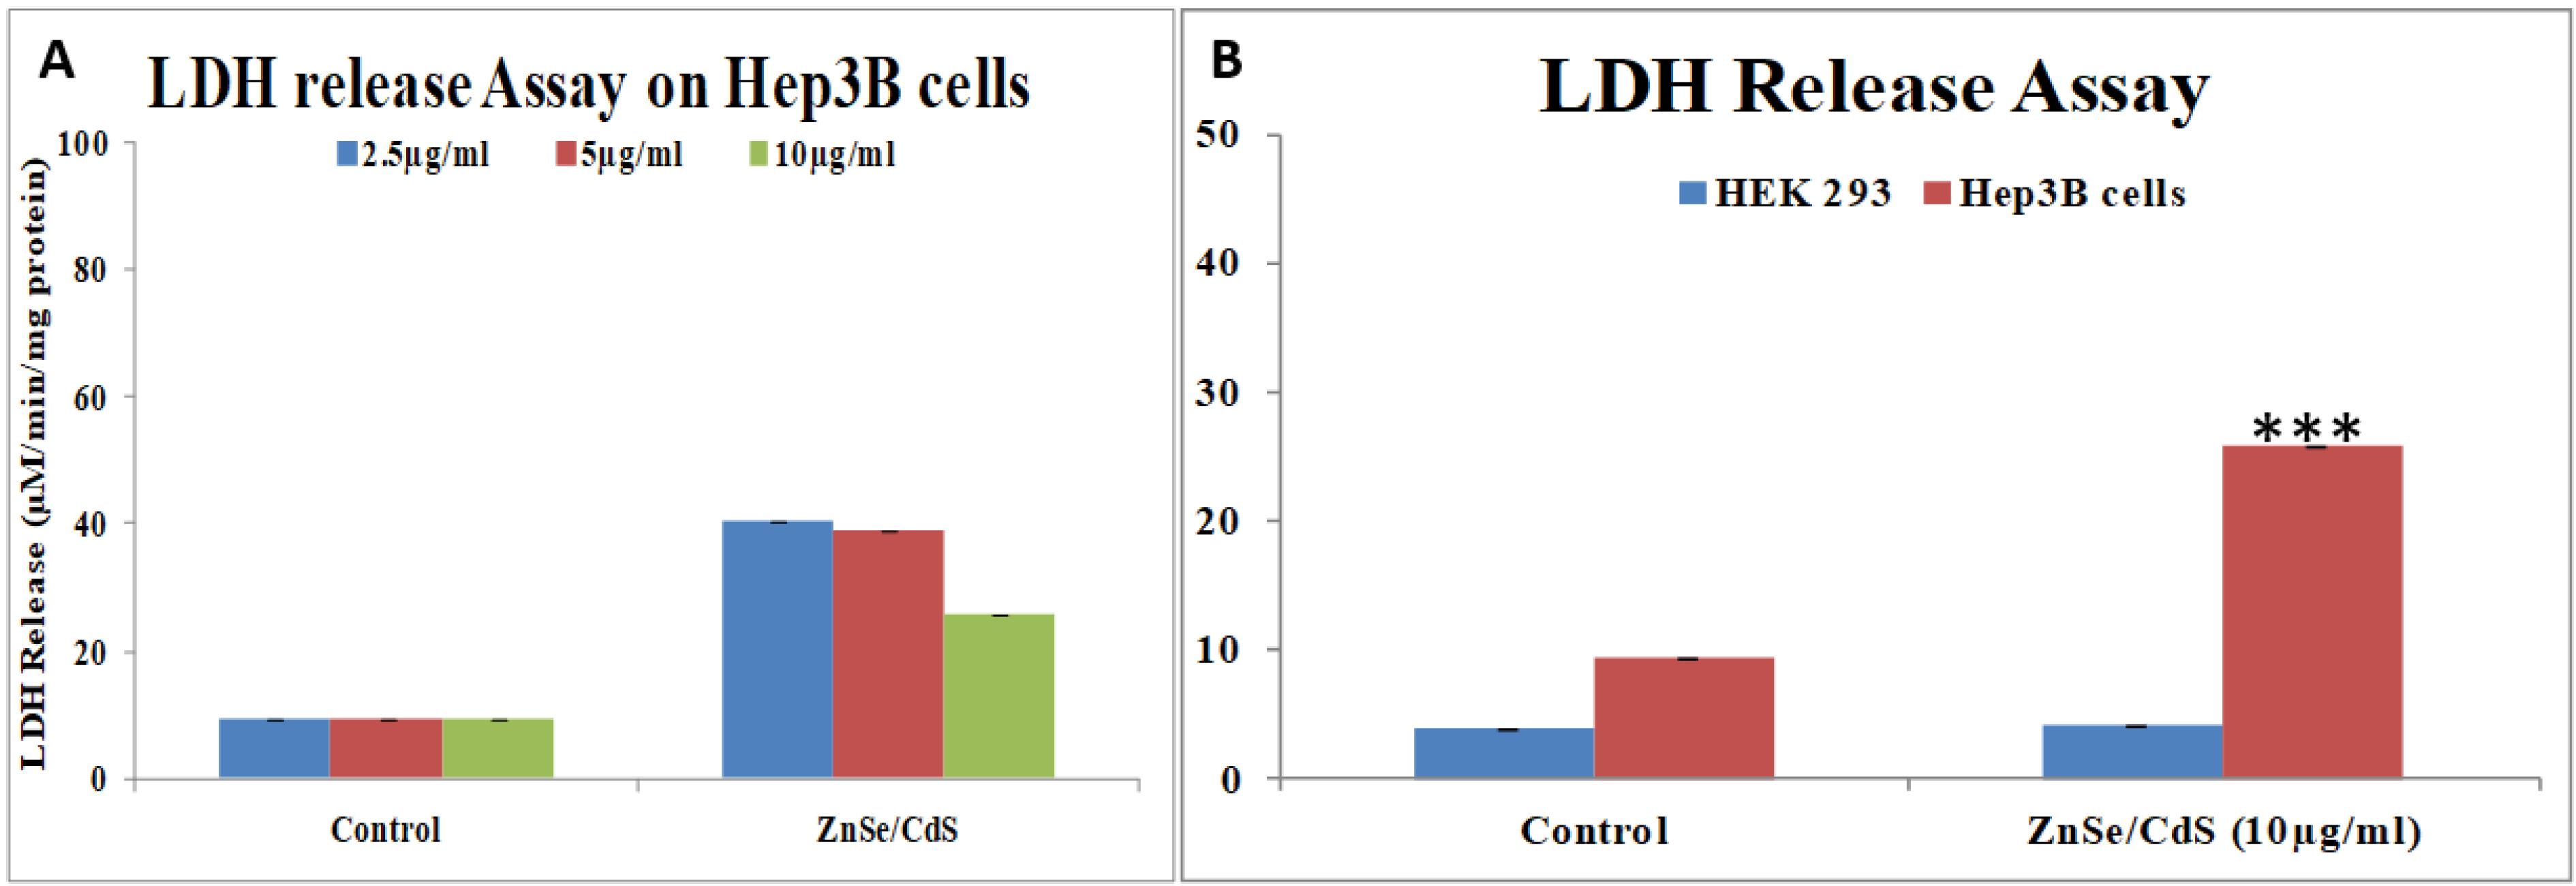
Fig. 1.
(A) Dose dependent assessment of membrane damage assessed by LDH release assay after 24 hours incubation of ZnSe/ CdS QDs at different concentrations. (B) Comparative assessment of membrane damage in HEK-293 and Hep3B cell line by LDH release assay when cells were exposed to highest concentration i.e. 10 μg/mL of QDs for 24 hours. Data represent the mean ± S.D. (n ≥ 3)from three independent experiments. *denotes significant differences between untreated control vs QDs treatment. *P < 0.05; ** P < 0.01; P < 0.001.
.
(A) Dose dependent assessment of membrane damage assessed by LDH release assay after 24 hours incubation of ZnSe/ CdS QDs at different concentrations. (B) Comparative assessment of membrane damage in HEK-293 and Hep3B cell line by LDH release assay when cells were exposed to highest concentration i.e. 10 μg/mL of QDs for 24 hours. Data represent the mean ± S.D. (n ≥ 3)from three independent experiments. *denotes significant differences between untreated control vs QDs treatment. *P < 0.05; ** P < 0.01; P < 0.001.
DCFDA assay showed the generation of ROS on treatment with ZnSe/CdS QDs in Hep3B cells when compared to HEK-293 cells (Fig. 2).
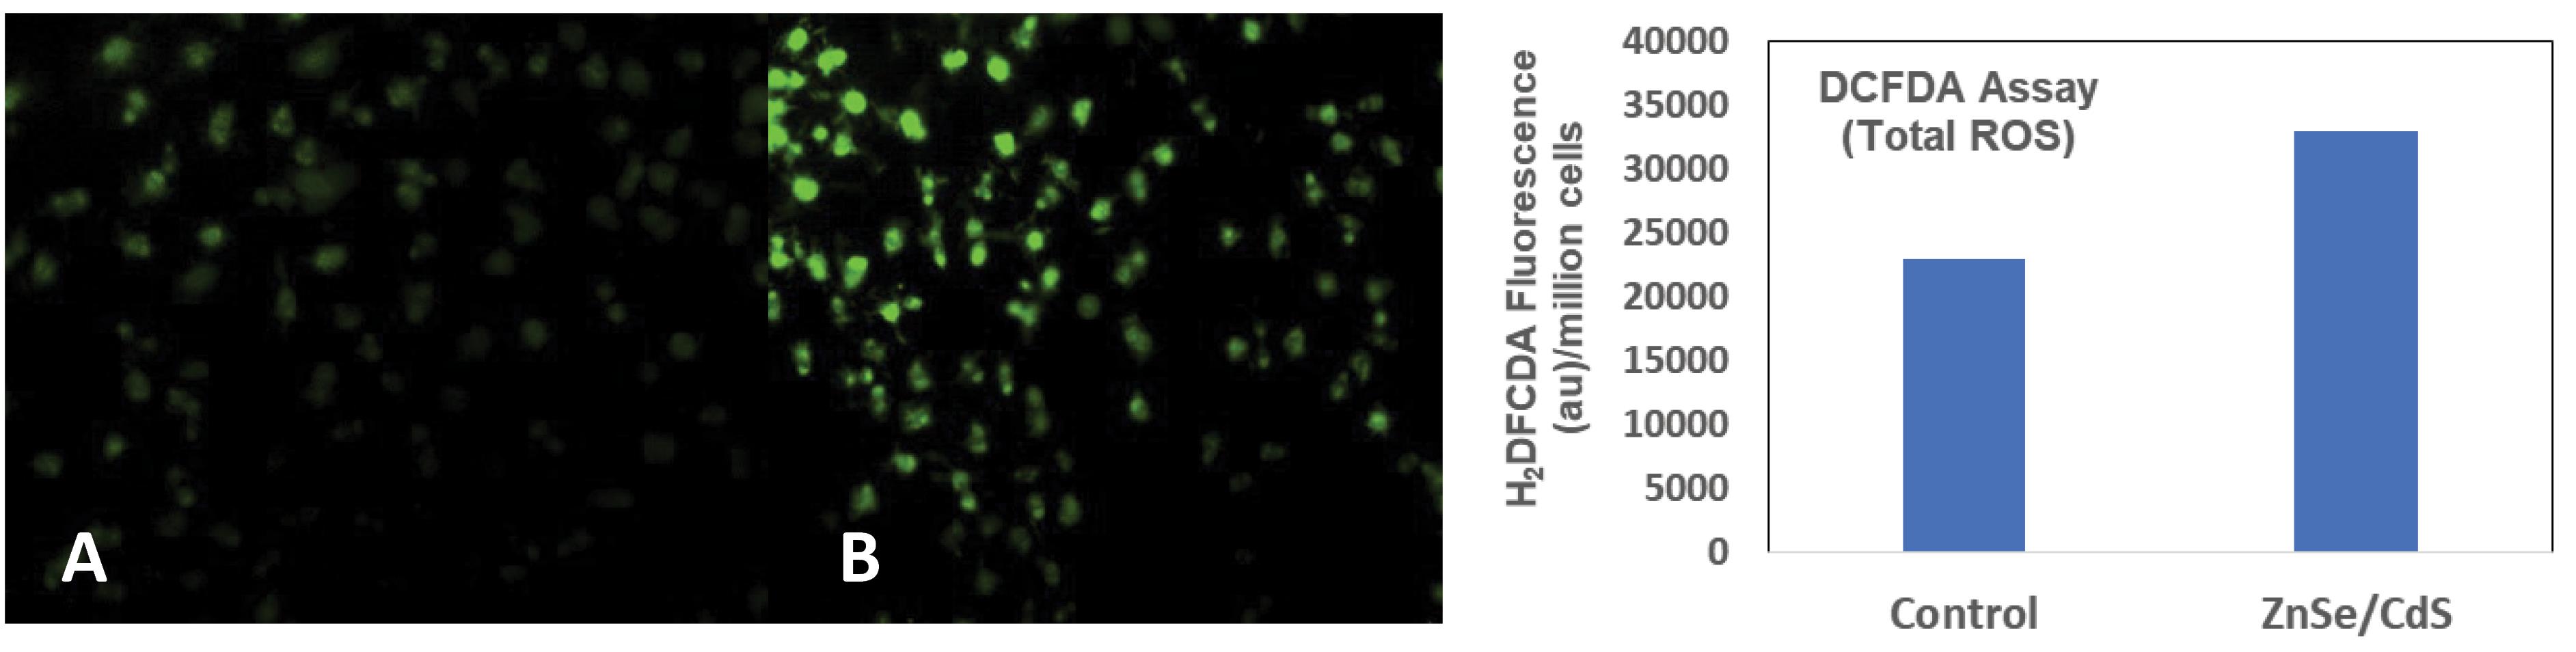
Fig. 2.
Photographs showing the qualitative estimation of intracellular ROS generation using DCFH-DA dye in Hep3B cells by fluorescent microscopy (20X). (A) Control and (B) ZnSe/CdS QDs along with the Quantitative estimation of ROS generation by QDs stimulation in Hep3B cells via fluorescent spectrophotometer.
.
Photographs showing the qualitative estimation of intracellular ROS generation using DCFH-DA dye in Hep3B cells by fluorescent microscopy (20X). (A) Control and (B) ZnSe/CdS QDs along with the Quantitative estimation of ROS generation by QDs stimulation in Hep3B cells via fluorescent spectrophotometer.
Hemolysis of QDs were done on human blood and Triton X-100 was used as positive control, while PBS, pH 7.4 as a negative control. Less than 5% hemolysis was observed which was regarded as non- toxic level (Fig. 3). All the labelling parameters such as pH, concentration of reducing agents (SnCl2), temperature etc. were standardized to achieve the maximum labelling efficiency. The high in vitro stability of QDs 99mTc-labeled ZnSe/CdS confirmed that no trans-chelation of the metal occurred in the physiological environment as substantiated by serum stability tests. The radiolabelled complexes thus prepared were found to be sufficiently stable in vitro as approximately only 8.8% of the 99mTc-labeled ZnSe/CdS complex dissociated in 24 hours (Fig. 3B).
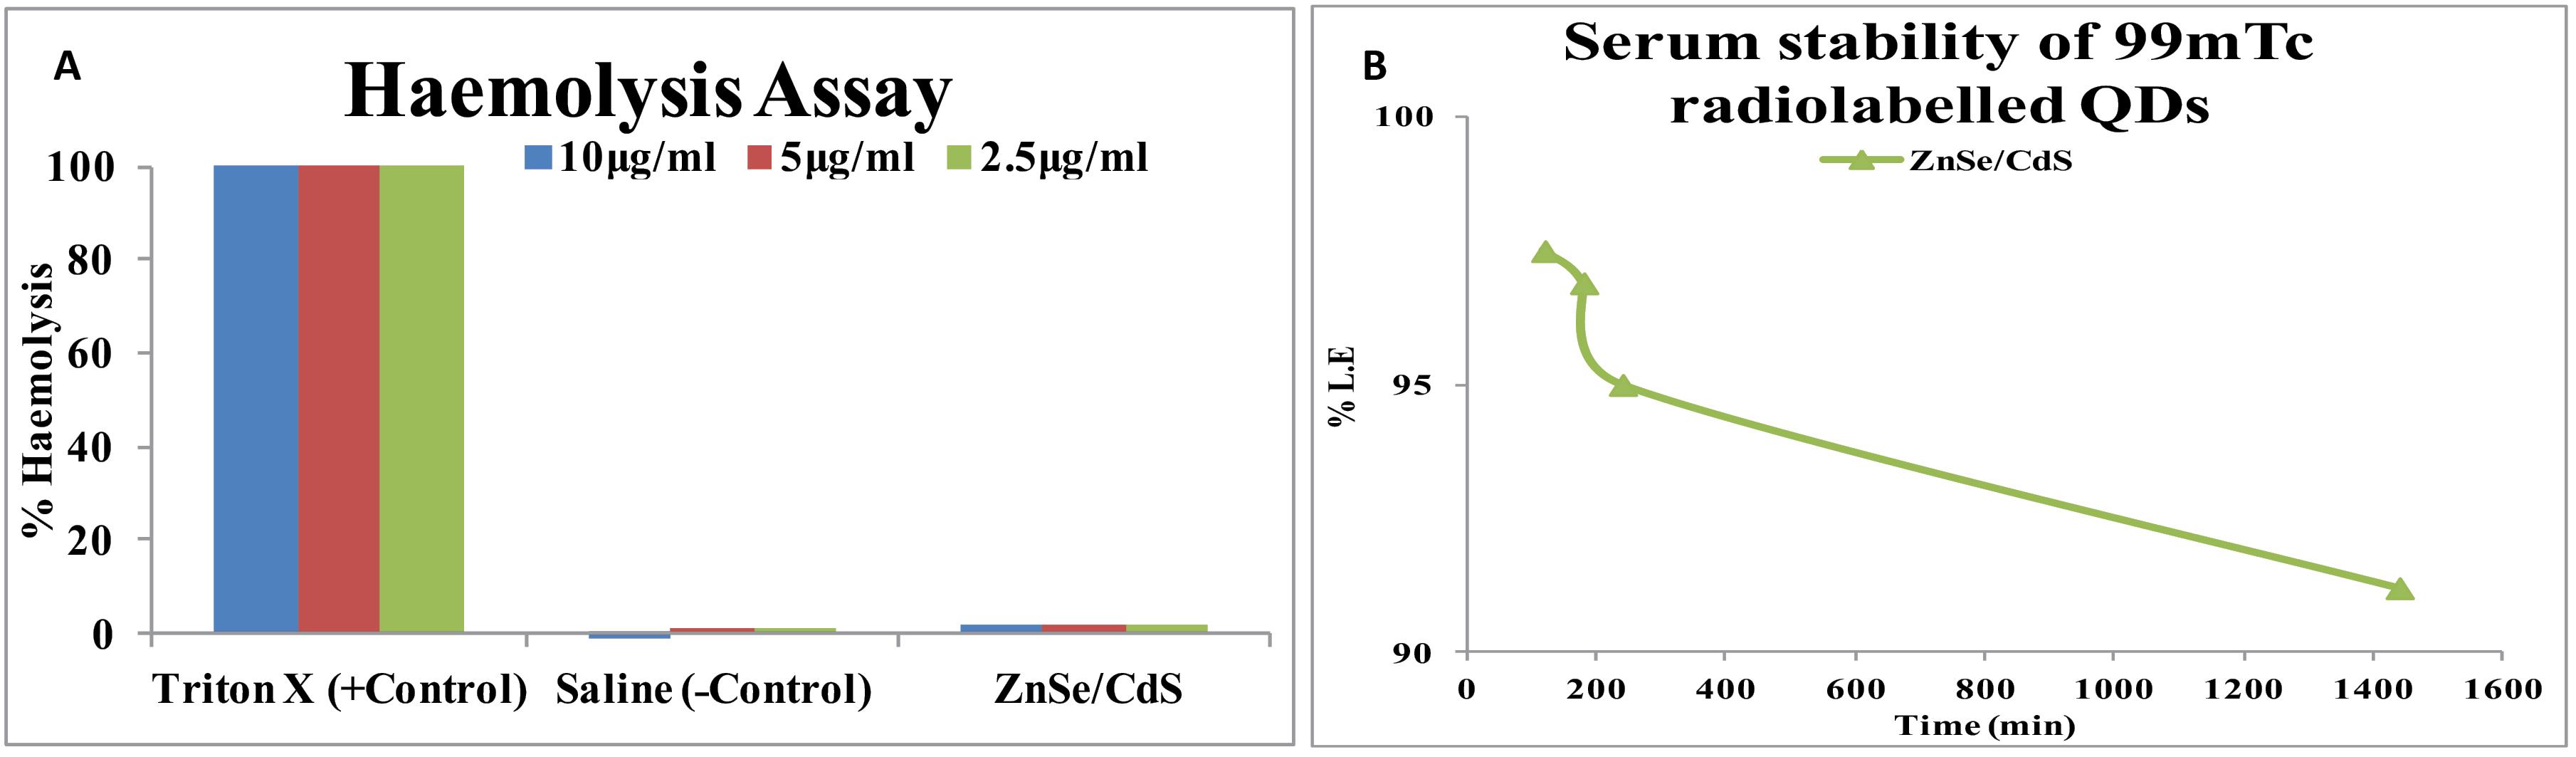
Fig. 3.
(A) Haemolysis activity of ZnSe/CdS QDs and saline was used as a negative control while Triton X-100 as positive control. (B) in vitro stability studies of 99mTc-ZnSe/ CdS QDs in human sera under physiological conditions, 99mTc: Technetium-99 m.
.
(A) Haemolysis activity of ZnSe/CdS QDs and saline was used as a negative control while Triton X-100 as positive control. (B) in vitro stability studies of 99mTc-ZnSe/ CdS QDs in human sera under physiological conditions, 99mTc: Technetium-99 m.
Pharmacokinetics of QDs in Balb/c at different time points indicated that 4.6% injected activity was present in case of ZnSe/ CdS QDs (Fig. 4). Biodistribution pattern of 99mTc–tagged ZnSe/ CdS QDs was observed at interval of 1 hour, 4 hours and 24 hours. Maximum injected dose was predominantly recovered from liver, kidney and spleen (Fig. 5). Negligible concentrations of QDs were found in lungs, heart, intestine, stomach, muscle, intestine, blood and t/m. Localization of 99mTc labelled QDs in Balb/c mice with EAC tumour was seen after 2 hours and 24 hours post-administration of QDs is presented in Fig. 6.

Fig. 4.
Graph depicting Pharmacokinetics of 99mTc-QDs in Balb/c mice showing the characteristic exponential decay. OA capped QDs were stable and could be detected even after 24 h post injection. The MRT observed was 15.4 h.
.
Graph depicting Pharmacokinetics of 99mTc-QDs in Balb/c mice showing the characteristic exponential decay. OA capped QDs were stable and could be detected even after 24 h post injection. The MRT observed was 15.4 h.
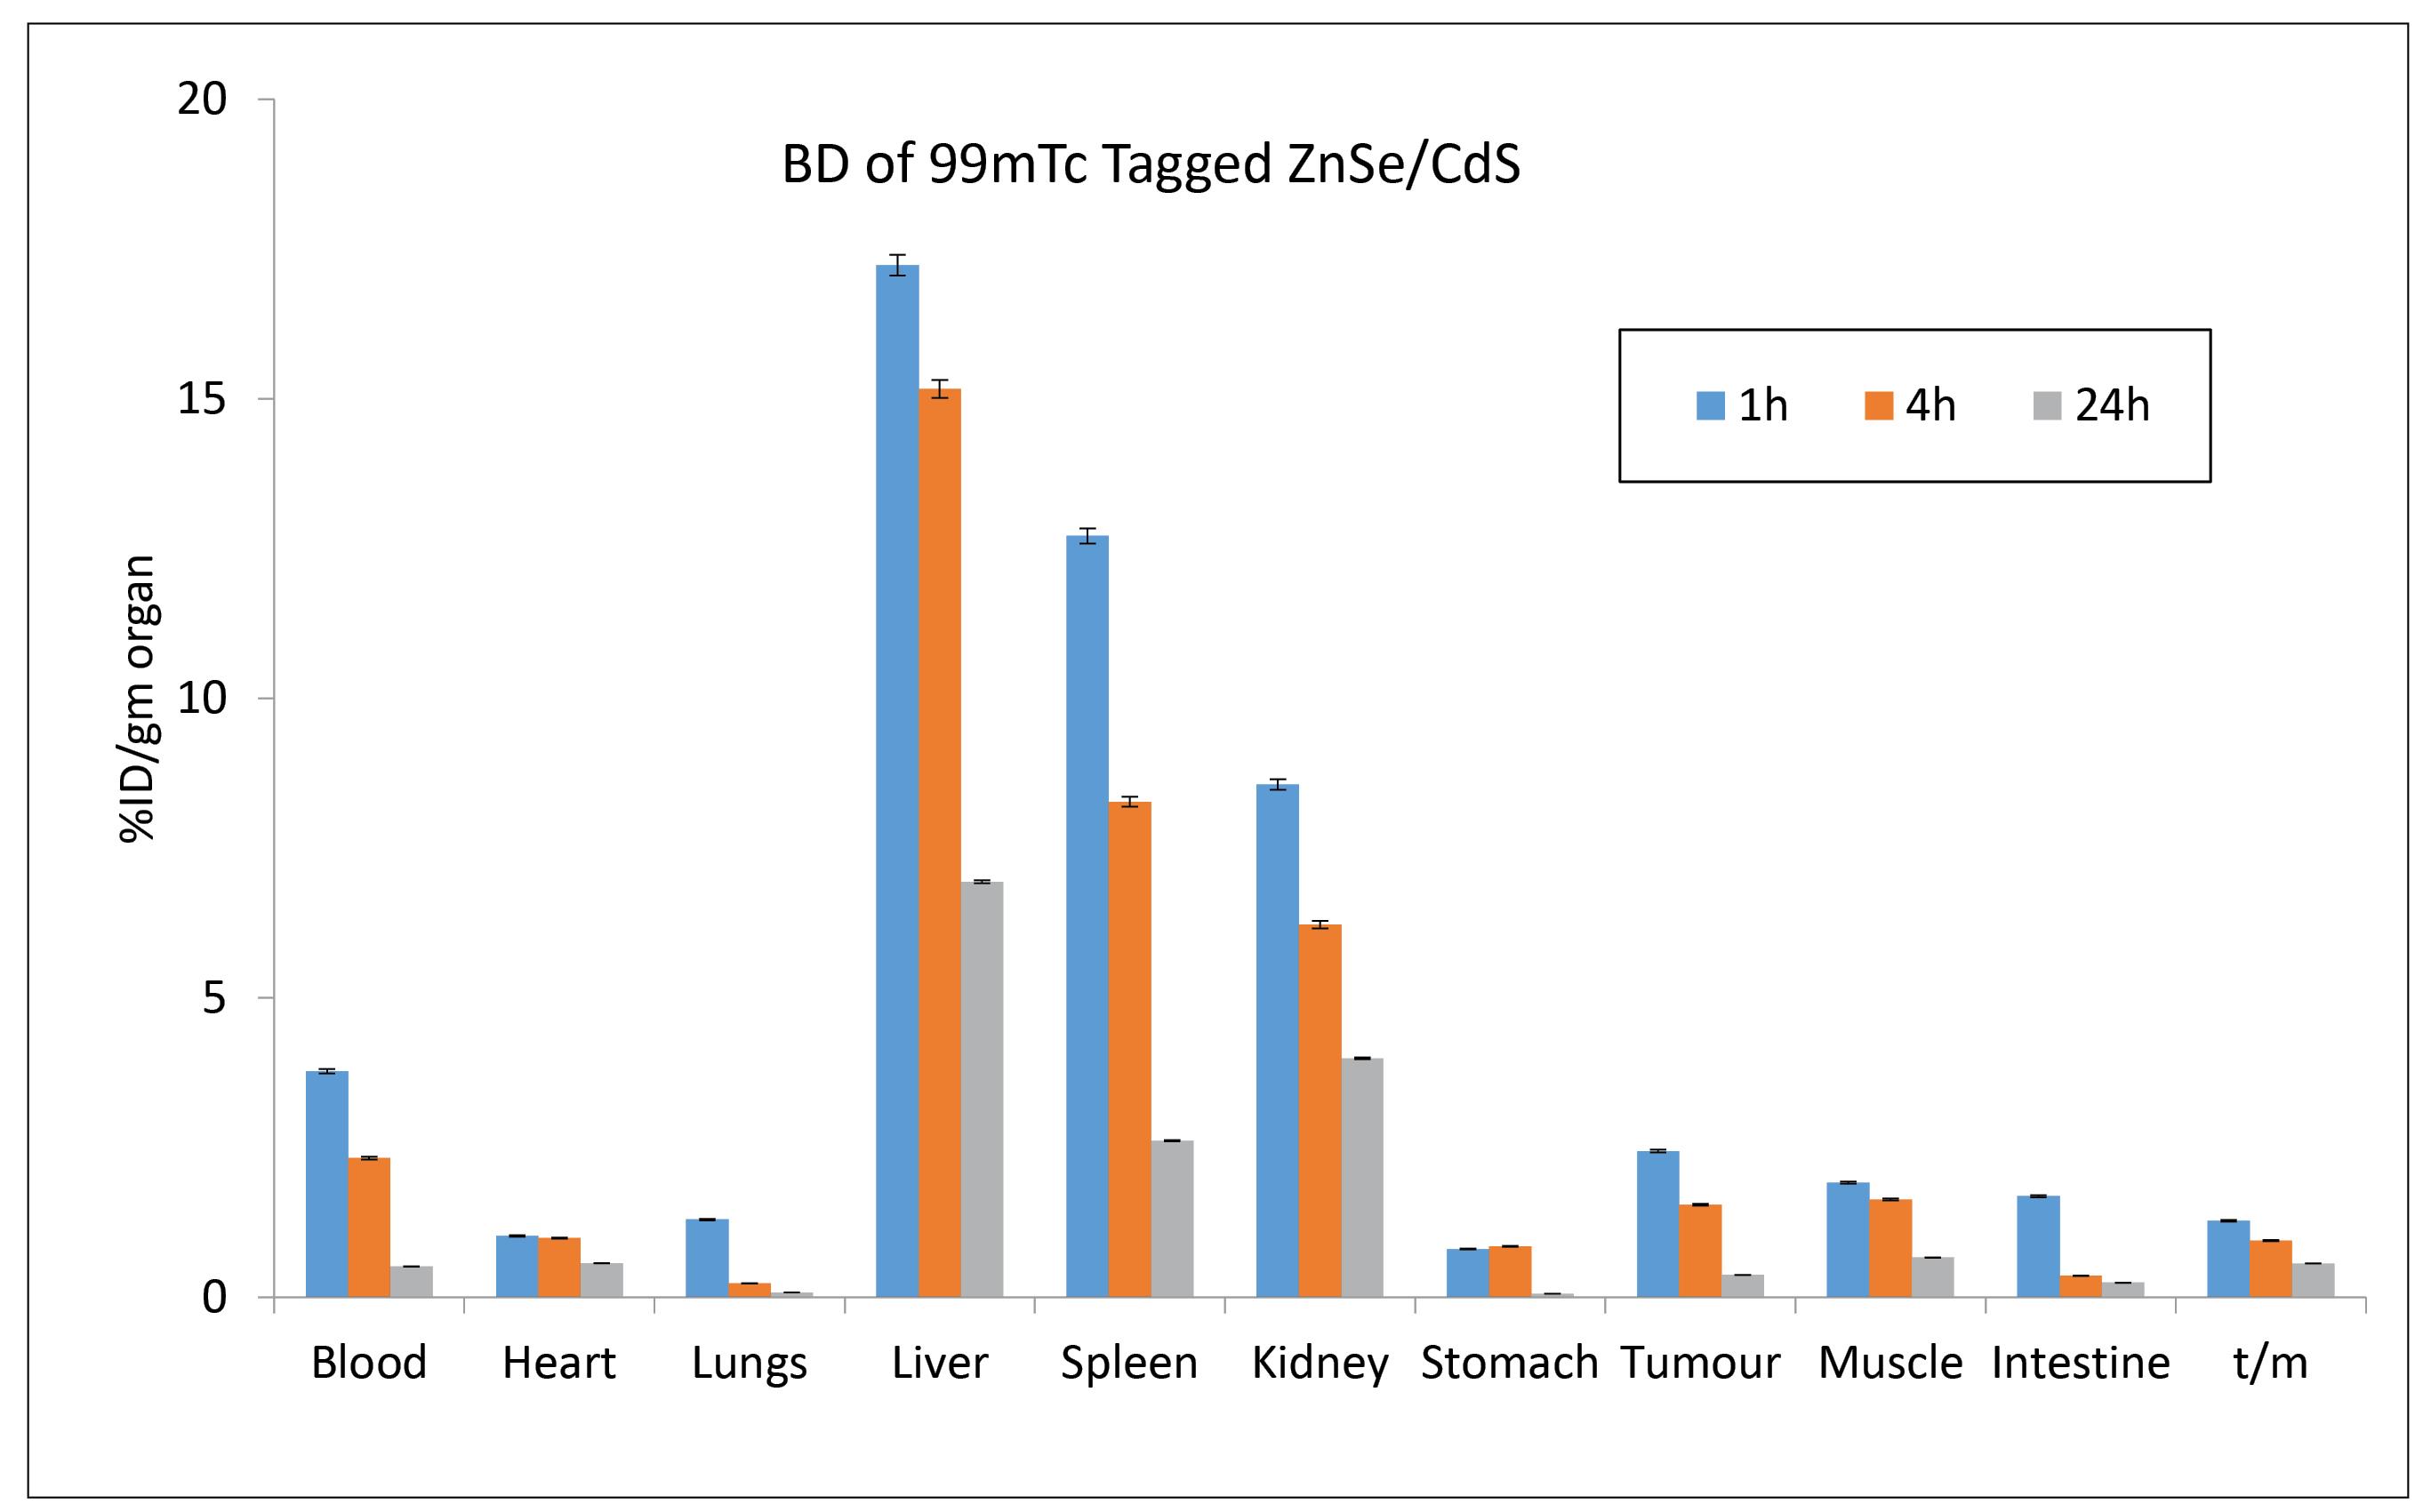
Fig. 5.
Accumulation of radiolabelled ZnSe/ CdS QDs (in milligrams) in various tissues e.g. blood, heart, lungs, liver, spleen, kidneys, stomach, intestine, muscles, and tumor. 5 mCi 99mTc activity measured per gram of organ excised after the intravenous administration of 99mTc–labelled ZnSe/ CdS QDs.Data in the table are expressed as mean % ID/g (percent injected dose per gram) of tissue.
.
Accumulation of radiolabelled ZnSe/ CdS QDs (in milligrams) in various tissues e.g. blood, heart, lungs, liver, spleen, kidneys, stomach, intestine, muscles, and tumor. 5 mCi 99mTc activity measured per gram of organ excised after the intravenous administration of 99mTc–labelled ZnSe/ CdS QDs.Data in the table are expressed as mean % ID/g (percent injected dose per gram) of tissue.
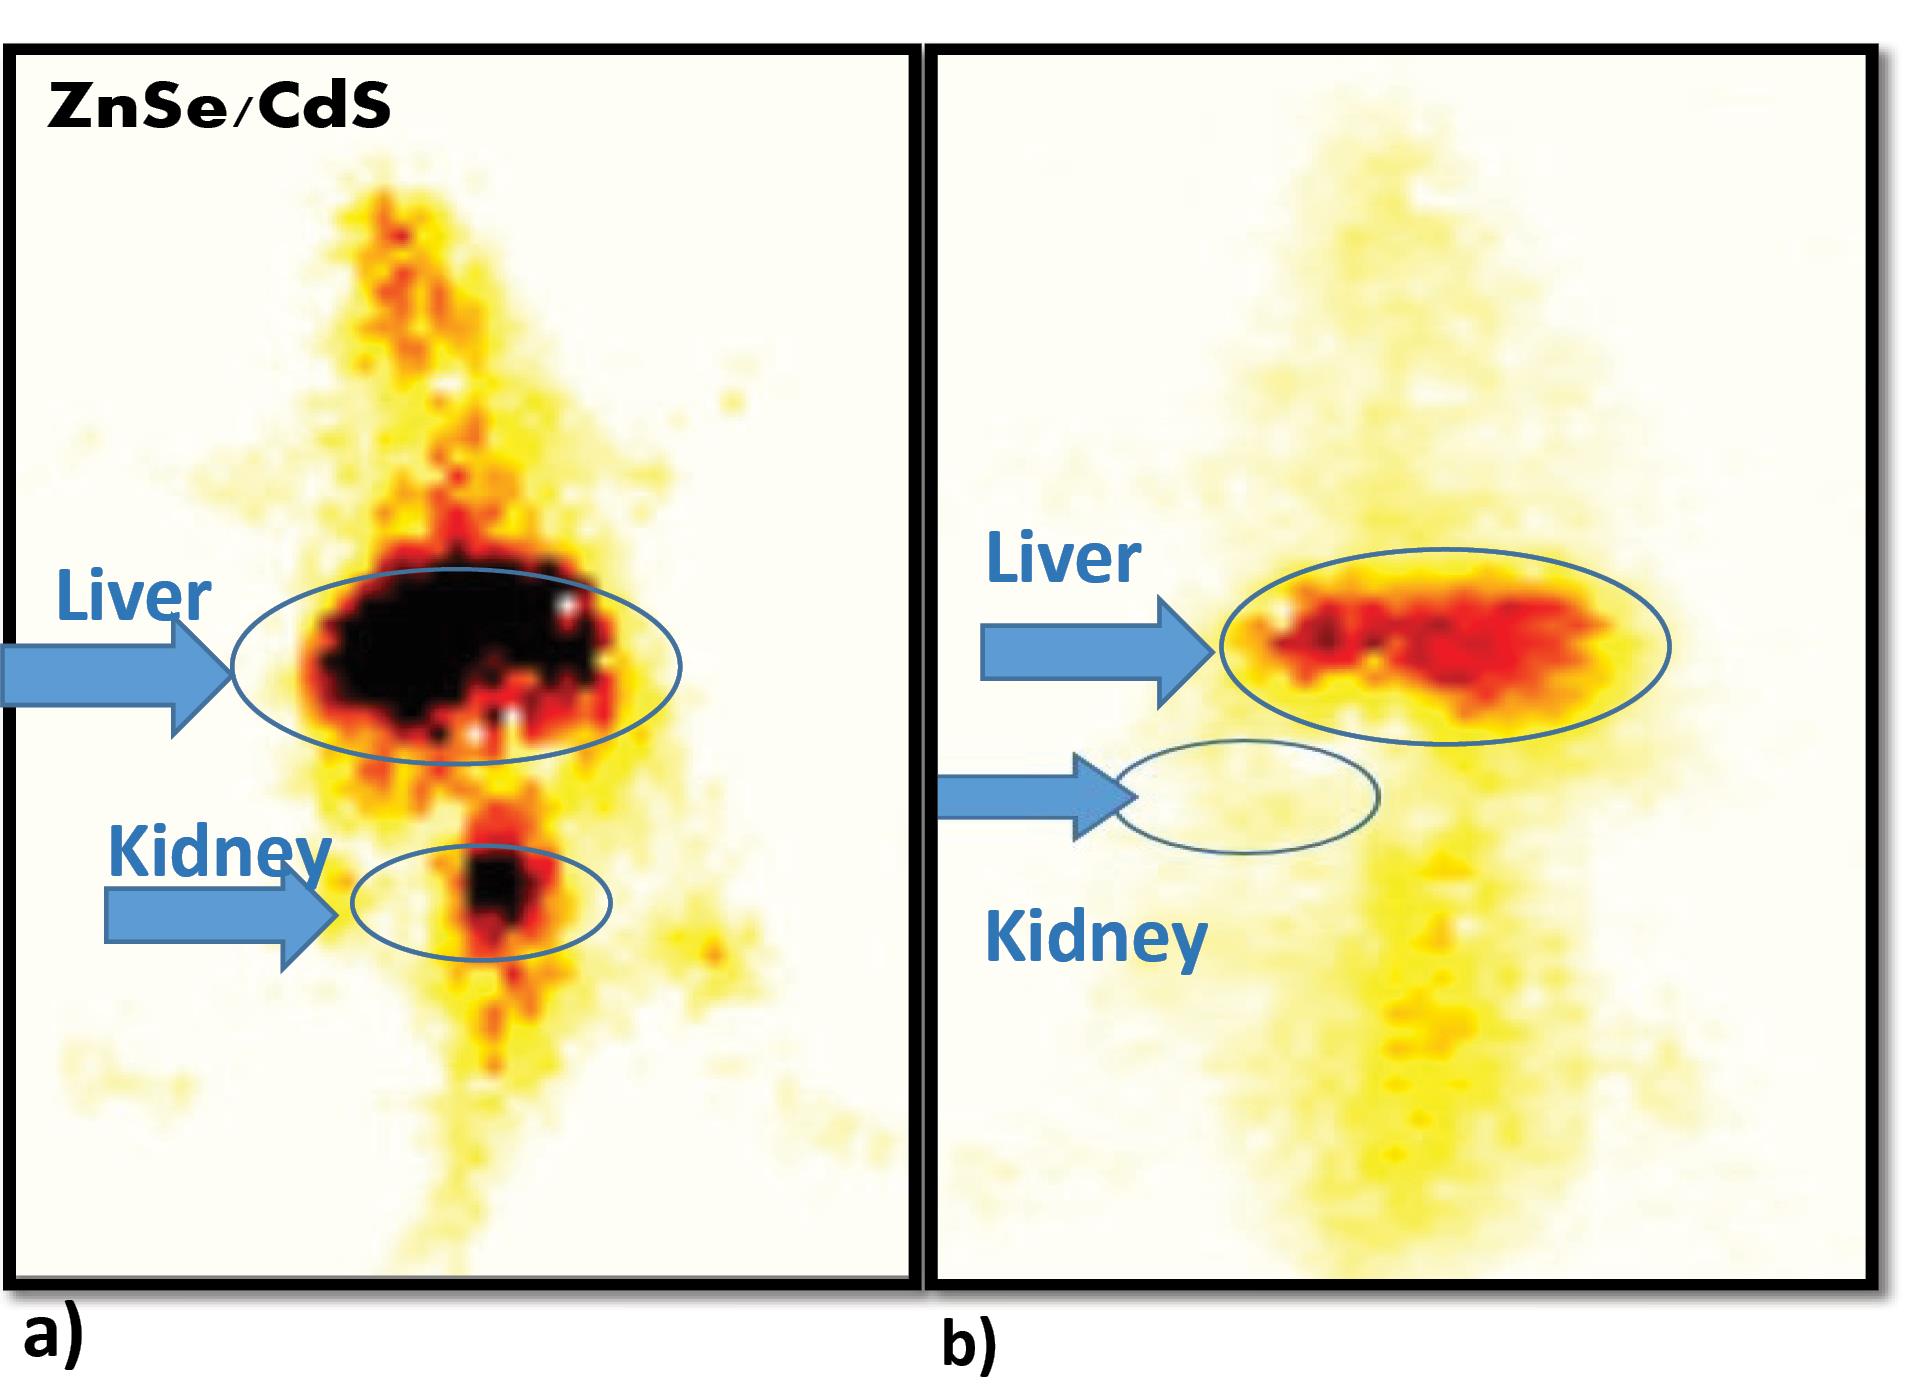
Fig. 6.
Whole body scintigraphy images of radiolabelled 99mTc-QDs in Balb/c mice post- intravenous administration of 99mTc–labelled ZnSe/ CdS QDs a) post 2 hours and (b) post 24 hours via SPECT imaging with arrows indicating the maximum accumulation in liver post 2 hours of injection and minimal accumulation of 99mTc-QDs in kidney post 24 hour indicating negligible nephrotoxicity of QDs.
.
Whole body scintigraphy images of radiolabelled 99mTc-QDs in Balb/c mice post- intravenous administration of 99mTc–labelled ZnSe/ CdS QDs a) post 2 hours and (b) post 24 hours via SPECT imaging with arrows indicating the maximum accumulation in liver post 2 hours of injection and minimal accumulation of 99mTc-QDs in kidney post 24 hour indicating negligible nephrotoxicity of QDs.
Discussion
Semiconductor QDs have been used in various biomedical application including anti-cancer activities. To date, relatively few studies have been reported for in vivo biodistribution and toxicology assessment of QDs. The reported QDs have also shown potential anticancer efficacy (Table 1). ZnSe/CdS QDs were non- toxic to HEK-293 cells. The calculated IC50 of ZnSe/CdS was 21.58 µg/mL at 48 hours against HEK-293 cells, and the IC50 of ZnSe/CdS post 24 hours was calculated as 29.85 µg/mL and 27.78 µg/mL post 48 hours against Hep3B cell line. The MTT assay revealed that the HEK-293 cells were less susceptible to QDs, but Hep3B cell lines were highly susceptible to QDs (Fig. S1, Supplementary file 1). The IC50 of ZnSe/CdS on EAC cell lines post 24 hours at a concentration of 10.40 µg/mL and 9.503 µg/mL post 48 hours. It was essential to validate the toxicity in mouse cell lines before doing the in vivo validation in terms of pharmacokinetic and biodistribution studies.
Table 1.
Enumeration of the percent cytotoxicity in HEK- 293, Hep3B and EAC cell line at various time points
|
Groups
|
Hours
|
HEK-293
|
Hep3B
|
EAC
|
|
10 µg/mL
|
5 µg/mL
|
2.5 µg/mL
|
10 µg/mL
|
5 µg/mL
|
2.5 µg/mL
|
10 µg/mL
|
5 µg/mL
|
2.5 µg/mL
|
| ZnSe/ CdS |
24 |
8.09 ± 0.27 |
6.72 ± 0.19 |
6.49 ± 0.13 |
25.61 ± 0.10### |
22.14 ± 0.08+ |
16.01 ± 0.08* |
50.02 ± 0.25### |
4.24 ± 0.13+ + |
1.00 ± 0.10** |
| 48 |
18.95 ± 0.24 |
17.10 ± 0.27 |
14.75 ± 0.09 |
27.67 ± 0.01## |
22.76 ± 0.09+ + + |
18.06 ± 0.09*** |
54.62 ± 0.87## |
14.66 ± 0.72+ + + |
2.16 ± 0.04*** |
* denotes significant difference between control HEK-293 vs Hep3B and EAC of ZnSe/CdS conc. 2.5 µg/mL.
+ denotes significant difference between control HEK-293 vs Hep3B and EAC of ZnSe/CdS conc. 5 µg/mL.
# denotes significant difference between control HEK-293 vs Hep3B and EAC of ZnSe/CdS conc. 10 µg/mL.
*P < 0.05; ** P < 0.01; P < 0.001.
The LDH leakage assay was further used to validate the possible membrane damage induced by elevated levels of ROS. ZnSe/CdS QDs at 10µg/mL concentration exhibited LDH release in Hep3B cells (Fig. 1). The results are in unison with reports on neuroblastoma cells treated with CdSe/ZnS for 24 hours induced significant membrane damage at concentrations as low as 1 pM.28
To better understand the molecular mechanism in causing cell cytotoxicity, we performed a series of additional assays. The levels total oxidative stress induced by QDs in-vitro was measured based on the diffusion of DCFDA into the cell where it gets deacetylated by the cellular esterases to a non-fluorescent compound. This was later oxidized by the induced ROS into 2', 7'-dichlorofluorescein (DCF). Oxidation of DCFH by ROS converts the molecule to DCF, which emits green the fluorescence at an ex/em wavelength of 485 nm and 530 nm, respectively. Therefore, the fluorescence is directly proportional to the total oxidative stress produced by the cell. The generation of ROS is one of the main responses that happen when macrophages interact with foreign bodies which is here represented by QDs. Hence macrophages and their responses towards QDs are crucial in understanding the QD toxicity.29 ZnSe/CdS QDs induced elevated ROS in Hep3B cell line when compared to the untreated control (Fig. 2). The results were in unison with the previous reports on Cd containing QDs- which elevated the intracellular ROS production at 1 pM concentration in lung carcinoma and neuroblastoma cell line.28
Hemolytic test was performed as a supporting information for evaluation of biocompatibility and as a sensitive measure for the assessment of ZnSe/CdS QDs effect on erythrocytes. Less than 5% hemolysis, which was regarded as low toxicity level (Fig. 3). Our results were in unison with the studies of hemolysis caused by CdS-QDs bionanocomposite at concentration of 100 µg/mL. The observed hemolysis was ~3 %, which was in the permissible limit for therapeutic applications.30
The half-life of our QDs was 10.63 hours (Table 2). Similarly, the blood circulation curve showed a blood circulation half-life of 3.66 hour for PEGylated-Ag2S QDs.31 Also some researchers have reported that the circulating half-lives in mice were 12–70 minutes for QD630, QD645, and QD655.32
Table 2.
Pharmacokinetic parameters of 99mTc-ZnSe/CdS QDs
|
Parameter/Unit
|
Unit
|
ZnSe/CdS
|
| Elimination Rate Constant (Kd) |
1/h |
0.0651 |
| Half Life Time (t1/2) |
h |
10.63 |
| Maximum Time (Tmax) |
h |
0.5 |
| Maximum Concentration (Cmax) |
Counts |
4.67 |
| Minimum Concentration (Cmin) |
Counts |
0.87 |
| Area Under Curve (AUC0-1) |
Counts*h |
53.20 |
| Mean Residence Time (MRT0-inf obs) |
h |
15.34 |
Biodistribution pattern of 5mCi 99mTc labelled QDs (300 µg/mL) in Balb/c at 1 hour, 4 hours and 24 hours, shows maximum accumulation in liver (20.6% in 1 hour) (Fig. 5). The pattern of accumulation of QDs was in the order of maximum in liver > kidney > spleen. In case of kidney, post 1hour, the observed concentration was 6.21% and after 4 hours the concentration was slightly decreased to 3.92% which was in unison with the work done by Akerman, wherein they reported accumulation of ZnS-capped CdSe QDs in specific tissues by varying the coatings. Along with this QDs were accumulated in both spleen and liver in addition to the intended target tissues.33 The much higher uptake of the liver versus the spleen was partially due to the larger size of the liver, resulting in a higher fraction of dose sequestered.34 With the passage of time there was also substantial increase in the accumulation in the urinary bladder. The uptake of 99mTc–tagged QDs in stomach, where free technetium is accumulated, was quite low. Therefore, the labelled QDs exhibited positive aspects like low stomach uptake and fast renal clearance, hence decreasing the possibility of radiation exposure to the body. These observations are clearly shown in the whole body scintigraphic images (Fig. 6). Researchers also reported that whole body fluorescence imaging studies showed that QDs were present in lymph nodes, liver, and bone marrow for a month after intravenous (IV) dosing.35 Additionally, studies demonstrated the presence of QDs in the liver, kidneys, spleen, and lungs for up to 7 days without causing toxicity to the mice. This suggests that some QDs underwent intracellular degradation and released degraded precursors containing cadmium for renal excretion. These pioneering studies utilized the fluorescence properties of QDs, providing crucial information about the fate of QDs in animals. However, due to the dependence of fluorescence on its microenvironment, these studies are generally qualitative. Therefore, quantitative pharmacokinetic studies of QDs were needed. In a recent publication, scientists reported the pharmacokinetics, tissue sequestration, and distribution of two QDs synthesized by them in male Sprague-Dawley rats. Upon entering tissues and blood, QDs might affect physiological functions, but our studies proved that QDs were not toxic to red blood cells. Tissue distribution of ZnSe/CdS QDs were investigated. Throughout the study, the health and behaviour of the animals were normal. The distribution of the QDs was observed in the liver, kidneys spleen and lung, but was not observed in the brain and heart. The liver and spleen and liver exhibited the highest accumulation of QDs followed by lungs whereas kidneys had complete clearance with negligible retention. Our study also indicated negligible changes in the body weight or organ weight index proving negligible toxicity of the QDs. However, a systematic in vivo toxicology studies including biochemical, histological and hematological parameters are required to further validate their biosafety.
Conclusion
We report oleic acid capped ZnSe/ CdS QDs that were safe and biocompatible. In this study, we established the potential anticancer efficacy of QDs, as they were non- toxic to HEK-293 cells. The anti-cancer activity was evident by the elevated levels of oxidative stress observed by DCFDA assay and the loss of cell membrane integrity. Pharmacokinetics indicated the increased half-life that will facilitate retention at the inflamed and the tumour site. Also, enhanced circulation did not show any damage to erythrocytes. Further, biodistribution studies indicated the accumulation in liver and spleen and no retention in kidney or lung. This validates the biosafety of the reported QDs. Because surface modification is of great importance to render toxicity to QDs, the optimal surface modification should be considered and oleic acid was selected to reduce the potential adverse toxicity of ZnSe/ Cds QDs for biological applications.
Research Highlights
What is the current knowledge?
-
Semiconductor QDs have been used for various biomedical applications like gene technology, fluorescent labelling, cellular tracking, detection and imaging.
What is new here?
-
Our Current study ZnSe/CdS QDs exhibited enhanced anti-cancer efficacy against Hep3B (Hepatocarcinoma) and EAC (Ehrlich ascites carcinoma) cell line.
-
Further, minimum accumulation and retention were observed in vital organs in Balb/c mice protecting them from potential adverse side effects, underlining their potential for biomedical applications.
Competing Interests
All authors declare that they have no conflict of interest.
Ethical Approval
This article does not contain any studies with human participants performed by any of the authors. All procedures performed in studies involving animals were in accordance with the ethical standards of the institution or practice at which the studies were conducted. All the experiments carried out on animals were adhered to the protocol approved by the IAEC under protocol number. Inbred, female Balb/cmice (20–25 g), 6 to 8 weeks old, were obtained from Animal Holding Facility with protocol number DU/KR/IAEC/2018/07.
Supplementary files
Supplementary file 1 contains Fig. S1.
(pdf)
Acknowledgements
This work was done without any financial assistance. The QDs used in this study were a kind gift from DIAT, Pune. Authors are also thankful to Mr. Rajeev Kumar for his assistance in animal work.
References
- Hamidu A, Pitt WG, Husseini GA. Recent breakthroughs in using quantum dots for cancer imaging and drug delivery purposes. Nanomaterials (Basel) 2023; 13:2566. doi: 10.3390/nano13182566 [Crossref] [ Google Scholar]
- Ruzycka-Ayoush M, Kowalik P, Kowalczyk A, Bujak P, Nowicka AM, Wojewodzka M. Quantum dots as targeted doxorubicin drug delivery nanosystems in human lung cancer cells. Cancer Nanotechnol 2021; 12:8. doi: 10.1186/s12645-021-00077-9 [Crossref] [ Google Scholar]
- Hens B, Smothers J, Rizvanovic H, Patel R, Wu Q, Kim K. The future of anticancer drugs: a cytotoxicity assessment study of CdSe/ZnS quantum dots. J Nanotheranostics 2020; 1(1):19-38. doi: 10.3390/jnt1010003 [Crossref] [ Google Scholar]
- Niveria K, Singh P, Yadav M, Verma AK. Quantum dot (QD)-induced toxicity and biocompatibility. In: Korotcenkov G, ed. Handbook of II-VI Semiconductor-Based Sensors and Radiation Detectors: Volume 1, Materials and Technology. Cham: Springer. 2023. p. 181-211. 10.1007/978-3-031-19531-0_8.
- Field LD, Chen YC, Delehanty JB. Semiconductor quantum dots for visualization and sensing in neuronal cell systems. In: Wright NJ, ed. Basic Neurobiology Techniques. New York, NY: Springer. 2020. p. 1-18. 10.1007/978-1-4939-9944-6_1.
- Malik P, Gulia S, Kakkar R. Quantum dots for diagnosis of cancers. Adv Mater Lett 2013; 4:811-22. doi: 10.5185/amlett.2013.3437 [Crossref] [ Google Scholar]
- Chen F, Gerion D. Fluorescent CdSe/ZnS nanocrystal−peptide conjugates for long-term, nontoxic imaging and nuclear targeting in living cells. Nano Lett 2004; 4:1827-32. doi: 10.1021/nl049170q [Crossref] [ Google Scholar]
- Alivisatos AP, Gu W, Larabell C. Quantum dots as cellular probes. Annu Rev Biomed Eng 2005; 7:55-76. doi: 10.1146/annurev.bioeng.7.060804.100432 [Crossref] [ Google Scholar]
- Brkić S. Applicability of quantum dots in biomedical science. In: Djezzar B, ed. Ionizing Radiation Effects and Applications. IntechOpen. 2018. p. 21-39. 10.5772/intechopen.71428.
- Wagner AM, Knipe JM, Orive G, Peppas NA. Quantum dots in biomedical applications. Acta Biomater 2019; 94:44-63. doi: 10.1016/j.actbio.2019.05.022 [Crossref] [ Google Scholar]
- Abdellatif AA, Younis MA, Alsharidah M, Al Rugaie O, Tawfeek HM. Biomedical applications of quantum dots: overview, challenges, and clinical potential. Int J Nanomedicine 2022; 17:1951-70. doi: 10.2147/ijn.S357980 [Crossref] [ Google Scholar]
- Tyagi A, Kumari N, Leekha A, Mittal D, Verma AK. Core shell quantum dots induced apoptosis in human hepatocellular carcinoma cells via Reactive oxygen species-mediated mitochondrial-dependent pathway. Int J Life Sci Res 2019; 7:518-30. [ Google Scholar]
- Verfaillie T, Garg AD, Agostinis P. Targeting ER stress induced apoptosis and inflammation in cancer. Cancer Lett 2013; 332:249-64. doi: 10.1016/j.canlet.2010.07.016 [Crossref] [ Google Scholar]
- Hotokezaka Y, van Leyen K, Lo EH, Beatrix B, Katayama I, Jin G. alphaNAC depletion as an initiator of ER stress-induced apoptosis in hypoxia. Cell Death Differ 2009; 16:1505-14. doi: 10.1038/cdd.2009.90 [Crossref] [ Google Scholar]
- He N, Shi X, Zhao Y, Tian L, Wang D, Yang X. Inhibitory effects and molecular mechanisms of selenium-containing tea polysaccharides on human breast cancer MCF-7 cells. J Agric Food Chem 2013; 61:579-88. doi: 10.1021/jf3036929 [Crossref] [ Google Scholar]
- Bhandary B, Marahatta A, Kim HR, Chae HJ. An involvement of oxidative stress in endoplasmic reticulum stress and its associated diseases. Int J Mol Sci 2012; 14:434-56. doi: 10.3390/ijms14010434 [Crossref] [ Google Scholar]
- Bhanoth S, More PV, Jadhav A, Khanna PK. Core–shell ZnSe–CdSe quantum dots: a facile approach via decomposition of cyclohexeno-1, 2, 3-selenadiazole. RSC Adv 2014; 4:17526-32. doi: 10.1039/c4ra00676c [Crossref] [ Google Scholar]
- Bhanoth S, Kshirsagar A, Khanna PK, Tyagi A, Leekha A, Kumar V. Synthesis, characterization and bio-evaluation of core-shell QDs with ZnSe, CdS and CdSe combinations. Adv Mater Lett 2017; 8:352-61. doi: 10.5185/amlett.2017.6495 [Crossref] [ Google Scholar]
- Bhanoth S, Kshirsagar AS, Khanna PK, Tyagi A, Verma AK. Biotoxicity of CdS/CdSe core-shell nano-structures. Adv Nanopart 2016; 5:1-8. doi: 10.4236/anp.2016.51001 [Crossref] [ Google Scholar]
- Bhanoth S, Tyagi A, Verma AK, Khanna PK. Cytotoxicity studies of II-VI semiconductor quantum dots on various cancer cell lines. Adv Mater Lett 2017; 8:368-76. doi: 10.5185/amlett.2017.6456 [Crossref] [ Google Scholar]
- Mittal D, Biswas L, Verma AK. Redox resetting of cisplatin-resistant ovarian cancer cells by cisplatin-encapsulated nanostructured lipid carriers. Nanomedicine (Lond) 2021; 16:979-95. doi: 10.2217/nnm-2020-0400 [Crossref] [ Google Scholar]
- Bergmeyer HU, Bernt E. Lactate dehydrogenase. UV-assay with pyruvate and NADH. In: Bergmeyer HU, ed. Methods of Enzymatic Analysis. New York: Academic Press. 1974. p. 574-8.
- Leekha A, Gurjar BS, Tyagi A, Rizvi MA, Verma AK. Vitamin C in synergism with cisplatin induces cell death in cervical cancer cells through altered redox cycling and p53 upregulation. J Cancer Res Clin Oncol 2016; 142:2503-14. doi: 10.1007/s00432-016-2235-z [Crossref] [ Google Scholar]
- Kumar V, Leekha A, Tyagi A, Kaul A, Mishra AK, Verma AK. Preparation and evaluation of biopolymeric nanoparticles as drug delivery system in effective treatment of rheumatoid arthritis. Pharm Res 2017; 34:654-67. doi: 10.1007/s11095-016-2094-y [Crossref] [ Google Scholar]
- Kaul A, Chaturvedi S, Attri A, Kalra M, Mishra AK. Targeted theranostic liposomes: rifampicin and ofloxacin loaded pegylated liposomes for theranostic application in mycobacterial infections. RSC Adv 2016; 6:28919-26. doi: 10.1039/c6ra01135g [Crossref] [ Google Scholar]
- Verma AK, Sachin K. Novel hydrophilic drug polymer nano-conjugates of cisplatin showing long blood retention profile: its release kinetics, cellular uptake and bio-distribution. Curr Drug Deliv 2008. 5: 120-6. 10.2174/156720108783954806.
- Moin I, Biswas L, Zafaryab M, Kumari N, Leekha A, Mittal D. In vitro toxico-genomics of etoposide loaded gelatin nanoparticles and its in-vivo therapeutic potential: pharmacokinetics, biodistribution and tumor regression in Ehrlich ascites carcinoma (EAC) mice model. Front Nanotechnol 2021; 3:624083. doi: 10.3389/fnano.2021.624083 [Crossref] [ Google Scholar]
- Brunetti V, Chibli H, Fiammengo R, Galeone A, Malvindi MA, Vecchio G. InP/ZnS as a safer alternative to CdSe/ZnS core/shell quantum dots: in vitro and in vivo toxicity assessment. Nanoscale 2013; 5:307-17. doi: 10.1039/c2nr33024e [Crossref] [ Google Scholar]
- Haque MM, Im HY, Seo JE, Hasan M, Woo K, Kwon OS. Acute toxicity and tissue distribution of CdSe/CdS-MPA quantum dots after repeated intraperitoneal injection to mice. J Appl Toxicol 2013; 33:940-50. doi: 10.1002/jat.2775 [Crossref] [ Google Scholar]
- Srinivasan A, Gayathri G, Muthupandi M, Rajasekar K, Ameen KB, Pandaram P. Eco-benign synthesis, characterization of CdS-QDs/casein bionanocomposite towards anti-microbial, anti-hemolytic and cytotoxicity in A549 & MCF-7 Cells. J Clust Sci 2023; 34:773-88. doi: 10.1007/s10876-022-02253-2 [Crossref] [ Google Scholar]
- Zhang Y, Zhang Y, Hong G, He W, Zhou K, Yang K. Biodistribution, pharmacokinetics and toxicology of Ag2S near-infrared quantum dots in mice. Biomaterials 2013; 34:3639-46. doi: 10.1016/j.biomaterials.2013.01.089 [Crossref] [ Google Scholar]
- Ballou B, Ernst LA, Waggoner AS. Fluorescence imaging of tumors in vivo. Curr Med Chem 2005; 12:795-805. doi: 10.2174/0929867053507324 [Crossref] [ Google Scholar]
- Akerman ME, Chan WC, Laakkonen P, Bhatia SN, Ruoslahti E. Nanocrystal targeting in vivo. Proc Natl Acad Sci U S A 2002; 99:12617-21. doi: 10.1073/pnas.152463399 [Crossref] [ Google Scholar]
- Fischer HC, Liu L, Pang KS, Chan WC. Pharmacokinetics of nanoscale quantum dots: in vivo distribution, sequestration, and clearance in the rat. Adv Funct Mater 2006; 16:1299-305. doi: 10.1002/adfm.200500529 [Crossref] [ Google Scholar]
- Hoshino A, Hanaki K, Suzuki K, Yamamoto K. Applications of T-lymphoma labeled with fluorescent quantum dots to cell tracing markers in mouse body. Biochem Biophys Res Commun 2004; 314:46-53. doi: 10.1016/j.bbrc.2003.11.185 [Crossref] [ Google Scholar]