Bioimpacts. 2025;15:30510.
doi: 10.34172/bi.30510
Original Article
Evaluation of specific lncRNAs, miRNAs, and mRNAs in different groups of prostate cancer
Gelareh Vahabzadeh Conceptualization, Resources, Supervision, 1, 2, # 
Amirreza Pashapour-Yeganeh Investigation, Methodology, 3, #
Maryam Eini Software, 3
Morad Roudbaraki Validation, 4
Ebrahim Esmati Investigation, Methodology, 5
Amirhoushang Poorkhani Validation, 6
Solmaz Khalighfard Conceptualization, Data curation, Formal analysis, Investigation, Methodology, Project administration, Software, Validation, 7
Ali Mohammad Alizadeh Conceptualization, Formal analysis, Methodology, Project administration, Resources, Supervision, Validation, 3, *
Author information:
1Razi Drug Research Center, Iran University of Medical Sciences, Tehran, Iran
2Department of Pharmacology, School of Medicine, Iran University of Medical Sciences, Tehran, Iran
3Cancer Research Center, Cancer Institute, Tehran University of Medical Sciences, Tehran, Iran
4Laboratory of Cell Physiology, Inserm U1003, University of Lille, Villeneuve d’Ascq, France
5Radiation Oncology Research Center, Cancer Institute, Tehran University of Medical Sciences, Tehran, Iran
6Ischemic Disorders Research Center, Golestan University of Medical Sciences, Gorgan, Iran
7Research Center for Development of Advanced Technologies, Tehran, Iran
#Gelareh Vahabzadeh and Amirreza Pashapour-Yeganeh contributed equally to this work.
Abstract
Introduction:
LncRNAs interact with miRNAs and mRNAs that can have a special expression pattern in a specific cell type. We investigated the specific lncRNAs, miRNAs, and mRNAs in different groups of prostate cancer (PC).
Methods:
The mRNAs with significant expression differences were first analyzed using the GEO and TCGA databases. The lncRNAs and miRNAs were then identified in the miRWalk2, miRmap, OncomiR, miRGator 3.0, miRCancerDB, LncRNA2target, TANRIC, LncRNADisease, Lnc2Cancer v3.0, and LncBase. Seventy subjects, including sixty PC patients classified as local, locally advanced, biochemical relapse, metastatic, and benign groups, as well as ten normal individuals, were then included. Finally, real-time PCR determined the expression of the candidate biomarkers.
Results:
The bioinformatics analysis detected candidate 6 miRNAs, 6 lncRNAs, and 6 mRNAs in different groups of PC patients. Unlike the significant decrease in candidate tumor suppressors, the expression levels of specific onco-lncRNA, onco-miRNA, and oncogenes exhibited a substantial increase in different groups of the patients compared to the normal group. The expression of lncRNAs, including LINC01128 (P=0.0182), LINC02246 (P<0.0001), and LINC02288 (P<0.0001), LINC00857 (P<0.0001), GNAS-AS1 (P<0.0001), and LINC02371 (P<0.0001), the expression of miRNAs, including miR-217 (P<0.0001), miR-375 (P<0.0001), miR-203a (P<0.0001), miR-876 (P=0.0046), miR-27b (P<0.0001), and miR-152 (P<0.0001), and the expression of oncogenes, including ST14 (P<0.0001), CD24 (P<0.0001), CDH1 (P<0.0001), DSC2 (P<0.0001), TGFB3 (P<0.0001), and MYL2 (P=0.0186) had significant changes at different groups of PC patients.
Conclusion:
Our results identified promising biomarkers that play a role in specific groups of prostate cancer patients. Detecting specific biomarkers may be an effective strategy for different groups of PC patients.
Keywords: Prostate cancer, Biomarker, Gleason, PSA
Copyright and License Information
© 2025 The Author(s).
This work is published by BioImpacts as an open access article distributed under the terms of the Creative Commons Attribution Non-Commercial License (
http://creativecommons.org/licenses/by-nc/4.0/). Non-commercial uses of the work are permitted, provided the original work is properly cited.
Funding Statement
None of the funding sources had any role in the study design, data collection, analysis, interpretation, or the decision to submit the article for publication.
Introduction
In recent decades, many investigations have been conducted to identify biomarkers related to prostate cancer (PC) development.1 The ceRNA hypothesis describes a complex regulatory network of lncRNA, miRNA, and mRNA that can interact in PC.2 In this setting, lncRNAs interact with miRNAs and modify their availability as endogenous mRNAs. The essential point is that lncRNAs may have a special expression pattern in a specific cell type.2 However, the diversity in their functions, from regulating protein activities to modulating other noncoding RNAs, indicates that we are beginning to understand the importance of lncRNAs in different biochemical and cellular processes.3 More importantly, the role of lncRNA in some malignancies as a robust prognosis biomarker has been revealed.4 There are reports of some lncRNA sequences that compete with miRNA.5 This complicated interaction between lncRNAs and miRNAs finally determines the level of protein-coding mRNAs.6 Therefore, evaluation of miRNA levels can be applied to cancer classification, detection of tumor development, monitoring treatment response, remission after surgery, prognosis of tumor relapse, etc. MiRNAs' pivotal role, stability, availability, quantification ability, and direct association with the stage of the disease have made them a candidate as an informative cancer biomarker.7 In this regard, miRNAs are considered one of the most defining elements controlling cancer signaling pathways.8 Thus, the secretion of miRNAs from tumor cells into body fluids such as blood and urine has made them a suitable diagnostic biomarker.9
Adopting bioinformatics approaches to explore the lncRNA-miRNA-mRNA interaction in PC patients has been a concern in recent years. In a bioinformatics study by Taheri et al, a ceRNA network including 5 lncRNAs, 5 miRNAs, and 17 mRNAs was constructed to detect prostate cancer.10 Another bioinformatics study reported lncRNA-miRNA-mRNA regulatory networks and their interaction with transcription factors to explore involved genes and pathways in prostate cancer.11 However, the application of these networks in detection and therapy still needs to be improved. The present bioinformatics and experimental study analyzed the significant differential expression of lncRNAs, miRNAs, and mRNAs in PC patients along with Gleason scores. In this setting, specific candidate expressions of lncRNAs, miRNAs, and mRNAs in different prostate cancer groups were identified that would provide opportunities for better biomarker estimations for diagnostic purposes.
Materials and Methods
Microarray data collection for PC patients
The mRNA expression profiles (GSE30994, GSE69223, GSE3325, GSE70770, and GSE35988) at different groups of PC were downloaded from the Gene Expression Omnibus (GEO) database.4 There were 6, 30, 12, 136, and 87 samples in each dataset, respectively. For further analysis, we chose 3 prostate tumors and 3 normal tissues from GSE30994, 15 prostate tumors and 15 adjacent normal samples from GSE69223, 6 prostate tumors and 6 adjacent normal samples from GSE3325, 63 prostate tumors and 73 adjacent normal samples from GSE70770: GPL10558, and 59 prostate tumors and 28 normal tissues from GSE35988: GPL9075. Using GEO2R, the data was analyzed, and genes with significant differential expressions (|log2FC| > 1 and adjusted p-value < 0.05) were selected. Likewise, GEPIA2 analyzed differentially expressed genes (DEGs) from the TCGA.12 MiRNAs of candidate genes were identified in the miRWalk2, miRmap, OncomiR, miRGator 3.0, and miRCancerDB databases. Moreover, LncRNA2target, TANRIC,LncRNADisease, Lnc2Cancer v3.0, and LncBase of the TCGA dataset were collected to identify candidate lncRNAs. The bioinformatics analyses are shown in Supplementary file 1.
Gene ontology (GO) and pathway enrichment analysis
The GO term enrichment analysis of DEG was performed using the Enricher tool. The pathway enrichment analysis of the same genes was explored using the Reactome and WikiPathway databases. The P value < 0.05 was considered significant in the data.13
Protein-protein interaction (PPI) network
The PPI network of DEGs was constructed from the STRING online database (https://string-db.org/) with medium confidence (0.400) as the minimum required interaction score. Candidate hub genes were identified by Cytohubba (Degree = 4) and the Molecular Complex Detection (MCODE) plugin of Cytoscape software. The degree cut-off value of 3 and the number of nodes > 4 were set as definitive criteria.
Sample collection
As previously reported, plasma, serum, and peripheral blood mononuclear cells were collected from 60 PC patients and 10 normal individuals at the Cancer Institute of Iran and Imum-Khomaini Hospital (Tehran, Iran) from September 2019 to September 2020.2 According to their pathological reports and clinical exams, prostate cancer patients (KPS ≥ 70 or ECOG = 0-1) were divided into five groups, including local (n = 22), locally advanced (n = 9), biochemical relapse (n = 11), metastatic (n = 8), and benign prostatic hyperplasia (n = 10) tumors. The routine treatments are considered radical therapy and prostatectomy for patients with local prostatic cancer; radiotherapy, androgen therapy, and radical prostatectomy for patients with locally advanced prostatic cancer; post-radical prostatectomy, salvage radiotherapy with or without androgen therapy for patients with biochemical relapse prostatic cancer; and anti-androgen therapy, chemotherapy, radiotherapy, and target therapy for patients with metastatic prostatic cancer.14,15 Exclusion criteria were younger than 50 or older than 75. In addition, the participants were excluded with diabetes, hypertension, acute or chronic heart disease, hepatitis, autoimmune disease, human immune deficiency disease, and other cancers.
Total RNA isolation and cDNA synthesis
The total RNA was extracted from 1 mL plasma samples using TRIzol reagent and incubated at -80 ºC. RNA quality, purity, and concentration were examined with a NanoDrop 2000 spectrophotometer (Thermo Scientific, Wilmington, DE, USA) and an Agilent 2100 Bioanalyzer (Agilent Technologies). Reverse transcription of RNA was then carried out using a Fermentase cDNA synthesis kit according to manufacturer instructions.
Quantitative real-time PCR analysis
According to the manufacturer's protocol, gene expression quantification was performed with a Syber-Green Real-Time PCR kit. The reaction mixture contained 10 µL SYBR green master mix, 2 µL of cDNA template, forward and reverse primers (final concentration of 0.2 µM for each primer), and nuclease-free distilled water to reach a total volume of 20 µL. The program was: 1 cycle of pre-denaturing at 95 °C for 10 seconds, then 40 cycles containing 3 steps of denaturation for 5 seconds at 95 °C, annealing for 20 seconds at 60 °C, and extension for 30 seconds at 72 °C. The -ΔCT was used to analyze the data, and beta-actin and U6 were used to normalize mRNA and miRNA genes, respectively. The list of used primers is shown in Supplementary file 2.
Statistical tests
GraphPad Prism 7.0 was used for statistical analysis. Kolmogrov-Smirnov evaluated the natural distribution of the data. T-test and Mann-Whitney were used to analyze the parametric and nonparametric data of the two groups. A P value less than 0.05 was considered statistically significant.
Results
Identification of DEGs in different groups of PC patients
Data analysis determined 1 up-regulated and 6 down-regulated genes in the local group, 2 up-regulated and 16 down-regulated genes in the locally advanced group, 106 up-regulated and 297 down-regulated genes in the metastatic group, 48 up-regulated and 19 down-regulated genes in biochemical relapse and 29 up-regulated and 19 down-regulated genes in the benign group. Van diagram (Fig. 1) demonstrated the DEGs between different PC patient groups. The list of hub genes, lncRNAs, and miRNAs were included in Supplementary file 3.
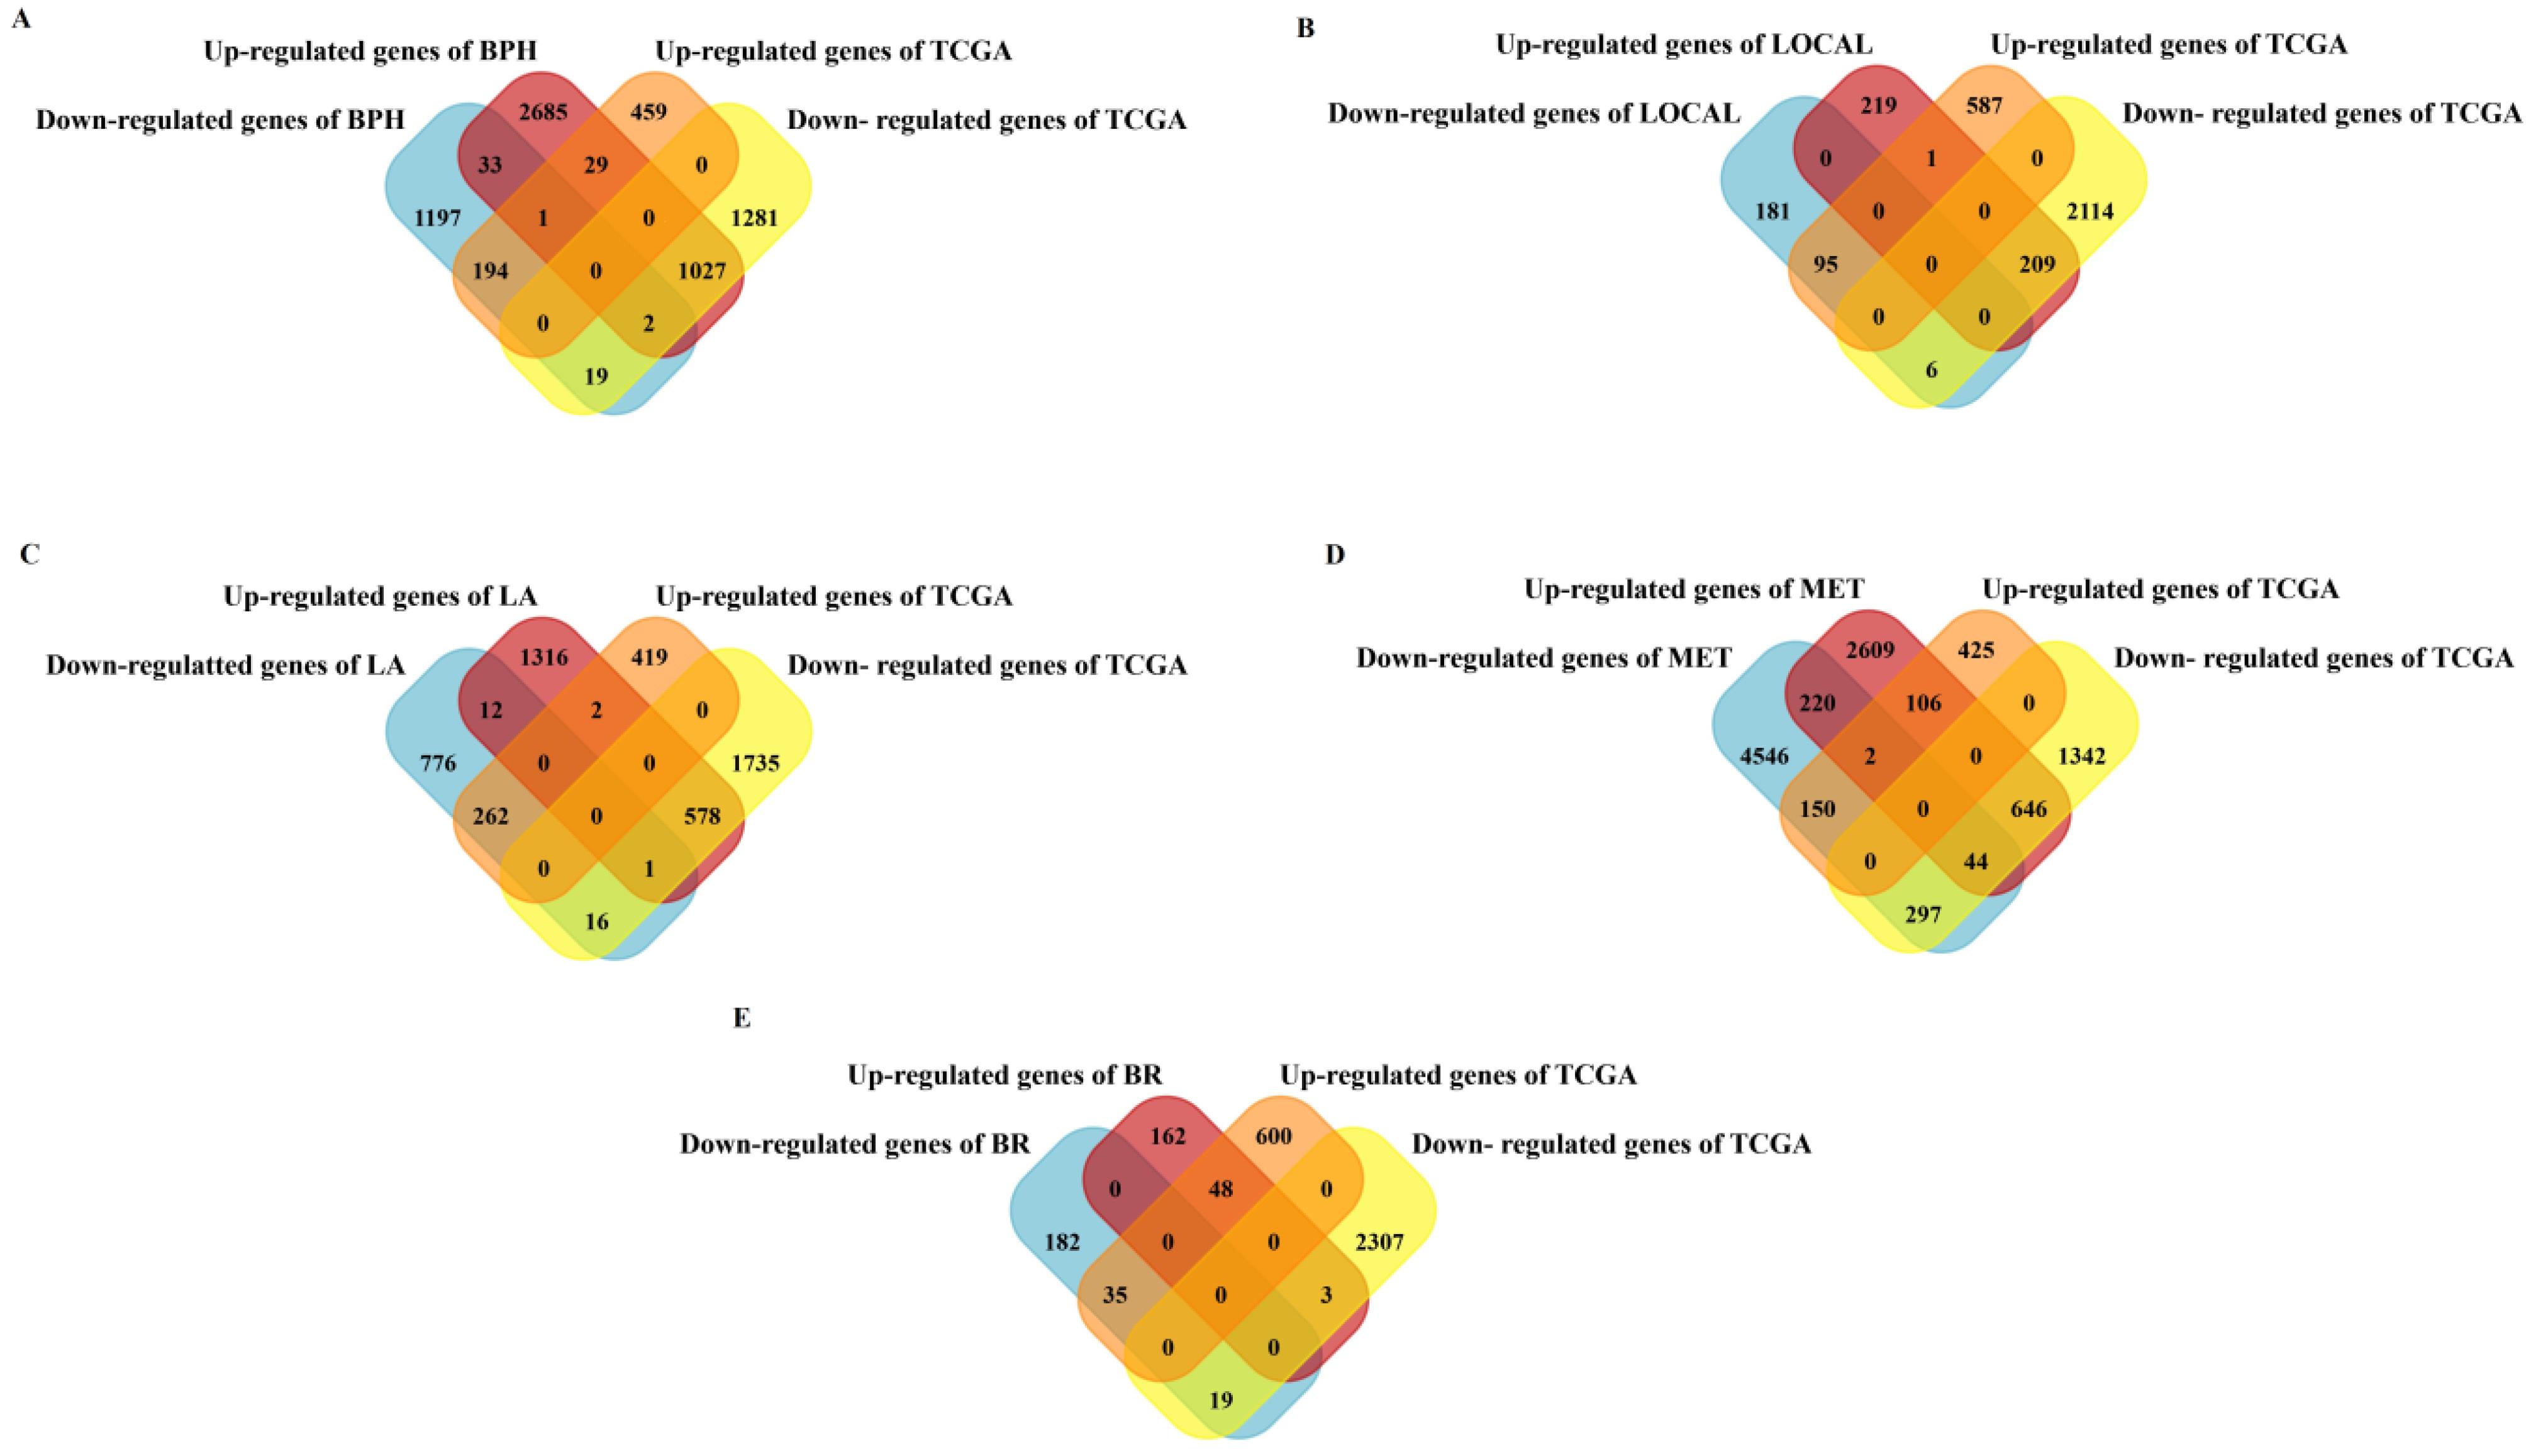
Fig. 1.
Identification of DEGs in different groups of PC patients. The Van diagram shows the DEGs between different groups of PC patients. (A) 48 genes (29 up-regulation and 19 down-regulation) in the Benign Prostatic Hyperplasia group, (B) 7 genes (1 up-regulation and 6 down-regulation) in the Local group, (C) 18 genes (2 up-regulation and 16 down-regulation) in the Locally Advanced group, (D) 403 genes (106 up-regulation and 297 down-regulation) in the Metastatic group, and (E) 67 genes (48 up-regulation and 19 down-regulation) in the Biochemical Relapse group were differentially expressed compared to the normal samples. A) BPH: Benign Prostatic Hyperplasia, B) L: Local, C) LA: Locally Advanced, D) BR: Biochemical Relapse, E) MET: Metastatic.
.
Identification of DEGs in different groups of PC patients. The Van diagram shows the DEGs between different groups of PC patients. (A) 48 genes (29 up-regulation and 19 down-regulation) in the Benign Prostatic Hyperplasia group, (B) 7 genes (1 up-regulation and 6 down-regulation) in the Local group, (C) 18 genes (2 up-regulation and 16 down-regulation) in the Locally Advanced group, (D) 403 genes (106 up-regulation and 297 down-regulation) in the Metastatic group, and (E) 67 genes (48 up-regulation and 19 down-regulation) in the Biochemical Relapse group were differentially expressed compared to the normal samples. A) BPH: Benign Prostatic Hyperplasia, B) L: Local, C) LA: Locally Advanced, D) BR: Biochemical Relapse, E) MET: Metastatic.
GO enrichment analysis
GO enrichment analyses were performed to better understand the role of specific hub genes in different prostate cancer groups. The most significant terms in biological process, cellular components, and molecular function regarding DEGs of various groups have been reported in Supplementary file 4. Table 1 indicates the selected lncRNAs, miRNAs, and mRNAs in different prostate cancer groups. The selected pathways in hub genes at each PC group were obtained through WikiPathway and Reactome pathway analysis (see Supplementary file 4).
Table 1.
A list of specific lncRNAs, miRNAs, and mRNAs in different groups of PC patients
|
Groups
|
Markers
|
|
lncRNAs
|
P
-value
|
miRNAs
|
P
-value
|
mRNAs
|
P
-value
|
| BPH |
LINC02371 |
5.12e-04 |
miR-375 |
1.62e-12 |
CD24 |
9.85e-15 |
| LA |
LINC01128 |
1.07e-15 |
miR-27b |
1.63e-12 |
ST14 |
3.95e-62 |
| L |
LINC02246 |
6.15e-04 |
miR-876 |
1.10e-03 |
MYL2 |
7.62e-4 |
| BR |
LINC00857 |
1.88e-10 |
miR-203a |
1.62e-12 |
TGFB3 |
2.59e-19 |
| MET |
GNAS-AS1
LINC02288 |
1.94e-06
9.77e-09 |
miR-217
miR-152 |
4.37e-08
6.65e-10 |
CDH1
DSC2 |
3.27e-39
2.45e-53 |
BPH: Benign Prostatic Hyperplasia, L: Local, LA: Locally Advanced, BR: Biochemical Relapse, MET: Metastatic.
PPI network
Cytoscape software showed the interaction networks of selected lncRNA-miRNA-mRNA in each of the different groups of prostate cancer (see Supplementary file 5). Besides, CIMminer software drew a heatmap of candidate lncRNAs', miRNAs', and mRNAs' expressions (see Supplementary file 6).
Clinical features of the patients
The previous study 2 reported clinicopathologic features of participants. There was no significant difference in age, BMI, and prostate volume between all PC groups. The majority of patients in each group had adenocarcinomas. Gleason scores and clinical tumor stages were significantly increased in different groups of PC patients with more aggressive disease.
PSA levels at different groups of PC patients
Except for the biomedical relapse group (0.5 ± 0.1 pg/mL), serum PSA level was statistically significantly higher in patients with benign prostatic hyperplasia (4.5 ± 2.3 pg/mL), local (13.2 ± 10.2 pg/mL), locally advanced (45.9 ± 14.3), and metastatic (59.5 ± 14.6 pg/mL) groups than in normal individuals (1.5 ± 0.4 pg/mL) (P < 0.05). This increase was more significant in patients with more advanced stages than in the early stages.
Specific lncRNA, miRNA, and mRNA expression in different groups of PC patients
Results revealed that the expression of onco-lncRNAs, including LINC01128 (P = 0.0182) in the locally advanced group, LINC02246 (P < 0.0001) in the local group, and LINC02288 (P < 0.0001) in the metastatic group demonstrated significant changes compared to the normal group (Table 2). Expression of candidate tumor suppressor lncRNAs, including LINC00857 (P < 0.0001) in the biomedical relapse group, GNAS-AS1 (P < 0.0001) in the metastatic group, and LINC02371 (P < 0.0001) in the benign prostatic hyperplasia group had significant changes compared to the normal group (Table 2).
Table 2.
Changes in the expression level of specific lncRNAs in different groups of PC patients
|
LncRNAs
|
Groups
|
|
Normal
|
BPH
|
P-
value
|
L
|
P-
value
|
LA
|
P-
value
|
BR
|
P
-value
|
MET
|
P-
value
|
|
Onco-lncRNA
|
| LINC01128 |
-14.5 ± 1.2 |
-13.4 ± 1.1 |
0.0523 |
-13.7 ± 1.2 |
0.0940 |
-13.1± 1.2 |
0.0182* |
- 13.6 ± 1.1 |
0.0766 |
-13.5 ± 1.2 |
0.1051 |
| LINC02246 |
-14.6 ± 0.6 |
- 15.4 ± 1.2 |
0.0931 |
-13.2 ± 0.8 |
< 0.0001* |
-14.9 ± 1.0 |
0.3171 |
-13.9 ± 1.1 |
0.1410 |
-13.3 ± 2.6 |
0.1515 |
| LINC02288 |
-14.0 ± 1.3 |
-14.3 ± 1.0 |
0.4772 |
-13.2 ± 1.4 |
0.1740 |
-14.2 ± 1.0 |
0.7281 |
-13.5 ± 1.6 |
0.4963 |
-5.3 ± 0.7 |
< 0.0001* |
|
T.S lncRNA
|
| LINC00857 |
-6.1 ± 1.5 |
-5.4 ± 1.7 |
0.3495 |
-6.8 ± 2.3 |
0.4324 |
-6.4 ± 1.9 |
0.7077 |
-17.8 ± 0.9 |
< 0.0001* |
-5.8± 1.4 |
0.6583 |
| LINC02371 |
-4.0 ± 1.2 |
-13.6 ± 1.3 |
< 0.0001* |
-4.3 ± 1.0 |
0.5621 |
-4.8 ± 1.2 |
0.2345 |
-4.8 ± 0.8 |
0.1011 |
-5.0± 0.7 |
0.0837 |
| GNAS-AS1 |
-6.5 ± 1.2 |
-5.7 ± 1.0 |
0.1242 |
-5.7 ± 1.0 |
0.0656 |
-6.0 ± 1.5 |
0.4098 |
-5.8 ± 1.2 |
0.2055 |
-16.9± 1.2 |
< 0.0001* |
BPH: Benign Prostatic Hyperplasia, L: Local, LA: Locally Advanced, BR: Biochemical Relapse, MET: Metastatic.
* P < 0.05 compared to normal groups.
Our results also demonstrated that the expression of onco-miRNAs, including miR-217 (P < 0.0001) in the metastatic group, miR-375 (P < 0.0001) in the benign prostatic hyperplasia group, and miR-203a (P < 0.0001) in the biomedical relapse group, changed significantly compared to the normal group (Table 3). Moreover, the expression of tumor suppressor miRNAs, including miR-876 (P = 0.0046) in the local group, miR-27b (P < 0.0001) in the locally advanced group, and miR-152 (P < 0.0001) in the metastatic group, demonstrated significant changes compared to the normal group (Table 3).
Table 3.
Changes in the expression level of specific miRNAs in different groups of PC patients
|
MiRNAs
|
Groups
|
|
Normal
|
BPH
|
P-
value
|
L
|
P-
value
|
LA
|
P-
value
|
BR
|
P
-value
|
MET
|
P-
value
|
|
Onco-miRNAs
|
| miR-203a |
-14.7 ± 1.8 |
-13.4 ± 1.0 |
0.0751 |
-14.9 ± 1.6 |
0.7216 |
-13.5 ± 1.2 |
0.1197 |
-5.2 ± 1.3 |
< 0.0001* |
-13.3 ± 0.5 |
0.0574 |
| miR-217 |
-12.0 ± 2.2 |
-12.2 ± 1.8 |
0.8372 |
-11.9 ± 2.8 |
0.9219 |
-11.1 ± 2.2 |
0.3955 |
-11.2 ± 2.4 |
0.4879 |
-2.1 ± 0.9 |
< 0.0001* |
| miR-375 |
-13.2 ± 1.0 |
-2.2 ± 0.8 |
< 0.0001* |
-14.1 ± 1.5 |
0.0846 |
-12.9 ± 1.5 |
0.6912 |
-12.1 ± 1.2 |
0.5546 |
-12.2 ± 1.0 |
0.0662 |
|
T.S miRNAs
|
| miR-876 |
-5.6 ± 1.0 |
-5.2 ± 1.1 |
0.4276 |
-6.9 ± 1.1 |
0.0046* |
-5.3 ± 1.1 |
0.1190 |
-6.4 ± 0.9 |
0.1797 |
-6.4 ± 0.9 |
0.1047 |
| miR-27b |
-6.4 ± 0.7 |
-7.0 ± 1.4 |
0.3696 |
-7.2 ± 1.2 |
0.0742 |
-14.2 ± 2.0 |
< 0.0001* |
-7.1 ± 1.1 |
0.1328 |
-7.2 ± 1.1 |
0.1229 |
| miR-152 |
-6.3 ± 0.8 |
-6.8 ± 0.9 |
0.2045 |
-6.2 ± 1.7 |
0.8134 |
-7.0 ± 2.0 |
0.3463 |
-6.8 ± 0.8 |
0.1848 |
-14.5 ± 0.9 |
< 0.0001* |
BPH: Benign Prostatic Hyperplasia, L: Local, LA: Locally Advanced, BR: Biochemical Relapse, MET: Metastatic.
* P < 0.05 compared to normal groups.
Our results also demonstrated that the expression of oncogenes, including ST14 (P < 0.0001) in the locally advanced group, CD24 (P < 0.0001) in the benign prostatic hyperplasia group, and CDH1 (P < 0.0001) and DSC2 (P < 0.0001) in the metastatic group, increased significantly compared to the normal group (Table 4). A significant decrease was observed in the expression of candidate tumor suppressor mRNAs, including TGFB3 (P < 0.0001) in the biomedical relapse group and MYL2 (P = 0.0186) in the local group, compared to the normal group (Table 4).
Table 4.
Changes in the expression level of specific genes in different groups of PC patients
|
mRNAs
|
Groups
|
|
Normal
|
BPH
|
P
-value
|
L
|
P
-value
|
LA
|
P
-value
|
BR
|
P
-value
|
MET
|
P
-value
|
|
Oncogenes
|
| ST14 |
-13.5 ± 1.3 |
-14.3 ± 1.6 |
0.2245 |
-14.6 ± 1.5 |
0.0773 |
-5.5 ± 1.1 |
< 0.0001* |
-12.9 ± 2.1 |
0.4237 |
-13.0 ± 1.5 |
0.4317 |
| CD24 |
-13.7 ± 1.1 |
-5.2 ± 1.4 |
< 0.0001* |
-12.8 ± 2.0 |
0.5171 |
-13.4 ± 1.2 |
0.9162 |
-12.7 ± 1.1 |
0.0551 |
-13.2 ± 1.2 |
0.8443 |
| CDH1 |
-13.5 ± 1.5 |
-13.3 ± 0.7 |
0.7234 |
-12.3 ± 1.8 |
0.0739 |
-12.2 ± 1.6 |
0.0868 |
-14.2 ± 1.4 |
0.3413 |
-3.2 ± 1.4 |
< 0.0001* |
| DSC2 |
-13.0 ± 1.2 |
-13.2 ± 1.2 |
0.7553 |
-12.4 ± 1.2 |
0.1742 |
-12.5 ± 1.0 |
0.2750 |
-13.7 ± 0.9 |
0.2009 |
-3.3 ± 1.0 |
< 0.0001* |
|
T.S genes
|
| MYL2 |
-3.6 ± 1.3 |
-3.7 ± 1.4 |
0.8188 |
-4.9 ± 1.3 |
0.0186* |
-2.9 ± 0.8 |
0.1925 |
-4.6 ± 0.9 |
0.0657 |
-4.6 ± 1.0 |
0.0915 |
| TGFB3 |
-3.1 ± 1.4 |
-3.4 ± 1.5 |
0.6934 |
-4.0 ± 1.0 |
0.0573 |
-4.3 ± 1.0 |
0.0597 |
-14.0 ± 1.6 |
< 0.0001* |
-4.0 ± 0.9 |
0.1519 |
BPH: Benign Prostatic Hyperplasia, L: Local, LA: Locally Advanced, BR: Biochemical Relapse, MET: Metastatic.
* P < 0.05 compared to normal groups.
Association of specific lncRNA, miRNA, and mRNA biomarkers with Gleason scores
Unlike the significant decrease in candidate tumor suppressors, the expression levels of specific onco-miRNA, onco-lncRNA, and oncogenes exhibited a substantial increase in PC patients with higher Gleason scores than in normal ones (Figs. 2-4). The expression of onco-lncRNAs such as LINC02288 (P = 0.0002) increased significantly in PC patients with higher Gleason scores compared to lower ones (Fig. 2). The expression of tumor suppressor lncRNAs LINC00857 (P < 0.0001) and GNAS-AS1 (P < 0.0001) decreased significantly in PC patients with higher Gleason scores compared to lower ones (Fig. 2).
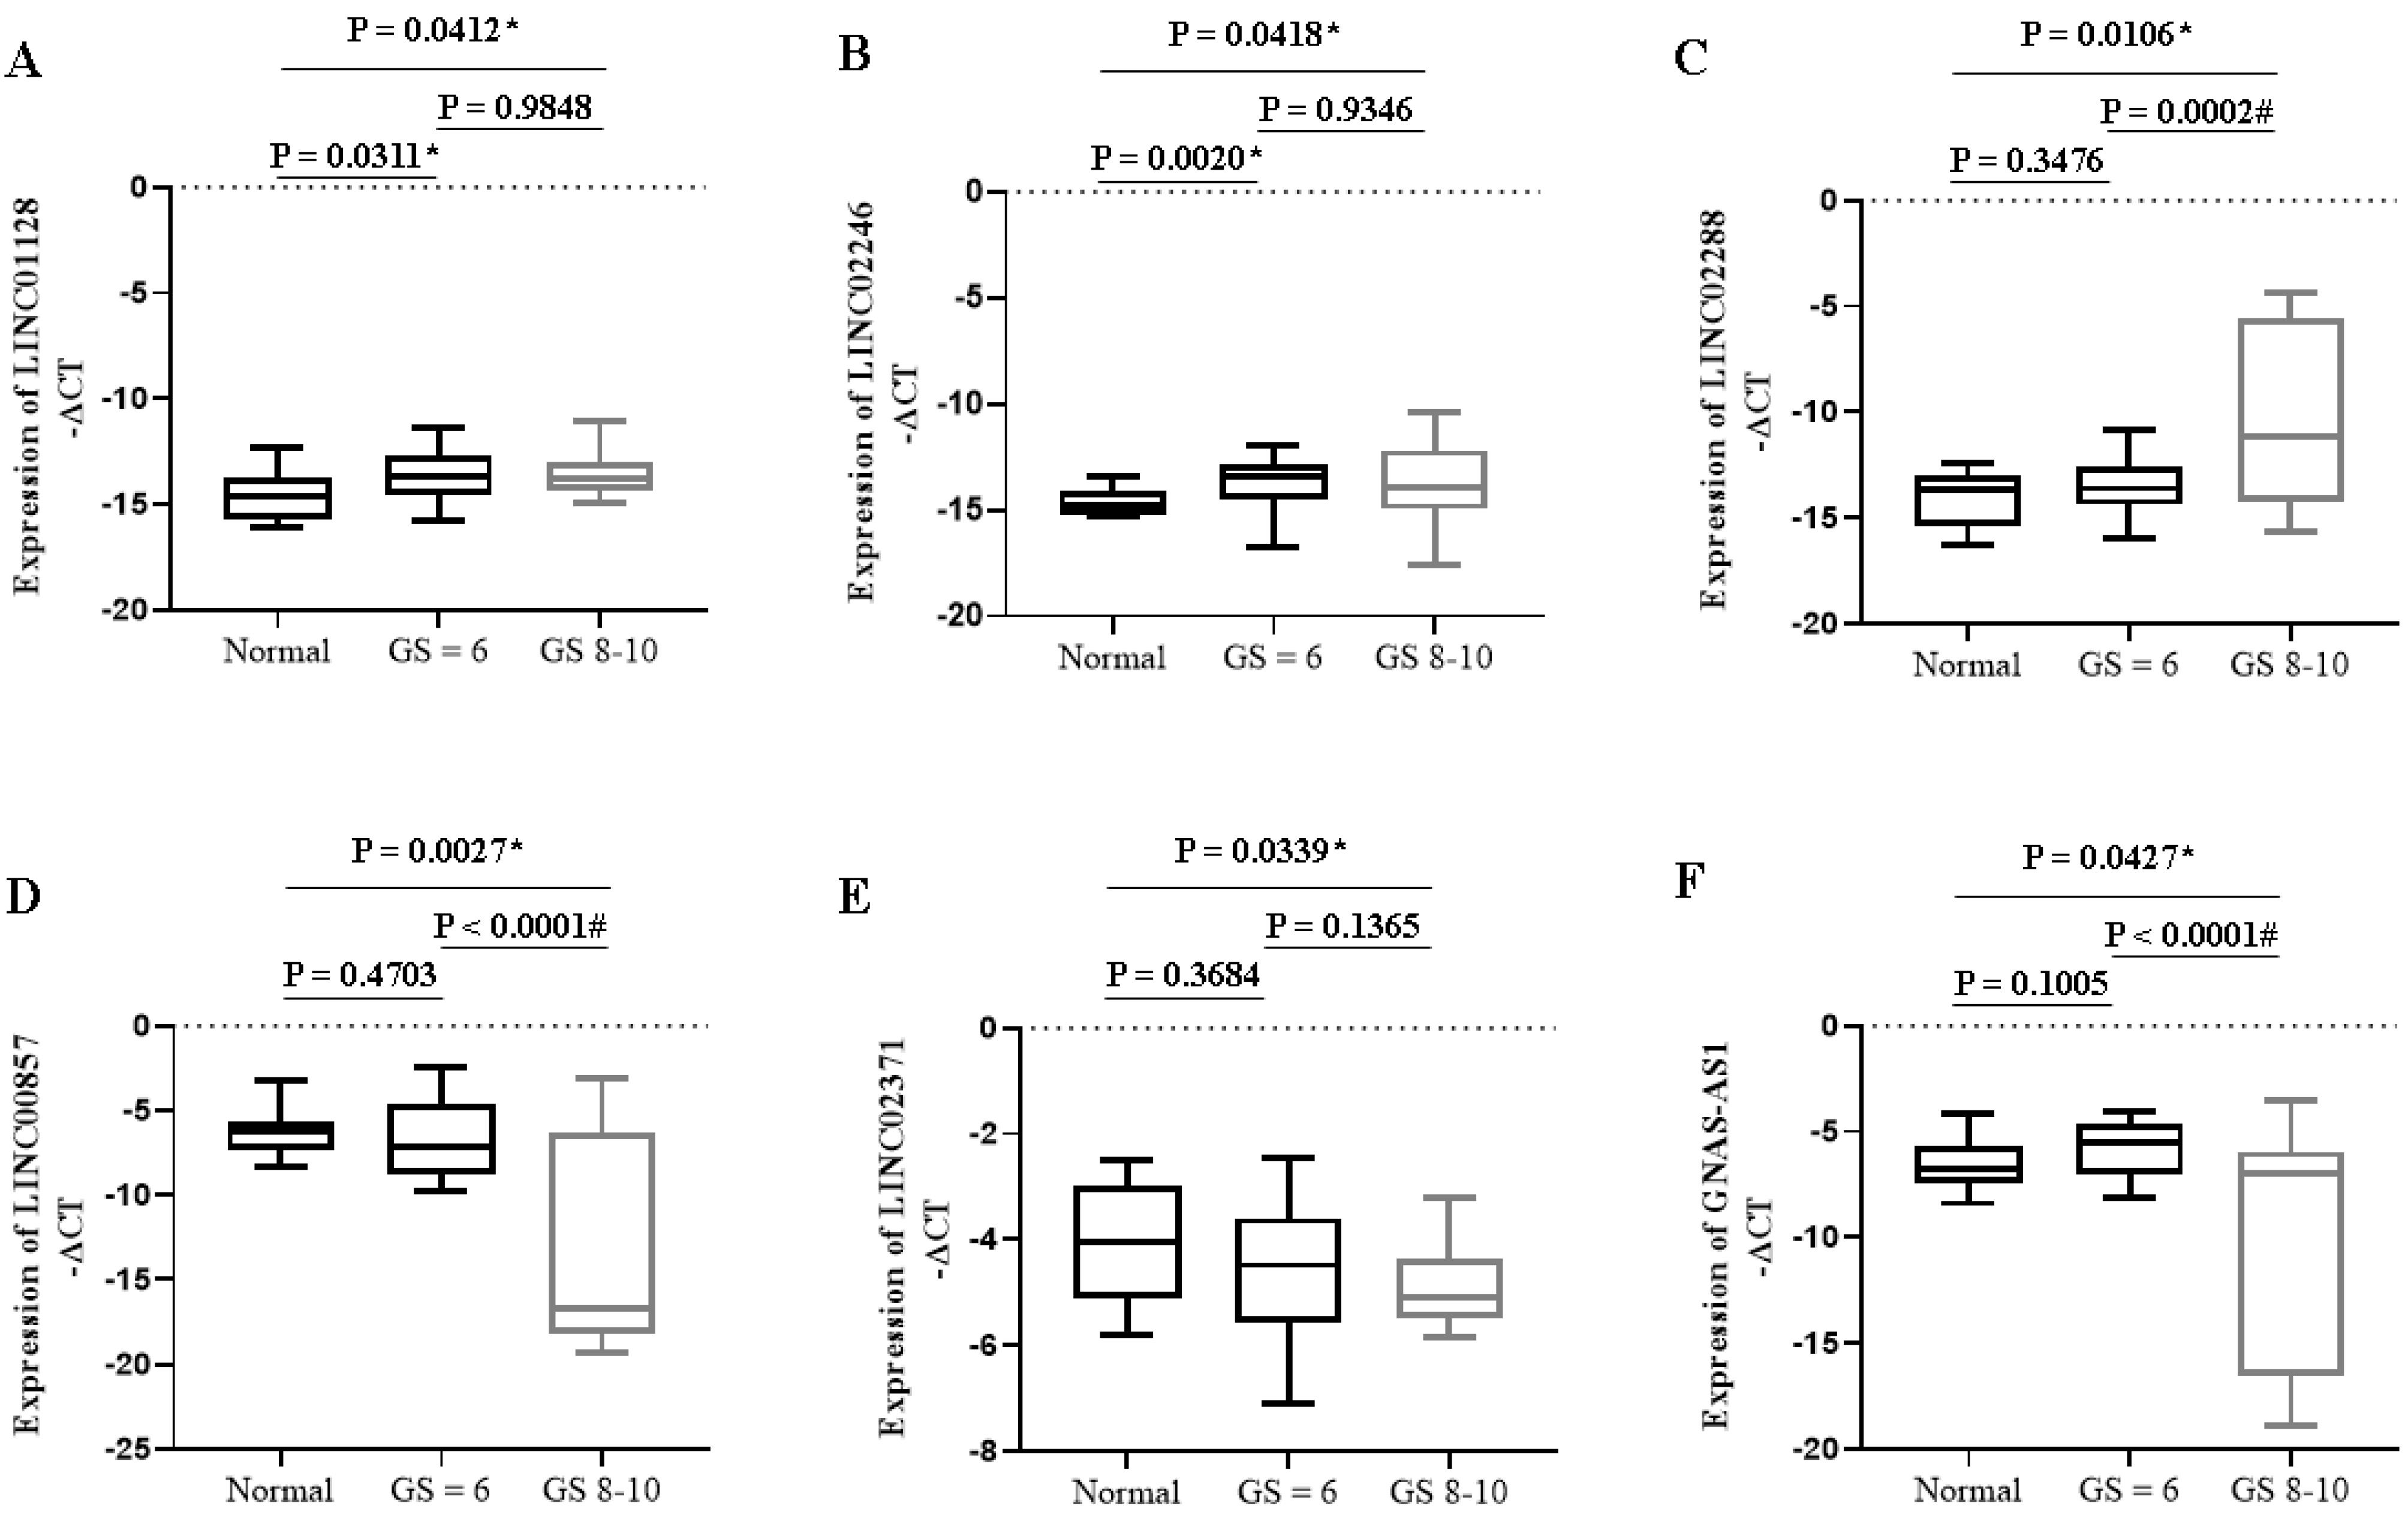
Fig. 2.
Expression of specific lncRNAs in PC patients with different Gleason scores. * P < 0.05 compared to the normal group; # P < 0.05 compared to GS ≤ 6. GS: Gleason Score.
.
Expression of specific lncRNAs in PC patients with different Gleason scores. * P < 0.05 compared to the normal group; # P < 0.05 compared to GS ≤ 6. GS: Gleason Score.
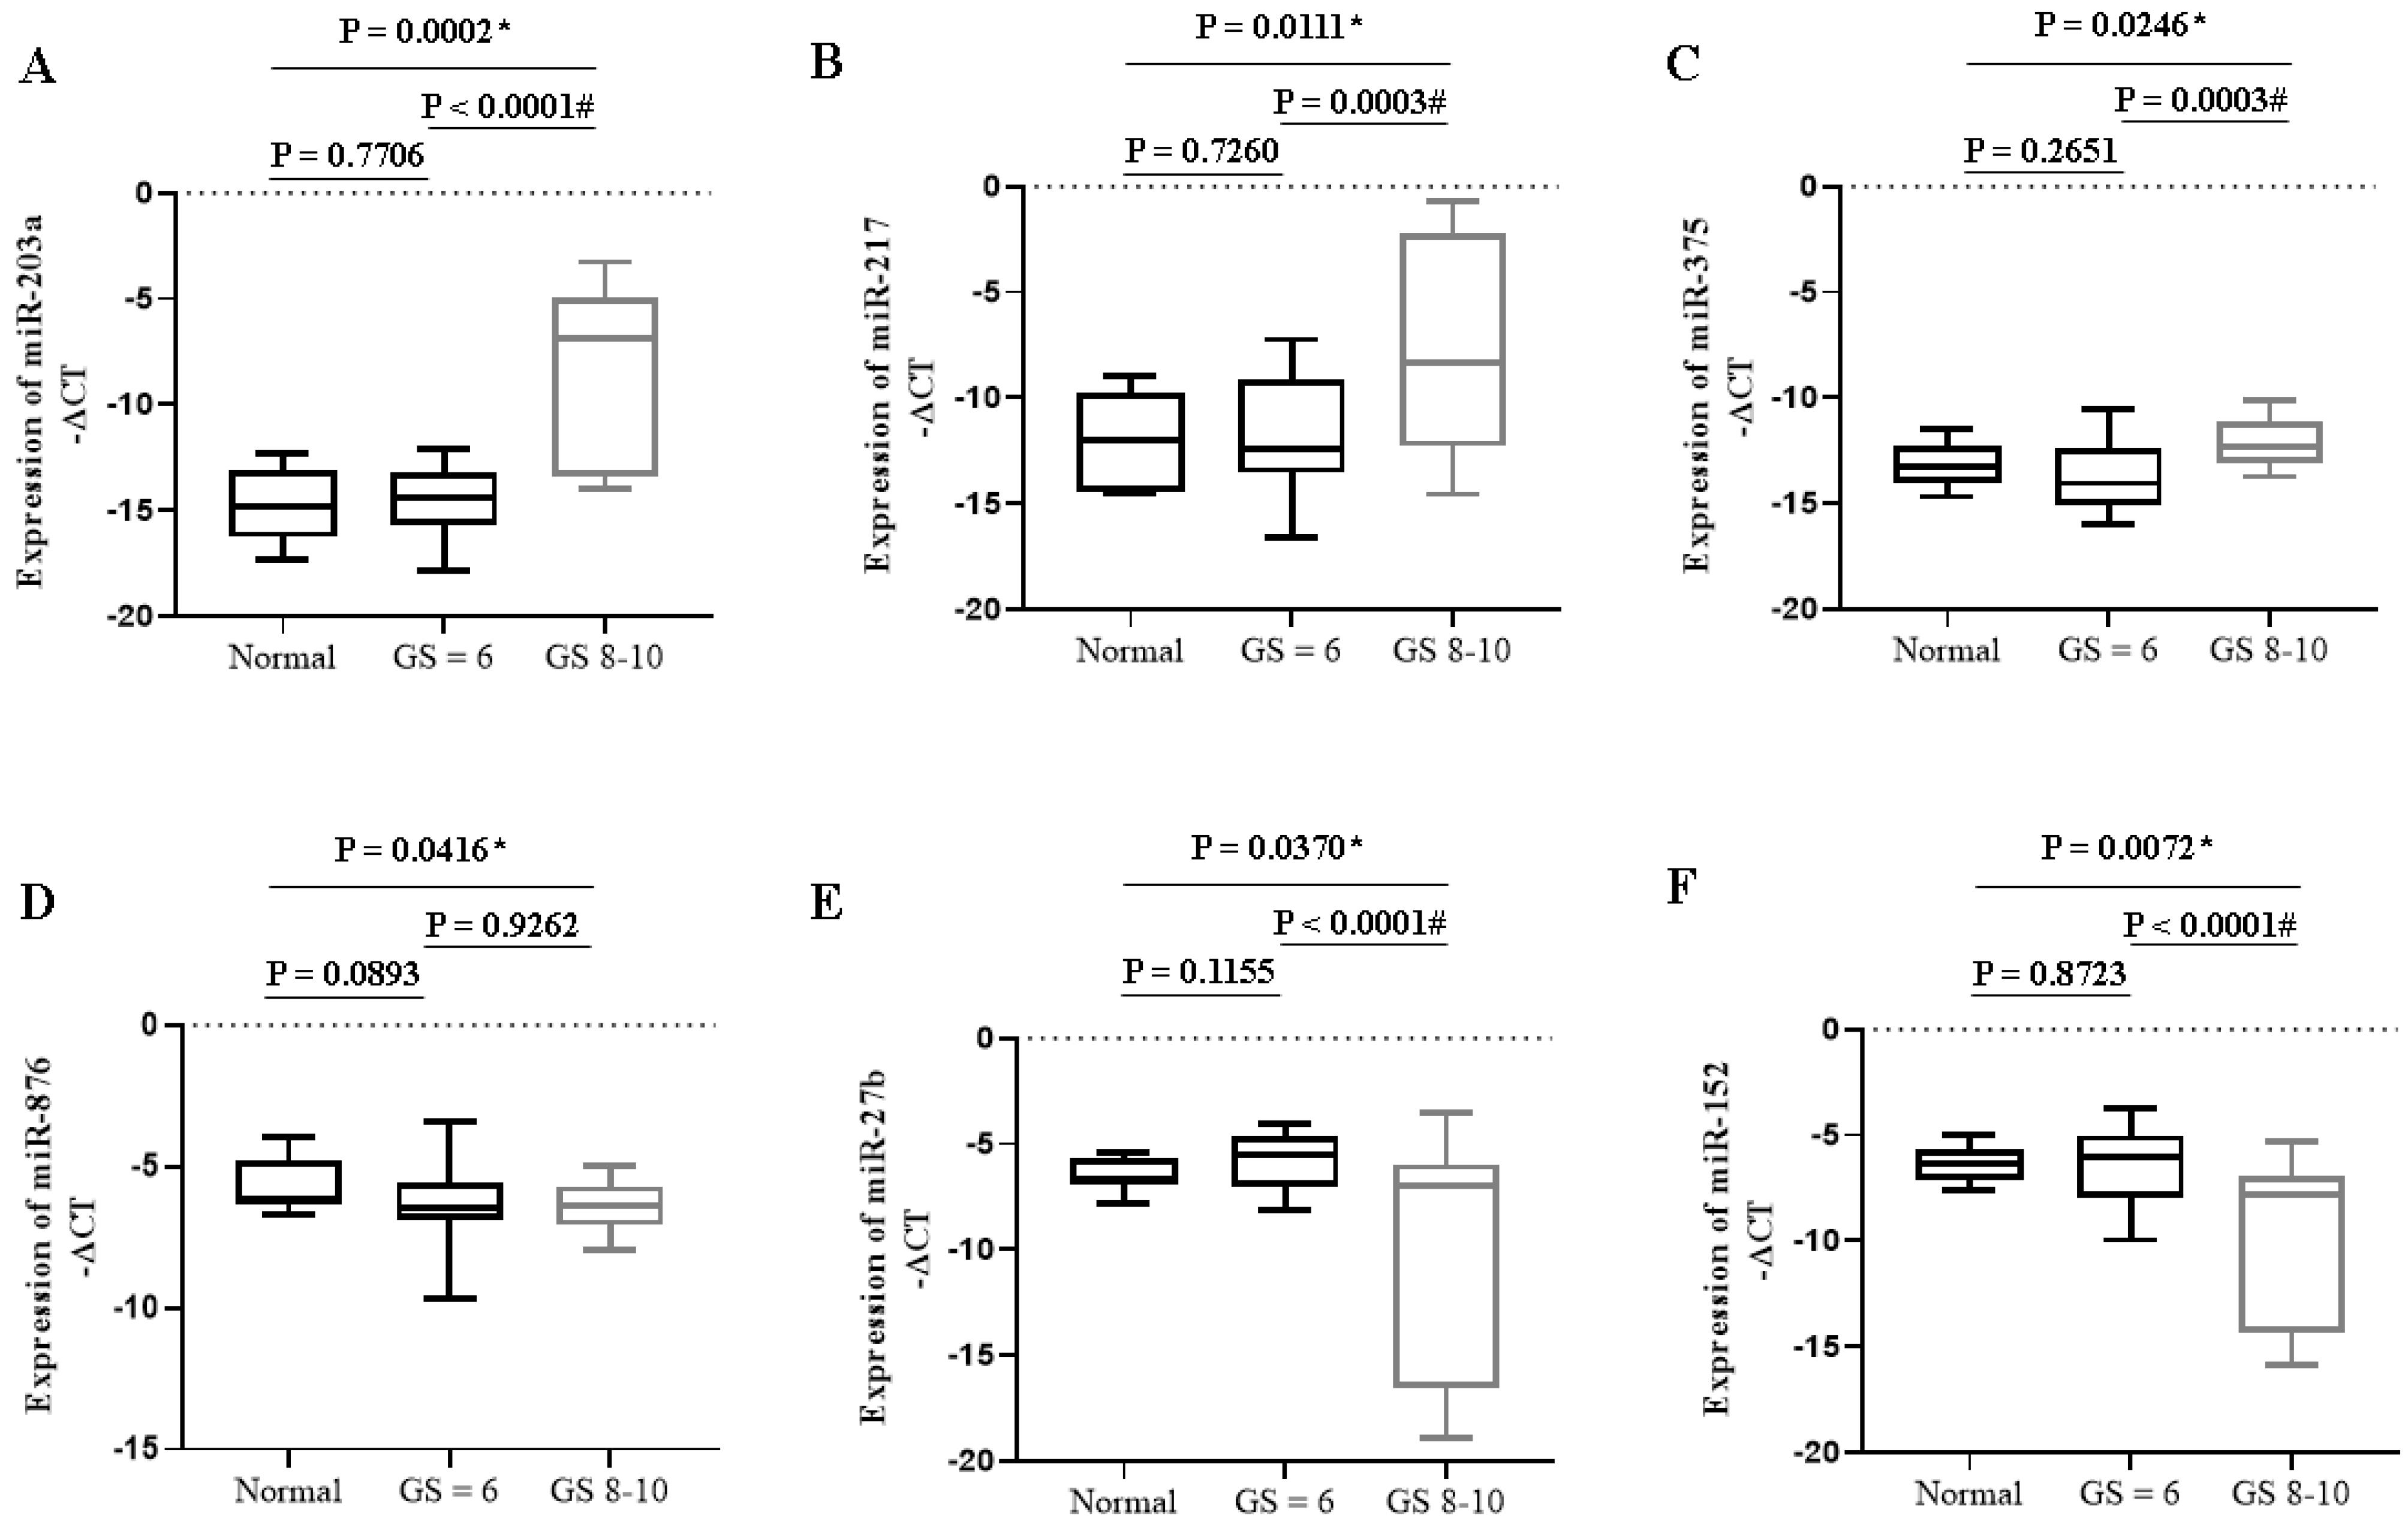
Fig. 3.
Expression of specific miRNAs in PC patients with different Gleason scores. * P < 0.05 compared to the normal group; # P < 0.05 compared to GS ≤ 6. GS: Gleason Score.
.
Expression of specific miRNAs in PC patients with different Gleason scores. * P < 0.05 compared to the normal group; # P < 0.05 compared to GS ≤ 6. GS: Gleason Score.
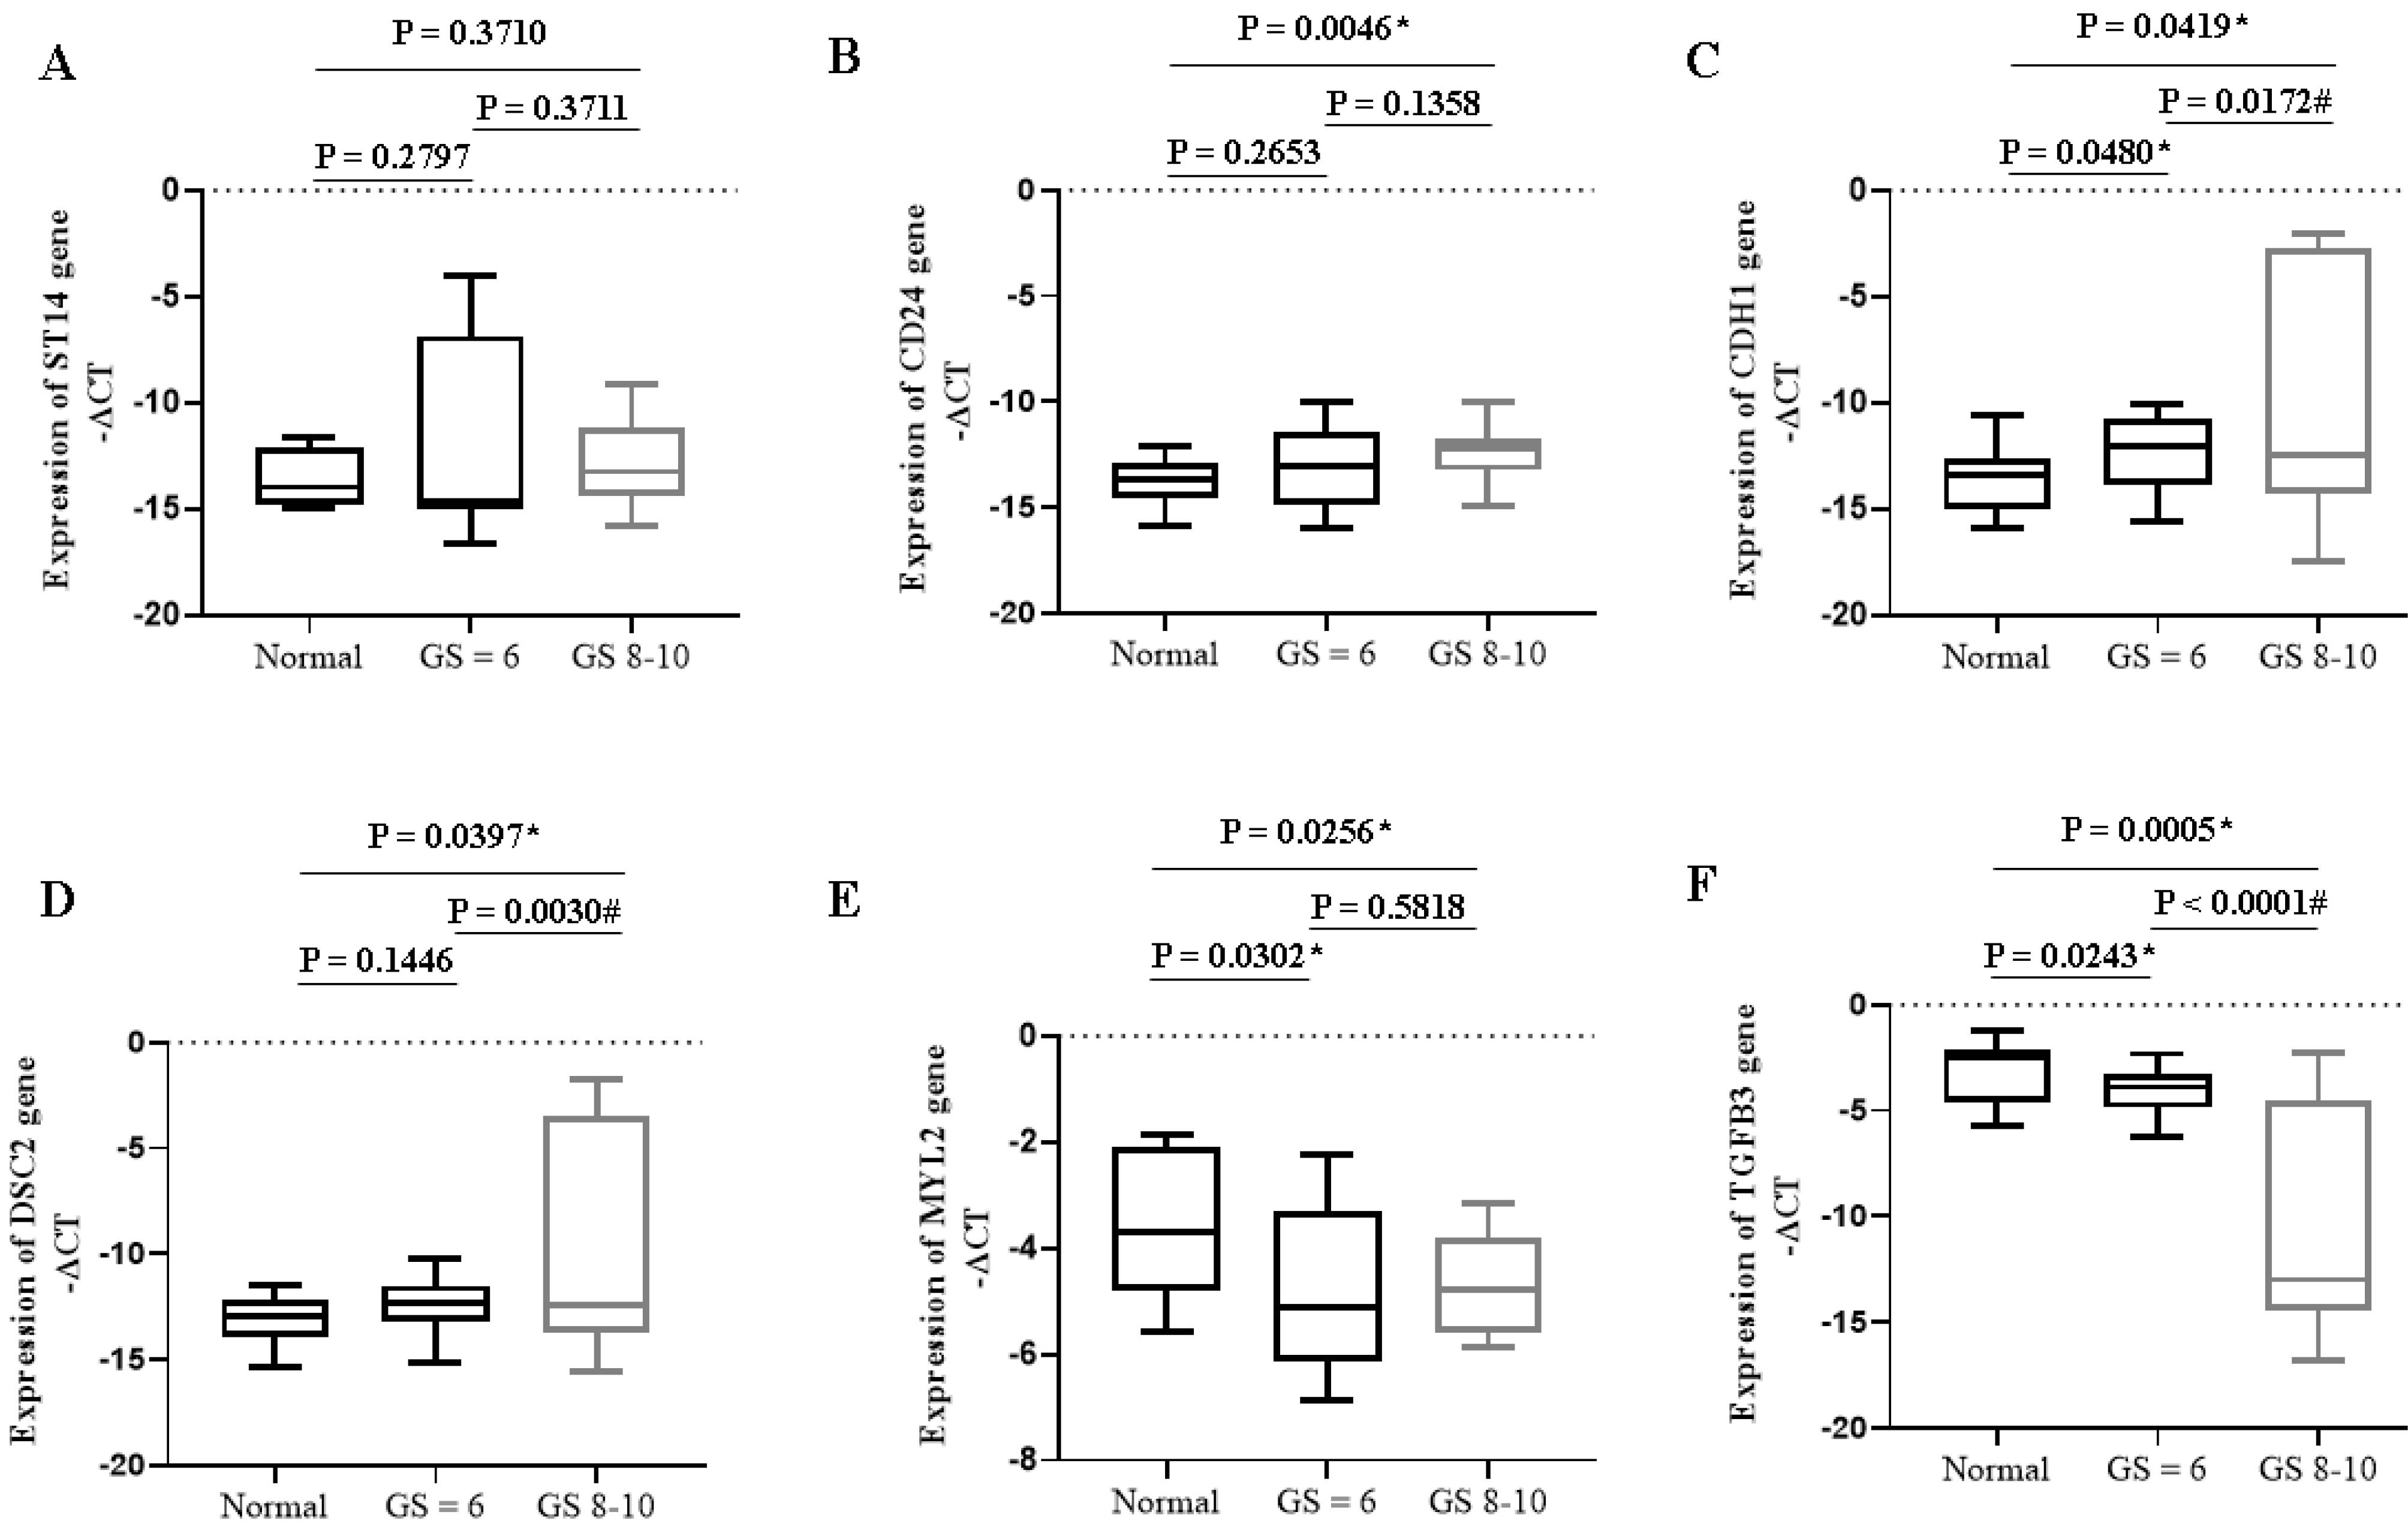
Fig. 4.
Expression of specific mRNAs in PC patients with different Gleason scores. * P < 0.05 compared to the normal group; # P < 0.05 compared to GS ≤ 6. GS: Gleason Score.
.
Expression of specific mRNAs in PC patients with different Gleason scores. * P < 0.05 compared to the normal group; # P < 0.05 compared to GS ≤ 6. GS: Gleason Score.
Our results also showed that the expression of candidate onco-miRNAs such as miR-203a (P < 0.0001), miR-217 (P = 0.0003), and miR-375 (P = 0.0003) increased significantly in PC patients with higher Gleason scores compared to lower ones (Fig. 3). The expression of tumor suppressor miRNAs such as miR-27b (P < 0.0001) and miR-152 (P < 0.0001) decreased significantly in PC patients with higher Gleason scores compared to lower ones (Fig. 3).
Our results also showed that the expression of oncogenes such as CDH1 (P = 0.0172) and DSC2 (P = 0.0030) increased significantly in PC patients with higher Gleason scores compared to lower ones (Fig. 4). The expression of tumor suppressor genes such as TGFB3 (P < 0.0001) decreased significantly in PC patients with higher Gleason scores compared to lower ones (Fig. 4).
Furthermore, CIMminer software was used to create a heatmap showing the expression of specific lncRNAs, miRNAs, and mRNAs in PC patients. This issue was based on Gleason scores' clinicopathologic status. We showed that the high expression of the onco-lncRNAs, onco-miRNAs, and oncogenes and the low expression of the tumor suppressors led to increases in Gleason scores (see Supplementary file 6).
Discussion
Our bioinformatics results demonstrated that 6 lncRNAs, 6 miRNAs, and 6 mRNAs were differentially expressed in PC patients. Unlike candidate tumor suppressor expression, onco-lncRNA, onco-miRNA, and oncogene expression were significantly increased in PC patients compared to the normal group. Despite a substantial decrease in the tumor suppressors, the expression levels of specific onco-miRNAs, onco-lncRNAs, and oncogenes showed a considerable increase in the high Gleason scores compared to the lower ones.
Sigel et al showed that most PC patients in advanced stages are resistant to treatment.16 In this setting, many morphological, immunological, and molecular characteristics are employed to assess the progression or prognosis of prostate cancer.13,17 Considering this approach, our study found specific ceRNA networks of PC in different groups that may be used as diagnostic or prognostic values. In the benign prostatic hyperplasia group, we reported LINC02371, miR-375, and CD24 biomarkers, which can be detected in the earliest stages of PC patients. LINC02371 was not previously reported, but similar to our results, some studies have reported over-expression of miR-375 and CD24 in PC patients.18,19 As differential markers of the locally advanced group, LINC01128, and miR-27b have been discovered in PC patients. However, a report showed the role of LINC01128 in pancreatic cancer progression.20 Here, we reported ST14 overexpression in the locally advanced group. Similarly, a higher expression level of ST14 in prostate cancer cell lines has been observed in another study.21 The specific markers identified for the current study's local group of PC patients included LINC02246, miR-876, and MYL2, while LINC02246 and MYL2 were found. In line with our findings, Aakula et al reported the down-regulation of miR-876.22 Regarding the biochemical relapse group, LINC00857, miR-203a, and TGFB3 could differentiate in PC patients with more advanced groups of the disease. Similarly, Gong et al showed a lower LINC00857 level with a poorer survival rate in PC patients.23 However, we observed LINC00857 and miR-203 as onco-lncRNA and oncomiR, respectively, which were overexpressed in the biochemical relapse samples. In this setting, the potential role of TGFB3 as a specific marker of the biochemical relapse group has been reported in PC patients. As a result of this study, we reported several specific markers that could be used to distinguish metastatic PC patients from other groups. GNAS-AS1 and LINC02288 have been found in the metastatic group of PC patients. However, their role has been mentioned in different conditions, including osteoarthritis and lung adenocarcinoma.24,25 Moreover, miR-217 and miR-152 were identified as two miRNAs that distinguish metastatic group of the disease. In this setting, Zhu et al. identified miR-152 as a tumor suppressor in PC, which aligns with our findings.26 CDH1 and DSC2 are other genes whose differential expression was specifically observed in the metastatic group of PC patients. CDH1 (E-cadherin expressing gene) significantly increased in metastatic PC compared with other groups.27 Another oncogene was DSC2 (Desmocollin-2), a DSC family member. Similar to our results, Jiang et al reported overexpression of DSC2 in DU-145, VCaP, and LNCaP PC cell lines compared with RWPE-1, a normal prostate cell line.28
The specific biomarkers in this study were also linked to Gleason scores in different PC groups. Using these biomarkers shows that, unlike candidate tumor suppressors, PC patients with higher Gleason scores onco-lncRNA, onco-miRNA, and oncogenes displayed a significant increase compared to the patients with lower ones. Brase et al demonstrated that miRNAs such as miR-375 were associated with higher Gleason scores, which aligns with our study.29 Thus, candidate lncRNAs, miRNAs, and mRNAs could be used to diagnose PC patients. These biomarkers would be a novel strategy with effective targets for developing treatments in the future.
The study's limitations relate to the limited sample size; however, significant effects have been seen in many biomarkers. On the other hand, we set the exclusion criteria high to minimize confounding factors. Additionally, the treatment traits were selected based on a statistical profile of group individuals. However, it should be noted that the sampling was done before the start of treatment and after the diagnosis and placement of patients in different stages of the disease.
Conclusion
Our results showed that these biomarkers could be distinguished in different groups of PC patients. The candidate lncRNAs, miRNAs, and mRNAs may be targets for developing effective therapeutic strategies.
Research Highlights
What is the current knowledge?
-
LncRNA-miRNA-mRNA regulatory networks and their interaction are explored in relation to the expression of genes and signaling pathways in prostate cancer progression.
-
The application of these networks in detection and therapy still needs to be improved.
What is new here?
-
The high expression of onco-lncRNAs, -miRNAs, and -mRNAs and the low expression of the tumor suppressors are associated with high malignancy in prostate cancer.
-
The specific lncRNAs, miRNAs, and mRNAs biomarkers may be targets for developing effective diagnostic and therapeutic strategies.
Competing interests
The manuscript's authors have no conflicts of interest and are responsible for the paper's content.
Data availability statement
The data supporting this study's findings are available from the corresponding author, AMA, upon reasonable request.
Ethical statement
All methods were performed under the relevant guidelines and regulations. All procedures performed in studies involving human participants were under institutional and/or national ethical standards. In addition, they were subject to the 1964 Helsinki Declaration and its later amendments or comparable ethical standards. A review board committee approved the experimental procedures and care protocols of the Iran University of Medical Sciences (NO: IR.IUMS.FMD.REC.1401.100). Written informed consent was obtained from each participant before sample collection.
Supplementary files
Supplementary file 1. A flowchart diagram for analyzing bioinformatics data.
(tiff)
Supplementary file 2. The sequence of real-time PCR primers.
(pdf)
Supplementary file 3. The identification of hub genes in different groups of prostate cancer patients.
(xlsx)
Supplementary file 4. Gene ontology (GO) enrichment analysis.
(xlsx)
Supplementary file 5. Protein-protein interaction network. A) Hub genes of the benign prostatic hyperplasia group, B) hub genes of the local group, C) hub genes of the locally advanced group, D) hub genes of the metastatic group, and E) hub genes of the biochemical relapse group
Protein-protein interaction constructed with hub genes from GEO and TCGA datasets that show the interaction between hub genes using STRING and Cytoscape software.
(pdf)
Supplementary file 6. A plot heatmap showing the gene expression profile of hub genes in both (A) bioinformatics and (B) experimental data (-∆CT), and (C) Gleason score (≤ 6 and 8-10) in prostate cancer patients. The green and red color indicates down-and up-regulated lncRNA-miRNA-mRNA interactions, respectively between tumor and normal samples.
(pdf)
Acknowledgements
This study was co-funded by the Tehran University of Medical Sciences (Grant Number: 56224) and the Iran University of Medical Sciences (Grant Number: 22341).
References
- Edwards DR, Moroz K, Zhang H, Mulholland D, Abdel-Mageed AB, Mondal D. PRL-3 increases the aggressive phenotype of prostate cancer cells in vitro and its expression correlates with high-grade prostate tumors in patients. Int J Oncol 2018; 52:402-12. doi: 10.3892/ijo.2017.4208 [Crossref] [ Google Scholar]
- Vahabzadeh G, Khalighfard S, Alizadeh AM, Yaghobinejad M, Mardani M, Rastegar T. A systematic method introduced a common lncRNA-miRNA-mRNA network in the different stages of prostate cancer. Front Oncol 2023; 13:1142275. doi: 10.3389/fonc.2023.1142275 [Crossref] [ Google Scholar]
- Statello L, Guo CJ, Chen LL, Huarte M. Gene regulation by long non-coding RNAs and its biological functions. Nat Rev Mol Cell Biol 2021; 22:96-118. doi: 10.1038/s41580-020-00315-9 [Crossref] [ Google Scholar]
- Faghihi MA, Zhang M, Huang J, Modarresi F, Van der Brug MP, Nalls MA. Evidence for natural antisense transcript-mediated inhibition of microRNA function. Genome Biol 2010; 11:R56. doi: 10.1186/gb-2010-11-5-r56 [Crossref] [ Google Scholar]
- Cui M, You L, Ren X, Zhao W, Liao Q, Zhao Y. Long non-coding RNA PVT1 and cancer. Biochem Biophys Res Commun 2016; 471:10-4. doi: 10.1016/j.bbrc.2015.12.101 [Crossref] [ Google Scholar]
- Masliah-Planchon J, Garinet S, Pasmant E. RAS-MAPK pathway epigenetic activation in cancer: miRNAs in action. Oncotarget 2016; 7:38892-907. doi: 10.18632/oncotarget.6476 [Crossref] [ Google Scholar]
- Panda M, Biswal BK. Cell signaling and cancer: a mechanistic insight into drug resistance. Mol Biol Rep 2019; 46:5645-59. doi: 10.1007/s11033-019-04958-6 [Crossref] [ Google Scholar]
- Sun Y, Zou X, He J, Mao Y. Identification of long non-coding RNAs biomarkers associated with progression of endometrial carcinoma and patient outcomes. Oncotarget 2017; 8:52604-13. doi: 10.18632/oncotarget.17537 [Crossref] [ Google Scholar]
- Ghorbanmehr N, Gharbi S, Korsching E, Tavallaei M, Einollahi B, Mowla SJ. miR-21-5p, miR-141-3p, and miR-205-5p levels in urine-promising biomarkers for the identification of prostate and bladder cancer. Prostate 2019; 79:88-95. doi: 10.1002/pros.23714 [Crossref] [ Google Scholar]
- Taheri M, Safarzadeh A, Hussen BM, Ghafouri-Fard S, Baniahmad A. LncRNA/miRNA/mRNA network introduces novel biomarkers in prostate cancer. Cells 2022; 11:3776. doi: 10.3390/cells11233776 [Crossref] [ Google Scholar]
- He JH, Han ZP, Zou MX, Wang L, Lv YB, Zhou JB. Analyzing the LncRNA, miRNA, and mRNA regulatory network in prostate cancer with bioinformatics software. J Comput Biol 2018; 25:146-57. doi: 10.1089/cmb.2016.0093 [Crossref] [ Google Scholar]
- Guan L, Ji D, Liang N, Li S, Sun B. Up-regulation of miR-10b-3p promotes the progression of hepatocellular carcinoma cells via targeting CMTM5. J Cell Mol Med 2018; 22:3434-41. doi: 10.1111/jcmm.13620 [Crossref] [ Google Scholar]
- Klein EA, Santiago-Jiménez M, Yousefi K, Robbins BA, Schaeffer EM, Trock BJ. Molecular analysis of low-grade prostate cancer using a genomic classifier of metastatic potential. J Urol 2017; 197:122-8. doi: 10.1016/j.juro.2016.08.091 [Crossref] [ Google Scholar]
- Chin JL, Bauman GS. Re: benefits and risks of primary treatments for high-risk localized and locally advanced prostate cancer: an international multidisciplinary systematic review. Eur Urol 2020; 78:765-6. doi: 10.1016/j.eururo.2020.06.016 [Crossref] [ Google Scholar]
- Parker CC, Clarke NW, Catton C, Kynaston H, Cook A, Cross W. RADICALS-HD: reflections before the results are known. Clin Oncol (R Coll Radiol) 2022; 34:593-7. doi: 10.1016/j.clon.2022.06.004 [Crossref] [ Google Scholar]
- Siegel RL, Miller KD, Jemal A. Cancer statistics, 2018. CA Cancer J Clin 2018; 68:7-30. doi: 10.3322/caac.21442 [Crossref] [ Google Scholar]
- Sinnott JA, Peisch SF, Tyekucheva S, Gerke T, Lis R, Rider JR. Prognostic utility of a new mRNA expression signature of Gleason score. Clin Cancer Res 2017; 23:81-7. doi: 10.1158/1078-0432.Ccr-16-1245 [Crossref] [ Google Scholar]
- Zedan AH, Osther PJS, Assenholt J, Madsen JS, Hansen TF. Circulating miR-141 and miR-375 are associated with treatment outcome in metastatic castration resistant prostate cancer. Sci Rep 2020; 10:227. doi: 10.1038/s41598-019-57101-7 [Crossref] [ Google Scholar]
- Zhang Y, Li B, Zhang X, Sonpavde GP, Jiao K, Zhang A. CD24 is a genetic modifier for risk and progression of prostate cancer. Mol Carcinog 2017; 56:641-50. doi: 10.1002/mc.22522 [Crossref] [ Google Scholar]
- Zhong M, Fang Z, Ruan B, Xiong J, Li J, Song Z. LINC01128 facilitates the progression of pancreatic cancer through up-regulation of LDHA by targeting miR-561-5p. Cancer Cell Int 2022; 22:93. doi: 10.1186/s12935-022-02490-5 [Crossref] [ Google Scholar]
- Wang Y, Rathinam R, Walch A, Alahari SK. ST14 (suppression of tumorigenicity 14) gene is a target for miR-27b, and the inhibitory effect of ST14 on cell growth is independent of miR-27b regulation. J Biol Chem 2009; 284:23094-106. doi: 10.1074/jbc.M109.012617 [Crossref] [ Google Scholar]
- Aakula A, Kohonen P, Leivonen SK, Mäkelä R, Hintsanen P, Mpindi JP. Systematic identification of microRNAs that impact on proliferation of prostate cancer cells and display changed expression in tumor tissue. Eur Urol 2016; 69:1120-8. doi: 10.1016/j.eururo.2015.09.019 [Crossref] [ Google Scholar]
- Gong X, Ning B. Five lncRNAs associated with prostate cancer prognosis identified by coexpression network analysis. Technol Cancer Res Treat 2020; 19:1533033820963578. doi: 10.1177/1533033820963578 [Crossref] [ Google Scholar]
- Fu Q, Zhu J, Wang B, Wu J, Li H, Han Y. LINC02288 promotes chondrocyte apoptosis and inflammation through miR-374a-3p targeting RTN3. J Gene Med 2021; 23:e3314. doi: 10.1002/jgm.3314 [Crossref] [ Google Scholar]
- He J, Xi X, Cao P, Zhou J, Liu H, Li N. Long non-coding RNA GNAS-AS1 knockdown inhibits proliferation and epithelial-mesenchymal transition of lung adenocarcinoma cells via the microRNA-433-3p/Rab3A axis. Open Med (Wars) 2023; 18:20230740. doi: 10.1515/med-2023-0740 [Crossref] [ Google Scholar]
- Zhu C, Li J, Ding Q, Cheng G, Zhou H, Tao L. miR-152 controls migration and invasive potential by targeting TGFα in prostate cancer cell lines. Prostate 2013; 73:1082-9. doi: 10.1002/pros.22656 [Crossref] [ Google Scholar]
- Lin CY, Chuu CP. Friend or foe: role of E-cadherin in prostate cancer metastasis. Transl Androl Urol 2016; 5:961-3. doi: 10.21037/tau.2016.11.08 [Crossref] [ Google Scholar]
- Jiang F, Wu P. Regulating DSC2 expression affects the proliferation and apoptosis of prostate cancer cells. Cancer Manag Res 2020; 12:11453-62. doi: 10.2147/cmar.S273394 [Crossref] [ Google Scholar]
- Brase JC, Johannes M, Schlomm T, Fälth M, Haese A, Steuber T. Circulating miRNAs are correlated with tumor progression in prostate cancer. Int J Cancer 2011; 128:608-16. doi: 10.1002/ijc.25376 [Crossref] [ Google Scholar]