Bioimpacts. 2025;15:30586.
doi: 10.34172/bi.30586
Original Article
Smart IoT-driven biosensors for EEG-based driving fatigue detection: A CNN-XGBoost model enhancing healthcare quality
Khosro Rezaee Conceptualization, Investigation, Methodology, Project administration, Writing – original draft, 1, * 
Asmar Nazerian Data curation, Formal analysis, Methodology, Writing – original draft, 2
Hossein Ghayoumi Zadeh Conceptualization, Formal analysis, Resources, Supervision, Visualization, 3
Hani Attar Investigation, Validation, Writing – review & editing, 4
Mohamadreza Khosravi Resources, Validation, Writing – review & editing, 5, 6, 7
Mohammad Kanan Data curation, Methodology, Project administration, Supervision, Visualization, 8
Author information:
1Department of Biomedical Engineering, Meybod University, Meybod, Iran
2Department of Engineering, Islamic Azad University, Qods Branch, Tehran, Iran
3Department of Electrical Engineering, Faculty of Engineering, Vali-e-Asr University of Rafsanjan, Rafsanjan, Iran
4Faculty of Engineering, Zarqa University, Zarqa, Jordan
5Department of Medical Physics and Engineering, School of Medicine, Shiraz University of Medical Sciences, Shiraz, Iran
6IT Services, Lidoma Sanat Mehregan Part Ltd., Shiraz 71581, Fars, Iran
7SPUL4PH Lab, Weifang University of Science and Technology, Weifang 262700, China
8College of Engineering, University of Business and Technology, Jeddah, Saudi Arabia
Abstract
Introduction:
Drowsy driving is a significant contributor to accidents, accounting for 35 to 45% of all crashes. Implementation of an internet of things (IoT) system capable of alerting fatigued drivers has the potential to substantially reduce road fatalities and associated issues. Often referred to as the internet of medical things (IoMT), this system leverages a combination of biosensors, actuators, detectors, cloud-based and edge computing, machine intelligence, and communication networks to deliver reliable performance and enhance quality of life in smart societies.
Methods:
Electroencephalogram (EEG) signals offer potential insights into fatigue detection. However, accurately identifying fatigue from brain signals is challenging due to inter-individual EEG variability and the difficulty of collecting sufficient data during periods of exhaustion. To address these challenges, a novel evolutionary optimization method combining convolutional neural networks (CNNs) and XGBoost, termed CNN-XGBoost Evolutionary Learning, was proposed to improve fatigue identification accuracy. The research explored various subbands of decomposed EEG data and introduced an innovative approach of transforming EEG recordings into RGB scalograms. These scalogram images were processed using a 2D Convolutional Neural Network (2DCNN) to extract essential features, which were subsequently fed into a dense layer for training.
Results:
The resulting model achieved a noteworthy accuracy of 99.80% on a substantial driver fatigue dataset, surpassing existing methods.
Conclusion:
By integrating this approach into an IoT framework, researchers effectively addressed previous challenges and established an artificial intelligence of things (AIoT) infrastructure for critical driving conditions. This IoT-based system optimizes data processing, reduces computational complexity, and enhances overall system performance, enabling accurate and timely detection of fatigue in extreme driving environments.
Keywords: Driving fatigue, Extreme environment, EEG signals, Optimized XGBoost, Convolutional neural network, IoMT
Copyright and License Information
© 2025 The Author(s).
This work is published by BioImpacts as an open access article distributed under the terms of the Creative Commons Attribution Non-Commercial License (
http://creativecommons.org/licenses/by-nc/4.0/). Non-commercial uses of the work are permitted, provided the original work is properly cited.
Funding Statement
This research did not receive any specific grant from funding agencies in the public, commercial, or not-for-profit sectors.
Introduction
Accidental injuries will be the top cause of mortality and the eighth major cause of death worldwide in 2030.1,2 According to estimates, driving fatigue is the leading cause of traffic accidents.3 Nowadays, drowsy driving fatalities are a global problem, since they pose a grave threat to people's lives and property. As well as being subjectively uncomfortable, fatigue can also negatively impact an individual's quality of life objectively.4 Early driver fatigue is mostly evaluated from a medical standpoint using medical technology in the laboratory.5 Several studies in the field of tiredness analysis have benefited from technologies such as image processing, signal processing, face evaluation, and physiological signals, or a combination thereof.6 Few studies, however, have examined driving conditions and the excessive weariness of drivers in extreme environments. Given that harsh climatic conditions exceed the ideal range for human growth and bring about distinct biological changes, face or composite-based analyses may not be effective. These include driving in mining areas, polar regions, radioactive environments, and extremely arid deserts. Changes in pH, oxygen levels, temperature, heat, and humidity occur under these circumstances, making it harder to diagnose weariness.
To investigate driving tiredness in extreme environments, several studies incorporate mental and objective monitoring via electroencephalogram signals. The examination of electroencephalography (EEG) signals, which have long been regarded as the 'gold standard' for fatigue monitoring, is crucial in recognizing exhaustion in extreme environments.7 Additionally, weariness is one of the leading causes of vehicle incidents in such environments.8 In order to handle the vehicle properly, brain tiredness detection technologies must accurately reflect the driver's mental acuity. Several scientific organizations utilize EEG data to intuitively depict the driver's mental state.9-11 EEG signal analysis can be beneficial for monitoring the mental state of drivers in extreme environments, which presents difficulties. Yet, one of the difficulties is the extraction of complete features from complicated and unstable EEG signals and the processing of data in many dimensions. Due to the vast amount of information collected, specific methods or technologies can be employed to reduce the bulk. In recent years, the construction of a wireless physiological signal monitoring system with secure data exchange inside the health care system has been a significant and dynamic activity.12 The use of the internet of medical things (IoMT) architecture, specifically smart biosensors at the edge, to enable mobility and rapid access to people's data has had a substantial influence in recent years.13,14 Another difficulty is discovering the link between various disciplines and learning characteristics.14 During data collection, variations in EEG signals across individuals are attributed to sleep quality, brain activity, and undefined external interference sources.
EEG-based monitoring systems have been shown to accurately detect and measure drowsiness in real-time based on existing research on EEG signals. By analyzing the electrical signals generated by the brain during periods of fatigue, these systems provide valuable insights into a driver's alertness level. Research like this contributes to the advancement of IoT/AIoT computing in healthcare, enabling the development of innovative solutions for monitoring and improving driver safety.15 There are many ways to diagnose fatigue using EEG signals. The data collection process was influenced by several techniques, such as facial expressions and peripheral physiological indicators. However, few studies have investigated how EEG signals can be used to identify weariness in extreme environments. EEG analysis includes several recognition models and explores numerous possibilities for developing integrated systems. Recently, EEG data for tiredness diagnosis have been processed using machine learning (ML), deep learning (DL), and a variety of real-world applications.
Zeng et al. introduced an enhanced transfer learning method, InstanceEasyTL, to detect driver fatigue using EEG signals. This approach surpassed EasyTL in accuracy, stability, and data efficiency.16 Min et al proposed a hybrid framework combining prefrontal EEG, multiple entropy measures, and a hybrid model, achieving superior fatigue detection accuracy in real-world conditions.17 Ren et al developed a radial basis function network with a two-level learning hierarchy, employing PCA for feature extraction, and attaining a 92.71% accuracy in detecting driver fatigue.18 Zeng et al proposed a transfer learning model combining DANN and GAN, achieving a 91.63% accuracy in cross-individual fatigue detection.19
Abdubrani et al introduced a comprehensive framework for driver fatigue detection using EEG analysis and various machine learning architectures.20 Their modified z-score method yielded a remarkable 99.65% accuracy in fatigue detection. Yang et al developed a broad learning system based on complex networks, demonstrating high accuracy in distinguishing between alert and fatigued states.21 Du et al proposed a fuzzy convolutional neural network combining EEG and ECG, achieving high accuracy and stability in detecting fatigue under noisy conditions.22 Wang et al employed Partial Directed Coherence to extract graph features from EEG, resulting in an 87.16% accuracy in fatigue detection.23 Zhang et al introduced a graph convolutional neural network based on Partial Directed Coherence, automatically extracting topological brain network features and achieving a 96.01% accuracy in fatigue detection.24 Zeng et al explored epidermal electronic systems for non-invasive mental fatigue monitoring, attaining an 89% accuracy using machine learning algorithms.25
Jantan et al. presented a multi-model approach utilizing convolutional neural networks, achieving over 99% accuracy in detecting driver fatigue.26 Gao et al developed a network combining spatial, frequency, and temporal information with an attention mechanism, surpassing other models in accuracy.27 Sangeetha et al. introduced a DL approach for detecting microsleep using various EEG signals, demonstrating high accuracy and real-world applicability.28 Jingwei developed a fatigue detection system combining EEG and Electromyography signals, utilizing the ThinkGear ASIC Module and signal analysis for accurate fatigue detection and driver alerts.29 Wu et al presented a DL model employing a sparse autoencoder for pilot fatigue detection, achieving high accuracy in detecting mental fatigue.30 Zhang et al introduced an auto-weighting incremental random vector functional link network for driver fatigue detection, outperforming existing methods with incremental learning capabilities.31 Sedik et al. developed a fatigue detection system combining fast Fourier transform and discrete wavelet transform (DWT) for feature extraction and noise reduction, achieving high accuracy in fatigue detection.32
Abbas and Alsheddy analyzed and compared different IoT platforms for driver fatigue detection, providing insights and improvement suggestions.33 Liu et al proposed transfer learning algorithms across individuals for mental fatigue detection, achieving higher accuracy with reduced calibration needs.34 Ding et al. presented a ResNet3D DL model for driver fatigue detection using three prefrontal EEG channels, achieving a 79.45% accuracy.35 Gao et al introduced a multi-dimensional feature fusion network for fatigue detection, achieving an 85.16% accuracy across various datasets.36
Wu et al employed AutoEncoder to extract features from EEG signals, compressing and representing EEG signals of pilots and using a SoftMax classifier for pilot fatigue detection, achieving a 91.68% accuracy.37 Wen et al utilized AutoEncoder for unsupervised feature learning of EEG signals and paired it with an AdaBoost classifier to detect fatigue from the DEAP dataset, achieving a 95.00% accuracy.38 Ma et al. presented a method using Modified-PCANet for feature extraction and SVM for EEG signal classification, achieving a 95.14% accuracy on a self-collected EEG dataset.39 Rundo et al. used Stacked AutoEncoder for feature extraction and SoftMax for classification, achieving a 100% accuracy on a self-collected EEG dataset.40 Panwar et al employed GAN for generating synthetic data and SoftMax for classification, achieving a 67.00% accuracy on a self-collected EEG dataset within a Wasserstein GAN setup.41 Lee et al combined LSTM and CNN to extract temporal and spatial features from EEG signals, achieving an 86.00% accuracy in three-class EEG signal classification using SoftMax.42
The reviewed studies showcase diverse approaches to driver fatigue detection using EEG signals, with high accuracy achieved through hybrid methods, DL, and feature extraction techniques. However, challenges such as extensive data requirements, computational complexity, and parameter optimization persist. The proposed CNN-XGBoost hybrid model aims to address these limitations by combining DL and boosting algorithms for improved accuracy and efficiency in detecting driver fatigue.
Moreover, conventional detection approaches require handcrafted feature extraction and rely on past information. Handcrafted extraction focuses solely on particular traits, ignoring others that are necessary for fatigue detection. In contrast, the DL model is capable of end-to-end feature learning (e2e). However, the majority of present studies only address DL models as classifiers. There is a need for more study on the impact of other subjects on the learned features.
Using convolutional concepts as a basis, this paper proposes a novel learning approach based on a fusion of convolution neural networks (CNNs) and Extreme Gradient Boosting (XGBoosts) for detecting brain fatigue in extreme environments. Our fatigue classification task combines CNN, XGBoost, and signal decomposition. Additionally, fatigue is detected using a limited number of channels, which results in good accuracy and a reduction in processing time. Our proposed scalogram image-based 2DCNN-XGBoost fusion approach is used to further process RGB images by applying continuous wavelet transform (CWT) to the existing EEG signals. In addition, we investigated the link between topics and characteristics. The primary contributions of this study are as follows:
-
A novel framework integrating CNN and XGBoost is proposed in this research. By employing Continuous Wavelet Transform, EEG signals are converted into RGB scalogram images. This innovative approach effectively addresses the challenge of driver fatigue detection, particularly in demanding environments. The fusion of CNN and XGBoost empowers the model with robust feature extraction and high-accuracy classification.
-
To enhance the efficiency of fatigue detection systems, an optimized dimensionality reduction method is introduced. This approach preserves essential EEG data features while significantly reducing data volume. Consequently, computational load and processing speed are optimized, making the method ideal for real-time applications in industrial and healthcare settings.
-
To enhance driver safety, this research comprehensively evaluates the CNN-XGBoost model within an IoT-driven biosensor framework for accurate fatigue detection. Rigorous testing under diverse conditions reveals the model's high reliability, positioning it as a crucial tool for preventing fatigue-related accidents.
The structure of this paper is as follows: Section 2 provides a detailed description of the proposed model architecture. In Section 3, the experimental data and results are presented. Section 4 discusses the challenges encountered and offers an outlook on future directions. Finally, Section 5 provides the conclusion, summarizing the key findings and their implications.
Materials and Methods
The proposed method for detecting driver fatigue in extreme environments is built upon the integration of advanced signal processing techniques and machine learning algorithms. This approach leverages the power of CNN and the XGBoost classifier, optimized through a modified particle swarm optimization (PSO) algorithm, to accurately identify fatigue based on EEG signals.
The system is designed to address the unique challenges presented by the variability and complexity of EEG data in extreme conditions. By transforming EEG recordings into scalogram images using CWT and then extracting features through a 2D-CNN, the method enhances the detection accuracy and robustness of the model. This section outlines the key components and processes involved in the proposed method, providing a detailed overview of the signal preprocessing, feature extraction, and classification steps, which collectively contribute to the system's high performance and generalizability across different scenarios. Fig. 1 depicts a potential system for identifying driver fatigue based on EEG data in extreme environments.
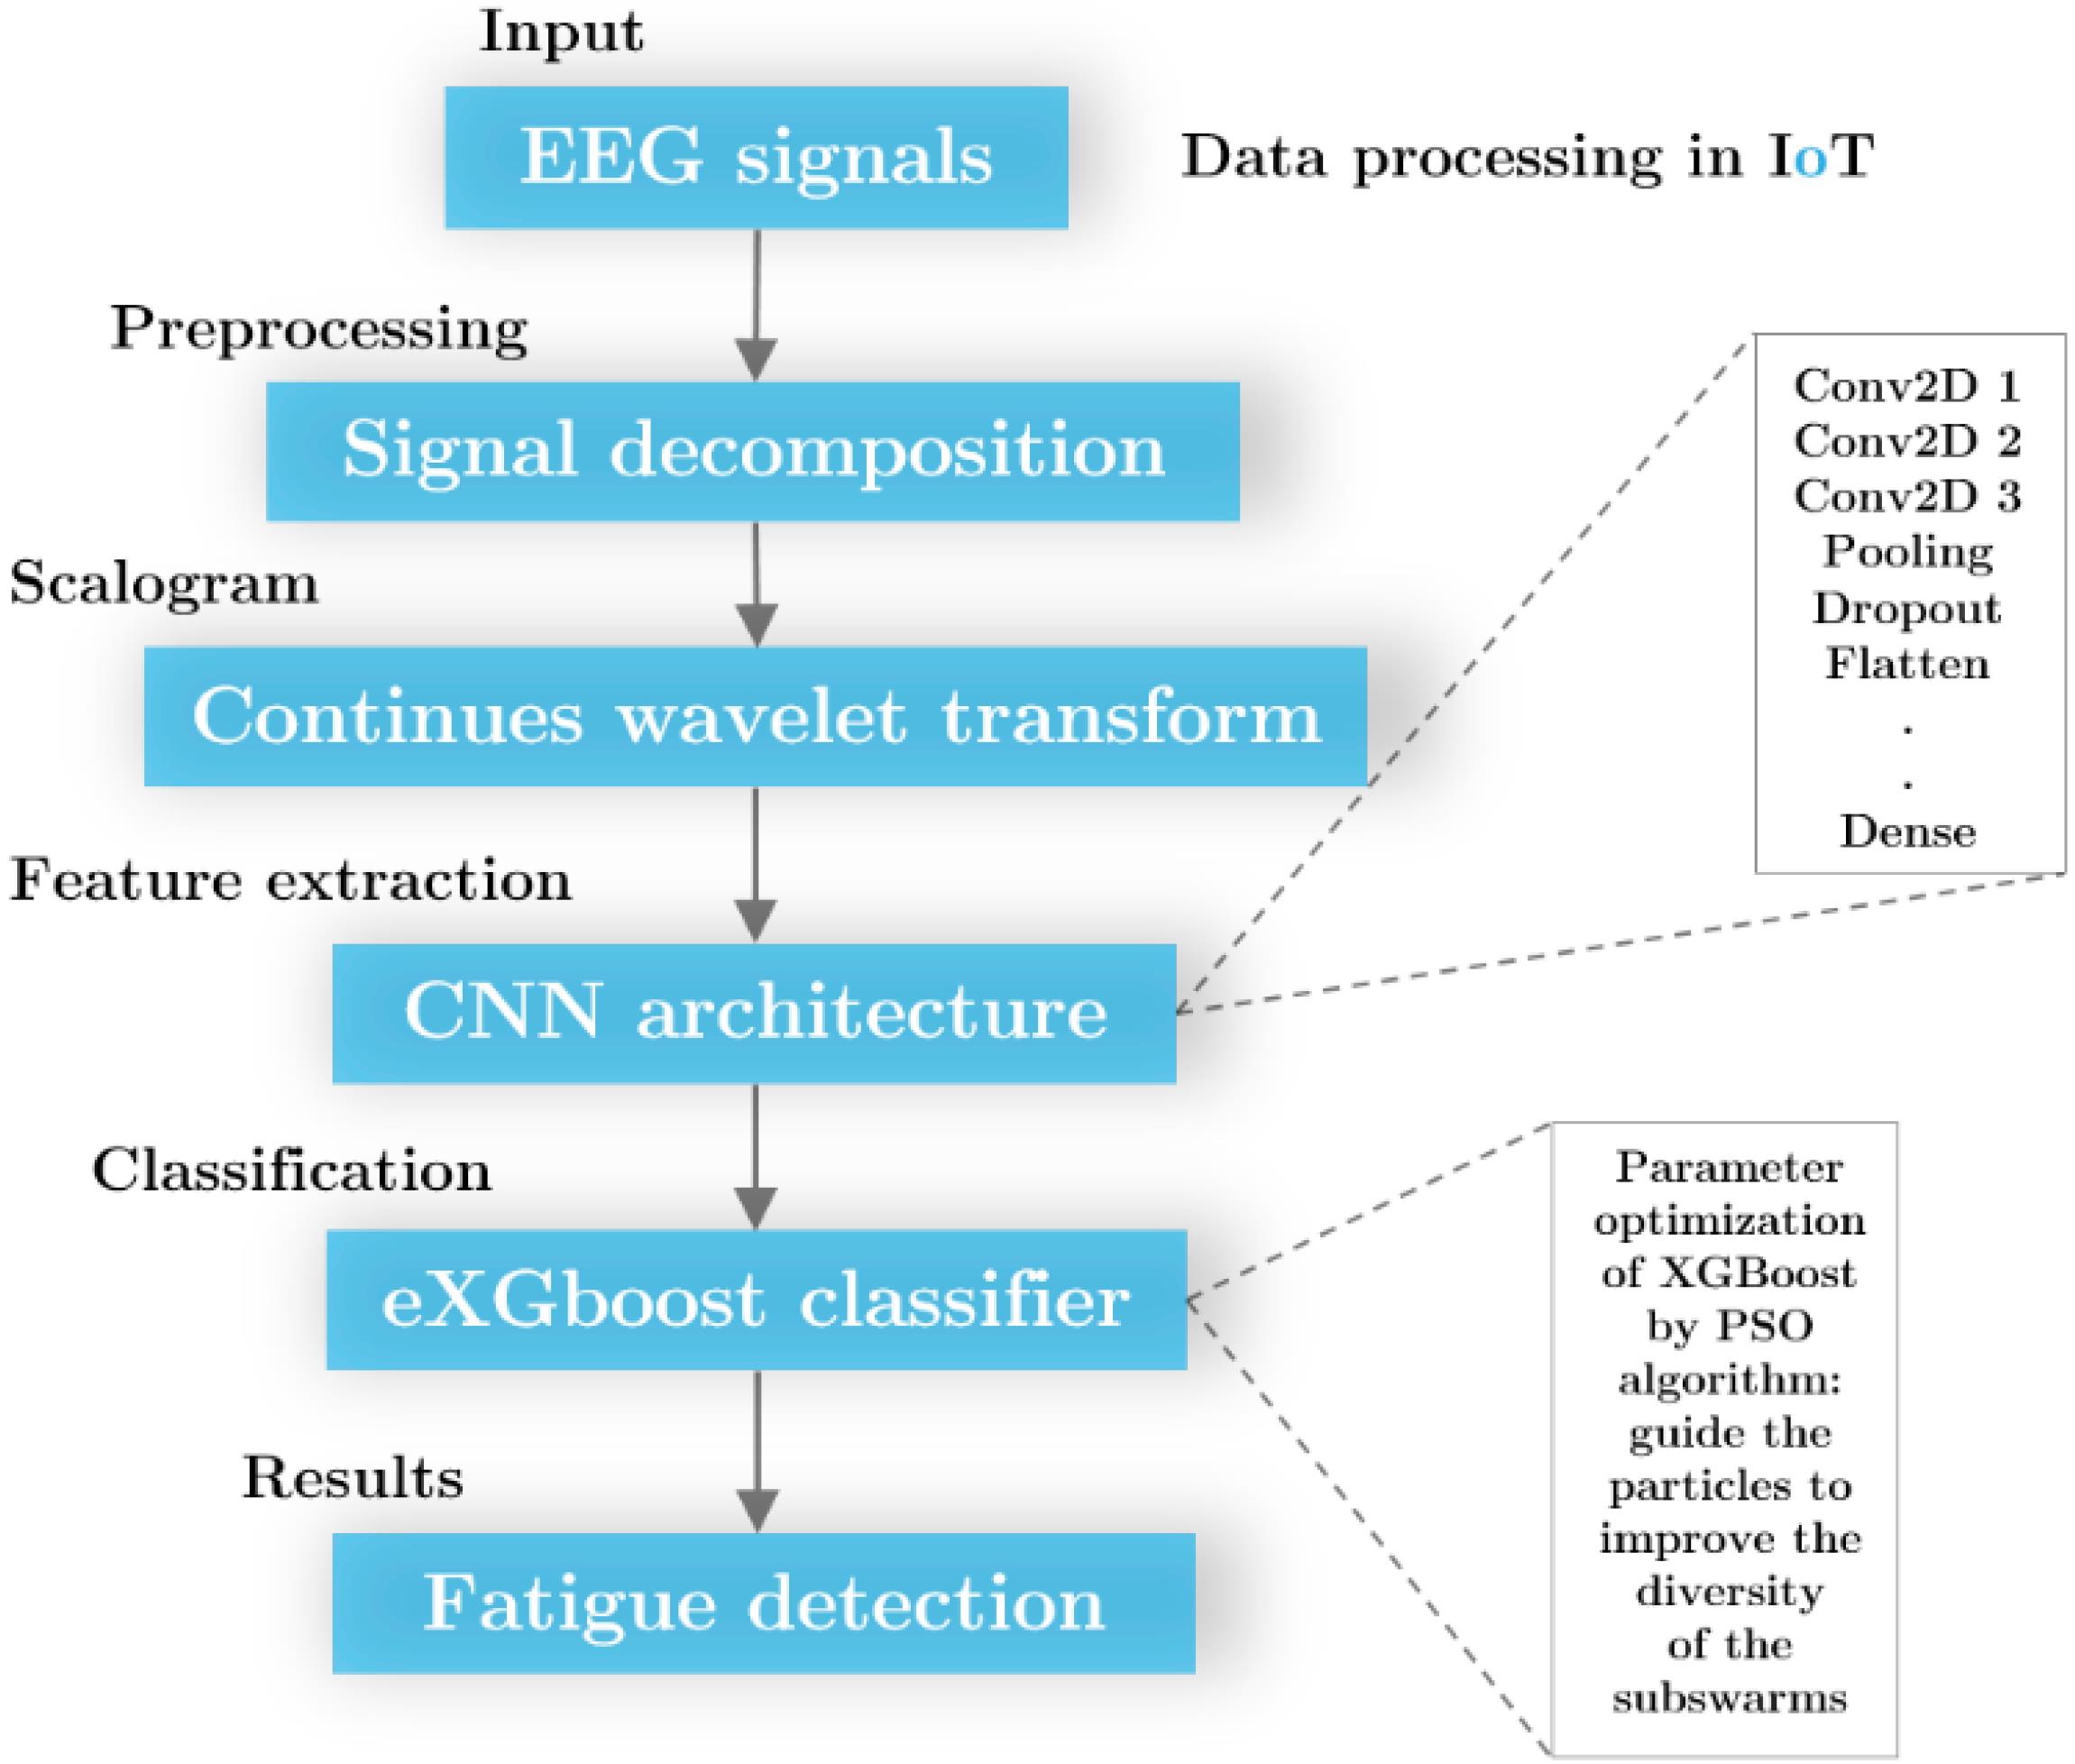
Fig. 1.
Overview of the proposed method for fatigue detection, illustrating the key steps involved in the process.
.
Overview of the proposed method for fatigue detection, illustrating the key steps involved in the process.
Dataset
In this study, we accessed EEG recordings from the Figshare database.43 The dataset we utilized is derived from the Figshare database, which includes EEG recordings from 16 participants (8 women and 8 men) aged 17 to 25. Each participant's EEG data was collected using a 32-electrode brain helmet during driving simulation tests. The dataset encompasses a comprehensive range of driving conditions and participant states, allowing us to capture a diverse set of fatigue indicators. EEG recordings typically last several minutes, followed by data analysis. Participants were instructed to drive in a simulated environment while EEG signals were collected. These signals often indicated fatigue, which varied in onset between participants. To measure fatigue, researchers employed Li's and Borg's scales. Neurologists categorized EEG signals into those from conscious and fatigued participants. However, identifying fatigue in EEG signals is complex due to the brain's dynamic nature. While the protocol focused on distinguishing conscious and fatigued states, it's acknowledged that fatigue might not be fully captured in the recorded signals. Driving simulators were used for the tests, according to the description. Driving simulators were used for the tests, according to the description. These simulations were conducted to replicate real-world driving conditions, allowing for the collection of EEG data under controlled yet realistic scenarios. The participants' EEG signals were recorded using a 32-electrode brain helmet, capturing brain activity during both conscious and fatigued states. The use of driving simulators ensured a consistent environment for all participants, making the dataset particularly valuable for developing and validating fatigue detection algorithms.
Signal preprocessing
There are four frequency bands in which human EEG recordings are usually divided: Theta (4-8 Hz), Alpha (8-13 Hz), Beta (13-30 Hz), and Gamma (30-48 Hz). Therefore, the DWT is used to determine the frequency, followed by the application of a Hanning window to divide the frequency band into time slices.
For the dilation and translation parameters a and b, make them discrete values, such as
and
, where m and n are integers. The equation (2) describes discrete wavelets by substituting these values for a and b in (1).
Where, ψ((t-b) × a-1) is the conjugate component of the mother wavelet ψ(t). In addition, a and b are two random real values. This equation defines the DWT, where ψa,b(t) is the wavelet function, a is the scaling parameter that controls the frequency, and b is the translation parameter that determines the time shift. The wavelet ψ(t) is a function that can be dilated and translated to analyze different parts of the signal at various scales and positions, making it useful for capturing both frequency and time-domain characteristics in EEG signals. On the time axis, the parameters a and b indicate the values for dilations and translations, respectively.
(2)
The DWT has no more than log_2 N phases when given a signal x[n] of length N. The starting point yields two sets of coefficients: the approximation coefficients cA1 and the detail coefficients cD1. Following decimation, these vectors are generated by convolving x[n] with the low-pass filter g for approximation and the high-pass filter h for detail:
The following step divides the approximation coefficients cA1 into two parts utilizing the identical method, yielding cA2 and cD2, respectively. Fig. 2 shows this method of sampling, commonly known as dynamic decomposition. These equations represent the convolution operations used to calculate the approximation coefficients cA[n] and detail coefficients cD[n] in the DWT. The signal x[k] is convolved with a low-pass filter g[n] to obtain the approximation coefficients, and with a high-pass filter h[n] to obtain the detail coefficients. These coefficients capture the low-frequency and high-frequency components of the EEG signal, respectively.
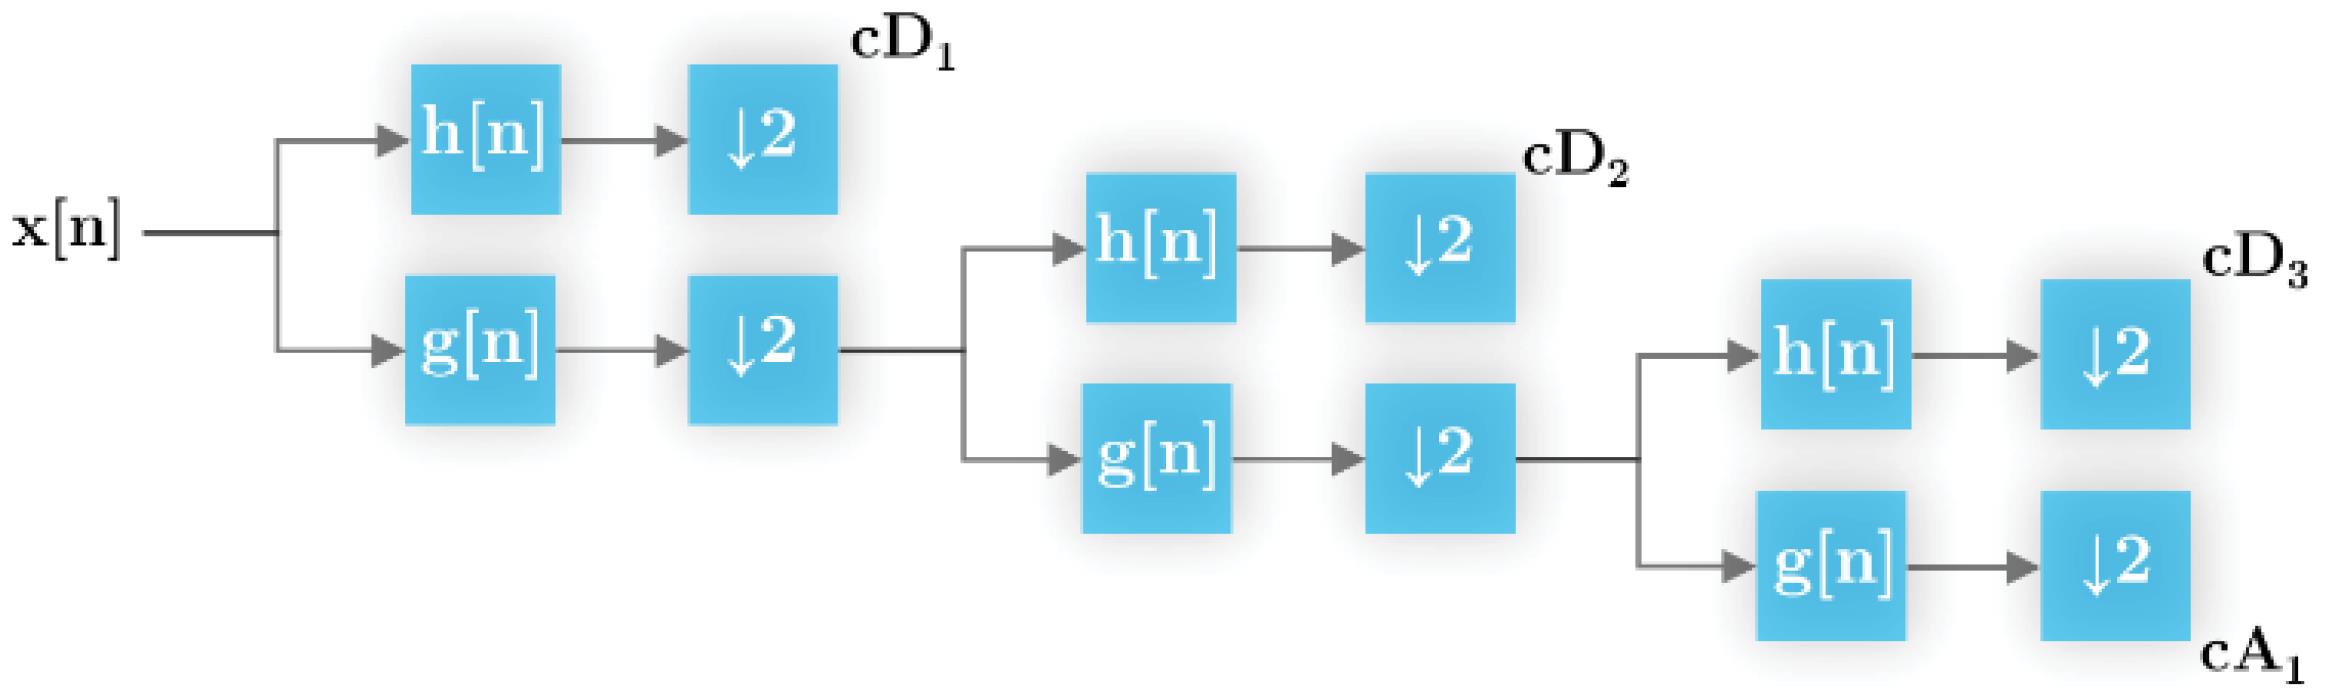
Fig. 2.
Illustration of the Discrete Wavelet Transform (DWT), also referred to as dynamic decomposition.
.
Illustration of the Discrete Wavelet Transform (DWT), also referred to as dynamic decomposition.
Scalogram of signal
Despite its non-stationary nature, the EEG signal exhibits multiple frequency spectra. In terms of the dynamics of an EEG signal, CWT is typically used to extract power from frequency bands. Notably, to address the non-stationary nature of EEG signals, we utilized the CWT combined with a Hanning window. The Hanning window was applied to mitigate spectral leakage by dividing the signal into smaller time slices, which helps in preserving the integrity of the signal during frequency analysis. The CWT was then used to transform these time slices into a time-frequency representation, allowing for an accurate analysis of the EEG signals' frequency content over time. This approach effectively resolves the non-stationary problem by enabling the extraction of meaningful features from the EEG signals, which are crucial for detecting driver fatigue.
By forming windows with varying widths from a wavelet function, the wavelet takes advantage of the fact that low-frequency signals spread over time, while high-frequency impulses occur at short intervals. Convolution is conducted by a window that moves along a signal in CWT:
(5)
A translation parameter is b, and a scaling parameter is 0 < a < ∞. Temporal localization of frequency features requires a Complex Morlet mother wavelet that is non-orthogonal and exponentially complicated [41]. Thus, W(a,b) is the wavelet coefficient, x(t) is the signal being analyzed, a is the scale parameter, and b is the translation parameter. The CWT is used to transform the EEG signal into a time-frequency representation, where each coefficient represents the signal’s content at a specific scale and time. As shown below, a complex Morlet wavelet consists of cosine and sine waves combined with a Gaussian function:
(6)
Based on the sine signal's fundamental frequency and the Gaussian bandwidth, the mother wavelet's time and frequency resolution can be described as follows44:
There is a trade-off between frequency and time resolution. In these equations, the parameters a and b are crucial for fine-tuning the model's behavior based on the characteristics of the dataset. Parameter a typically controls the influence of specific features, such as time-domain aspects of EEG signals, while b might adjust the regularization strength or balance between model components. These parameters are selected through empirical testing and optimization to enhance model performance, ensuring sensitivity to relevant features while maintaining generalizability across different datasets, particularly in challenging conditions like extreme environments.
The Hanning window and Complex Morlet wavelet were specifically chosen for their ability to enhance the accuracy and robustness of signal processing in our proposed method. The Hanning window is used in the preprocessing stage to mitigate spectral leakage when dividing the EEG signal into time slices. This windowing function is essential for minimizing distortions that can occur during the frequency analysis of the EEG signal, thereby preserving the integrity of the signal's features. The Complex Morlet wavelet, on the other hand, is employed for its excellent time-frequency localization properties, which are crucial in analyzing non-stationary signals like EEG. The combination of cosine and sine waves with a Gaussian function allows the Complex Morlet wavelet to effectively capture both the temporal and spectral characteristics of the EEG data. This capability is particularly important for detecting subtle changes in brain activity that are indicative of driver fatigue, as it ensures that both high-frequency and low-frequency components are accurately represented. Together, these methods contribute significantly to the overall approach by providing a reliable and precise framework for feature extraction, which is foundational to the success of the subsequent classification steps in the model.
Deep CNN
Fig. 3 shows the total two-dimensional CNN model employed in our proposed structure (see Fig. 1), as well as our 2DCNN-XGBoost fusion strategy. Before using this Classifier model, we created spectrum illustrations by filtering the frequency range with signals between 4 and 30 Hz, and then extracted features with a 2D CNN and another dense layer. As part of our evaluation of the proposed solution, we developed a test environment. The following is a description of the algorithm trained using CNN:
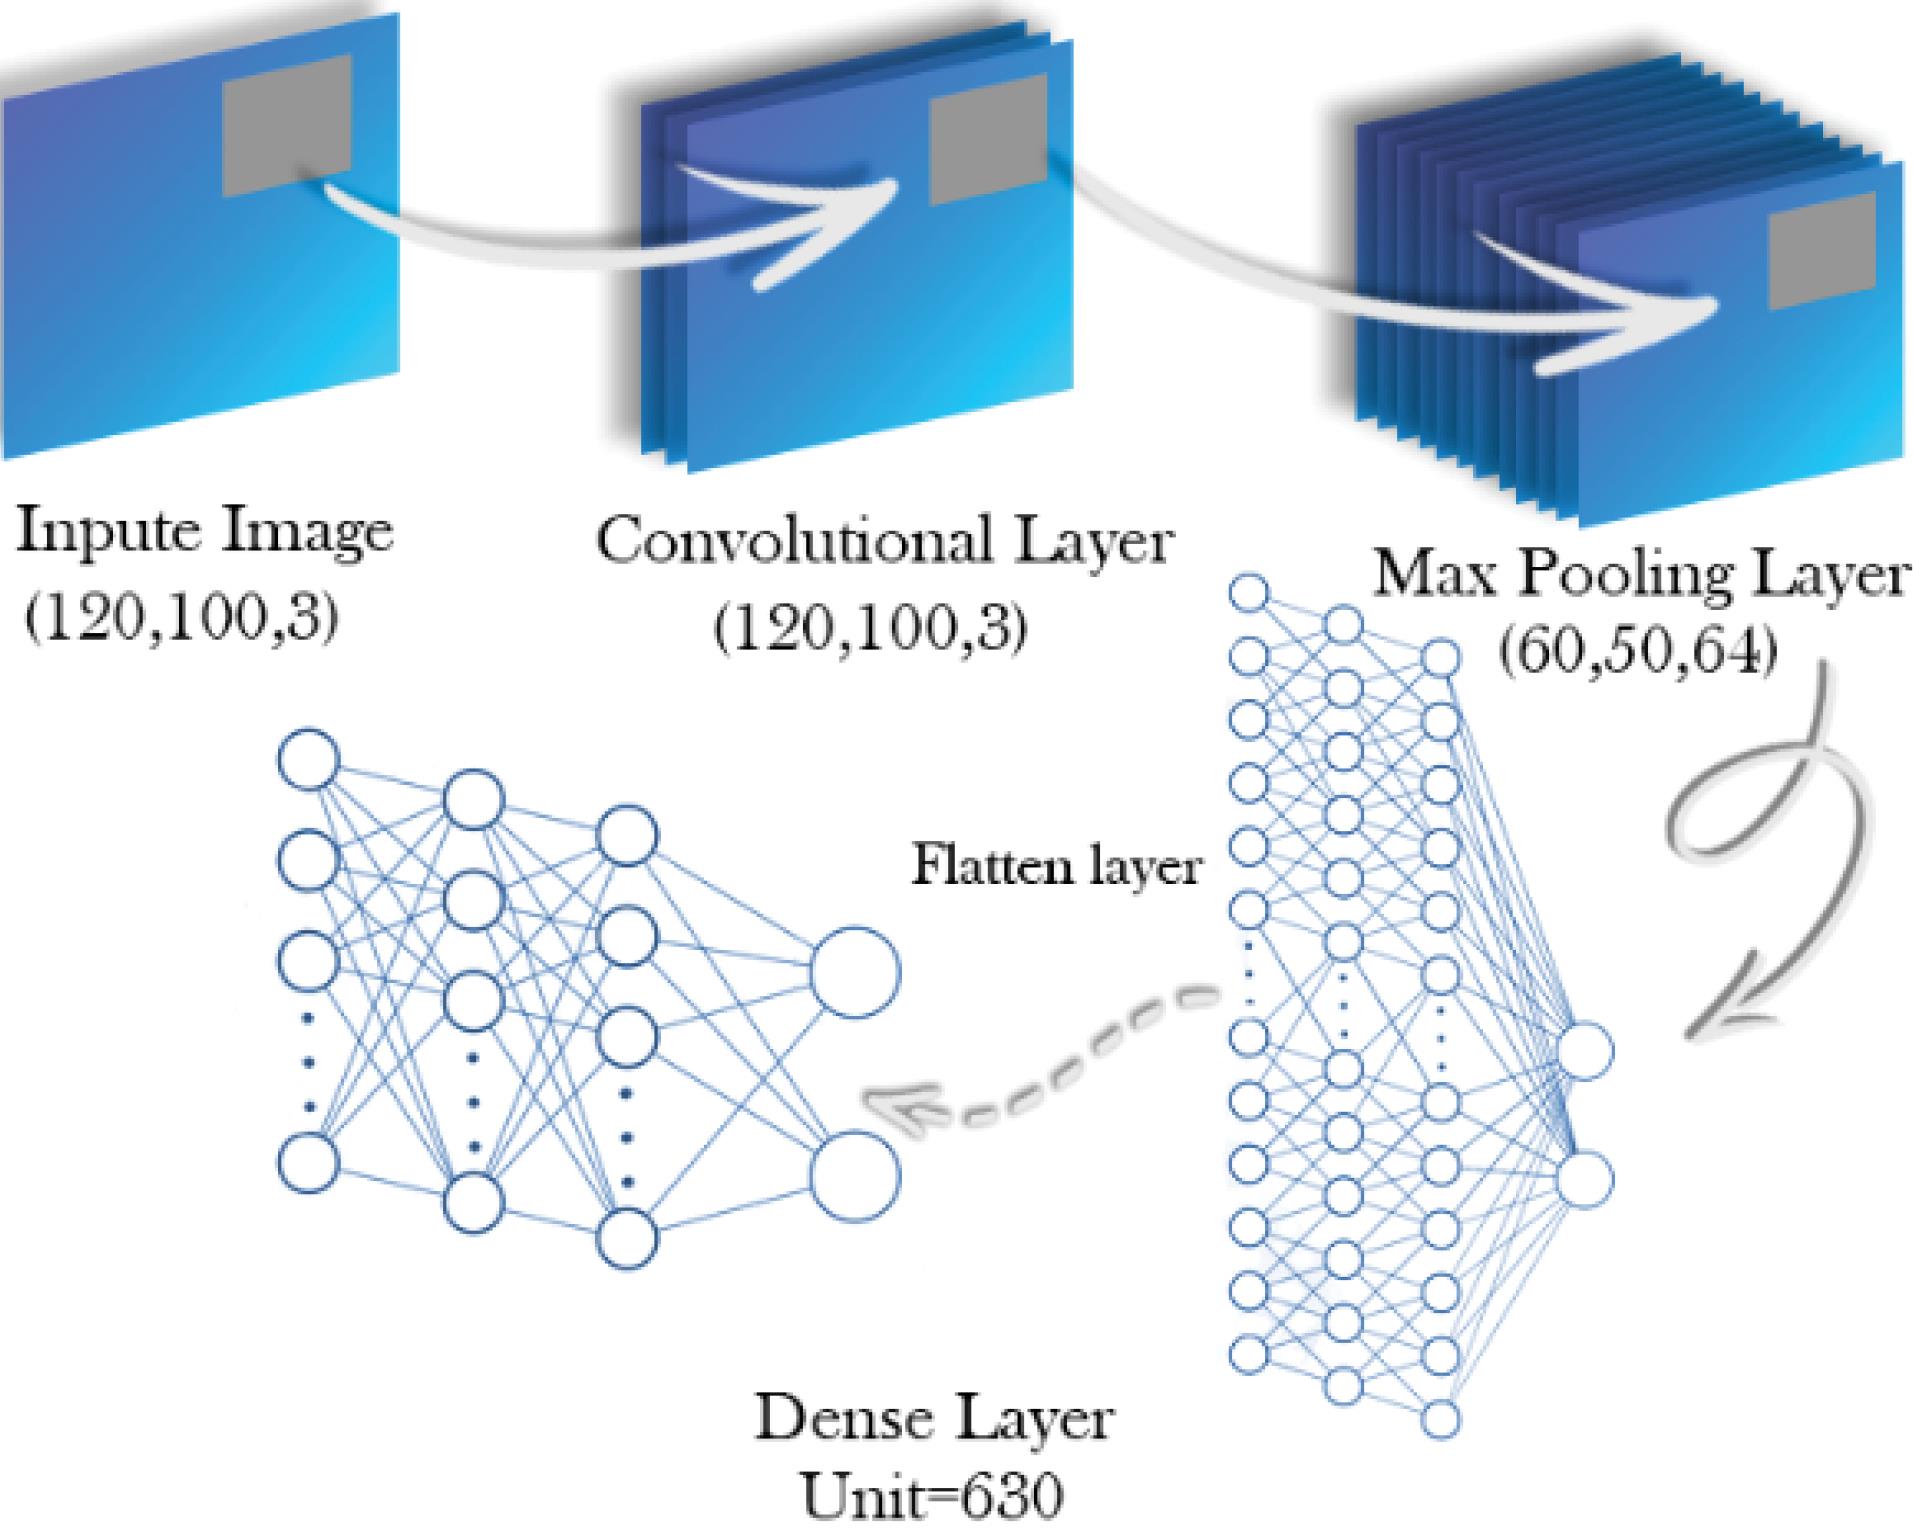
Fig. 3.
Overview of the convolutional neural network (CNN) architecture.
.
Overview of the convolutional neural network (CNN) architecture.
2D Convolution layer: The first layer typically collects basic information such as horizontal and diagonal edges. In the subsequent layer, this data is used to recognize more complex characteristics, such as corners and combinational edges. More complex characteristics, such as objects and encounters, can be recognized as we go deeper into the structure. In the last convolution layer, the determinants are identified, and a series of confidence ratings (0-1) are generated. We identified the classes using three 2D Convolution layers.
Maximum pooling: By pooling the features, the spatial dimension of the convoluted features is reduced. As file sizes decrease, so do the processing time and memory space required to store and retrieve information. In terms of performance, maximum pooling outperforms average pooling. Noise and dimensionality are reduced by removing noisy activations. Generally, equation (9) can be used to express the pooling function:
(9)
Rlj represents the jth pooled region at layer l, and Pool() represents the pooling function. Moreover, this equation describes the pooling function in the CNN model, which is used to reduce the spatial dimensions of feature maps. The equation Rjl= Pooling(qi1,qi2,...,qin) illustrates that the pooling operation (such as max pooling) takes a set of input values from a small region in the feature map and condenses them into a single output value Rjl for that region. This process helps to retain the most significant features while reducing the computational complexity and preventing overfitting in the model, thereby improving its efficiency and generalization.
Dropout: To prevent overfitting, we inserted a dropout layer after the pooling layer. When the loss rate falls and the dropout rate drops, accuracy will continue to increase. Certain max pooling results are randomly chosen and neglected. They are not transmitted to the layer bottom. The statement "certain max pooling results are randomly chosen and neglected" refers to the use of a stochastic pooling approach in our CNN model, where values within the pooling window are selected based on probabilities proportional to their magnitude, rather than simply choosing the maximum value. This introduces an element of randomness, which acts as a form of regularization, preventing the model from becoming overly dependent on specific features. As a result, the model is encouraged to learn more general patterns, improving its robustness and generalization, particularly when dealing with variability in the input data. This approach ultimately enhances the model's performance on unseen data.
Flatten: Following a series of 2D convolutions, a flatten function is always required. Flattening converts information into a one-dimensional array for computation. The output of the convolutional layers is flattened to produce a single, long feature vector. It is also connected to the entire categorization framework.
Dense: A dense layer provides the neural network with a fully interconnected network. All of the outputs of the previous layers are sent to all of its neurons, with each neuron giving one output to the subsequent layer. The dense layer, also known as a fully connected layer, plays a crucial role in a CNN by integrating and processing the features extracted by the convolutional and pooling layers. Unlike earlier layers that focus on spatial features, the dense layer connects every neuron to each neuron in the previous layer, allowing the model to combine all the learned features for final decision-making. This layer is essential for interpreting the high-level features and making accurate predictions, such as determining whether a driver is fatigued. Its significance lies in its ability to capture complex relationships between features, which is vital for producing accurate and meaningful outcomes in the model.
Various kernels are used in the convolution layer of our proposed CNN model to extract high-level features, leading to distinct feature maps. The prediction model concludes with a fully linked layer. The output of the fully connected layer produces the expected class labels for weariness. To extract this number of features, we added a dense layer of 630 units after the training layer.
Optimized XGboost
In comparison with Random Forest, the XGBoost algorithm is 10 times more efficient. At each stage of the XGBoost framework, an additional tree is added to the previously constructed trees. Precision typically increases with the planting of more trees. We implemented XGBoost after CNN in our suggested algorithm. From the training layer of CNN, we extracted a number of features. Accordingly, the CWT was used to transform the EEG signals into scalogram images, capturing both time and frequency information. These scalogram images served as input to the CNN, which then extracted high-level features through a series of convolutional layers. The features captured by the CNN include essential frequency components, spatial patterns, and signal characteristics that are crucial for distinguishing between fatigue and non-fatigue states.
The selection of features was driven by their relevance to the task of fatigue detection. We focused on features that are known to be indicative of cognitive and physical fatigue, such as changes in specific brain rhythms (e.g., Alpha, Beta, Theta, Delta rhythms). Additionally, the model was fine-tuned using evolutionary optimization techniques to ensure that only the most significant features were retained, further enhancing the model's accuracy and generalization capability. Based on the collected data, we classified fatigue occurrences in extreme environments using XGBoost. By summing the values of each tree's leaf nodes, XGBoost forecasts the result. The purpose of this method is to learn these k trees; hence we minimize the objective function below:
(10)
Where, l represents the loss of the differential between the predicted
and actual values yi. The following statement describes Ω regularization:
The regularization term Ω(f) is crucial for controlling the complexity of the XGBoost model. It serves to penalize large weights within the model, which helps prevent overfitting. Thus, this regularization helps to enhance the model's generalization ability by preventing it from fitting too closely to the training data, thus improving its performance on unseen data. Moreover, there are T leaf nodes in the model, while γ is a hyperparameter that affects its complexity. Normally constant leaf weight ɷ is penalized by λ, which represents its penalty coefficient. When t trees exist in a framework, it is stated in the following way:
Combining (10) and (11) results in the following function:
(13)
After performing the Taylor expansion, XGBoost removes the first three terms, removes the high-order infinitesimally small terms, and transforms the objective function into a linear function.
(14)
gi and hi are the first and second derivatives of the loss function, respectively. The difference between
and yi is removed since it has no bearing on optimizing the objective function:
(15)
These equations define the objective function for the XGBoost algorithm. The function 𝐿(𝜃) consists of a loss term that measures the difference between the predicted values
and the actual values yi, and a regularization term Ω(𝑓) that penalizes the complexity of the model. The regularization term helps prevent overfitting by controlling the complexity of the trees in the ensemble. Moreover, the end objective is reached by entering the optimal value:
(16)
Hyperparameters determine how complicated or regularized the model is. Using parameter optimization to tune hyperparameters can enhance prediction capabilities. A number of hyperparameters can be tuned for XGBoost. In terms of finding global optimums, the PSO algorithm is one of the most reliable approaches. This method improves XGBoost so that it can find n-dimensional space-optimal values for numerous meta-parameters. In the quest for finding the global optimums for these hyperparameters, the PSO algorithm emerges as a robust and dependable approach. PSO enhances the capabilities of XGBoost by efficiently exploring the n-dimensional space to identify optimal values for various meta-parameters. This dynamic synergy between XGBoost and PSO not only streamlines the process of hyperparameter tuning but also contributes to the model's ability to adapt and generalize effectively in diverse datasets
The steps to optimize the XGBoost classifier are in Fig. 4. As shown in this table, the set C is found by selecting the maximum of i based on L, R, and the normal value of the Cfunction. The pseudocode in Fig. 4 outlines the steps involved in optimizing the hyperparameters of the XGBoost classifier using a PSO algorithm.
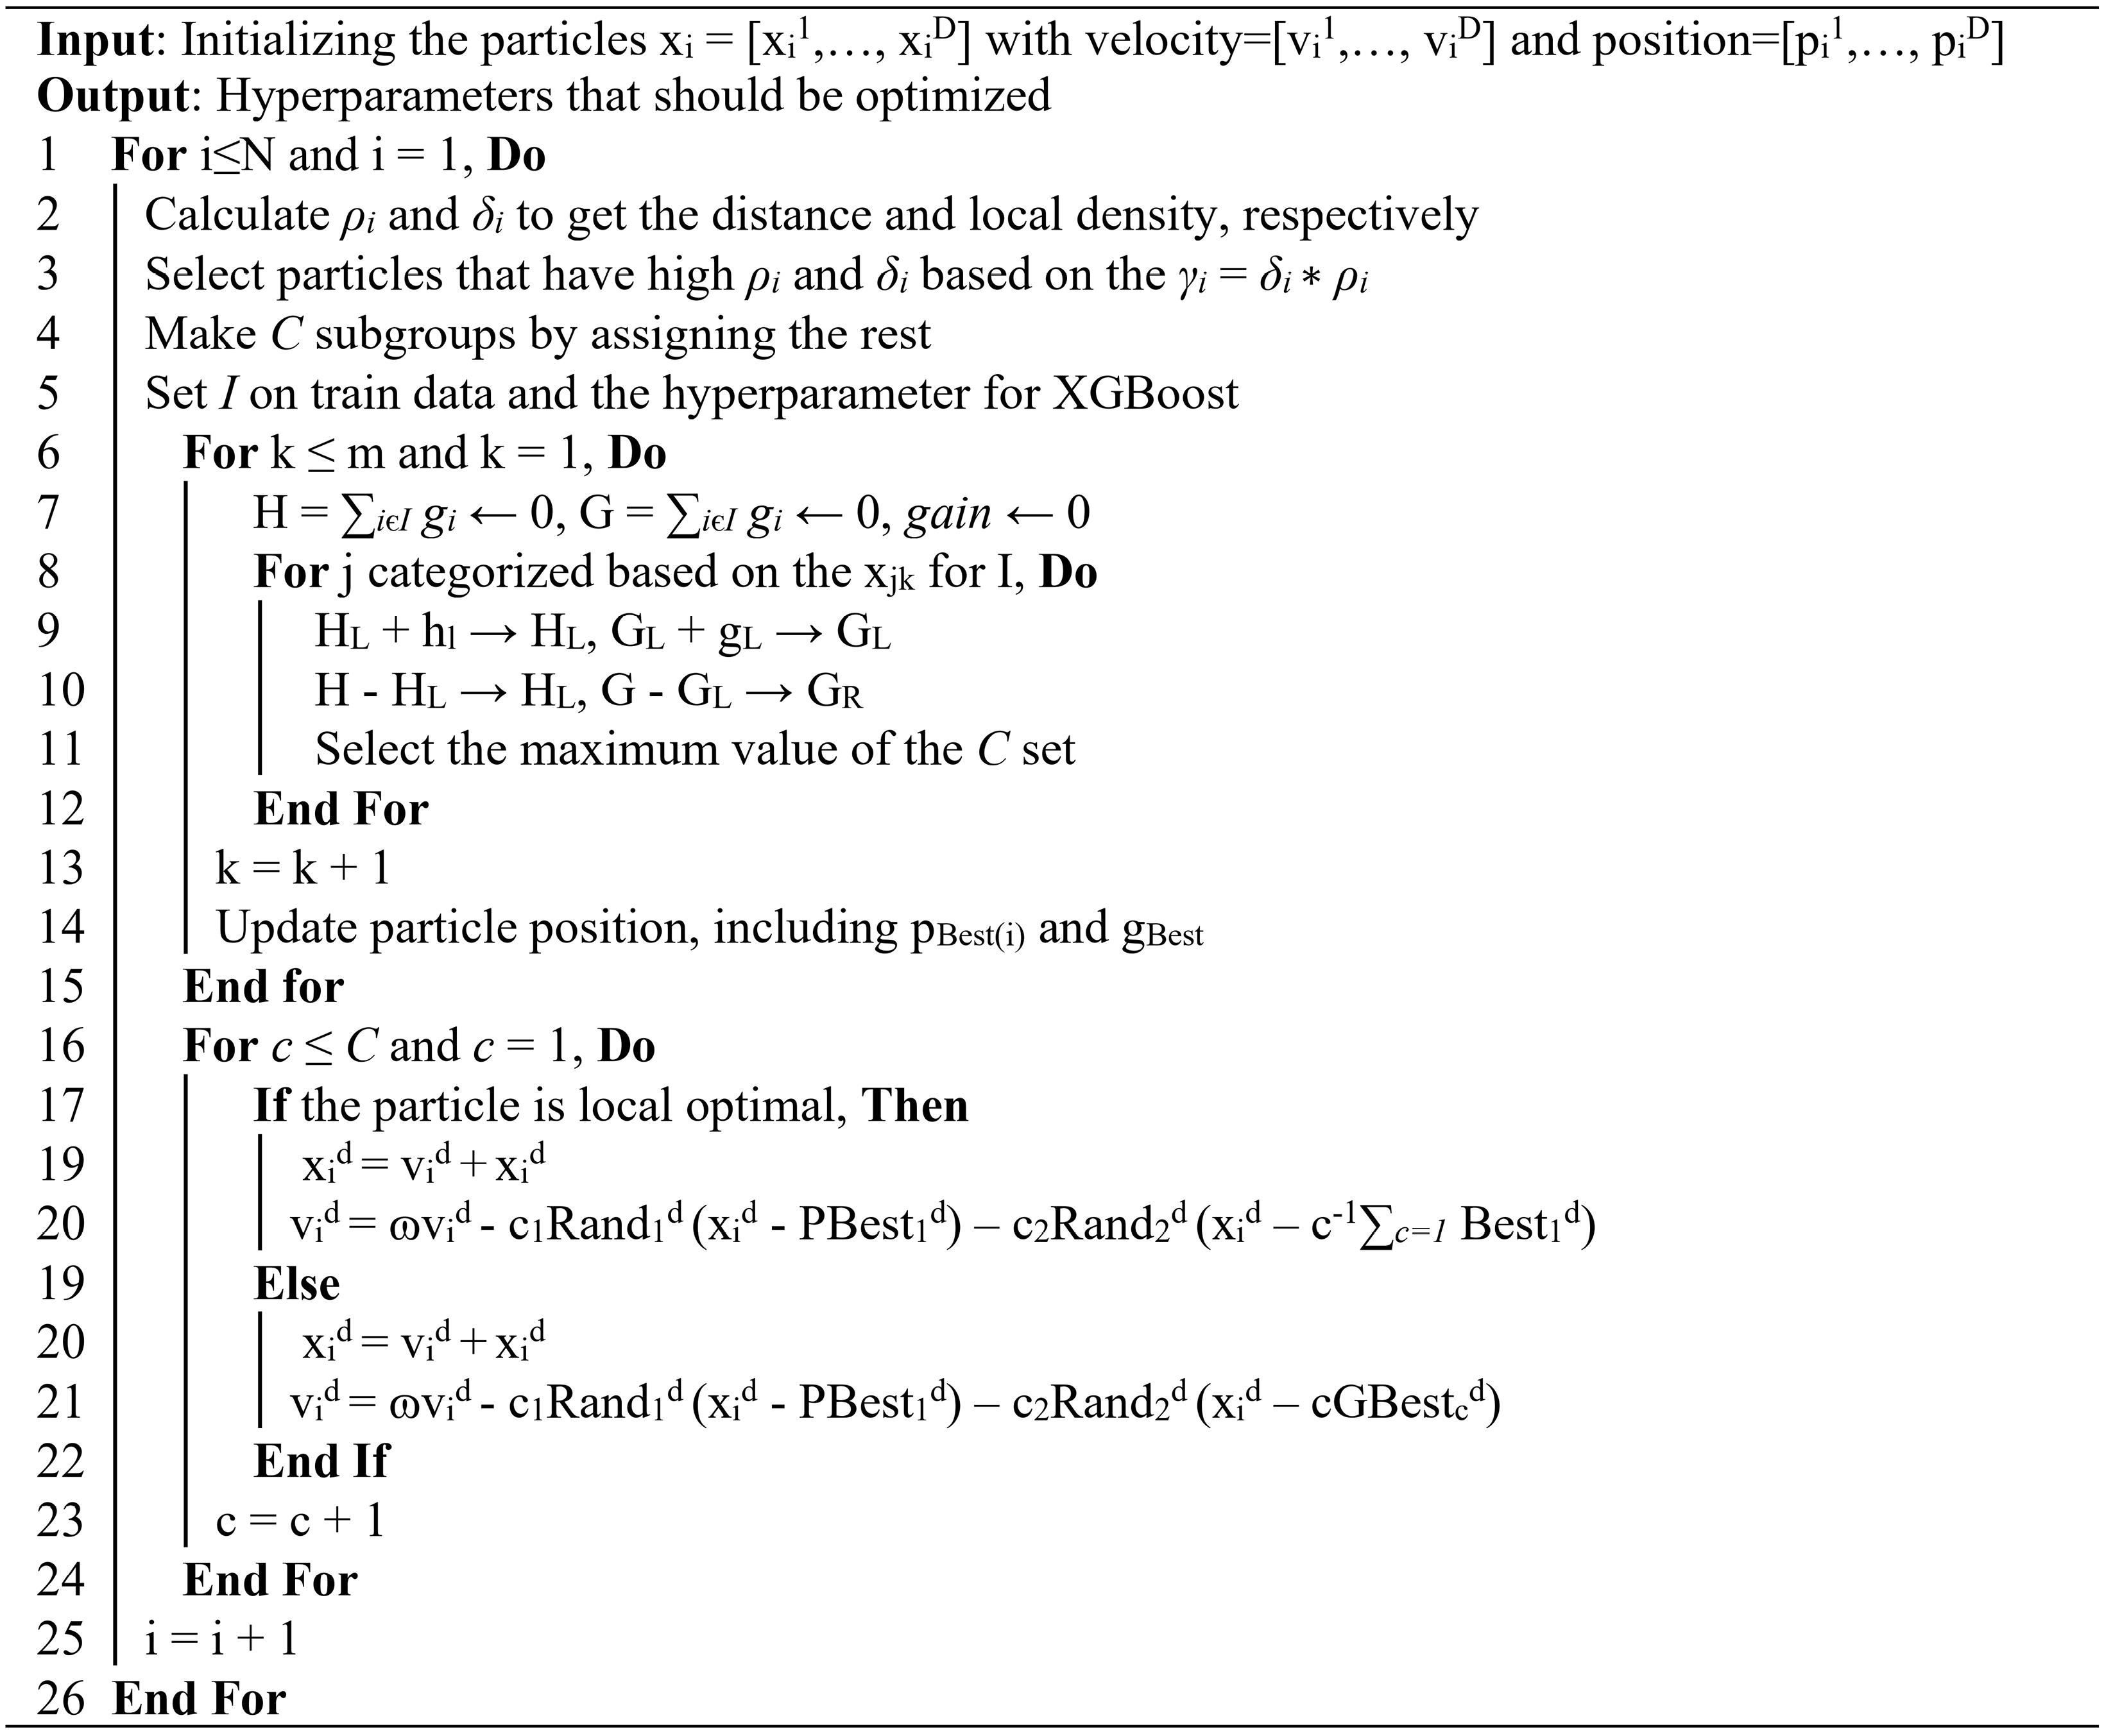
Fig. 4.
An improved version of XGBoost for detecting driver fatigue.
.
An improved version of XGBoost for detecting driver fatigue.
The process begins by initializing particles, each representing a potential solution in the search space. These particles are evaluated based on a fitness function related to the classification accuracy of XGBoost. The particles' velocities and positions are updated iteratively to explore the search space, with the goal of converging on the optimal set of hyperparameters. This iterative process is guided by both the individual particle's best-known position and the global best position found by the swarm. The PSO algorithm's integration with XGBoost enhances the model's ability to find an optimal solution efficiently, improving the overall performance of the fatigue detection system. A modified PSO algorithm significantly enhances XGBoost model performance by optimizing its hyperparameters more effectively than traditional methods. This approach is specifically designed to navigate the complex hyperparameter space of XGBoost, which encompasses parameters like learning rate, maximum depth, and the number of estimators. By leveraging swarm intelligence principles, the modified PSO accelerates convergence and improves optimization accuracy. Each particle within the swarm represents a potential solution characterized by specific hyperparameter values. The algorithm iteratively updates these particles based on both individual and collective best performances. This dynamic adjustment enables efficient exploration and exploitation of the search space, mitigating common challenges like local optima. Enhancements to the standard PSO, such as adaptive velocity updates and refined convergence criteria, further refine XGBoost parameter tuning, resulting in a model that is not only more accurate but also exhibits greater robustness across diverse datasets. This synergistic combination of modified PSO and XGBoost yields a powerful predictive model capable of effectively handling the intricacies of complex data, such as EEG signals for fatigue detection.
Results
Among the measures used are accuracy, precision, sensitivity, F-measure, and specificity. As well, unlike macroaveraging (macroAVG), microaveraging (microAVG) gives each category equal weight. Macroaveraging calculates evaluation metrics like precision, recall, and F1-score independently for each class and then averages them, giving equal weight to all classes. In contrast, microaveraging aggregates the contributions of all classes, giving more weight to those with more samples. By using both methods, the study provides a comprehensive assessment of the model's performance across different class distributions, ensuring that both individual class performance and overall accuracy are thoroughly evaluated. An analysis of the three case studies presented in Table 1 demonstrates the effectiveness of the proposed model. In Table 1, we examine when it is appropriate to use a smaller or larger number of CNN layers. The table presents different scenarios of EEG signal processing and classification using the proposed model, each selected based on distinct CNN configurations and their impact on classification accuracy for detecting driver fatigue. Case Study 1 focuses on a configuration with fewer CNN layers to evaluate performance with a simpler architecture, while Case Study 2 explores a deeper architecture to assess potential improvements in performance.
Table 1.
Comparison of classification performance metrics under different CNN configurations
|
Metric
|
Under a low number of CNN structure layers
|
|
Conscious (Class 1)
|
Fatigue (Class 2)
|
macroAVG
|
microAVG
|
|
SVM
|
XGboost
|
eXGboost
|
SVM
|
XGboost
|
eXGboost
|
SVM
|
XGboost
|
eXGboost
|
SVM
|
XGboost
|
eXGboost
|
| Precision |
98.91 |
99.02 |
99.88 |
96.03 |
97.99 |
99.47 |
97.47 |
98.50 |
99.67 |
97.47 |
98.50 |
99.67 |
| Sensitivity |
96.14 |
98.01 |
99.47 |
98.88 |
99.01 |
99.88 |
97.51 |
98.51 |
99.68 |
97.47 |
98.50 |
99.67 |
| Specificity |
98.88 |
99.01 |
99.88 |
96.14 |
98.01 |
99.47 |
97.51 |
98.51 |
99.68 |
97.47 |
98.50 |
99.67 |
| Accuracy |
97.47 |
98.50 |
99.67 |
97.47 |
98.50 |
99.67 |
97.47 |
98.50 |
99.67 |
97.47 |
98.50 |
99.67 |
| F- score |
97.51 |
98.51 |
99.68 |
97.43 |
98.51 |
99.67 |
97.47 |
98.50 |
99.67 |
97.47 |
98.50 |
99.67 |
|
Metric
|
Under a high number of CNN structure layers
|
|
Conscious (Class 1)
|
Fatigue (Class 2)
|
macroAVG
|
microAVG
|
|
SVM
|
XGboost
|
eXGboost
|
SVM
|
XGboost
|
eXGboost
|
SVM
|
XGboost
|
eXGboost
|
SVM
|
XGboost
|
eXGboost
|
| Precision |
99.16 |
99.54 |
100 |
96.76 |
98.07 |
99.69 |
97.96 |
98.81 |
99.84 |
97.96 |
98.81 |
99.84 |
| Sensitivity |
96.83 |
98.10 |
99.69 |
99.14 |
99.54 |
100 |
97.99 |
98.82 |
99.84 |
97.96 |
98.81 |
99.84 |
| Specificity |
99.14 |
99.54 |
100 |
96.83 |
98.10 |
99.69 |
97.99 |
98.82 |
99.84 |
97.96 |
98.81 |
99.84 |
| Accuracy |
97.96 |
98.81 |
99.84 |
97.96 |
98.81 |
99.84 |
97.96 |
98.81 |
99.84 |
97.96 |
98.81 |
99.84 |
| F- score |
97.98 |
98.82 |
99.84 |
97.93 |
98.80 |
99.84 |
97.96 |
98.81 |
99.84 |
97.96 |
98.81 |
99.84 |
Accordingly, classification of fatigue signals with more layers in CNN leads to better results when we compare SVM, XGboost, and evolutionary XGboost (eXGboost). Each assessment was cross-validated by three independent experiments. The sample signal, which had been analyzed to resolve the non-stationary problem, was divided into several windowing intervals, and therefore, the length of the signals was considered to be 30 seconds with 30% overlapping between two consecutive windows, which resulted in 28 frames for each participant. Next, a scalogram image was created from the generated windows. Due to the four sub-bands of the signal and its forty channels, a total of 71 680 windows and scalograms were created for all 16 participants.
This number is divided in half according to alertness and fatigue levels. In Fig. 5, we show two examples of EEG signals from conscious and fatigued drivers. Their scalogram images are displayed along with the signal. A comparison of sub-bands of brain signals shows that there is no noticeable difference in some sub-bands when driving in normal environments.
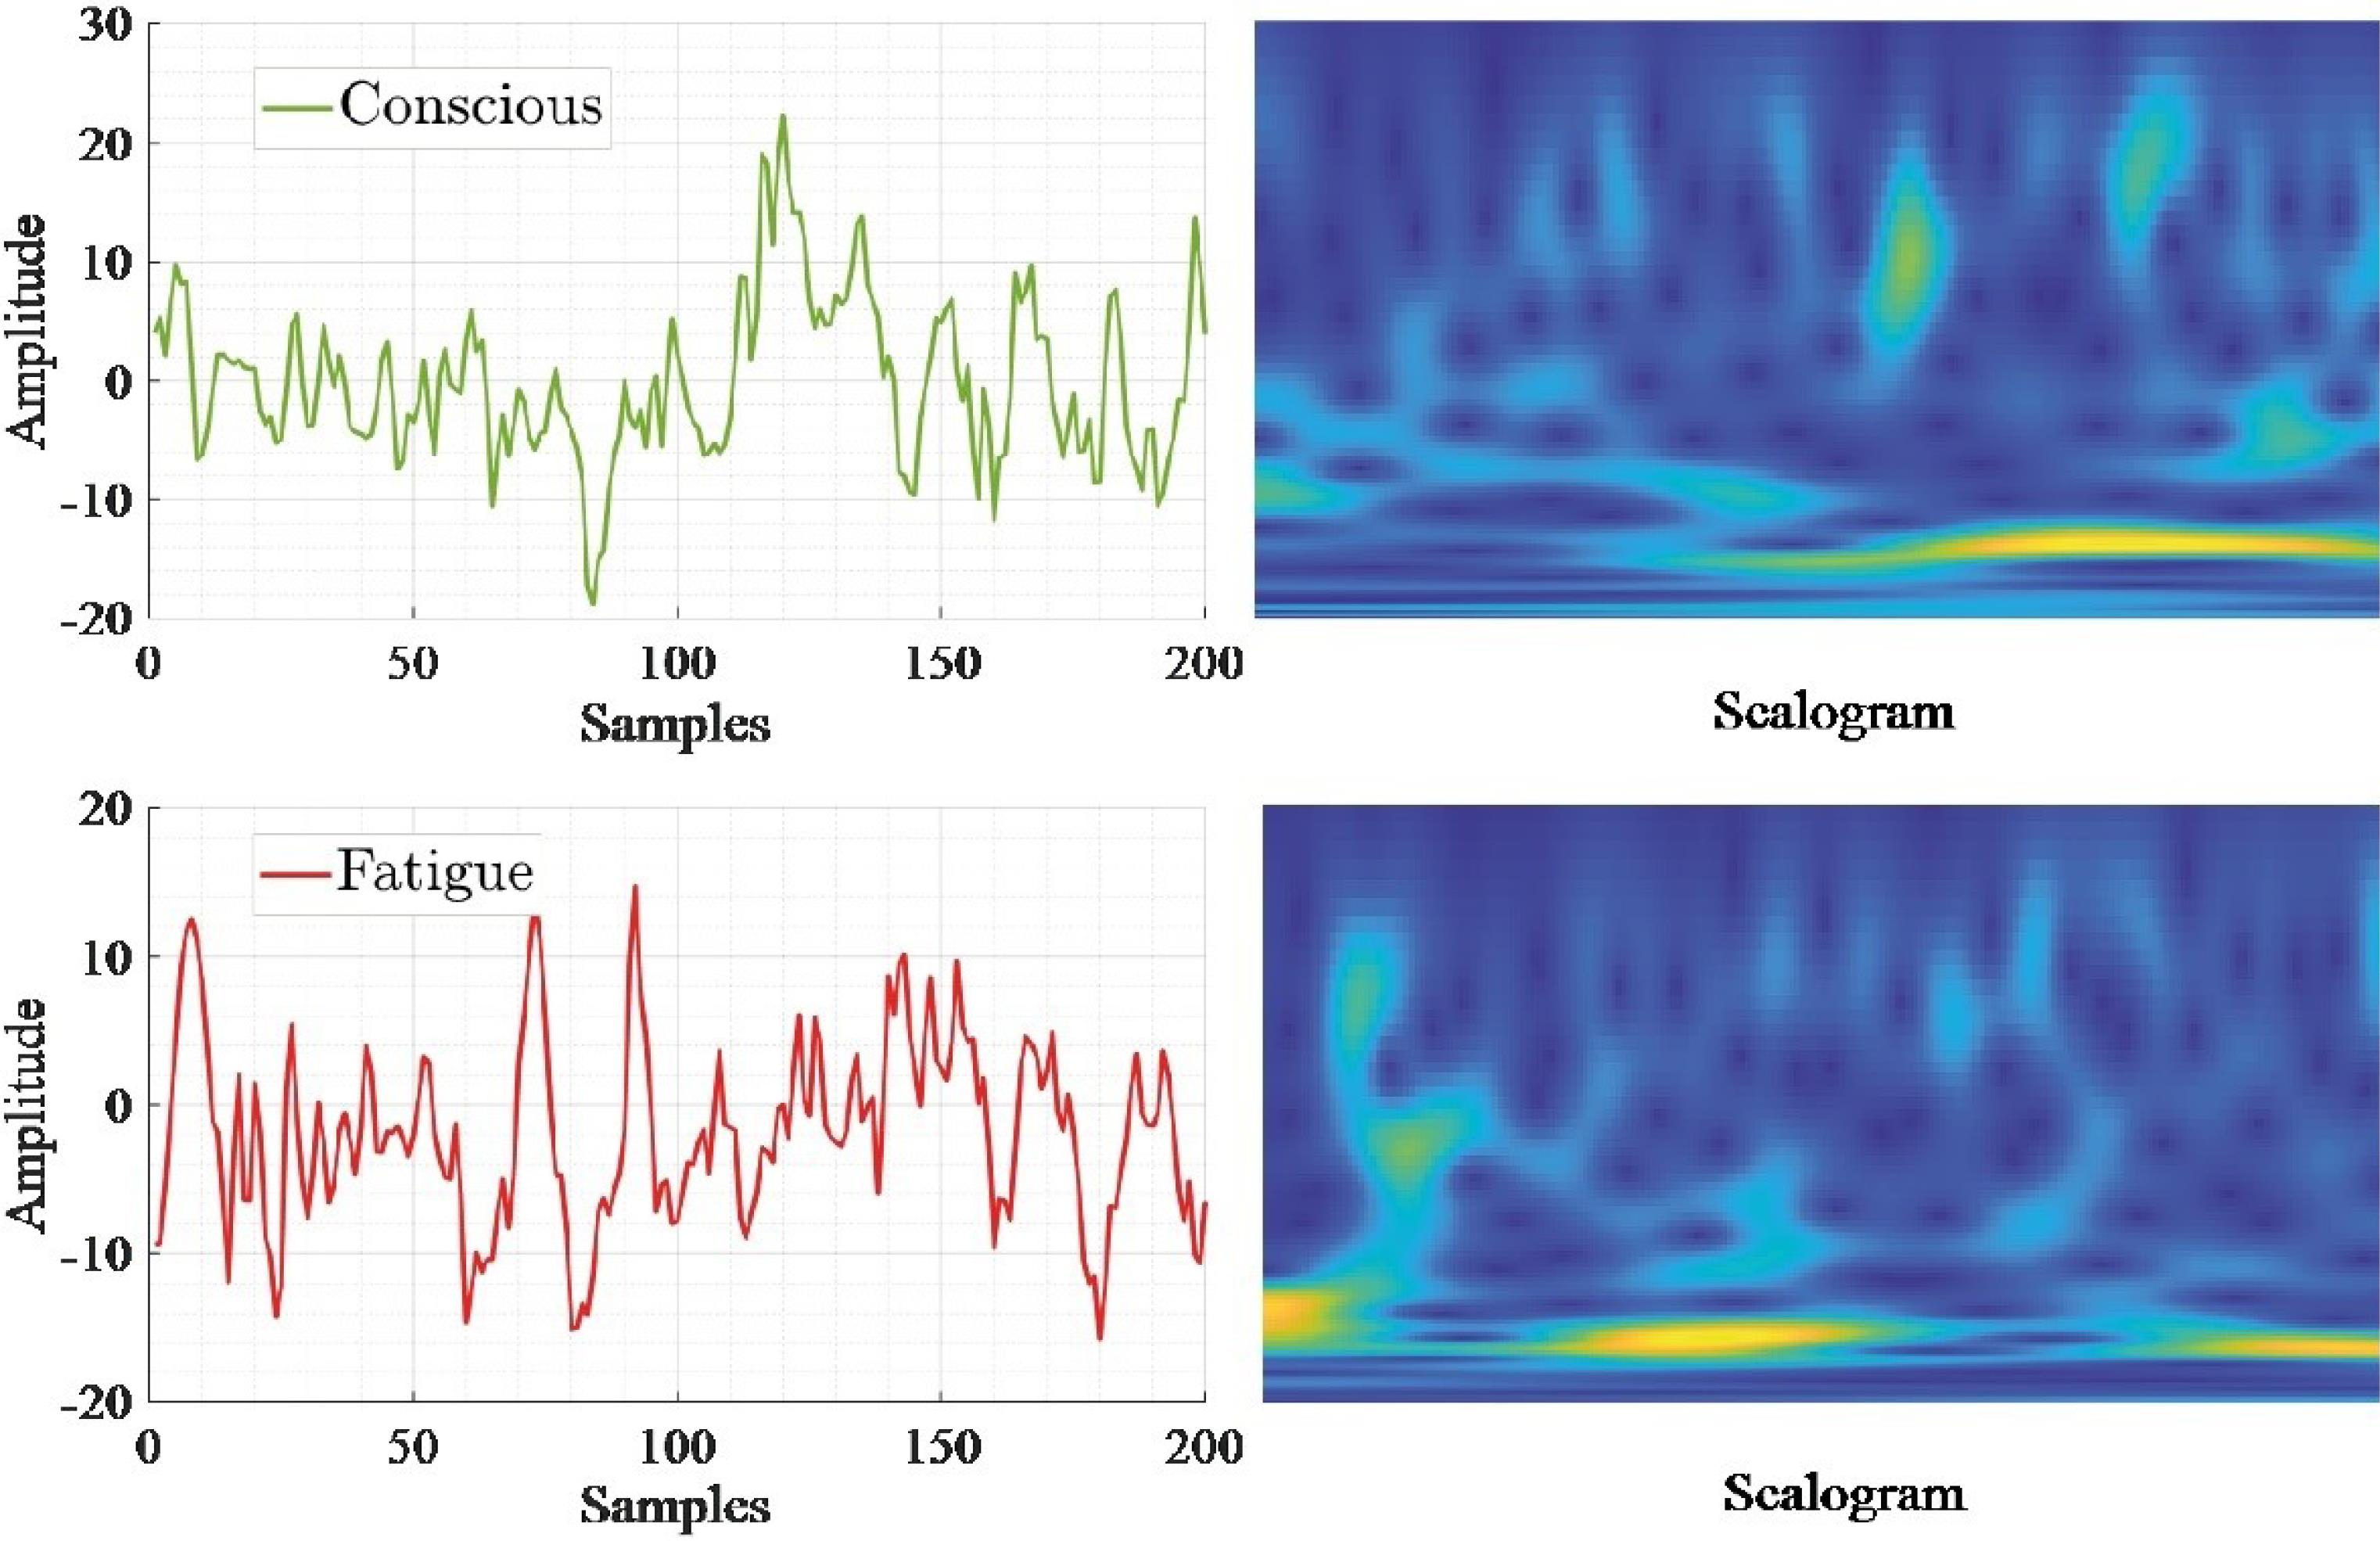
Fig. 5.
EEG signals from both conscious and fatigued drivers, accompanied by their corresponding scalogram images.
.
EEG signals from both conscious and fatigued drivers, accompanied by their corresponding scalogram images.
However, almost all brain rhythms help identify fatigue in some way. There is no doubt that extreme environments are more likely to cause fatigue than other environments. Due to external and visual stimulation, the Alpha rhythm is suppressed and its intensity decreases. Therefore, under normal driving conditions, the Alpha rhythm can significantly assist with fatigue detection. In extreme environments and in normal environments, driving fatigue is not associated with drastic changes in the Delta, Theta, and Beta rhythms. The occipital region and adjacent brain areas are activated when the brain is faced with a large amount of visual and focused information. There is no significant difference between the Beta rhythm in extreme environments and the same rhythm in normal environments. Normally, the driver's Alpha rhythm is very intense, but in extreme environments, this intensity is greatly reduced. Overall, this rhythm can be considered an effective measure for assessing driver fatigue in both environments.
Discussion
Table 2 provides a detailed analysis of the performance metrics for various EEG sub-bands-Delta, Theta, Alpha, Beta, and Gamma-regarding their effectiveness in detecting fatigue. Among these, the Alpha sub-band continues to stand out with the highest performance across all metrics, including a Precision of 97.38% and an Accuracy of 97.11%, underscoring its strong association with fatigue states, particularly those linked to relaxation and drowsiness. The Theta and Beta sub-bands demonstrate moderate relevance, with Theta showing slightly higher accuracy (87.61%) and F-score (87.36%) compared to Beta, indicating their importance in capturing brain wave patterns related to drowsiness and cognitive activity. In contrast, the Delta and Gamma sub-bands exhibit lower relevance, with accuracy metrics of 85.38% and 84.73%, respectively, suggesting that these sub-bands are less effective in distinguishing fatigue due to their association with deep sleep (Delta) and high-level cognitive functions (Gamma). Overall, the Alpha sub-band remains the most critical for fatigue detection, while Theta and Beta also play significant but lesser roles, and Delta and Gamma are identified as less significant.
Table 2.
Quantitative results for EEG sub-bands in fatigue detection
|
Sub-band
|
Precision (%)
|
Sensitivity (%)
|
Specificity (%)
|
Accuracy (%)
|
F-score (%)
|
Fatigue relevance
|
| Delta |
85.38 |
85.23 |
85.53 |
85.38 |
85.3 |
Low |
| Theta |
87.5 |
87.21 |
87.8 |
87.61 |
87.36 |
Moderate |
| Alpha |
97.38 |
97.02 |
97.74 |
97.11 |
97.2 |
High |
| Beta |
92.56 |
92.79 |
92.32 |
92.69 |
92.67 |
Moderate |
| Gamma |
84.55 |
84.68 |
84.41 |
84.73 |
84.61 |
Low |
Note: This table presents the precision, sensitivity, specificity, accuracy, and F-score for each EEG sub-band (Delta, Theta, Alpha, Beta, Gamma), along with their relevance to fatigue detection.
Moreover, electrodes T6, P3, TP7, and O1 demonstrate substantially more influential influence than electrodes FC4, C3, P4, and F8 (see Table 3). This demonstrates that each person has a distinct channel of priority for driving tiredness. Taking into consideration the association between electrodes and the creation of more effective channels, the TP7, CP3, T5, and P3 electrodes are deemed more successful. By selecting the Alpha rhythm and brain areas responsible for information processing, the computational complexity of fatigue classification can be significantly reduced. The influence of specific electrodes in detecting driver fatigue was determined by analyzing their contribution to the classification accuracy across different EEG sub-bands. This analysis involved evaluating the performance of electrodes based on the accuracy, sensitivity, and specificity metrics for each sub-band.
Table 3.
Three criteria used to estimate the effectiveness of electrodes, demonstrating the algorithm's capability to achieve satisfactory results through selected electrodes
|
K-fold
|
Electrodes (TP7, P3, T5, and CP3)
|
Electrodes (TP7, P3, and T5)
|
Electrodes (TP7 and P3)
|
Electrode (TP7)
|
|
Accuracy
|
Sensitivity
|
Specificity
|
Accuracy
|
Sensitivity
|
Specificity
|
Accuracy
|
Sensitivity
|
Specificity
|
Accuracy
|
Sensitivity
|
Specificity
|
| 5-fold(1) |
99.78 |
99.64 |
99.92 |
99.67 |
99.50 |
99.83 |
99.09 |
98.67 |
99.52 |
98.70 |
97.84 |
99.60 |
| 5-fold(2) |
99.72 |
99.53 |
99.92 |
99.54 |
99.17 |
99.92 |
98.98 |
98.32 |
99.66 |
97.27 |
97.24 |
99.34 |
| 5-fold(3) |
99.78 |
99.58 |
99.97 |
99.47 |
99.22 |
99.72 |
98.91 |
98.32 |
99.52 |
98.69 |
98.07 |
99.32 |
| 5-fold(4) |
99.75 |
99.64 |
99.86 |
99.68 |
99.55 |
99.80 |
98.81 |
98.05 |
99.60 |
98.34 |
97.45 |
99.26 |
| 5-fold(5) |
99.71 |
99.53 |
99.89 |
99.53 |
99.14 |
99.92 |
98.94 |
98.21 |
99.69 |
98.54 |
97.67 |
99.43 |
Electrodes T6, P3, TP7, and O1 were found to have a substantially higher influence compared to electrodes FC4, C3, P4, and F8. This determination was made by examining the signal quality and relevance of each electrode in capturing the most critical EEG features associated with fatigue. The criteria for selecting these electrodes involved their ability to consistently contribute to high classification accuracy in multiple testing scenarios, indicating their importance in the overall model's effectiveness for fatigue detection. To support the claim that results based on fewer features from four electrodes were superior to other classification approaches, we conducted a thorough comparison using performance metrics such as accuracy, sensitivity, and specificity. The electrodes T6, P3, TP7, and O1 were selected due to their significant contribution to fatigue detection, as identified through empirical analysis of EEG sub-bands. The results showed that features from these electrodes led to higher accuracy and better generalization compared to models using a broader set of features, particularly in the Alpha sub-band, where the selected electrodes captured the most relevant fatigue-related information. This approach also improved model efficiency by simplifying the feature set without compromising accuracy.
For optimization of XGBoost classifier, various optimization evolutionary algorithms were compared, such as PSO, Genetic algorithm (GA), and Ant Colony Optimization (ACO). Hence, based on the loss function over a finite number of epochs, the convergent level of error is calculated (see Fig. 6).
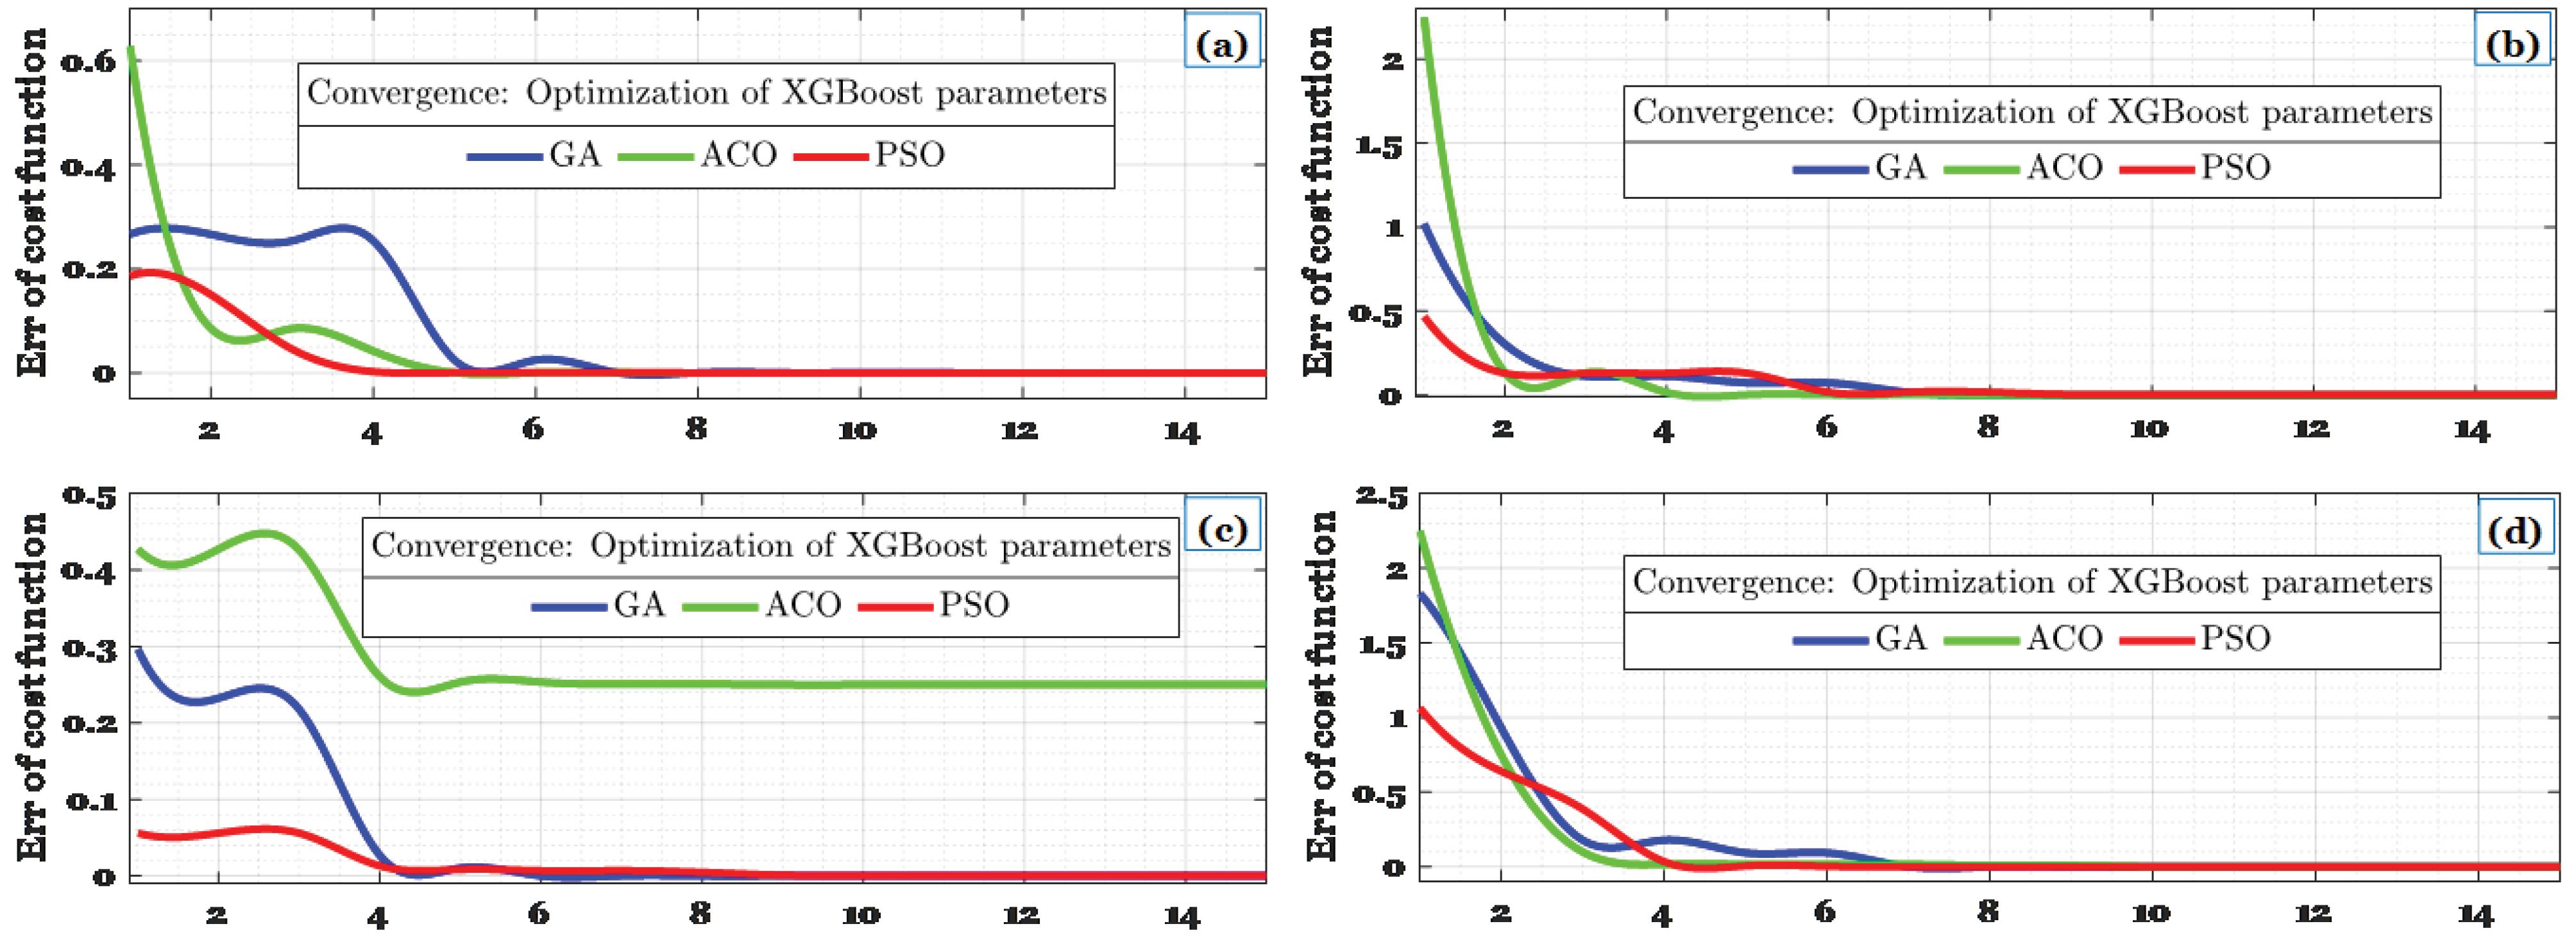
Fig. 6.
Comparison of various evolutionary optimization algorithms for optimizing the XGBoost classifier, including PSO, GA, and ACO. The PSO algorithm outperformed GA and ACO
.
Comparison of various evolutionary optimization algorithms for optimizing the XGBoost classifier, including PSO, GA, and ACO. The PSO algorithm outperformed GA and ACO
A modified PSO procedure allows rapid and reliable optimization of the XGBoost classifier for various fatigue signals. There have been several studies that have investigated driver fatigue identification using EEG signals in recent years. Results based on less features of four electrodes were superior to those of other classification approaches. The classification efficiency used in their investigation can be found in Table 4.
Table 4.
Comparative analysis of feature extraction strategies and classifiers, showing both the actual accuracies achieved on original datasets and the observed accuracies obtained when these methods were re-implemented and tested on the Figshare dataset
|
Ref. |
Feature extraction strategy
|
Classifier
|
Original dataset
|
Actual accuracy
|
Evaluation dataset
|
Observed accuracy
|
| Wu et al37 |
AutoEncoder |
SoftMax |
Pilots’ EEG dataset (collected from 20 subjects) |
91.68% |
Figshare |
93.78% |
| Wen et al38 |
AutoEncoder |
AdaBoost |
DEAP dataset |
95.00% |
Figshare |
97.14% |
| Ma et al39 |
Modified-PCANet |
SVM |
Driving Fatigue Dataset (self-collected EEG data) |
95.14% |
Figshare |
94.27% |
| Rundo et al40 |
Stacked AutoEncoder |
SoftMax |
Self-collected EEG dataset |
100% |
Figshare |
98.56% |
| Panwar et al41 |
GAN |
SoftMax |
Self-collected EEG dataset (Wasserstein GAN setup) |
67.00% |
Figshare |
72.12% |
| Lee et al42 |
LSTM-CNN (3 classes) |
SoftMax |
Publicly available EEG dataset (source unspecified) |
86.00% |
Figshare |
85-88% |
| Proposed model |
CNN |
optXGBoost |
Figshare |
99.80% |
Table 4 presents a comparative analysis of various feature extraction strategies and classifiers across different datasets, including both the original datasets used in previous studies and the Figshare dataset employed in this study. The observed accuracy on the Figshare dataset is slightly different from the actual accuracy reported in the original studies, which is expected due to the inherent differences between datasets. Notably, most methods demonstrate consistent or slightly improved accuracy when implemented on the Figshare dataset, indicating the robustness and generalizability of these approaches. The proposed model, which combines CNN and XGBoost, achieves the highest accuracy of 99.80% on the Figshare dataset, further validating its effectiveness.
Driver fatigue detection in traffic control can prevent excessive driving, reduce casualties, and warn of driver fatigue. Future studies should focus on the temporal variability of tiredness data and the practical implementation of an EEG-based fatigue surveillance system. To reduce the likelihood of traffic accidents, it is imperative to provide early warnings about drowsiness. The use of IoT platforms can greatly enhance data processing, as well as minimize the complexity of computing, so drowsiness should be notified to the driver by an alarm when it becomes a problem. The research is not without problems, however. These challenges include the limitations imposed by hardware components on IoT platforms, the difficulties in data recording in extreme environments, and the inadequacy of signal sizes for comprehensive driver fatigue analysis. To mitigate these issues, we implemented several strategies. For instance, we addressed hardware limitations by optimizing the data processing algorithms to work efficiently within the constraints of IoT platforms. Additionally, to overcome the challenge of data recording in extreme environments, we employed advanced EEG signal processing techniques to enhance data quality despite the adverse conditions. Furthermore, we utilized robust statistical methods to compensate for the smaller signal sizes, ensuring that the analysis remained reliable and valid despite the data limitations. As a result of hardware component limitations on IoT platforms, the challenges of data recording in extreme environments, and inadequate signal sizes are the most significant problems for driver fatigue analysis. Moreover, channel selection could not be implemented without considering the correlation of several brain regions.
Despite only using a few distinct biosensor nodes for tiredness detection, the detection rate of fatigue events was poor due to the small number of channels. Due to the development of frameworks for DL, future research will be able to utilize fewer channels and electrodes.
Increasing the volume of data related to EEG and environmental parameters, including driving conditions, weather conditions, and physiological information, can help develop richer training datasets, ultimately enhancing the model's accuracy and generalization capabilities.45-47 Expanding information horizons facilitates better detection and prediction of driver fatigue states. Moreover, integrating reinforcement learning and dynamic feedback mechanisms can enhance the system's performance. Real-time feedback from the IoT system to improve the model in real-world driving conditions allows for better adaptation to the driver's current state and recognition of a broader range of fatigue conditions. Notably, improving the security system of this framework and preserving the privacy of sensitive data will increase user trust and acceptance. Utilizing encryption technology, access controls, and advanced security standards protects the system against security threats, ensuring data integrity and confidentiality.
The detection of driver fatigue using EEG signals presents several significant challenges that must be addressed to ensure the system's reliability and effectiveness. One primary challenge is the variability in EEG data across individuals. Influenced by factors such as age, gender, sleep patterns, and physiological differences, this variability hinders the development of a universal model. Additionally, collecting high-quality EEG data during moments of driver fatigue is inherently challenging due to fatigue's gradual onset, leading to a potential lack of training data.
Moreover, processing EEG data using advanced DL models like CNNs and XGBoost is computationally demanding, requiring substantial resources. This limits scalability, especially in real-time applications where swift decision-making is crucial. Another critical challenge is the need for real-time processing capabilities. Given the imperative of detecting fatigue in real-time to prevent accidents, the system must rapidly process and analyze EEG data. This places significant demands on both software algorithms and hardware infrastructure. Privacy and security concerns are paramount, as the system processes sensitive EEG data that could reveal personal health information. Robust data security measures are essential to protect against unauthorized access and breaches, maintaining user trust and compliance with legal regulations. Interpreting the complex patterns within EEG data is another challenge, as signals are often noisy and influenced by various external factors. Developing robust algorithms that accurately differentiate between meaningful fatigue indicators and irrelevant noise is crucial.
To address these challenges, future research should explore the integration of Recurrent Neural Networks (RNNs) and Long Short-Term Memory (LSTM) networks. These models excel at handling temporal sequences, enhancing the system's ability to detect subtle changes in brain activity over time. Developing a flexible and adaptable system architecture is crucial to accommodate new technologies and maintain effectiveness in an evolving landscape. Improving efficiency through optimized algorithms and hardware acceleration can mitigate computational challenges.
Prioritizing security and privacy are essential. Implementing advanced encryption, secure data transmission, and robust access control will safeguard sensitive EEG data, build trust, and facilitate widespread adoption, especially in regulated industries. Integrating the system with wearable devices to monitor other physiological parameters can provide a comprehensive view of the driver's health status and enable predictive healthcare interventions. Exploring reinforcement learning techniques can allow the system to adapt in real-time to the driver's state, improving its responsiveness and effectiveness. Finally, considering the social and economic impacts of deploying this technology, including its influence on driver behavior, accident reduction, and healthcare costs, is crucial for evaluating its broader benefits to society.
To provide a thorough understanding of the research challenges encountered in this study, the discussion has been enriched with specific examples and the corresponding solutions implemented:
-
Data quality in extreme environments: A significant challenge was maintaining data quality when recording EEG signals in extreme environments, such as high temperatures or high-vibration settings. These conditions introduced noise and artifacts into the EEG recordings, potentially compromising the reliability of the data. To mitigate this, advanced signal processing techniques, including filtering and artifact removal, were applied to clean the data and ensure robust analysis despite these challenges.
-
Hardware limitations on IoT platforms: The IoT platforms used in this research had limited processing power and memory, which posed a challenge for running complex algorithms in real-time. To address this, data processing algorithms were optimized for computational efficiency, allowing them to operate effectively within the constraints of the IoT hardware. This optimization included streamlining the feature extraction process and utilizing lightweight models that maintained high accuracy.
-
Limited sample size for EEG signals: The dataset used in this study comprised a relatively small number of EEG recordings, which could potentially limit the generalizability of the findings. To overcome this limitation, robust statistical methods and cross-validation techniques were employed to ensure the reliability and generalizability of the results. Additionally, synthetic data augmentation techniques were utilized to expand the dataset, further enhancing the robustness of the findings.
Conclusion
This study presents an innovative approach for detecting driving fatigue in extreme environments using EEG signals, leveraging a combination of CNN and XGBoost models. By transforming EEG signals into scalogram images and employing a 2D-CNN for key feature extraction, the proposed method achieved an impressive accuracy of 99.80% on a substantial dataset, surpassing all existing methods. The research demonstrated that integrating this approach within an IoT framework for real-time signal detection and processing can optimize overall system performance and reduce computational complexity. This makes the proposed model particularly suitable for industrial and healthcare applications, where rapid and accurate fatigue detection is critical. The primary challenges addressed in this research included the significant variability in EEG signals across individuals and the difficulty in collecting sufficient data under extreme conditions. Evolutionary optimization techniques were employed to overcome these challenges, resulting in improved model performance and enhanced generalizability. The findings of this study highlight the significant potential of deep learning models in detecting driving fatigue and underscore the importance of leveraging cutting-edge technologies to enhance road safety. However, future research should focus on improving data quality in extreme environments and reducing computational complexity to further refine these systems.
Research Highlights
What is the current knowledge?
-
EEG signals are utilized for detecting driver fatigue.
-
CNN and XGBoost are common methods for data classification in healthcare IoT systems.
-
IoT frameworks are increasingly used in smart healthcare solutions.
What is new here?
-
Introduction of a CNN-XGBoost model for enhanced EEG-based driver fatigue detection.
-
Transformation of EEG recordings into RGB scalograms for improved classification accuracy.
-
Achieved 99.80% accuracy, surpassing existing methods in detecting driver fatigue.
Competing Interests
The authors declare that they have no conflicts of interest.
Ethical Statement
Not applicable. As a disclaimer, the authors are neutral regarding the ethical issues related to the dataset preparation and declare that standard and common datasets from other sources have been used. Therefore, no new consent and ethical approval actions were required.
Acknowledgements
We would like to extend our sincere gratitude to the universities and institutions affiliated with the authors for their unwavering support and the resources provided for this research.
References
- World Health Organization (WHO). Road Traffic Injuries [Internet]. 2018. Available from: https://www.who.int/en/news-room/fact-sheets/detail/road-traffic-injuries. Accessed August 27, 2024.
- World Health Organization (WHO). Global Status Report on Road Safety 2018: Summary (No. WHO/NMH/NVI/18.20). Geneva: WHO; 2018.
- Dong W, Wu X. Fatigue detection based on the distance of eyelid. In: Proceedings of 2005 IEEE International Workshop on VLSI Design and Video Technology, 2005. Suzhou, China: IEEE; 2005. p. 365-8. 10.1109/iwvdvt.2005.1504626.
- Li Z, Nianqiang L. Fatigue driving detection system based on face feature. In: 2019 IEEE 2nd International Conference on Electronics Technology (ICET). Chengdu, China: IEEE; 2019. 10.1109/eltech.2019.8839479.
- Mou L, Zhao Y, Zhou C, Yin B, Gao W, Jain R. A review of personalized health navigation for drivers. In: 2022 IEEE 5th International Conference on Multimedia Information Processing and Retrieval (MIPR). IEEE; 2022. p. 293-9. 10.1109/mipr54900.2022.00059.
- Yan R, Wu C, Wang Y. Exploration and evaluation of individual difference to driving fatigue for high‐speed railway: a parametric SVM model based on multidimensional visual cue. IET Intell Transp Syst 2018; 12:504-12. doi: 10.1049/iet-its.2017.0289 [Crossref] [ Google Scholar]
- Jing D, Liu D, Zhang S, Guo Z. Fatigue driving detection method based on EEG analysis in low-voltage and hypoxia plateau environment. Int J Transp Sci Technol 2020; 9:366-76. doi: 10.1016/j.ijtst.2020.03.008 [Crossref] [ Google Scholar]
- Huang T, Fu R, Chen Y, Sun Q. Real-time driver behavior detection based on deep deformable inverted residual network with an attention mechanism for human-vehicle co-driving system. IEEE Trans Veh Technol 2022; 71:12475-88. doi: 10.1109/tvt.2022.3195230 [Crossref] [ Google Scholar]
- Huang R, Wang Y, Li Z, Lei Z, Xu Y. RF-DCM: multi-granularity deep convolutional model based on feature recalibration and fusion for driver fatigue detection. IEEE trans Intell Transp Syst 2022; 23:630-40. doi: 10.1109/tits.2020.3017513 [Crossref] [ Google Scholar]
- Hong S, Kwon H, Choi SH, Park KS. Intelligent system for drowsiness recognition based on ear canal electroencephalography with photoplethysmography and electrocardiography. Inf Sci (N Y) 2018; 453:302-22. doi: 10.1016/j.ins.2018.04.003 [Crossref] [ Google Scholar]
- Zhang Y, Cao W, Feng L, Wang M, Geng T, Zhou J. SHNN: a single-channel EEG sleep staging model based on semi-supervised learning. Expert Syst Appl 2023; 213:119288. doi: 10.1016/j.eswa.2022.119288 [Crossref] [ Google Scholar]
- Rajan JP, Rajan SE. An Internet of Things based physiological signal monitoring and receiving system for virtual enhanced health care network. Technol Health Care 2018; 26:379-85. doi: 10.3233/thc-171173 [Crossref] [ Google Scholar]
- Zhou Z, Su Y, Zhang Y, Xia Z, Du S, Gupta BB. Coverless information hiding based on probability graph learning for secure communication in IoT environment. IEEE Internet Things J 2022; 9:9332-41. doi: 10.1109/jiot.2021.3103779 [Crossref] [ Google Scholar]
- Yuan D, Yue J, Xiong X, Jiang Y, Zan P, Li C. A regression method for EEG-based cross-dataset fatigue detection. Front Physiol 2023; 14:1196919. doi: 10.3389/fphys.2023.1196919 [Crossref] [ Google Scholar]
- Miao Y, Bai X, Cao Y, Liu Y, Dai F, Wang F. A novel short-term traffic prediction model based on SVD and ARIMA with blockchain in industrial Internet of Things. IEEE Internet Things J 2023; 10:21217-26. doi: 10.1109/jiot.2023.3283611 [Crossref] [ Google Scholar]
- Zeng H, Zhang J, Zakaria W, Babiloni F, Gianluca B, Li X. InstanceEasyTL: an improved transfer-learning method for EEG-based cross-subject fatigue detection. Sensors (Basel) 2020; 20:7251. doi: 10.3390/s20247251 [Crossref] [ Google Scholar]
- Min J, Xiong C, Zhang Y, Cai M. Driver fatigue detection based on prefrontal EEG using multi-entropy measures and hybrid model. Biomed Signal Process Control 2021; 69:102857. doi: 10.1016/j.bspc.2021.102857 [Crossref] [ Google Scholar]
- Ren Z, Li R, Chen B, Zhang H, Ma Y, Wang C. EEG-based driving fatigue detection using a two-level learning hierarchy radial basis function. Front Neurorobot 2021; 15:618408. doi: 10.3389/fnbot.2021.618408 [Crossref] [ Google Scholar]
- Zeng H, Li X, Borghini G, Zhao Y, Aricò P, Di Flumeri G. An EEG-based transfer learning method for cross-subject fatigue mental state prediction. Sensors (Basel) 2021; 21:2369. doi: 10.3390/s21072369 [Crossref] [ Google Scholar]
- Abdubrani R, Mustafa M, Zahari ZL. A robust framework for driver fatigue detection from EEG signals using enhancement of modified z-score and multiple machine learning architectures. IIUM Eng J 2023; 24:354-72. doi: 10.31436/iiumej.v24i2.2799 [Crossref] [ Google Scholar]
- Yang Y, Gao Z, Li Y, Cai Q, Marwan N, Kurths J. A complex network-based broad learning system for detecting driver fatigue from EEG signals. IEEE Trans Syst Man Cybern Syst 2021; 51:5800-8. doi: 10.1109/tsmc.2019.2956022 [Crossref] [ Google Scholar]
- Du G, Long S, Li C, Wang Z, Liu PX. A product fuzzy convolutional network for detecting driving fatigue. IEEE Trans Cybern 2023; 53:4175-88. doi: 10.1109/tcyb.2021.3123842 [Crossref] [ Google Scholar]
- Wang F, Wu S, Ping J, Xu Z, Chu H. EEG driving fatigue detection with PDC-based brain functional network. IEEE Sens J 2021; 21:10811-23. doi: 10.1109/jsen.2021.3058658 [Crossref] [ Google Scholar]
- Zhang W, Wang F, Wu S, Xu Z, Ping J, Jiang Y. Partial directed coherence based graph convolutional neural networks for driving fatigue detection. Rev Sci Instrum 2020; 91:074713. doi: 10.1063/5.0008434 [Crossref] [ Google Scholar]
- Zeng Z, Huang Z, Leng K, Han W, Niu H, Yu Y. Nonintrusive monitoring of mental fatigue status using epidermal electronic systems and machine-learning algorithms. ACS Sens 2020; 5:1305-13. doi: 10.1021/acssensors.9b02451 [Crossref] [ Google Scholar]
- Jantan S, Ahmad SA, Soh AC, Ishak AJ, Raja Adnan RN. A multi-model analysis for driving fatigue detection using EEG signals. In: 2022 IEEE-EMBS Conference on Biomedical Engineering and Sciences (IECBES). Kuala Lumpur, Malaysia: IEEE; 2022. p. 183-8. 10.1109/iecbes54088.2022.10079534.
- Gao D, Wang K, Wang M, Zhou J, Zhang Y. SFT-Net: a network for detecting fatigue from EEG signals by combining 4D feature flow and attention mechanism. IEEE J Biomed Health Inform 2024; 28:4444-55. doi: 10.1109/jbhi.2023.3285268 [Crossref] [ Google Scholar]
- Sangeetha SKB, Mathivanan SK, Muthukumaran V, Pughazendi N, Jayagopal P, Uddin MS. A deep learning approach to detect microsleep using various forms of EEG signal. Math Probl Eng 2023; 2023:7317938. doi: 10.1155/2023/7317938 [Crossref] [ Google Scholar]
- Jingwei F. Fatigue driving detection system based on EEG signal. In: 2021 IEEE 4th International Conference on Automation, Electronics and Electrical Engineering (AUTEEE). Shenyang, China: IEEE; 2021. p. 299-302. 10.1109/auteee52864.2021.9668667.
- Wu EQ, Deng PY, Qiu XY, Tang Z, Zhang WM, Zhu LM. Detecting fatigue status of pilots based on deep learning network using EEG signals. IEEE Trans Cogn Dev Syst 2021; 13:575-85. doi: 10.1109/tcds.2019.2963476 [Crossref] [ Google Scholar]
- Zhang Y, Guo R, Peng Y, Kong W, Nie F, Lu BL. An auto-weighting incremental random vector functional link network for EEG-based driving fatigue detection. IEEE Trans Instrum Meas 2022; 71:1-14. doi: 10.1109/tim.2022.3216409 [Crossref] [ Google Scholar]
- Sedik A, Marey M, Mostafa H. WFT-Fati-Dec: enhanced fatigue detection AI system based on wavelet denoising and fourier transform. Appl Sci (Basel) 2023; 13:2785. doi: 10.3390/app13052785 [Crossref] [ Google Scholar]
- Abbas Q, Alsheddy A. Driver fatigue detection systems using multi-sensors, smartphone, and cloud-based computing platforms: a comparative analysis. Sensors (Basel) 2020; 21:56. doi: 10.3390/s21010056 [Crossref] [ Google Scholar]
- Liu Y, Lan Z, Cui J, Sourina O, Müller-Wittig W. Inter-subject transfer learning for EEG-based mental fatigue recognition. Adv Eng Inform 2020; 46:101157. doi: 10.1016/j.aei.2020.101157 [Crossref] [ Google Scholar]
- Ding X, Chen G, Wang J, Xu Y, Zhao J, Xu W, et al. Driving fatigue detection with three prefrontal EEG channels and deep learning model. In: 2023 15th International Conference on Advanced Computational Intelligence (ICACI). Seoul, Korea: IEEE; 2023. p. 1-5. 10.1109/icaci58115.2023.10146150.
- Gao D, Li P, Wang M, Liang Y, Liu S, Zhou J. CSF-GTNet: a novel multi-dimensional feature fusion network based on Convnext-GeLU- BiLSTM for EEG-signals-enabled fatigue driving detection. IEEE J Biomed Health Inform 2024; 28:2558-68. doi: 10.1109/jbhi.2023.3240891 [Crossref] [ Google Scholar]
- Wu EQ, Peng XY, Zhang CZ, Lin JX, Sheng RS. Pilots’ fatigue status recognition using deep contractive autoencoder network. IEEE Trans Instrum Meas 2019; 68:3907-19. doi: 10.1109/tim.2018.2885608 [Crossref] [ Google Scholar]
- Wen T, Zhang Z. Deep convolution neural network and autoencoders-based unsupervised feature learning of EEG signals. IEEE Access 2018; 6:25399-410. doi: 10.1109/access.2018.2833746 [Crossref] [ Google Scholar]
- Ma Y, Chen B, Li R, Wang C, Wang J, She Q. Driving fatigue detection from EEG using a modified PCANet method. Comput Intell Neurosci 2019; 2019:4721863. doi: 10.1155/2019/4721863 [Crossref] [ Google Scholar]
- Rundo F, Rinella S, Massimino S, Coco M, Fallica G, Parenti R. An innovative deep learning algorithm for drowsiness detection from EEG signal. Computation 2019; 7:13. doi: 10.3390/computation7010013 [Crossref] [ Google Scholar]
- Panwar S, Rad P, Quarles J, Golob E, Huang Y. A semi-supervised Wasserstein generative adversarial network for classifying driving fatigue from EEG signals. In: 2019 IEEE International Conference on Systems, Man and Cybernetics (SMC). Bari, Italy: IEEE; 2019. p. 3943-8. 10.1109/smc.2019.8914286.
- Lee C, An J. LSTM-CNN model of drowsiness detection from multiple consciousness states acquired by EEG. Expert Syst Appl 2023; 213:119032. doi: 10.1016/j.eswa.2022.119032 [Crossref] [ Google Scholar]
- Figshare. The Original EEG Data for Driver Fatigue Detection [Internet]. Available from: https://figshare.com/articles/dataset/The_original_EEG_data_for_driver_fatigue_detection/5202739.
- He P, Li P, Sun H. Feature extraction of acoustic signals based on complex Morlet wavelet. Procedia Eng 2011; 15:464-8. doi: 10.1016/j.proeng.2011.08.088 [Crossref] [ Google Scholar]
- Ronca V, Brambati F, Napoletano L, Marx C, Trösterer S, Vozzi A. A novel EEG-based assessment of distraction in simulated driving under different road and traffic conditions. Brain Sci 2024; 14:193. doi: 10.3390/brainsci14030193 [Crossref] [ Google Scholar]
- Chen J, Lin X, Ma W, Wang Y, Tang W. EEG-based emotion recognition for road accidents in a simulated driving environment. Biomed Signal Process Control 2024; 87:105411. doi: 10.1016/j.bspc.2023.105411 [Crossref] [ Google Scholar]
- Alghanim M, Attar H, Rezaee K, Khosravi M, Solyman A, Kanan MA. A hybrid deep neural network approach to recognize driving fatigue based on EEG signals. Int J Intell Syst 2024; 2024:9898333. doi: 10.1155/2024/9898333 [Crossref] [ Google Scholar]