Bioimpacts. 2025;15:30640.
doi: 10.34172/bi.30640
Original Article
A cancer diagnosis transformer model based on medical IoT data for clinical measurements in predictive care systems
Panpan Li Conceptualization, Investigation, Methodology, Writing – original draft, 1, # 
Yan Lv Investigation, Methodology, Validation, Writing – original draft, 2, #
Haiyan Shang Project administration, Writing – review & editing, 3, *
Author information:
1Department of Pulmonary and Critical Care Medicine, the Sixth Medical Center of PLA General Hospital, Beijing 100048, China
2Department of Pulmonary and Critical Care Medicine, the Fourth Medical Center of PLA General Hospital, Beijing100048, China
3Qingdao Fifth People's Hosptial, Qingdao 266000, China
#Both authors contributed equally to this work as first authors.
Abstract
Introduction:
In recent years, advancements in information and communication technology (ICT) and the internet of things (IoT) have revolutionized the healthcare industry, enabling the collection, analysis, and utilization of medical data to improved patient care. One critical area of focus is the development of predictive care systems for early diagnosis and treatment of cancer and disease.
Methods:
Leveraging medical IoT data, this study proposes a novel approach based on transformer model for disease diagnosis. In this paper, features are first extracted from IoT images using a transformer network. The network utilizes a convolutional neural network (CNN) in the encoder part to extract suitable features and employs decoder layers along with attention mechanisms in the decoder part. In the next step, considering that the extracted features have high dimensions and many of these features are irrelevant and redundant, relevant features are selected using the Harris hawk optimization algorithm.
Results:
Various classifiers are used to label the input data. The proposed method is evaluated using a dataset consisting of 5 classes for testing and evaluation, and all results are provided into tables and plots.
Conclusion:
The experimental results demonstrate that the proposed method acceptable performance compared to other methods.
Keywords: Cancer diagnosis, Transformer model, Medical IoT data, Clinical measurement, Predictive care systems, Deep learning
Copyright and License Information
© 2025 The Author(s).
This work is published by BioImpacts as an open access article distributed under the terms of the Creative Commons Attribution Non-Commercial License (
http://creativecommons.org/licenses/by-nc/4.0/). Non-commercial uses of the work are permitted, provided the original work is properly cited.
Funding Statement
Not applicable.
Introduction
In recent decades, significant advancements have been made in information and communication technology (ICT) and the internet of things (IoT), enabling the improved collection, storage, and analysis of medical data, thereby enhancing patient care. One important application of these technologies is the detection and prediction of cancerous diseases. Given the importance of early diagnosis and prompt treatment of cancer, the development and utilization of artificial intelligence models for cancer detection and prediction are highly significant. There are many methods for early disease detection, including computational methods and artificial intelligence-based approaches. A comprehensive study on artificial intelligence methods in healthcare and remote care has been conducted.1 In this research, the use of machine learning methods along with data collection through the Internet of Things has been investigated. Generally, in this field, we face many challenges such as data quality issues, data unavailability, validation and clinical acceptance, and the generalizability and interpretability of machine learning models.
In this context, the creation of a machine learning model for diseases detection based on medical data obtained from the IoT can be a significant step towards improving preventive care systems. This model has the capability to collect, parse, and analyze medical data in real-time and, leveraging machine learning algorithms, can accurately and quickly diagnose cancerous diseases. In this article, we investigate existing methods in the field of diseases diagnosis and prediction, introduce deep learning models, and implement a transformer model for cancer detection based on medical data obtained from the IoT.1,2,3 This model could lead to remarkable improvements in the early detection of cancerous diseases and the provision of active preventive care for patients. Machine learning methods based on fuzzy clustering have been utilized for the identification and diagnosis of lung cancer.2 In the proposed method, lung cancer images are segmented into different regions using fuzzy clustering. Then, in the next stage, lung cancer detection is performed using machine learning methods such as decision trees and association rule mining.
In another approach for lung cancer detection, both CT data and IoT have been utilized.3 In this article, the data obtained are divided into two categories, benign and malignant, using a multi-layer convolutional neural network (CNN) network. The results indicate that the proposed method has a 2.5% increase in accuracy rate compared to other methods. Recently, the use of IoT data has gained significant attention. Lung cancer identification and diagnosis have been achieved using these data and ensemble learning models.4 Various text classification methods on recurrent neural networks have been employed in this article. A team of researchers identified tumors using the IoT, medical images, and improved machine learning methods.5 In this study, images were classified by machine learning models after analysis. The results indicate that in the dataset used, the detection rate of the proposed method is 94.12%. A large dataset has been identified by the IoT.6 In order to utilize this vast amount of data and identify various diseases including lung cancer, quantum computing has been employed for computations. Salman and colleagues have identified various diseases using IoT data and machine learning methods.7 IoT data and machine learning methods have been utilized for cancer detection.8 In this article, after obtaining data from various devices, machine learning methods have been used for preprocessing and cancer detection. The classification models used in this study include decision trees, Bayesian learning, support vector machines, and others.
The problem with classical machine learning methods is that models may not generalize well and can suffer from overfitting. Additionally, the feature extraction phase in these methods, often involving images, is costly and challenging. Suitable feature extraction requires significant expertise and knowledge, and extracted features may not always perform optimally. To address these issues, recent focus has shifted towards deep learning methods.9-15 Unlike classical machine learning methods, deep learning methods do not require explicit feature extraction. CNNs have been used for cancer diagnosis.12 However, deep learning methods face challenges such as high-dimensional feature spaces in deep networks. To tackle this, a method combining feature selection and deep learning has been proposed for the classification of medical images and IoT data.13 Selecting an appropriate architecture in deep networks is also a challenge that can vary based on the type and quantity of data. A comprehensive review of deep learning methods for medical image classification has been presented in the literature.14
In addition to CNNs, transformers have recently gained significant attention. These networks consist of two structures, encoder and decoder. Unlike CNNs, these architectures are more straightforward. Attention mechanisms have been employed in the layers of these two structures.16 Transformer-based methods have been used for extracting information from medical images.17 In this approach, the input image is fed into the encoder, and then the desired information is extracted using the decoder. For breast cancer classification, the use of deep learning methods and transformers has been highlighted.18 Transformers with attention mechanisms and multi-head attention structures have been used for classifying various diseases.19 The results indicate that the proposed method performs acceptably compared to other methods. However, these methods still face many challenges such as the following:
Model interpretability: Deel learning models are known for their complexity, which can hinder interpretability. Understanding how the model makes predictions and translating those insights into actionable clinical decisions is essential for clinical adoption and trust.
Handling imbalanced data: Imbalanced datasets, where instances of cancer cases are significantly outnumbered by non-cancer cases, can bias the model's predictions. Developing strategies to address class imbalance and prevent model bias is crucial for accurate cancer diagnosis.
Real time processing and latency: Medical IoT data often require real-time processing to support timely clinical decision-making. Minimizing latency while maintaining model accuracy and efficiency poses a challenge, especially when dealing with large-scale data streams.
Model generalization: Ensuring the generalization of the transformer model across different patient demographics, healthcare settings, and types of cancer is essential for its applicability in diverse clinical scenarios. Robust validation and testing methodologies are needed to assess model performance across varied contexts.
Addressing these challenges requires collaboration among multidisciplinary teams comprising data scientists, healthcare professionals. By overcoming these hurdles, a cancer diagnosis transformer model based on medical IoT data can significantly enhance predictive care systems and improve cancer detection and treatment outcomes. The structure of the article will be as follows. In the next section, the proposed method, which includes Transformer networks for feature extraction and the Harris Hawk Optimization algorithm for feature selection, will be detailed. In the third section, the performance of the proposed method will be examined from various perspectives, and the evaluation results will be analyzed. Finally, the concluding remarks will be presented in the final section.
Methods
In this section, a proposed method based on deep learning and feature selection is presented for lung disease detection. Given the challenges of feature extraction and engineering in medical image diagnosis, this paper utilizes transformer-based deep learning methods to extract suitable features from IoT data. To achieve this, images are used to training transformer networks and feature extraction. Due to the high dimensionality of features at this stage, the Harris Hawk Optimization method is employed to identify and select important features. Then, in the next stage, classification and disease identification are performed using machine learning methods. The general steps of the proposed method are illustrated in Fig. 1. Further details of the proposed method are explained below.
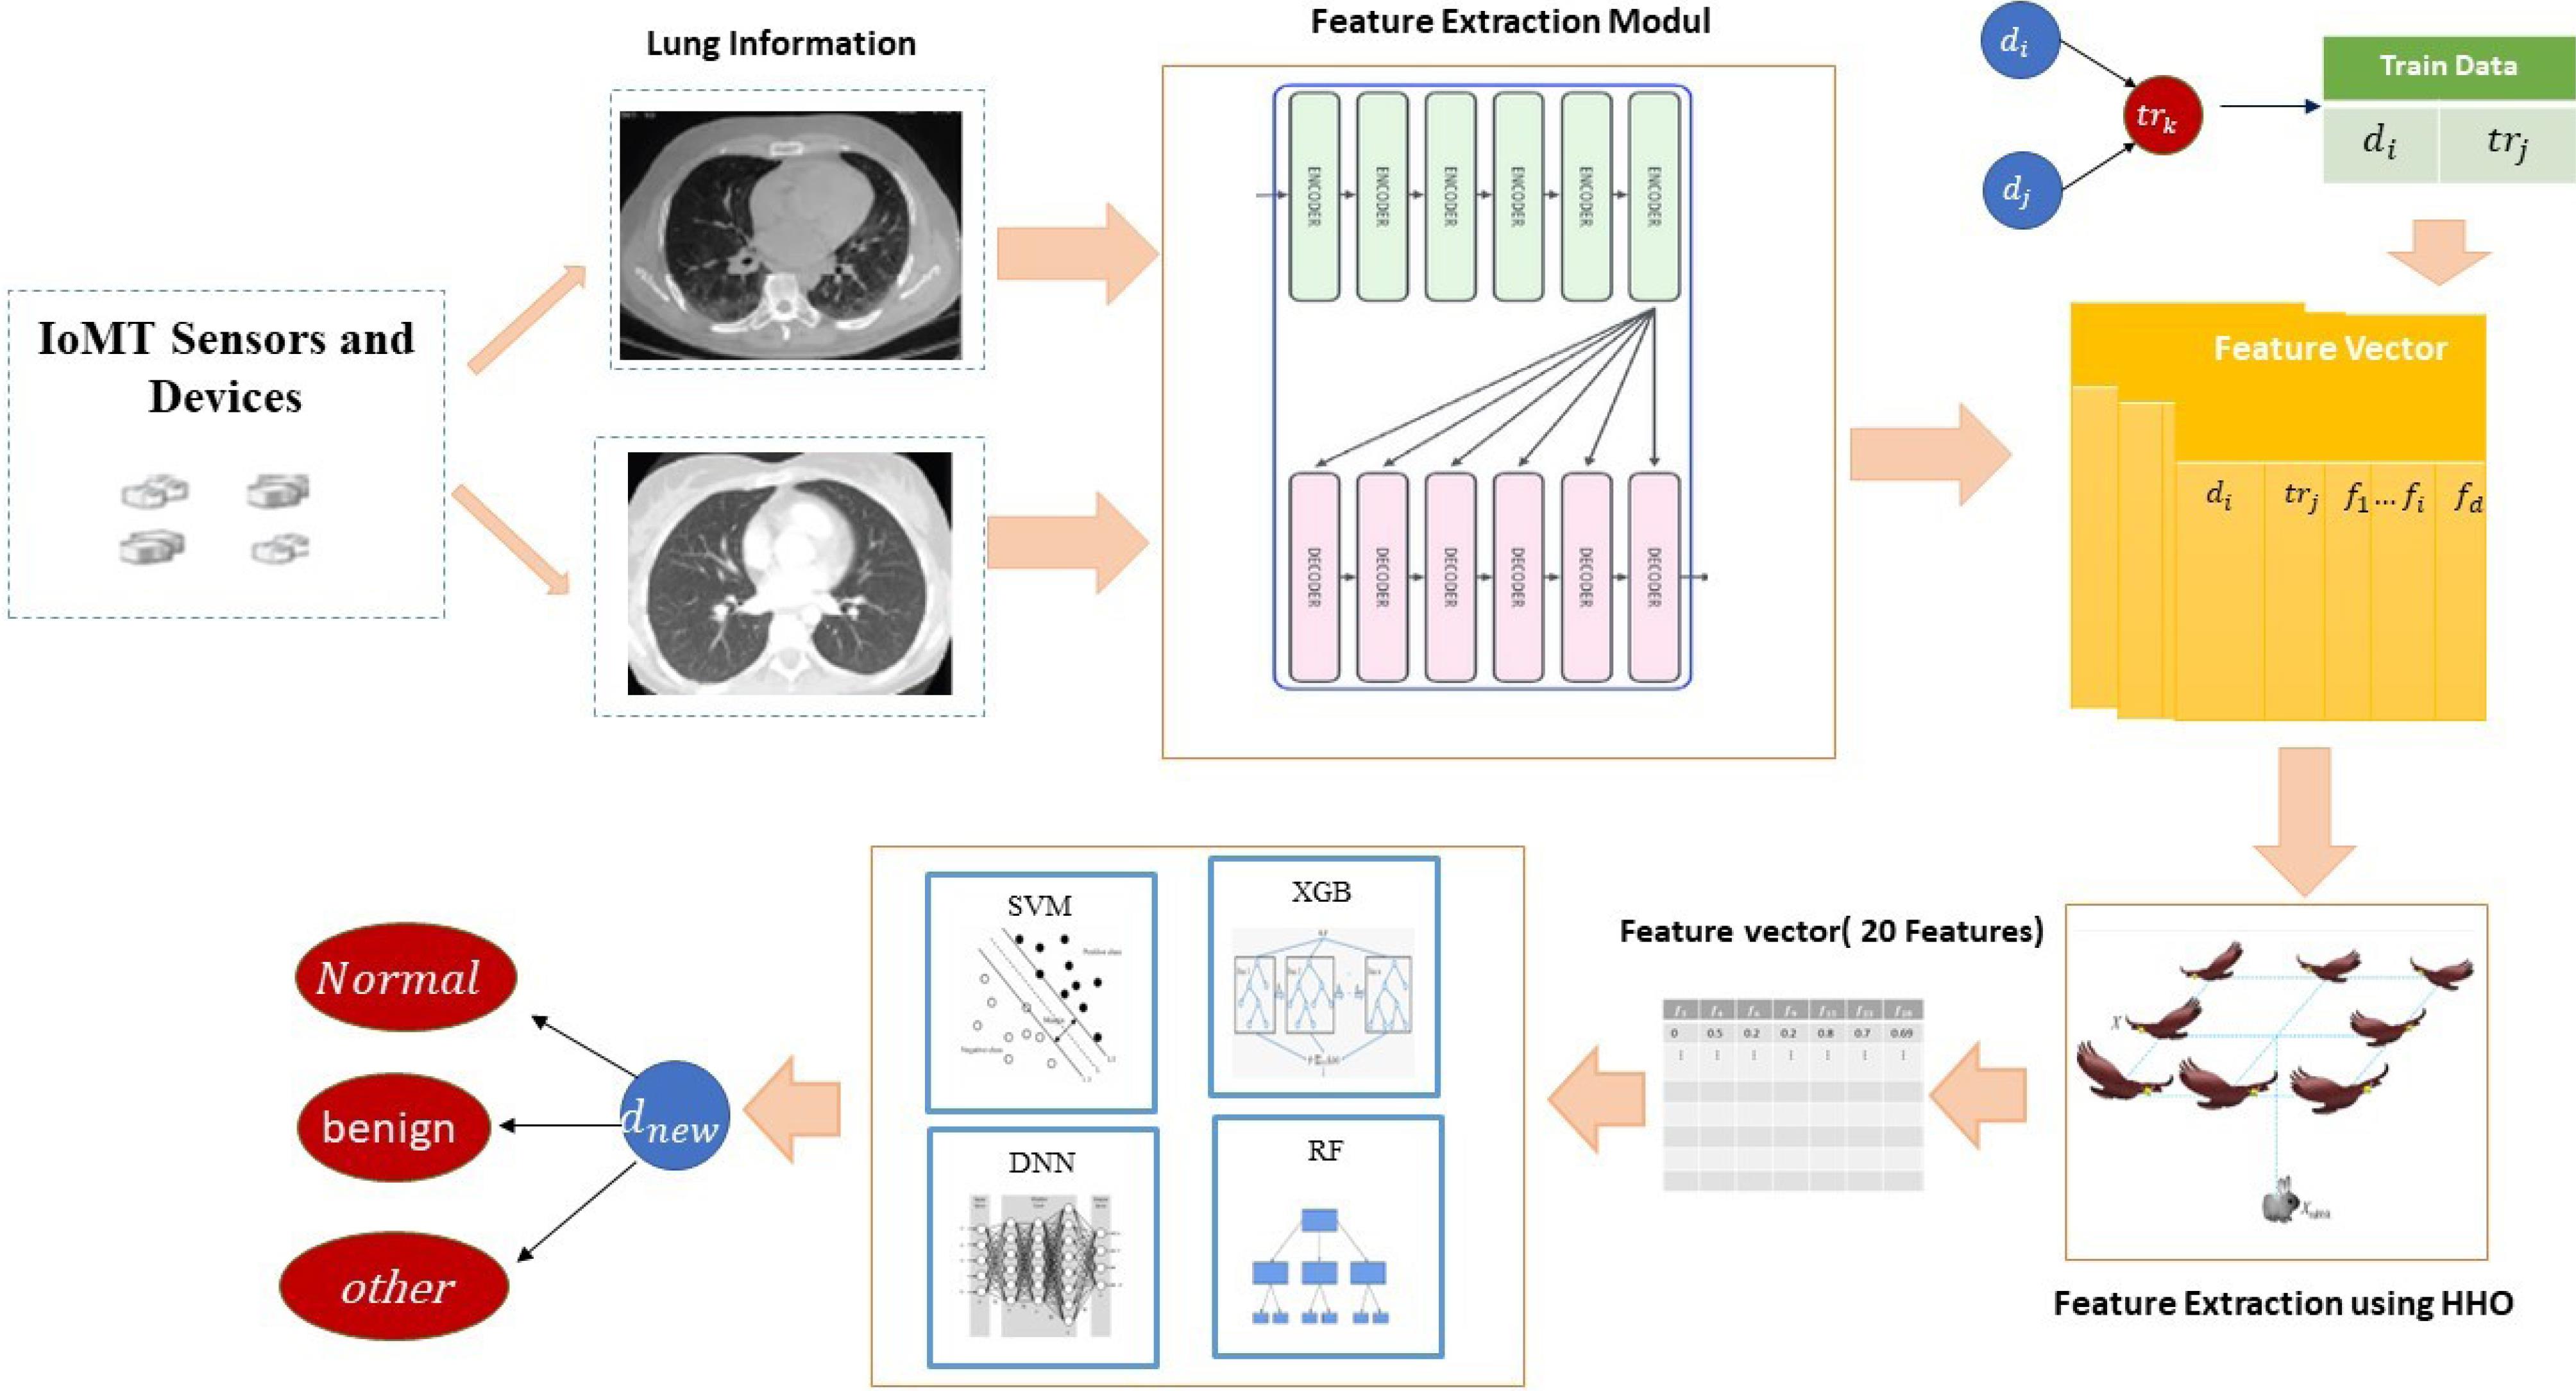
Fig. 1.
Overview of the proposed method's stages.
.
Overview of the proposed method's stages.
Feature extraction step
In the proposed method, images are initially collected from various sensors. These data are then used for training transformer networks and feature extraction. Transformers are based on an encoder-decoder architecture, consisting of a stack of encoders connected to decoders. The key difference between transformers and autoencoders lies in the self-attention mechanism subblocks, which establishes relationships between tokens and assigns values to each. Transformers have two main components: encoder and decoder blocks, each with distinct responsibilities. Encoders transform the input data (tokens) into a format called the latent space. Then, decoders transform the data from the latent space into the output space. Fig. 2 illustrates the details of the transformer network.
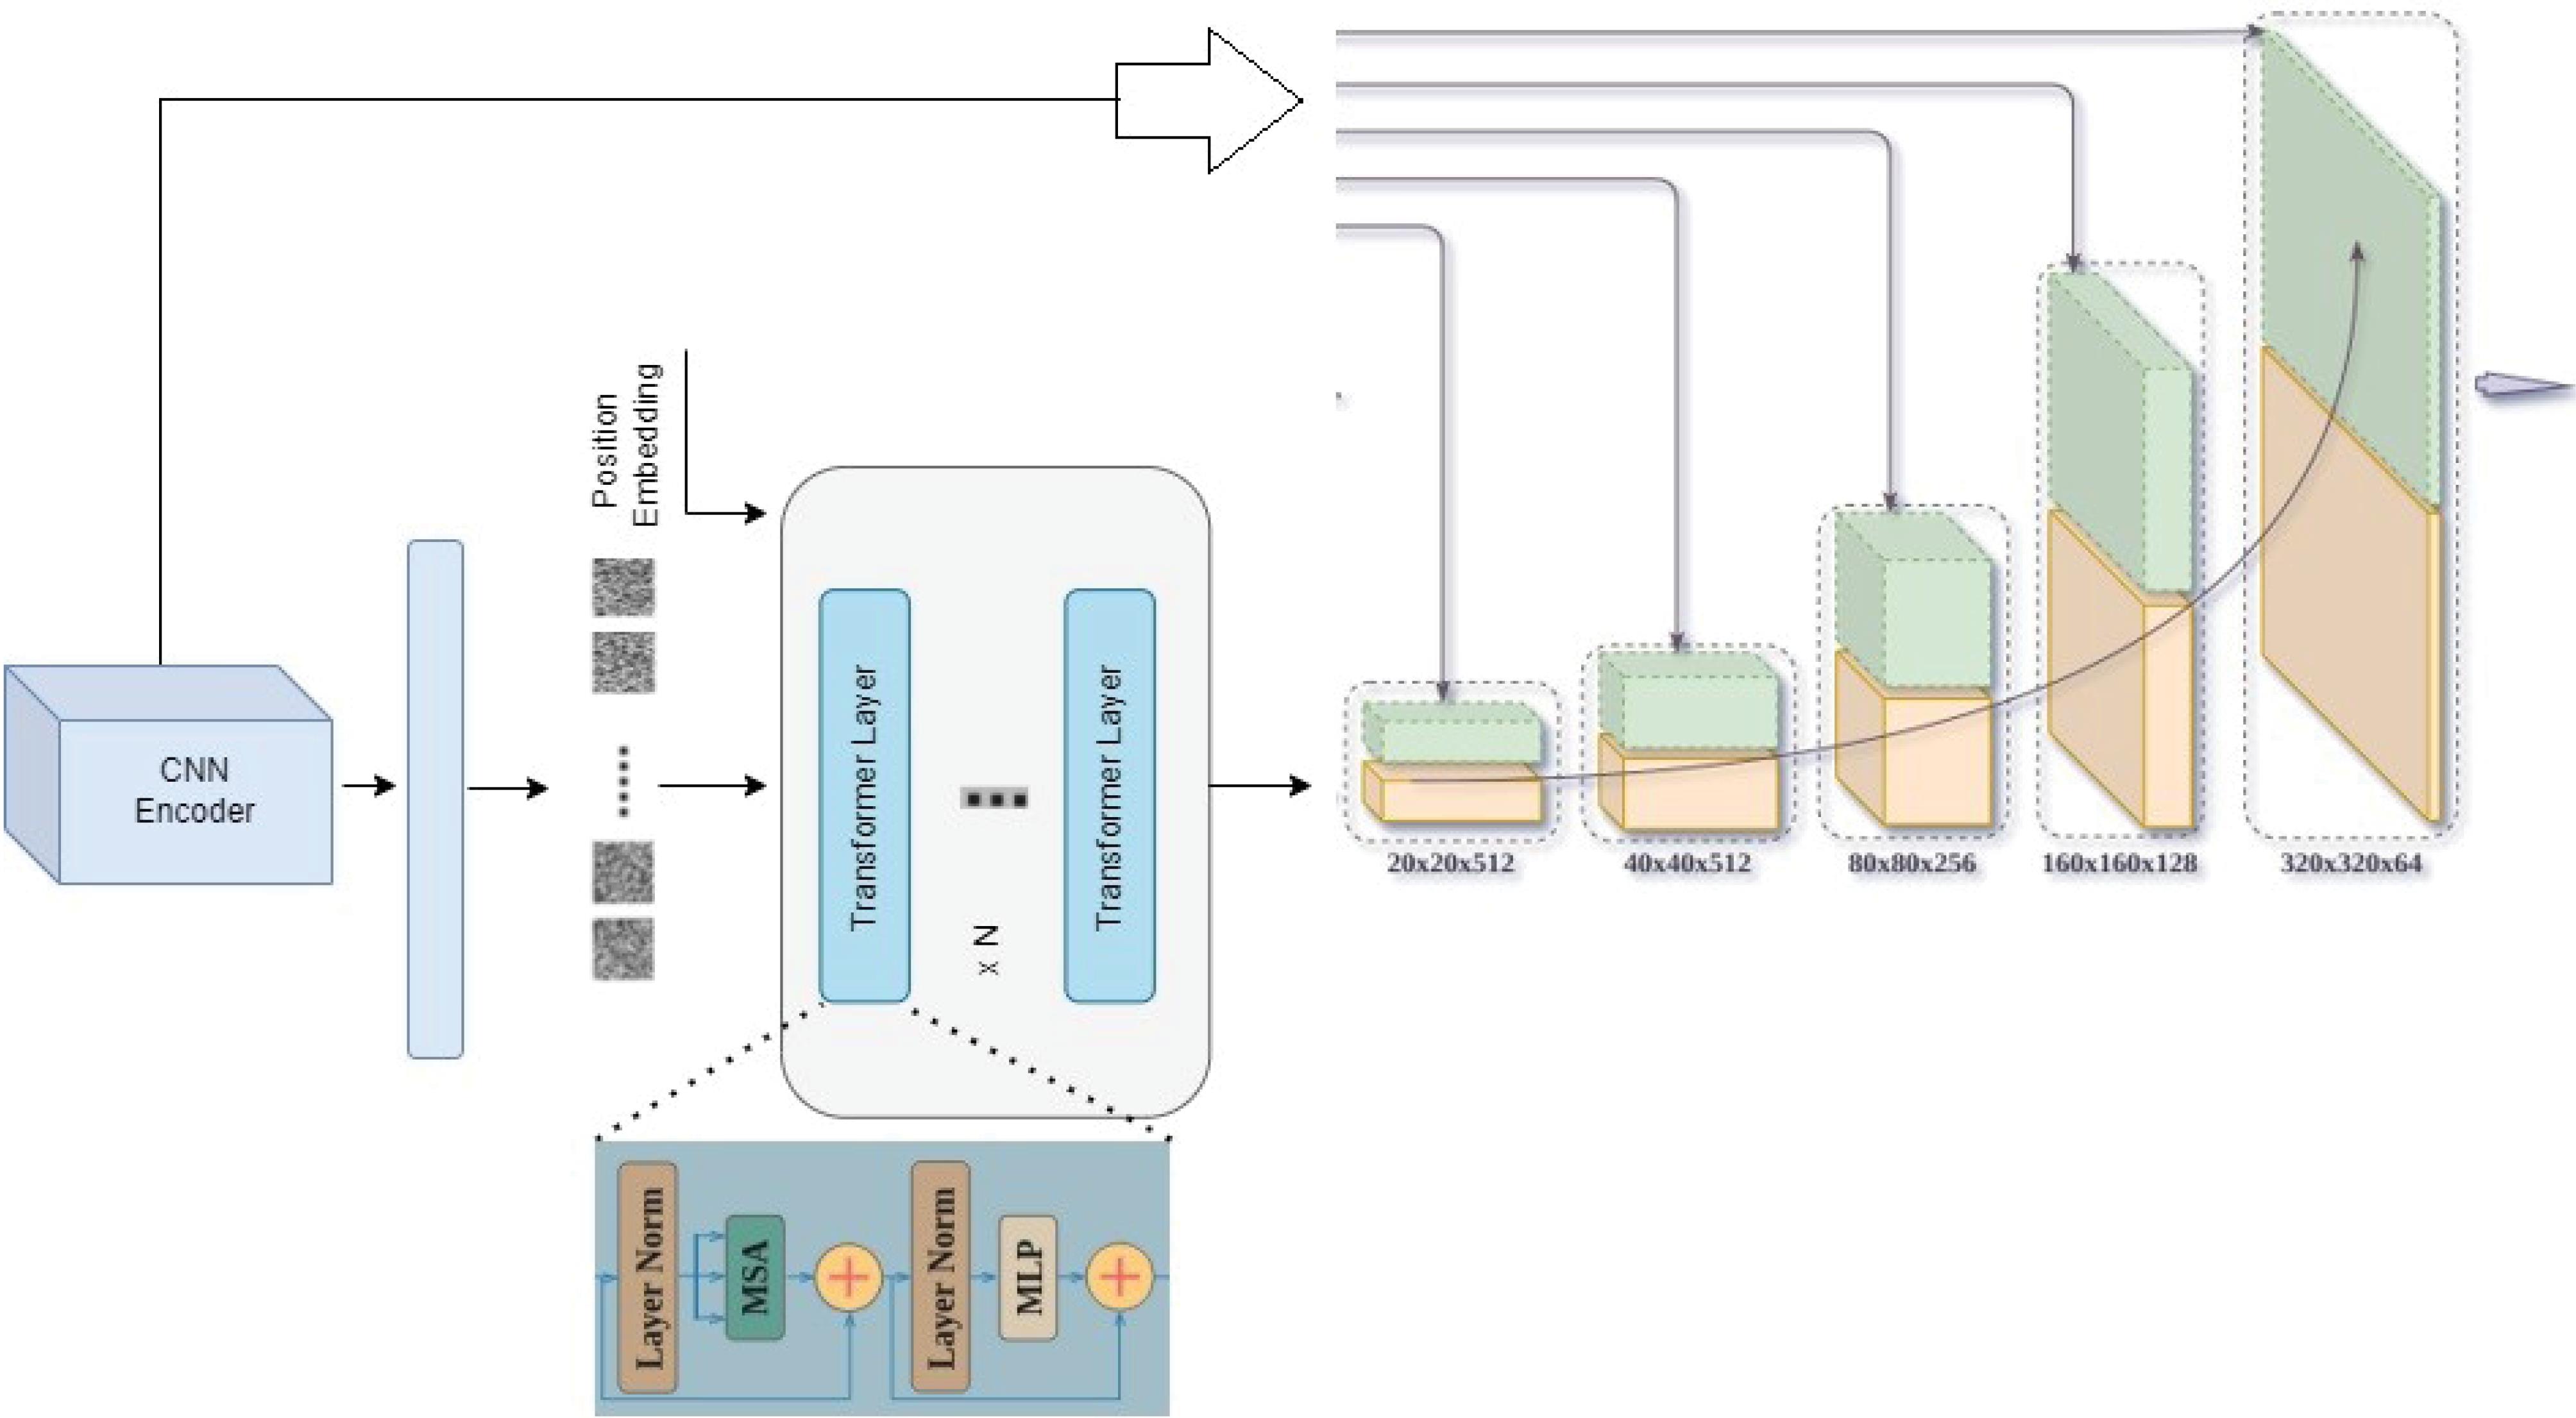
Fig. 2.
Details of the Transformer network used for feature extraction.
.
Details of the Transformer network used for feature extraction.
The proposed method utilizes a combination of encoder-decoder structures and attention mechanisms. The architecture of this model is such that, initially in the encoder part, a convolutional network extracts features from the images. In this part, successive convolutional layers extract various features. The convolutional network starts by resizing the input image to a fixed size of 64x448 using max pooling, which helps in reducing the spatial dimensions while retaining important features. It first resizes the input image into 64x448 using the max pooling method, then splits the image into a sequence of 16x16 patches by passing it through a hybrid CNN encoder. The hybrid CNN encoder combines traditional convolutional layers with advanced techniques such as dilated convolutions or residual connections to enhance feature extraction. The output of this section is a sequence of images with dimensions of 16x16. The details of this part are illustrated in Fig. 3.
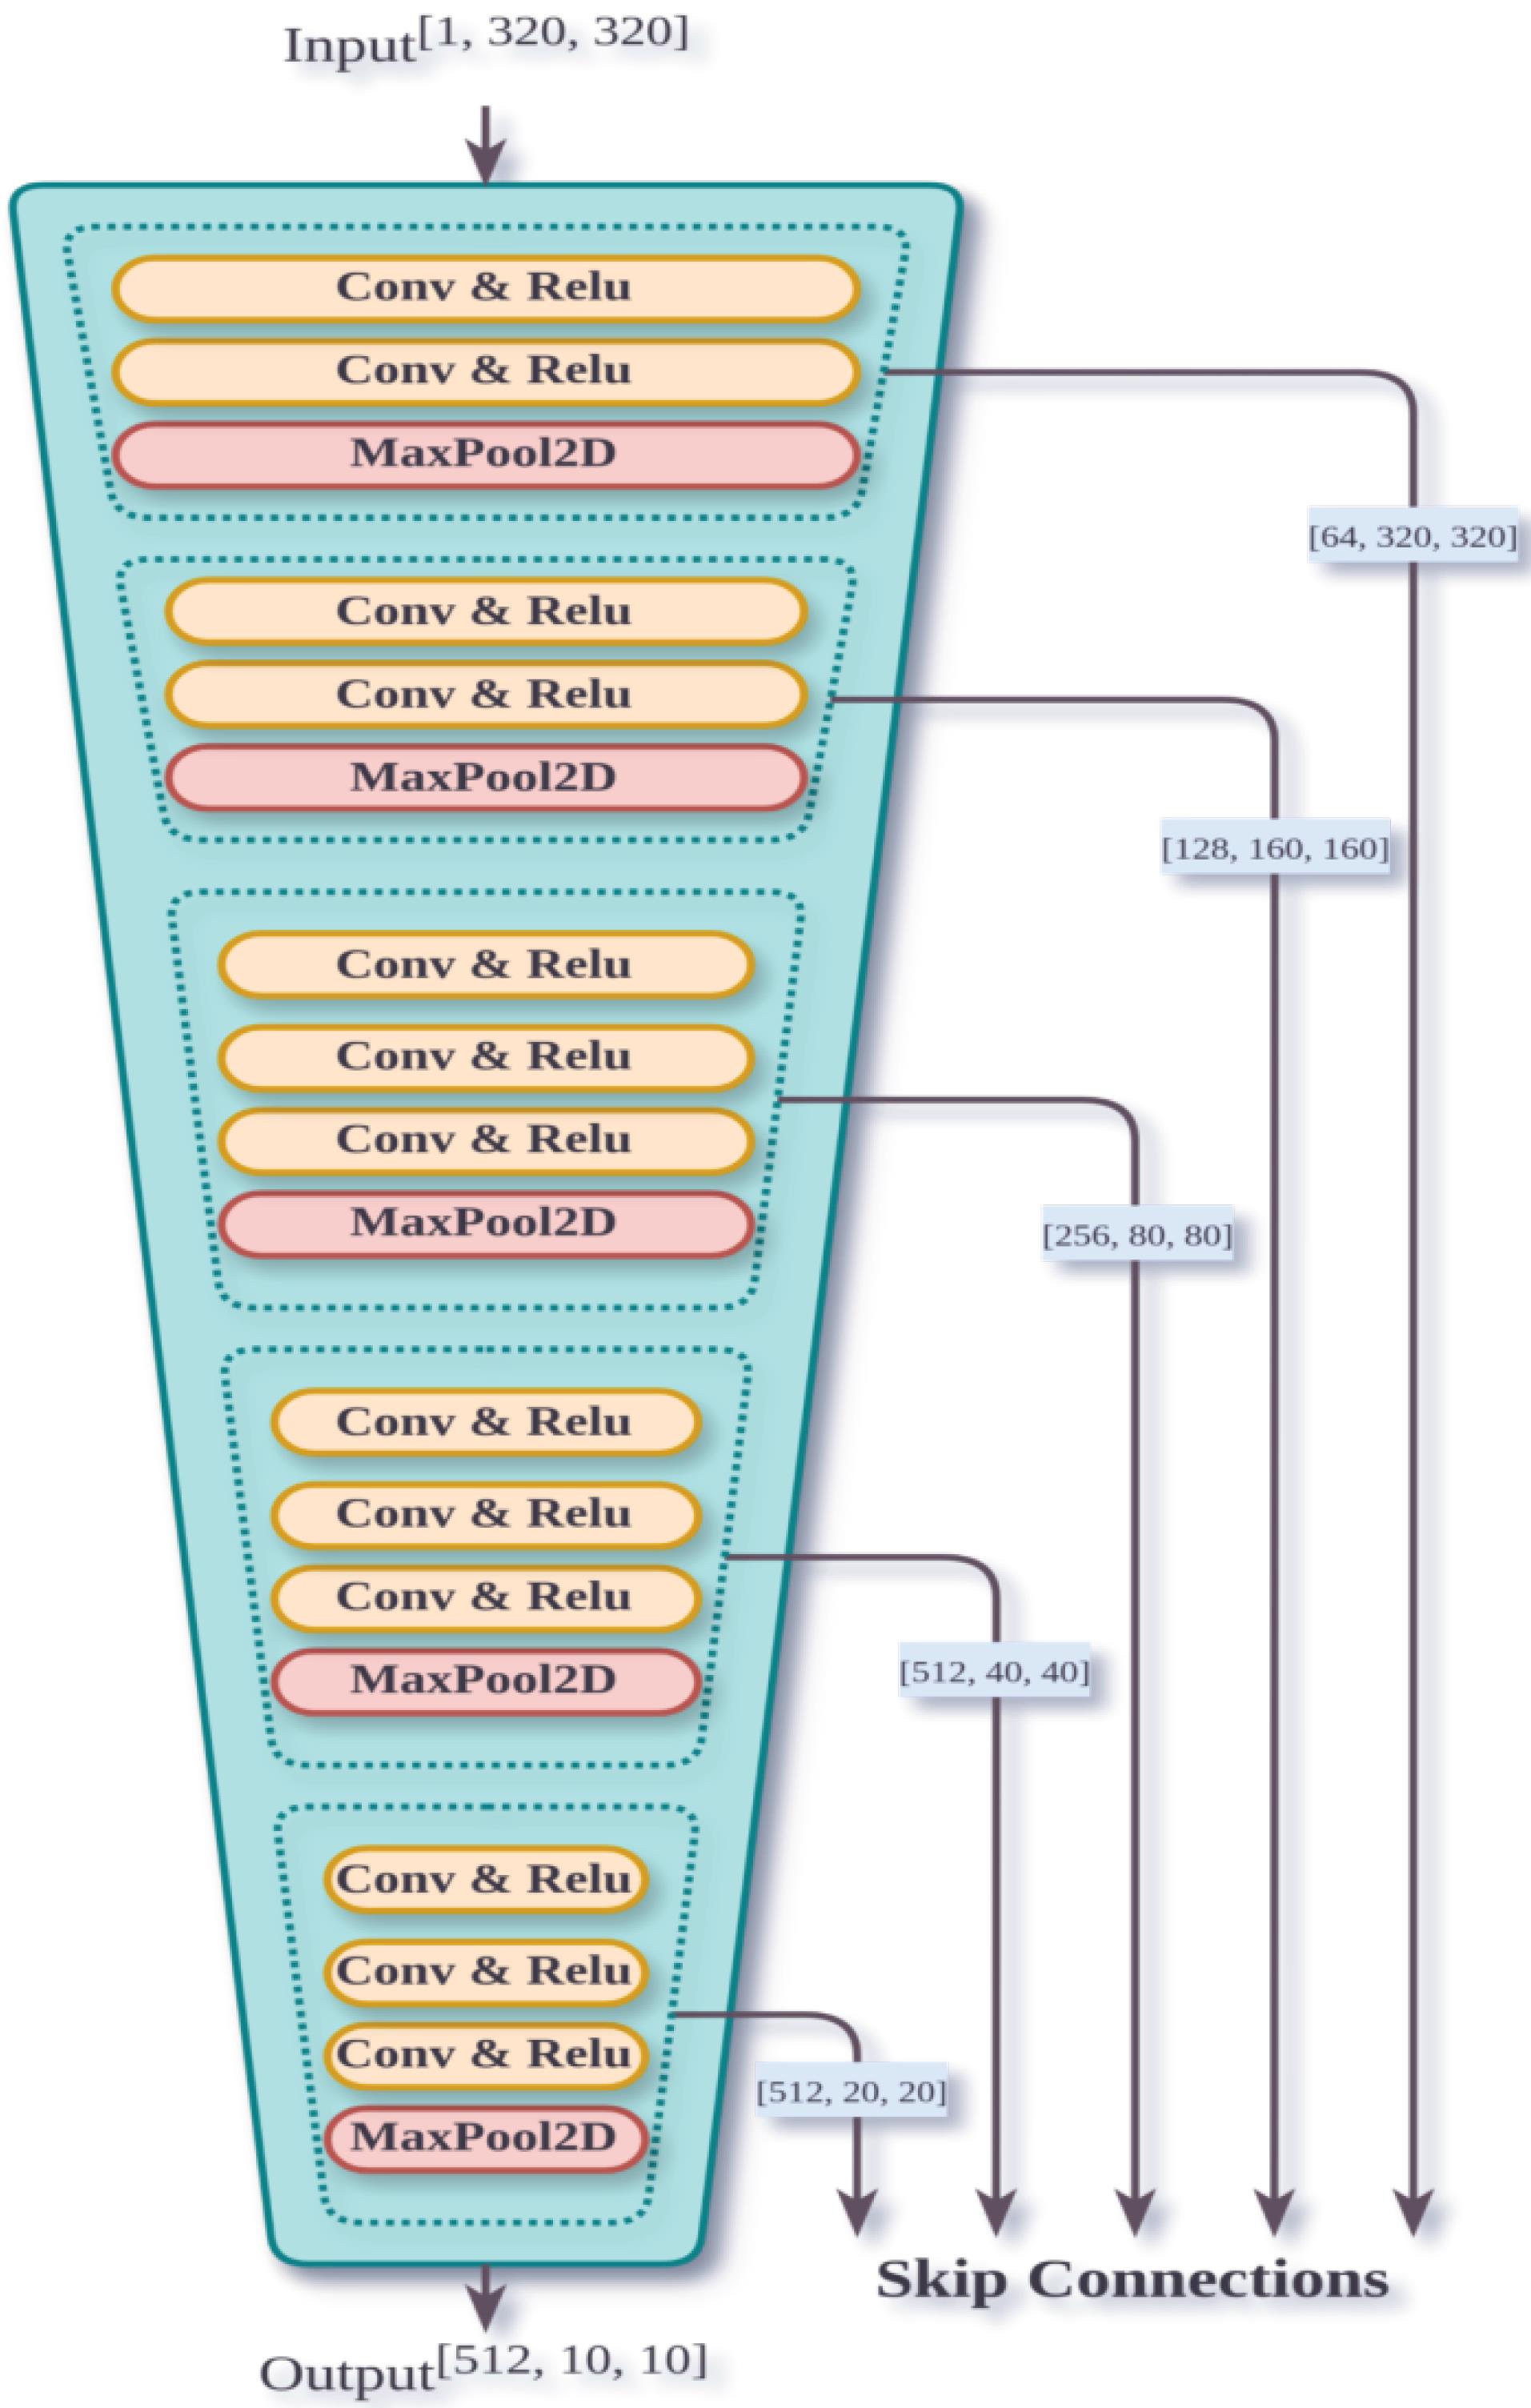
Fig. 3.
Convolutional network architecture used in feature extraction phase.
.
Convolutional network architecture used in feature extraction phase.
The decoder section consists of 6 decoder layers. Each decoder layer performs operations such as self-attention and cross-attention, which allow the model to focus on different parts of the input sequence and the encoded features. As illustrated in Fig. 2, each layer has 3 sub-layers. In the decoder, residual connections along with normalization are applied to each sub-layer. Residual connections help in preventing the vanishing gradient problem by allowing gradients to flow through the network more effectively, while normalization layers stabilize and accelerate training. Additionally, masking is employed in the decoder to ensure that predictions are based on previous data. This masking technique prevents the model from accessing future information during training, which is crucial for tasks involving sequential data.
The attention mechanism is a crucial component of transformer networks. This function maps a query and a set of key-value pairs, which correspond to an input. In attention mechanisms, the query vector represents the current focus of the model, while the key-value pairs provide context from the input data. The attention scores are computed as a weighted sum of these values based on the similarity between the query and the keys. The query, keys, and values are all vectors. This function is computed using the following relationship.
(1)
In transformer networks, multi-head attention is used to extract different information from input data. Multi-head attention is a feature of transformers that processes inputs simultaneously and in parallel. This mechanism is based on the following relationship.
(2)
Each decoder layer includes a fully connected feed-forward sublayer, which is applied independently and uniformly to each position. This sublayer consists of two linear mappings with a ReLU activation function between them. Formula 3 illustrates it.
(3)
After applying the encoder and generating images with dimensions of 16 by 16, to enable the model to have information about the order of the images, such as the relationships between tokens and their exact positions, positional encoding is added at the beginning of the decoder. In this model, formula 4 is used.
(4)
In the mentioned formula, "pos" represents the position, and "i" represents the token dimension. In this formula, each dimension of positional encoding is associated with a sinusoidal wave.
In our study, the parameters for the deep learning and optimization models were determined using a trial-and-error approach. We systematically adjusted key parameters such as learning rate, batch size, number of layers, and optimization algorithms through iterative testing. Each parameter setting was evaluated based on its impact on model performance, including accuracy and generalization capability. Although we did not utilize formal optimization techniques like grid search, random search, or Bayesian optimization, this empirical method proved effective in fine-tuning our models. By assessing various parameter configurations and their effects on the model, we identified optimal settings that significantly enhanced performance. We will include a detailed description of this parameter tuning process in the revised manuscript to provide a clearer understanding of how different parameters influenced the model's accuracy and robustness. Also, we utilized a server equipped with 64 GB of RAM and an NVIDIA GeForce RTX 3060 GPU with 12 GB of VRAM. The GPU was chosen for its balance between performance and cost-effectiveness, which is suitable for training medium-sized models. Additionally, the server runs on a Linux-based operating system and uses popular deep learning frameworks such as PyTorch, and SKlearn optimized for GPU acceleration. This setup provides sufficient computational power for running experiments and fine-tuning models while maintaining manageable resource consumption.
Feature selection step
In the previous stage, the high dimensionality of extracted features from medical images leads to challenges such as overfitting of machine learning models and increased computational burden. Therefore, there is a need to select appropriate and effective features. In the second stage of the proposed algorithm, an improved version of the Harris Hawk algorithm is utilized for selecting relevant features. Using the evolutionary improved Harris Hawk algorithm and the features extracted in the previous stage, an attempt is made to select effective and relevant features. To employ this method, the structure and initial values of the Harris Hawks need to be specified. For this purpose, initially, irrelevant features are filtered out using correlation criteria. This approach reduces the search space to find the best subset of features. The Harris Hawk Optimization algorithm was chosen for feature selection due to its ability to perform global search effectively and avoid local optima. It efficiently navigates the search space to identify optimal features, and its flexibility and robustness make it well-suited for handling complex feature selection tasks, ultimately improving the model’s accuracy and performance.
Initializing particles
To generate each particle (referred to as a Harris Hawk in this context), a set of randomly selected non-repetitive features is chosen from the preserved features that were obtained during the filtering stage. This means that from the set of features that passed the initial filtering process, a random subset is selected to form a particle, ensuring that no feature is chosen more than once within that particle.
Each particle represents a possible solution and consists of a random selection of features from the dataset. The number of features included in a particle depends on the dimensionality of the dataset, meaning the total number of available features after the filtering stage. This process of feature selection for particles allows the algorithm to explore different combinations of features to identify the most effective subset for the given task.
Fig. 4 illustrates the structure of these particles. The numbers inside the cells of Fig. 4 represent the specific features that have been selected for each particle. For example, if a cell contains the number "3," it indicates that the third feature from the dataset has been chosen as part of that particle's feature subset. This visual representation helps in understanding how each particle (Harris Hawk) is composed of different combinations of features.
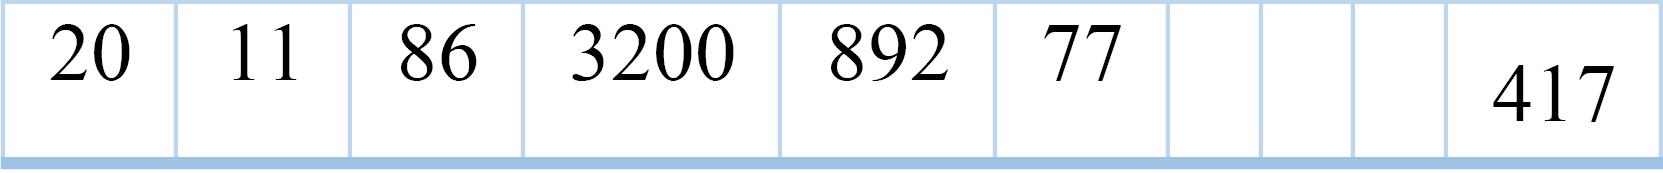
Fig. 4.
The structure of particles in the proposed method.
.
The structure of particles in the proposed method.
After generating the initial particles, the fitness (accuracy) of each hawk in the initial generation is calculated. Since the proposed feature selection method is based on wrapper techniques, the classifier used in this stage is the rotation forest method.
Stop condition
The algorithm can terminate under various conditions. One condition is a specified number of iterations determined by the user. In this paper, after evaluating the results obtained, an optimal number of iterations of 400 has been used based on the dataset. Another termination condition is when the average fitness of particles does not change significantly over several generations. If the average fitness of particles remains stable over several iterations, the algorithm terminates.
Applying the Harris Hawk algorithm
The Harris Hawk algorithm consists of three phases: exploration, exploitation, and extraction. In each phase, the hawks simulate their attack on prey using mathematical relationships. In this algorithm, based on the fitness function, the best particle in each generation is recognized as the prey, and the other hawks in that generation attempt to attack it. At the beginning of each iteration, the algorithm enters one of the execution phases based on the prey's energy.
In each phase of the Harris Hawk algorithm, random values such as the probability of hawks perching, the probability of prey escaping, remaining energy, and prey's jumping power are generated. Based on these values, the algorithm enters one of the phases. It's noteworthy that the energy, escape probability, and jump power of the prey are functions of the number of algorithm iterations; meaning, these values decrease over time. Depending on which phase the algorithm enters, the values of all particles' features are updated, and the fitness function is recalculated. In each phase, the values of all hawks' features for a generation are updated according to formulas 5 to 17.
Exploration phase:In the Harris Hawk Optimization (HHO) algorithm, Harris's hawks settle in some random locations according to two strategies and wait for prey detection. If we consider the probability of settling for each strategy as equal to 𝑞, the hawks choose their seating positions based on the location of other family members (so that they are close enough) and also the position of the prey according to Equation 5.
(5)
In this equation, 𝑋(𝑡 + 1) represents the vector of hawk positions in iteration 𝑡 + 1, 𝑋rabbit(𝑡) represents the position of the rabbit (prey), 𝑋(𝑡) represents the current vector of hawk positions, 𝑟1, 𝑟2, 𝑟3, 𝑟4, and 𝑞 are random numbers in the range (0, 1). LB and UB represent the lower and upper bounds of the variables, respectively. 𝑋rand(𝑡) is a randomly selected hawk from the current population. 𝑋𝑚 represents the average position of hawks in the current population, calculated according to the following equation.
In this equation, 𝑋𝑖(𝑡) represents the position of each hawk in one iteration, and 𝑁represents the total number of hawks.
Transition from the exploration phase to the extraction phase:The HHO algorithm can transition from the exploration phase to the exploitation phase, and then based on the escape energy of the prey, it can adopt different extraction behaviors. The energy of prey significantly decreases during escape. To model this problem, the energy of the prey is represented as follows.
In this equation, 𝐸 represents the escape energy of the prey, 𝑇 denotes the maximum number of iterations, and 𝐸0 is the initial energy of the prey. The escape energy 𝐸 follows a descending trend during iterations. When the ∣𝐸∣ ≥ 1, the hawks search different regions to discover the prey's position. When ∣𝐸∣ < 1, the algorithm attempts to identify the neighborhood of solutions during the extraction steps. In summary, the exploration operation occurs when ∣𝐸∣ ≥ 1, while the extraction operations take place in subsequent steps when ∣𝐸∣ < 1.
Extraction phase:In this phase, based on the prey escape behaviors and pursuit strategies of Harris's hawks, four strategies have been proposed in the HHO algorithm to model how attacks are carried out. Let's assume that 𝑟 represents the probability of successful (𝑟 < 0.5) or unsuccessful (𝑟 ≥ 0.5) prey escape before a surprise attack occurs. Depending on the behavior exhibited by the prey, Harris's hawks execute either a soft or hard besiege operation to capture the prey.
Soft besieging:When the escape probability 𝑟 ≥ 0.5, the prey (rabbit) still has sufficient energy and tries to confuse the hawks with random jumps. During these attempts, Harris's hawks gently encircle the prey, making it more tired, and then execute the final surprise attack. This behavior is based on the lower-level rules modeled.
(8)
In this equation, Δ𝑋(𝑡) represents the difference between the rabbit's position vector and the current position at iteration 𝑡. Additionally, 𝑟5 is a random number in the range of (0, 1), and 𝐽 = 2(1−𝑟5) indicates the power of the rabbit's random jump during the escape process. The value of 𝐽 changes randomly in each iteration to simulate the natural conditions of the rabbit's movements.
Hard besieging:When 𝑟 ≥ 0.5 and ∣𝐸∣ < 0.5, indicating that the prey is tired and has low escape energy, the Harris's hawks tightly encircle the prey to eventually execute a surprise attack. In these circumstances, the current states are updated using Equation (10):
Soft besieging with fast dives:When ∣𝐸∣ ≥ 0.5 but 𝑟 < 0.5, indicating that the prey still has enough energy to escape, and soft besiege is employed before the surprise attack. In this phase, for executing the soft besiege, we assume that the hawks can evaluate their next move based on the rule described by equation (11).
(11)
They then compare the potential outcomes with the previous action to determine whether the next move (a hawk's) could be a good one or not. If the next move is deemed unreasonable (when they observe that the prey is making more evasive movements), they also resort to unusual and rapid maneuvers as they approach the rabbit, based on equation 12.
In this equation, 𝐷 represents the dimension of the problem, and 𝑆 is a random vector with size 1 × 𝐷. In this context, 𝐿𝐹 denotes the Levy flight, which is calculated using equation (13).
(13)
In this equation, 𝑢 and 𝑣 are random values in the interval (0, 1). 𝛽 is a constant value equal to 1.5. Based on this, the final strategy for updating the positions of the hawks in the soft besieging phase is expressed by equation (14).
(14)
In this equation, 𝑌 and 𝑍 are calculated using equations (13) and (14) respectively.
Hard besieging with fast dives: When ∣𝐸∣ < 0.5 and 𝑟 < 0.5, the rabbit will not have enough energy to escape. In these conditions, before the ambush attack, a hard besiege is conducted. In this phase, the situation at the prey side is similar to a soft besiege, but this time, the hawks try to reduce the average distance between their positions and the prey. Therefore, in hard besiege conditions, the following rule is applied:
(15)
In this equation, Y and Z are calculated using the following new rules:
(16)
In this equation, Xm(t) is calculated using equation (2). In each phase, if a new feature generated according to the desired formula is out of range or redundant, a new feature is replaced with the previous one from the best fit. This problem aims to search for optimality in the entire problem space. At the end of each phase, if any of the updated hawks have a better fitness value compared to the prey, they are selected as the prey, and the hawks of the next generation attempt to capture this prey. The accuracy of each hawk is calculated based on different classifiers. Pseudo code for the proposed method is shown in Fig. 5.
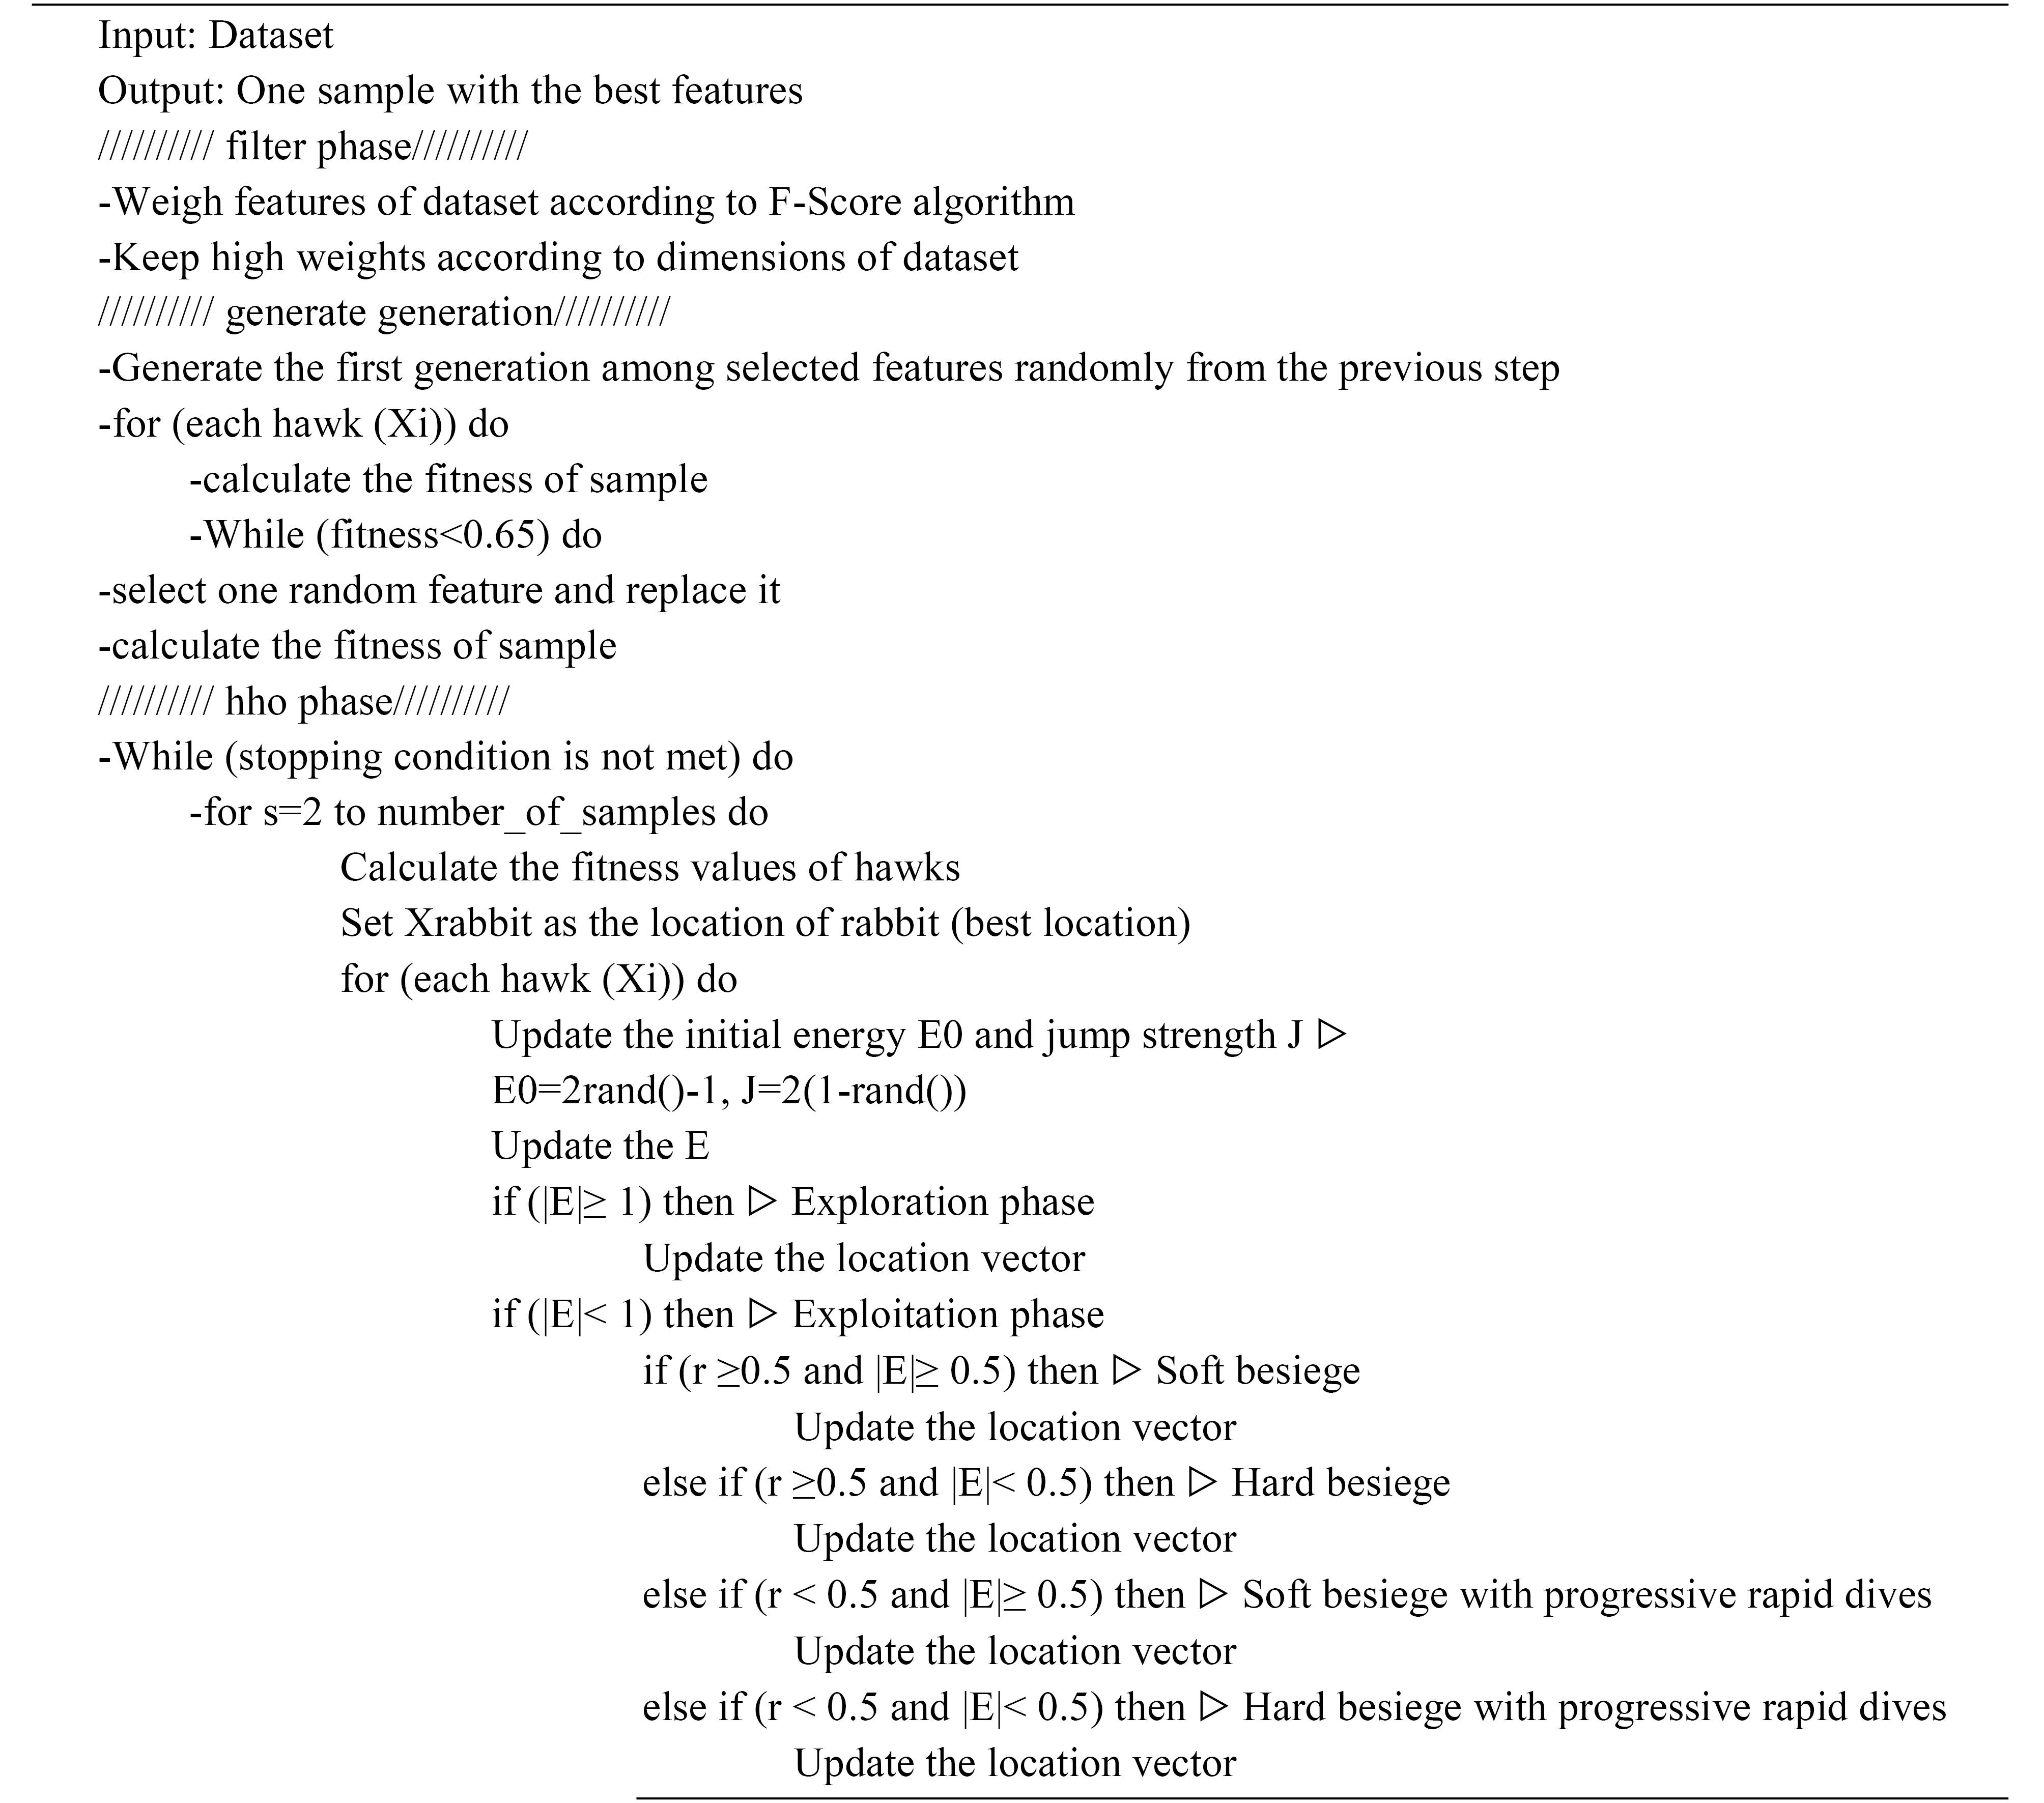
Fig. 5.
Pseudocode of the proposed feature selection algorithm.
.
Pseudocode of the proposed feature selection algorithm.
Final prediction
In the final section, dedicated to classification, for better model evaluation, the data is divided into k-fold (where in this study, k = 10 is considered), and then the data is fed into various classifiers. Different classifier models are trained based on the data and selected features from the previous stage. The classifiers used include SVM, MLP, Random Forest, and XGBoost.
Results
Dataset
The proposed method has been evaluated on an online dataset consisting of four diseases and one normal class, totaling 19,893 CT images. These images are from various SARS-CoV-2 CT datasets, including 2482 COVID-19 and 1252 non-COVID-19 images. Pneumonia images are collected from the COVIDx-CT dataset, comprising 4273 pneumonia and 1,583 normal images. The tuberculosis images consist of 501 aberrant and 501 normal samples. The lung cancer image dataset is extracted from the Cancer Imaging Archive (CIA), containing 5,043 CT scan images. The data were obtained from publicly available sources with proper permissions, and efforts were made to ensure data quality and integrity. Challenges encountered included dealing with variations in imaging protocols, discrepancies in data formats, and ensuring consistency across heterogeneous datasets. Ethical considerations were addressed by following the data use agreements and anonymizing patient information. The model's adaptability to different real-world environments was assessed by testing its performance on these diverse datasets, demonstrating its practical applicability. Details of the dataset are shown in Table 1.
Table 1.
Details of the dataset used
|
Class
|
Database
|
Train
|
Test
|
Total
|
| Pneumonia |
COVIDx-CT |
3419 |
854 |
4273 |
| Tuberculosis |
PTB |
401 |
100 |
501 |
| Covid-19 |
SARS-CoV-2 CT |
1986 |
496 |
2482 |
| Lung cancer |
CIA |
4355 |
1088 |
5043 |
| Normal |
- |
4302 |
1292 |
5594 |
Evaluation metrics
To evaluate the proposed system, various methods are available. Accuracy and classification error are the main evaluation criteria related to classification and prediction of samples in the training phase. The evaluation metrics used for assessing classification models based on the confusion matrix ((true positives, false negatives, false positives, true negatives)) include the following:
(18)
(21)
In order to train and test the proposed method, the data is divided into two sets: training and testing. This division should be done properly so that data from different classes are equally represented in both sets. For this purpose, in Fig. 6, the selection of data for the training and testing sets for different classes based on principal component analysis is illustrated. As shown, the data is appropriately divided into the training and testing sets.
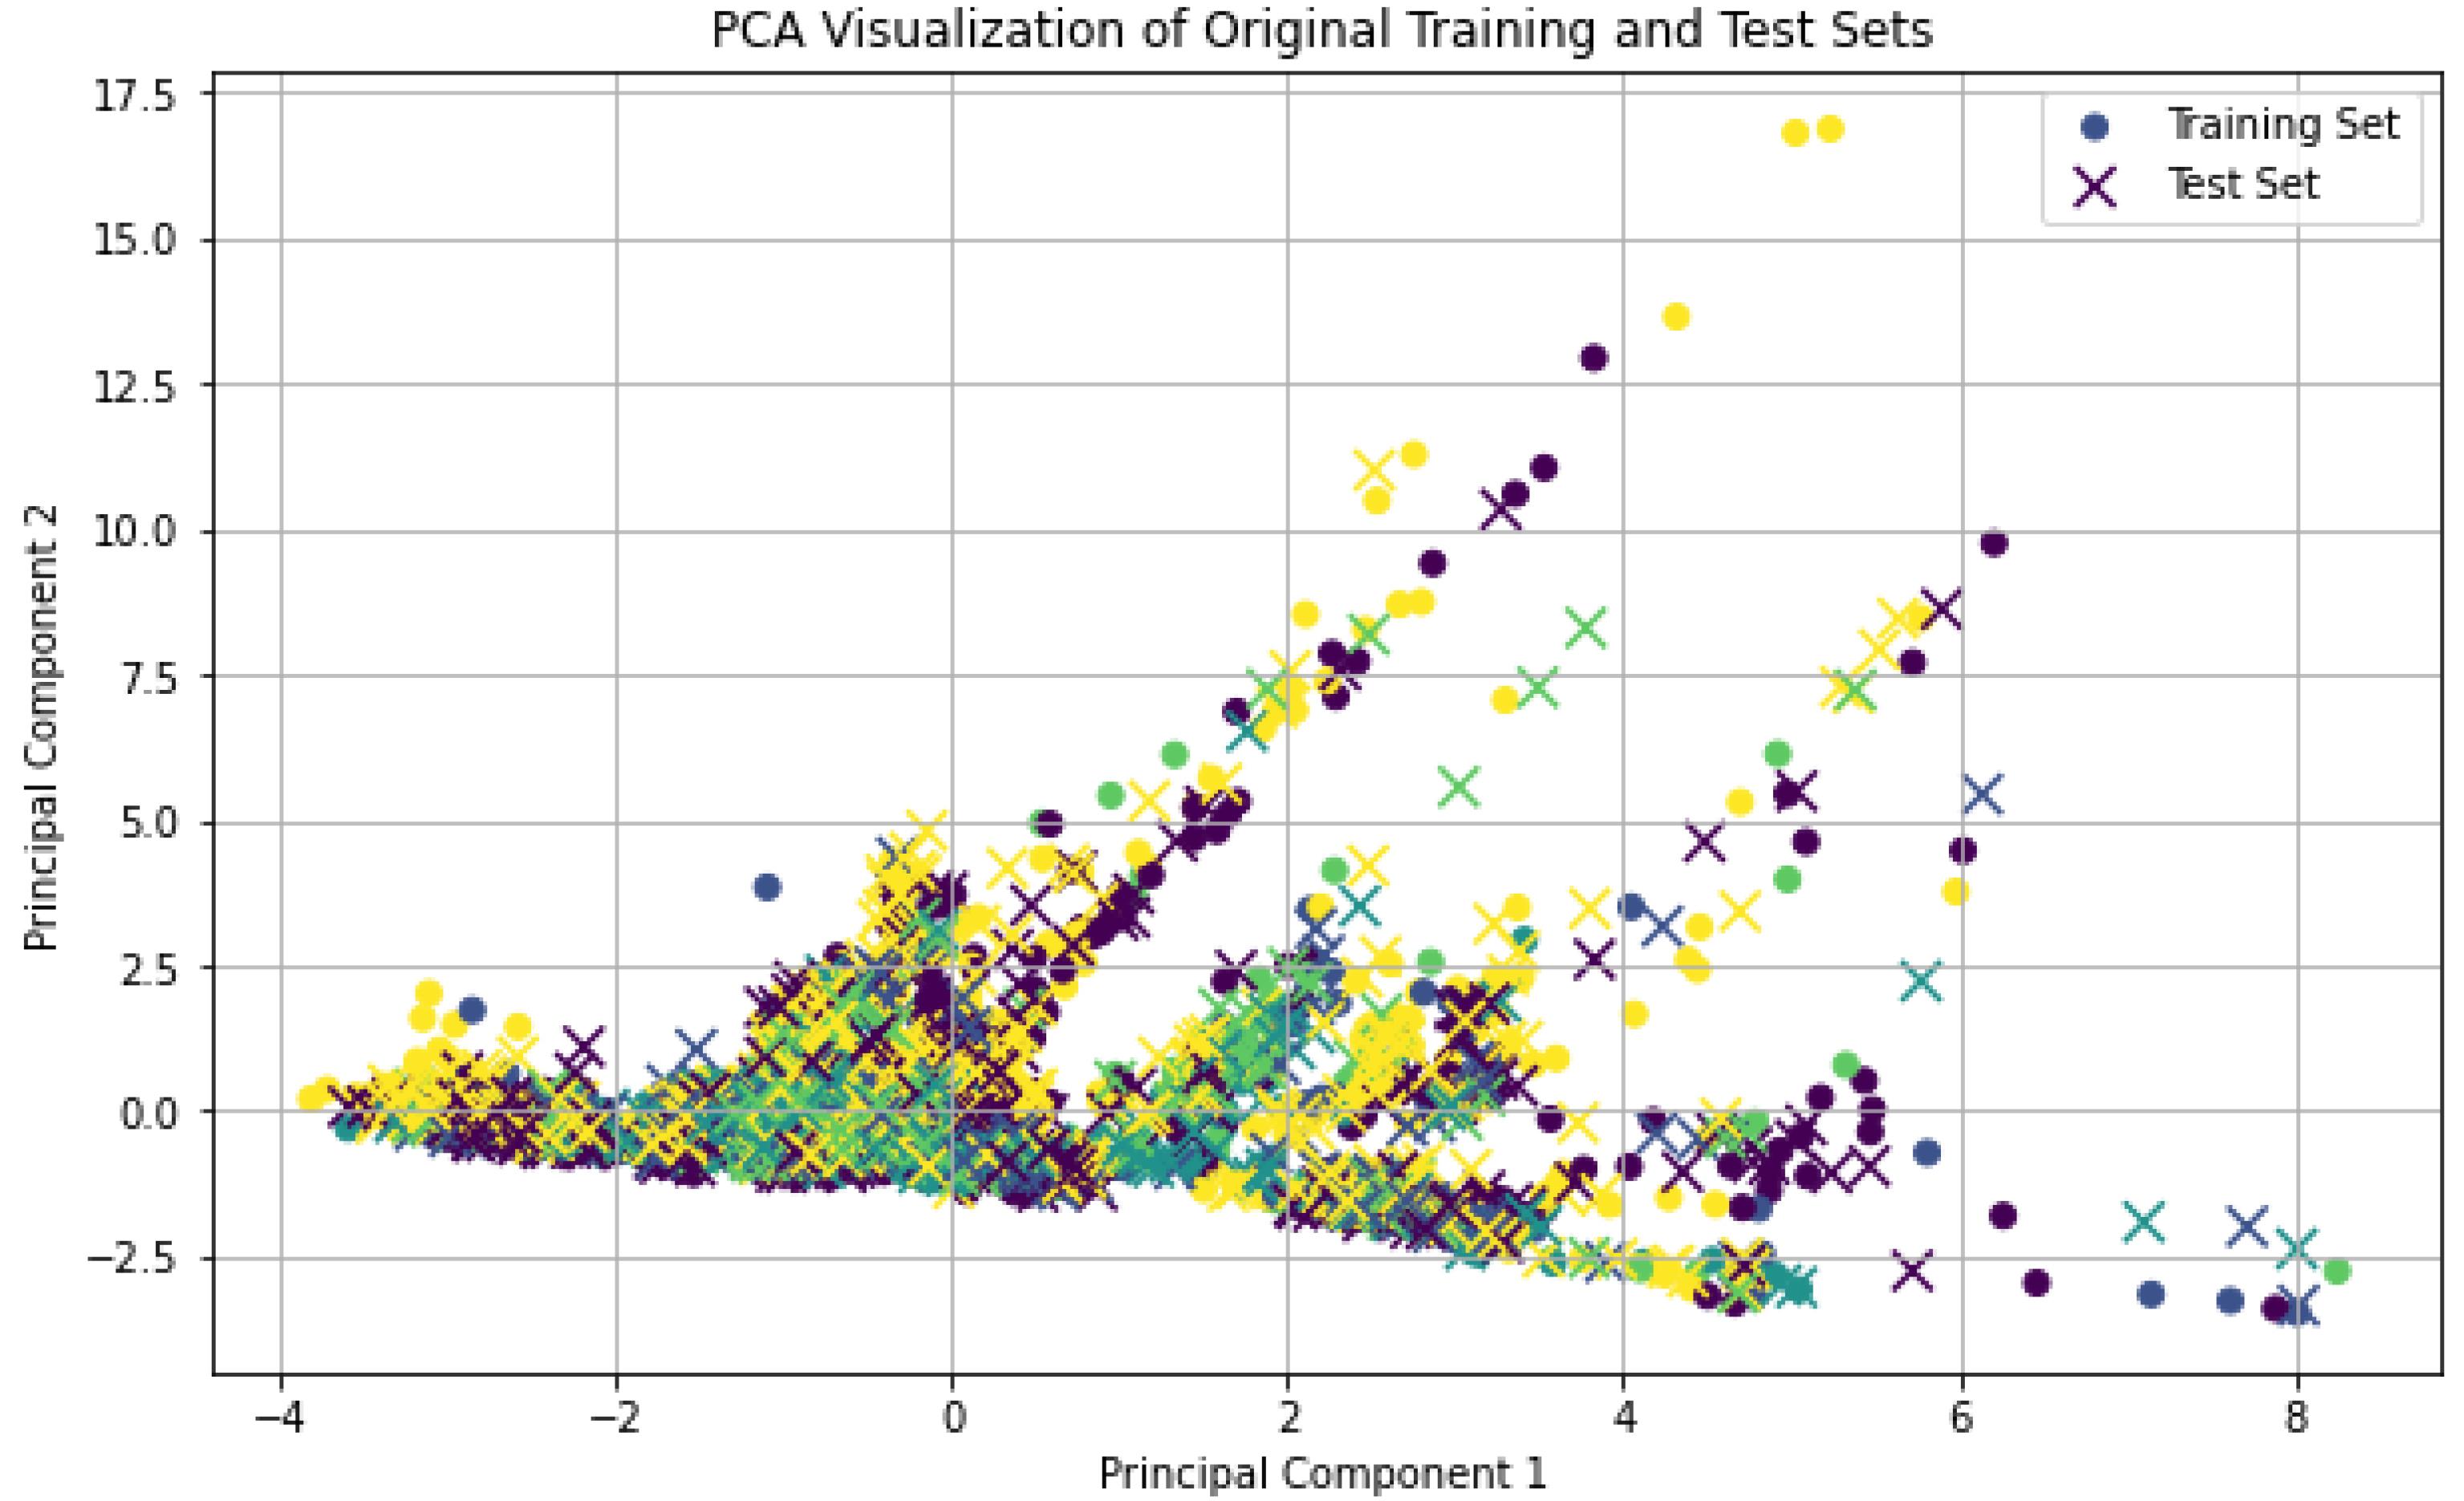
Fig. 6.
The distribution of training and testing data after dimensionality reduction using PCA.
.
The distribution of training and testing data after dimensionality reduction using PCA.
Also, we used 10-fold cross-validation for evaluating the model. This approach involves dividing the dataset into 10 subsets, where each subset serves as a test set while the remaining 9 subsets are used for training. This method helps in assessing the model’s performance more robustly by providing a comprehensive evaluation across different portions of the data.
For evaluating the proposed method, since feature selection is one of its crucial steps, in the initial assessment, various evaluation metrics for different classifiers such as SVM, deep neural network (DNN), random forest (RF), and XGBoost are calculated on the dataset without feature selection. The results obtained are shown in Table 2. As evident, the detection rates of all models were not satisfactory. This is because the presence of high dimensions causes machine learning models to suffer from overfitting issues. This occurs because many extracted features are irrelevant and redundant.
Table 2.
Evaluation of different classifiers into the dataset with and without feature selection
|
Dataset
|
Classifier
|
Without
|
With
|
|
Acc (%)
|
Sp (%)
|
Sn (%)
|
F1-score
|
Acc (%)
|
Sp (%)
|
Sn (%)
|
F1-score
|
| Pneumonia |
SVM |
73 |
68 |
86 |
87 |
97 |
95 |
97 |
97 |
| RF |
91 |
93 |
93 |
93 |
98 |
96 |
98 |
98 |
| XGBoost |
93 |
94 |
92 |
93 |
98 |
97 |
98 |
98 |
| DNN |
87 |
89 |
89 |
89 |
96 |
95 |
97 |
96 |
| Tuberculosis |
SVM |
83 |
85 |
84 |
85 |
97 |
95 |
98 |
96 |
| RF |
89 |
91 |
92 |
92 |
97 |
96 |
98 |
97 |
| XGBoost |
89 |
92 |
91 |
92 |
98 |
96 |
99 |
98 |
| DNN |
84 |
86 |
86 |
86 |
96 |
95 |
97 |
96 |
| Covid 19 |
SVM |
59 |
58 |
61 |
63 |
96 |
95 |
98 |
98 |
| RF |
90 |
93 |
93 |
94 |
97 |
97 |
99 |
99 |
| XGBoost |
94 |
94 |
93 |
93 |
98 |
98 |
99 |
99 |
| DNN |
69 |
82 |
87 |
87 |
96 |
95 |
98 |
98 |
| Lung cancer |
SVM |
66 |
68 |
69 |
69 |
98 |
97 |
98 |
97 |
| RF |
90 |
92 |
91 |
91 |
99 |
98 |
99 |
97 |
| XGBoost |
93 |
94 |
97 |
97 |
99 |
98 |
99 |
98 |
| DNN |
78 |
69 |
88 |
88 |
98 |
97 |
98 |
97 |
| Normal |
SVM |
65 |
64 |
66 |
66 |
97 |
96 |
98 |
98 |
| RF |
91 |
93 |
91 |
91 |
98 |
97 |
99 |
98 |
| XGBoost |
92 |
93 |
95 |
95 |
98 |
99 |
99 |
99 |
| DNN |
72 |
58 |
86 |
86 |
97 |
96 |
98 |
97 |
Given that feature extraction is performed by a transformer network, in order to examine the convergence and proper training of the network, the loss values for the training and evaluation datasets are depicted in Fig. 7 over 100 iterations. As evident, the training process of the network was conducted properly. Therefore, the extracted features were deemed suitable.
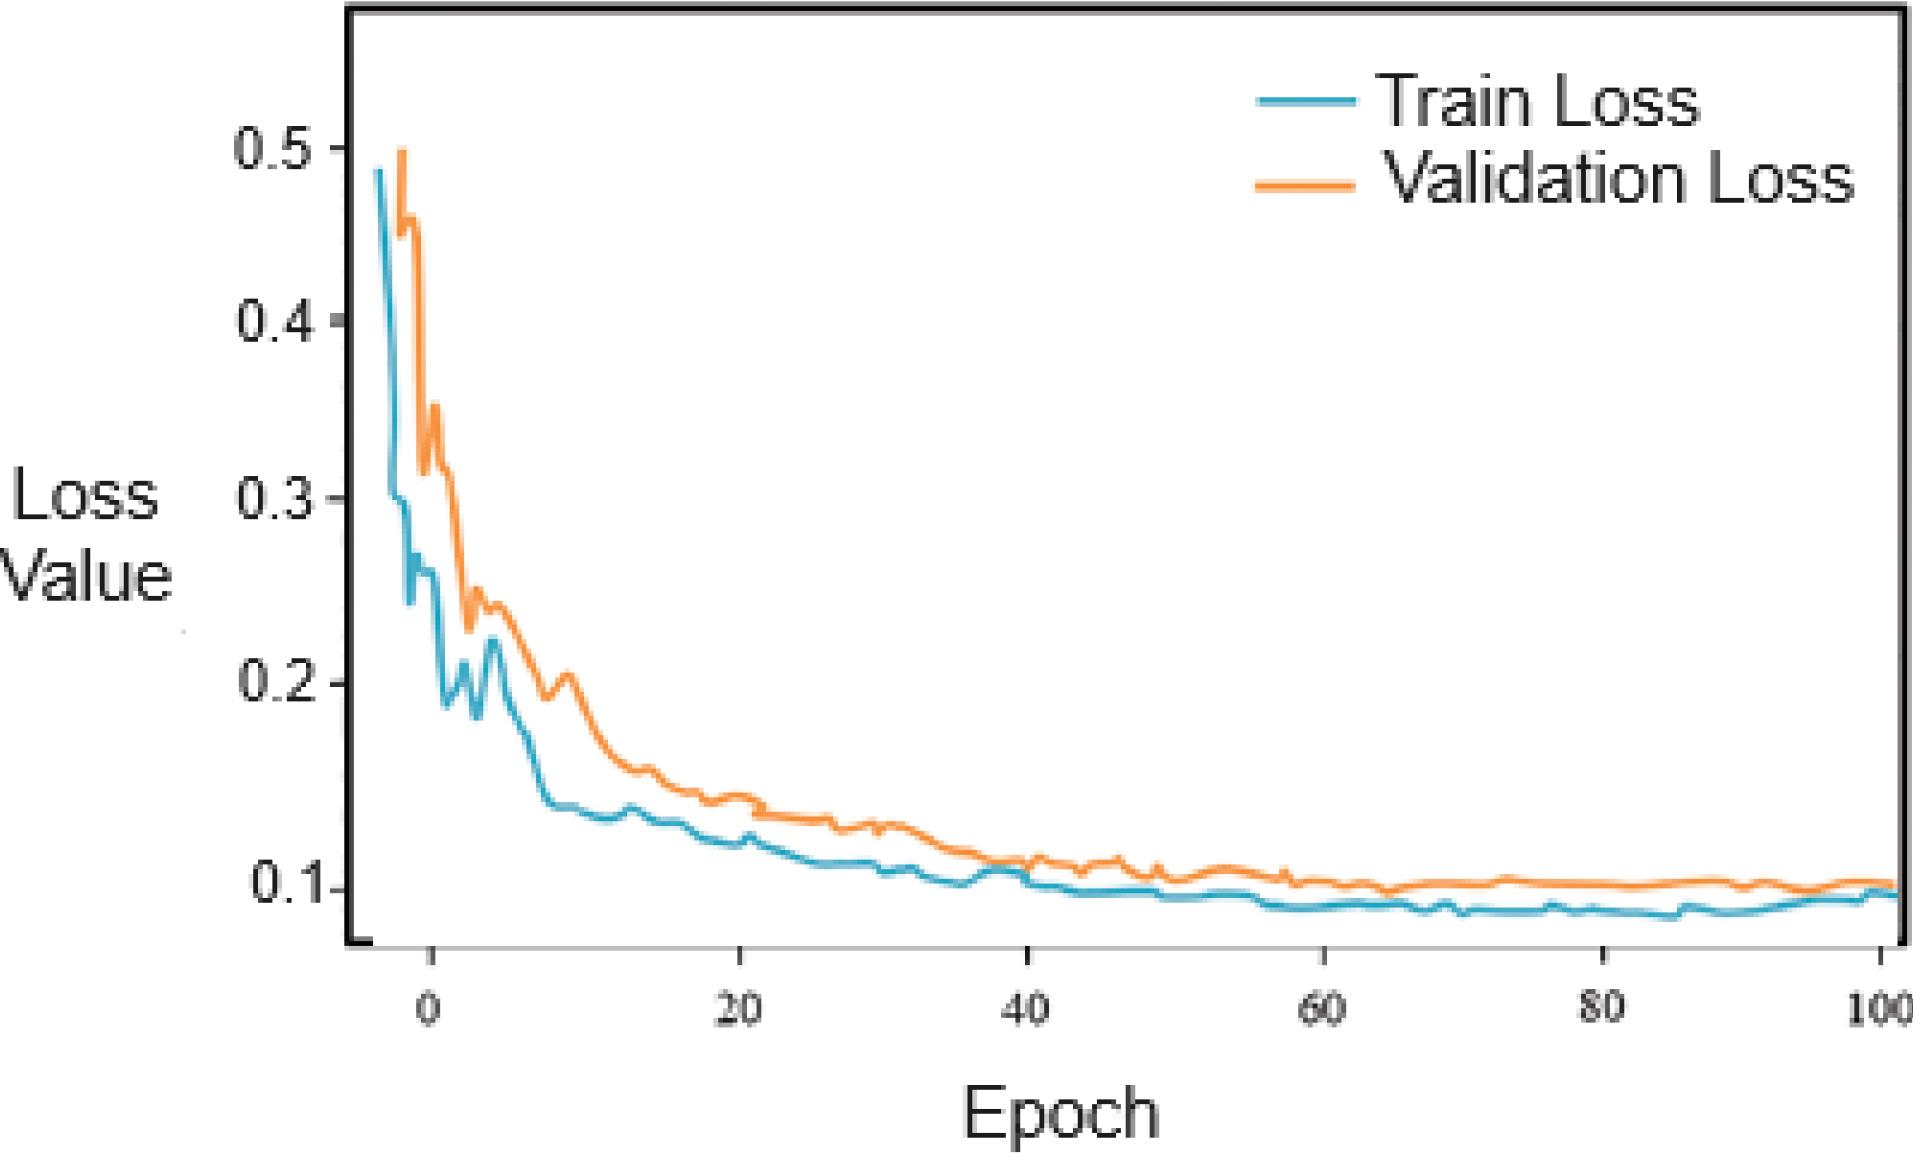
Fig. 7.
The loss plot of the Transformer neural network for the training and validation datasets
.
The loss plot of the Transformer neural network for the training and validation datasets
Due to the presence of redundant features and the high dimensionality of the dataset, which can lead to decreased performance of machine learning models, in this stage, appropriate and important features are selected using Harris Hawk optimization methods. Machine learning models were then trained and tested using these selected features. The results of this experiment are shown in Table 2. As evident, the detection rates and other evaluation metrics have increased for most models. Selecting 20 features has ensured that only relevant and discriminative features are used in training and testing the models, while redundant and irrelevant features are discarded.
Furthermore, for better evaluation of the model in classifying imbalanced data, ROC curves for two classifiers, RF and XGBoost, have been plotted for different classes in Fig. 8. As evident, the proposed model was able to effectively distinguish between different classes. It also demonstrates that the classifiers were not biased towards a particular class.
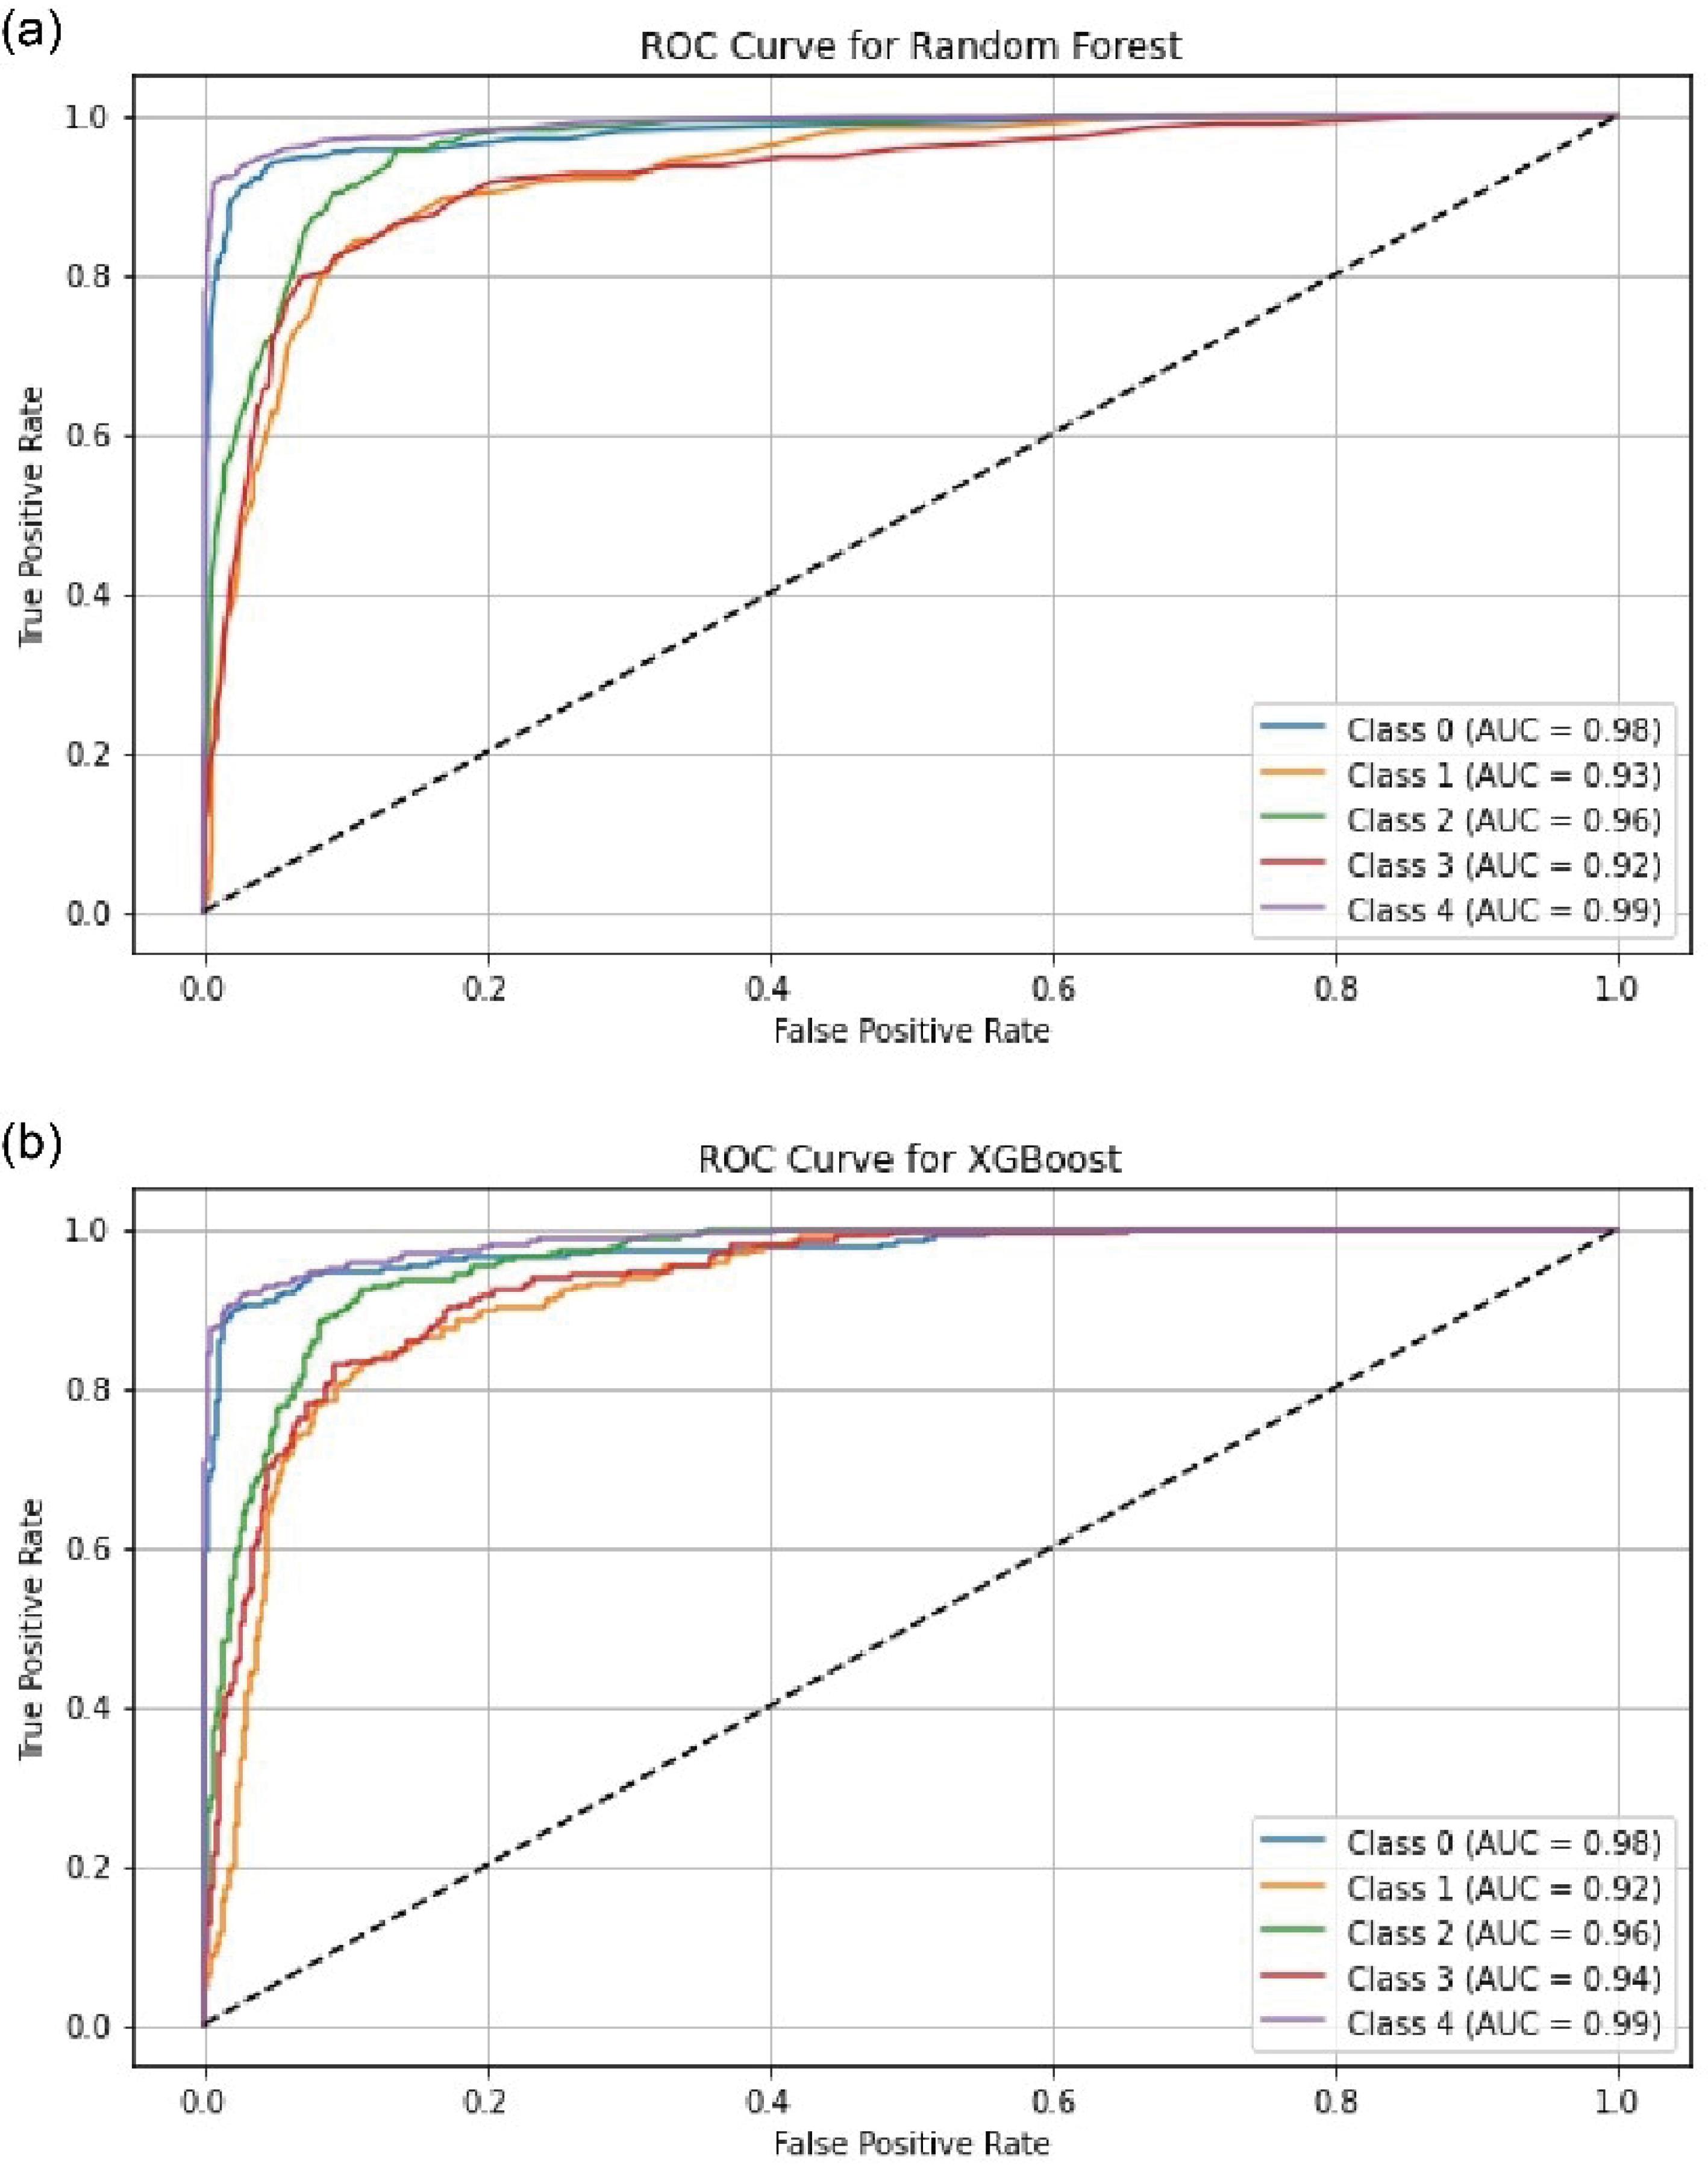
Fig. 8.
ROC curve construction for the Random Forest (a) and XGBoost (b) classifiers.
.
ROC curve construction for the Random Forest (a) and XGBoost (b) classifiers.
To investigate the convergence trend of the proposed method, the maximum and average fitness functions of the hawks are shown over 40 iterations. As evident in Fig. 9, during the algorithm's execution, the average fitness function of the hawks converges towards its final value. Therefore, it can be demonstrated that the selected features are appropriate.
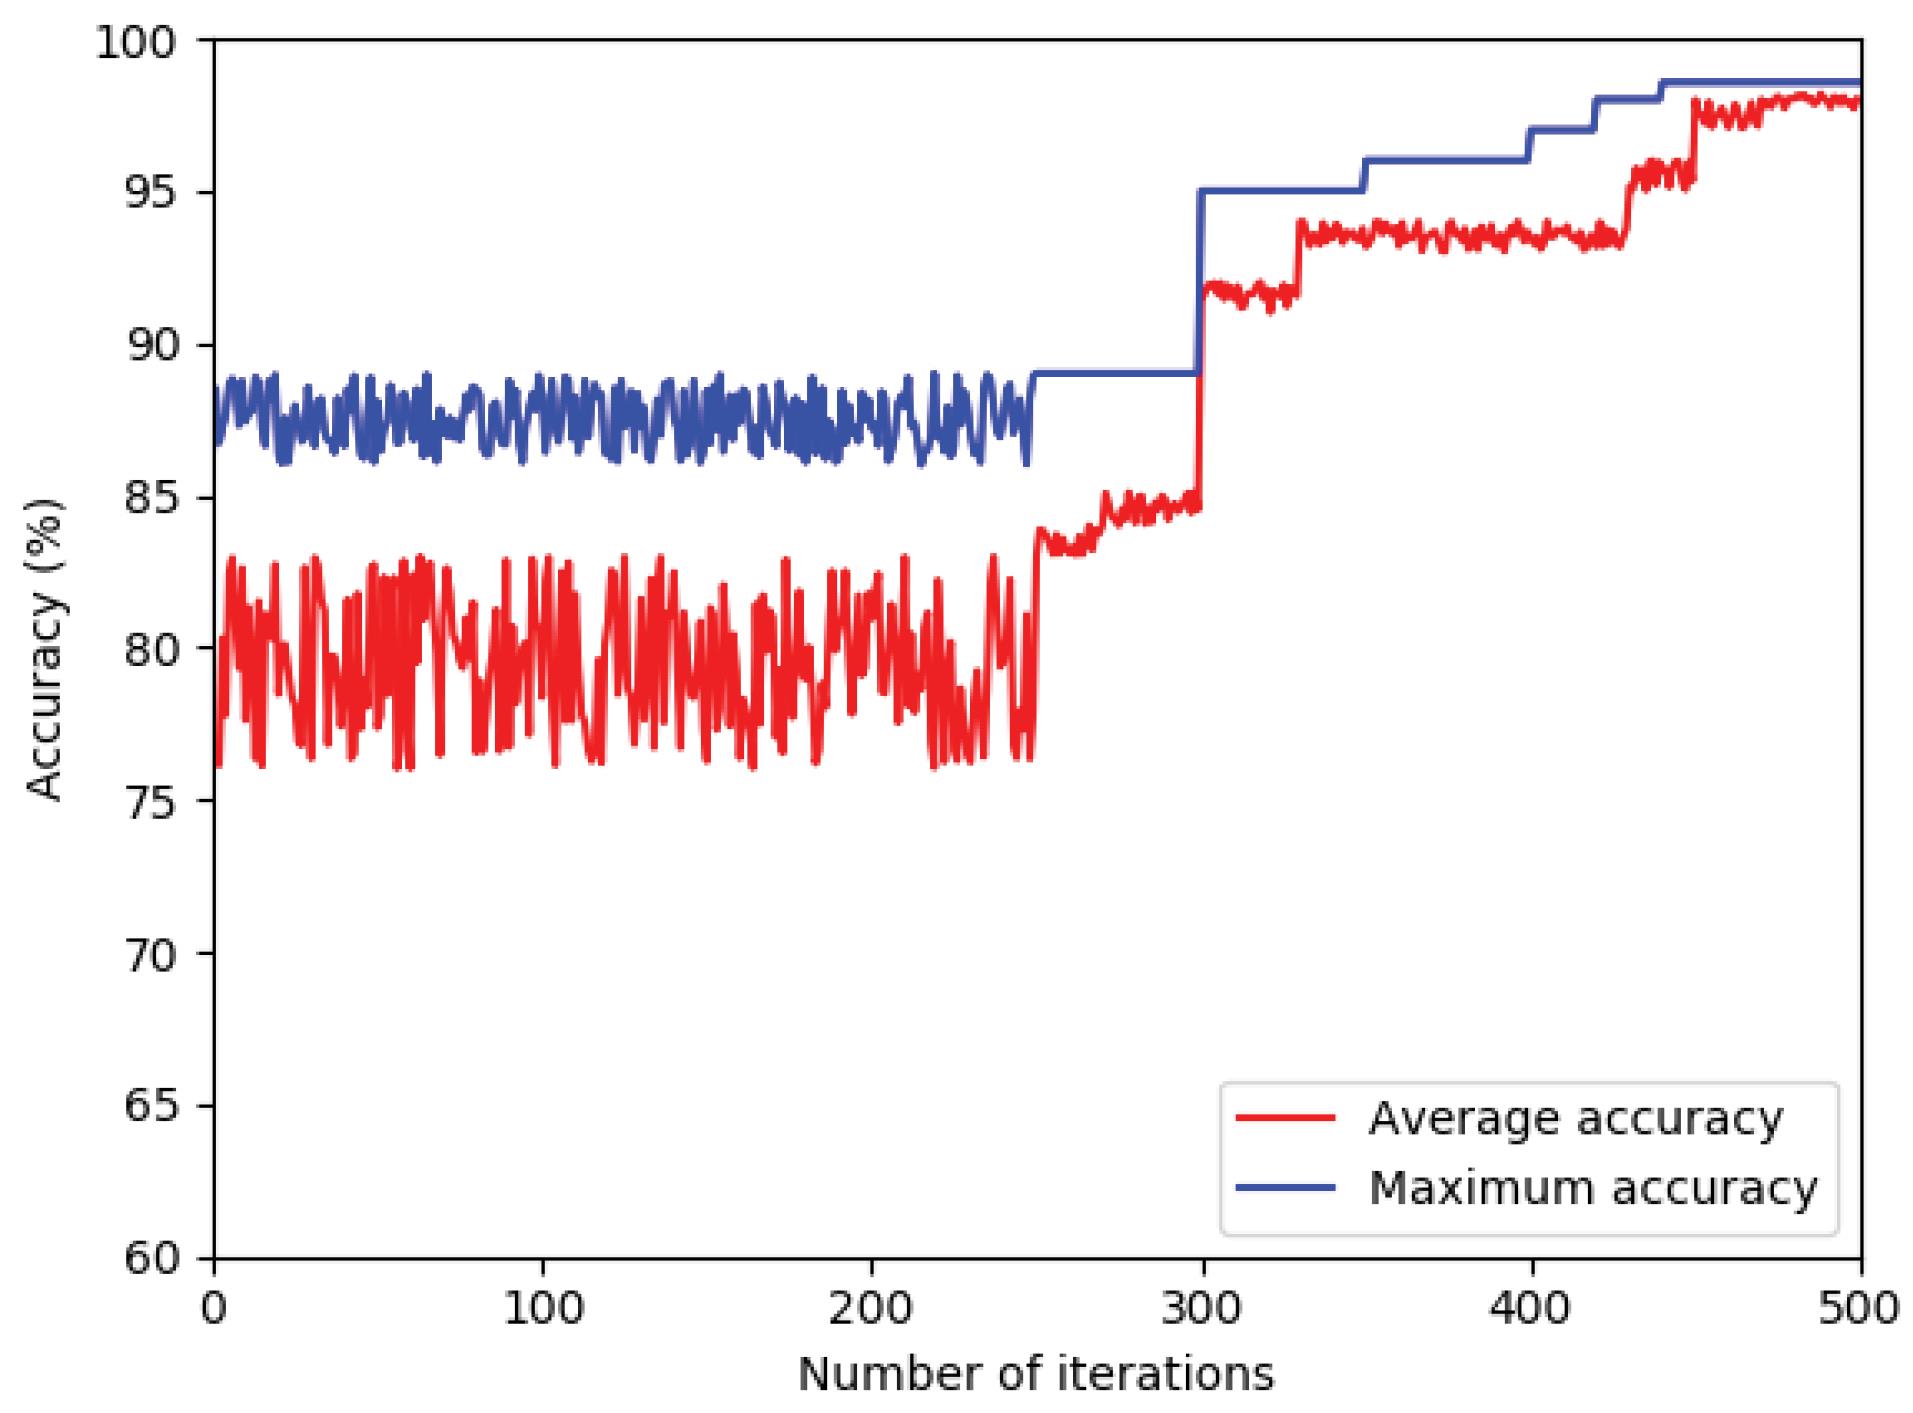
Fig. 9.
The maximum and average fitness functions of the Harris's hawks.
.
The maximum and average fitness functions of the Harris's hawks.
Comparison
In our study, we compared our proposed method with several existing approaches including Deep Learning, DCNN, CNN, AE-CNN, VDSNet, eKNN with ACO, Ensemble Learning, and 3DDCNN. Deep Learning methods and DCNNs are known for their capability to extract complex features from data, but they can be computationally intensive and require extensive training resources. CNNs, while less complex, may not capture long-range dependencies as effectively. AE-CNN integrates autoencoders to improve feature extraction, whereas VDSNet offers probabilistic predictions but with added complexity. eKNN with ACO enhances k-NN through optimization but may struggle with high-dimensional data. Ensemble Learning combines multiple models for improved accuracy but can be computationally demanding. 3DDCNN extends CNNs to three dimensions, useful for volumetric data but requiring significant resources. Our method shows superior performance in specific aspects, particularly in handling imbalanced data and achieving high accuracy across various datasets, offering a more efficient and robust solution for cancer detection.
To evaluate the proposed method and compare its performance with other methods, Table 3 compares the proposed method with other methods based on accuracy metrics. As evident from the results in the table, the proposed method demonstrates better performance compared to other methods. The proposed method exhibits at least 0.03 and up to 25 percent better performance compared to other methods. This is particularly significant given that the dataset used exhibits class imbalance. Additionally, the dataset used in this paper contains 5 classes, whereas other methods may have utilized datasets with only two classes. Therefore, the proposed method, considering the classification of data into more classes and the imbalance in the data, shows superior performance compared to other methods.
Table 3.
Comparison with other methods on the dataset
|
Method
|
Class
|
Accuracy (%)
|
| Deep learning 20 |
2 |
89.5 |
| DCNN 21 |
2 |
93.64 |
| CNN 22 |
2 |
98 |
| AE-CNN 23 |
2 |
80.29 |
| VDSNet 24 |
2 |
73 |
| eKNN with ACO 25 |
2 |
97.5 |
| Ensemble learning 26 |
2 |
98.56 |
| 3DDCNN 27 |
2 |
98.51 |
| Proposed method |
5 |
98.53 |
Conclusion
This article introduces a method for cancer disease detection based on medical IoT data for clinical measurements in predictive care systems, employing a transformer model and the Harris Hawk optimization algorithm. Leveraging transformer architectures, the proposed model can analyze various streams of medical IoT data, including medical images, to extract complex patterns and temporal dependencies inherent in cancer diagnosis, thus improving prediction accuracy and timeliness. Additionally, by utilizing the Harris Hawk optimization algorithm for feature selection, the model enhances its performance by extracting relevant features from medical images. The proposed method was compared with various other approaches based on different evaluation criteria, demonstrating its superiority. However, deploying such a model poses challenges such as data privacy concerns, model interpretability, and integration with existing healthcare infrastructure. Also, our proposed model has several limitations that need to be addressed. One key limitation is its sensitivity to data quality; the model's performance can significantly decline when trained on noisy or low-quality data, which is common in real-world clinical settings. Additionally, the model has primarily been tested on a specific type of cancer and may not generalize well to other types, particularly those with different imaging characteristics or biological behaviors. Variations in imaging modalities, such as differences in MRI or CT scan settings, can also impact the model's effectiveness, requiring further validation across diverse datasets and clinical environments to ensure robustness and generalizability. Future work can address these issues by incorporating more diverse datasets, including those with varied data quality and different types of cancers. Exploring multi-modal imaging data and enhancing the model’s robustness to noisy data can further improve its performance. Additionally, developing methods to adapt the model to different imaging modalities and clinical settings will be crucial for advancing its practical applicability.
Research Highlights
-
This article investigates around cancer disease detection based on medical IoT data for clinical measurements in predictive care systems. Recently, this topic has received much attention.
-
Our proposed model can analyze various streams of medical IoT data. The experimental results demonstrate that the proposed method acceptable performance compared to other methods.
Competing Interests
There is no conflict of interests.
Ethical Statement
Not applicable.
References
- Di Martino F, Delmastro F. Explainable AI for clinical and remote health applications: a survey on tabular and time series data. Artif Intell Rev 2023; 56:5261-315. doi: 10.1007/s10462-022-10304-3 [Crossref] [ Google Scholar]
- Palani D, Venkatalakshmi K. An IoT based predictive modelling for predicting lung cancer using fuzzy cluster-based segmentation and classification. J Med Syst 2018; 43:21. doi: 10.1007/s10916-018-1139-7 [Crossref] [ Google Scholar]
- Hussain Ali Y, Sabu Chooralil V, Balasubramanian K, Manyam RR, Kidambi Raju S, Sadiq AT. Optimization system based on convolutional neural network and internet of medical things for early diagnosis of lung cancer. Bioengineering (Basel) 2023; 10:320. doi: 10.3390/bioengineering10030320 [Crossref] [ Google Scholar]
- Prabakaran J, Selvaraj P. Advance IoT intelligent healthcare system for lung disease classification using ensemble techniques. Comput Syst Sci Eng 2023; 46:2141-57. doi: 10.32604/csse.2023.034210 [Crossref] [ Google Scholar]
- Swaminathan B, Choubey S, Anushkannan NK, Arumugam J, Suriyakrishnaan K, Almoallim HS. IOTEML: an internet of things (IoT)-based enhanced machine learning model for tumour investigation. Comput Intell Neurosci 2022; 2022:1391340. doi: 10.1155/2022/1391340 [Crossref] [ Google Scholar]
- Dash S, Shakyawar SK, Sharma M, Kaushik S. Big data in healthcare: management, analysis and future prospects. J Big Data 2019; 6:54. doi: 10.1186/s40537-019-0217-0 [Crossref] [ Google Scholar]
- Siddiqui SA, Ahmad A, Fatima N. IoT-based disease prediction using machine learning. Comput Electr Eng 2023; 108:108675. doi: 10.1016/j.compeleceng.2023.108675 [Crossref] [ Google Scholar]
- Maray M, Alghamdi M, Alazzam MB. Diagnosing cancer using IoT and machine learning methods. Comput Intell Neurosci 2022; 2022:9896490. doi: 10.1155/2022/9896490 [Crossref] [ Google Scholar]
- Singh N, Sasirekha SP, Dhakne A, Thrinath BVS, Ramya D, Thiagarajan R. IoT enabled hybrid model with learning ability for E-health care systems. Measur Sens 2022; 24:100567. doi: 10.1016/j.measen.2022.100567 [Crossref] [ Google Scholar]
- Jagadeeswari V, Subramaniyaswamy V, Logesh R, Vijayakumar V. A study on medical internet of things and big data in personalized healthcare system. Health Inf Sci Syst 2018; 6:14. doi: 10.1007/s13755-018-0049-x [Crossref] [ Google Scholar]
- Zhou B, Yang G, Shi Z, Ma S. Natural language processing for smart healthcare. IEEE Rev Biomed Eng 2024; 17:4-18. doi: 10.1109/rbme.2022.3210270 [Crossref] [ Google Scholar]
- Ponzio F, Macii E, Ficarra E, Di Cataldo S. Colorectal cancer classification using deep convolutional networks - an experimental study. In: 5th International Conference on Bioimaging; 2018. 10.5220/0006643100580066.
- Raj RJ, Shobana SJ, Pustokhina IV, Pustokhin DA, Gupta D, Shankar K. Optimal feature selection-based medical image classification using deep learning model in internet of medical things. IEEE Access 2020; 8:58006-17. doi: 10.1109/access.2020.2981337 [Crossref] [ Google Scholar]
- Ashraf R, Habib MA, Akram M, Latif MA, Malik MS, Awais M. Deep convolution neural network for big data medical image classification. IEEE Access 2020; 8:105659-70. doi: 10.1109/access.2020.2998808 [Crossref] [ Google Scholar]
- Ribeiro E, Uhl A, Wimmer G, Häfner M. Exploring deep learning and transfer learning for colonic polyp classification. Comput Math Methods Med 2016; 2016:6584725. doi: 10.1155/2016/6584725 [Crossref] [ Google Scholar]
- Faruqui N, Yousuf MA, Whaiduzzaman M, Azad AK, Barros A, Moni MA. LungNet: a hybrid deep-CNN model for lung cancer diagnosis using CT and wearable sensor-based medical IoT data. Comput Biol Med 2021; 139:104961. doi: 10.1016/j.compbiomed.2021.104961 [Crossref] [ Google Scholar]
- Ahmad PN, Liu Y, Khan K, Jiang T, Burhan U. BIR: biomedical information retrieval system for cancer treatment in electronic health record using transformers. Sensors (Basel) 2023; 23:9355. doi: 10.3390/s23239355 [Crossref] [ Google Scholar]
- Siddiqui SY, Haider A, Ghazal TM, Khan MA, Naseer I, Abbas S. IoMT cloud-based intelligent prediction of breast cancer stages empowered with deep learning. IEEE Access 2021; 9:146478-91. doi: 10.1109/access.2021.3123472 [Crossref] [ Google Scholar]
- Jacenków G, O’Neil AQ, Tsaftaris SA. Indication as prior knowledge for multimodal disease classification in chest radiographs with transformers. ArXiv [Preprint]. February 12, 2022. Available from: https://arxiv.org/abs/2202.06076.
- Wang S, Kang B, Ma J, Zeng X, Xiao M, Guo J. A deep learning algorithm using CT images to screen for corona virus disease (COVID-19). Eur Radiol 2021; 31:6096-104. doi: 10.1007/s00330-021-07715-1 [Crossref] [ Google Scholar]
- Zhang YD, Satapathy SC, Liu S, Li GR. A five-layer deep convolutional neural network with stochastic pooling for chest CT-based COVID-19 diagnosis. Mach Vis Appl 2021; 32:14. doi: 10.1007/s00138-020-01128-8 [Crossref] [ Google Scholar]
- Maghdid HS, Asaad AT, Ghafoor KZ, Sadiq AS, Mirjalili S, Khan MK. Diagnosing COVID-19 pneumonia from X-ray and CT images using deep learning and transfer learning algorithms. In: Multimodal Image Exploitation and Learning. Vol 11734. SPIE; 2021. p. 99-110. 10.1117/12.2588672.
- Li L, Huang H, Jin X. AE-CNN classification of pulmonary tuberculosis based on CT images. In: 2018 9th International Conference on Information Technology in Medicine and Education (ITME). Hangzhou, China: IEEE; 2018. p. 39-42. 10.1109/itme.2018.00020.
- Bharati S, Podder P, Mondal MR. Hybrid deep learning for detecting lung diseases from X-ray images. Inform Med Unlocked 2020; 20:100391. doi: 10.1016/j.imu.2020.100391 [Crossref] [ Google Scholar]
- Mukherjee R, Kundu A, Mukherjee I, Gupta D, Tiwari P, Khanna A. IoT-cloud based healthcare model for COVID-19 detection: an enhanced k-nearest neighbor classifier-based approach. Computing 2023; 105:849-69. doi: 10.1007/s00607-021-00951-9 [Crossref] [ Google Scholar]
- Zhou T, Lu H, Yang Z, Qiu S, Huo B, Dong Y. The ensemble deep learning model for novel COVID-19 on CT images. Appl Soft Comput 2021; 98:106885. doi: 10.1016/j.asoc.2020.106885 [Crossref] [ Google Scholar]
- Masood A, Yang P, Sheng B, Li H, Li P, Qin J. Cloud-based automated clinical decision support system for detection and diagnosis of lung cancer in chest CT. IEEE J Transl Eng Health Med 2020; 8:4300113. doi: 10.1109/jtehm.2019.2955458 [Crossref] [ Google Scholar]