Bioimpacts. 9(2):71-78.
doi: 10.15171/bi.2019.10
Original Research
SPR signals enhancement by gold nanorods for cell surface marker detection
Farzaneh Fathi 1, 2, *  , Roghayeh Jalili 3, Mohammad Amjadi 3, Mohammad-Reza Rashidi 1, 4, *
Author information:
1Research Center for Pharmaceutical Nanotechnology, Tabriz University of Medical Sciences, Tabriz, Iran
2Student Research Committee, Tabriz University of Medical Sciences, Tabriz, Iran
3Department of Analytical Chemistry, Faculty of Chemistry, University of Tabriz, Tabriz, Iran
4Faculty of Pharmacy, Tabriz University of Medical Sciences, Tabriz, Iran
Abstract
Introduction:
The detection of micrometer-sized particles like cells is limited by surface plasmon resonance (SPR) biosensors because of having a depth of evanescent wave <500 nm. In this study, for the first time, we exhibited the use of streptavidin-functionalized gold nanorods (GNRs) as intensification labels for detection of cell surface markers in SPR-based biosensors.
Methods:
The GNRs (ʎ max: 735 nm) were modified with streptavidin using EDC/NHS coupling method and human umbilical vein endothelial cells (HUVECs) were selected as the cell model for detecting VE-cadherin on cell surface using real-time SPR device in the 785 nm wavelength of the laser source.
Results:
The investigations revealed that the plasmonic field extension produced from the gold layer and GNRs resulted in multiple enhancement of SPR signals when the wavelength of laser source in SPR instrument was matched with the wavelength of maximum absorbance in GNRs. Moreover, the results showed that the growth of ∆RU value in specific and non-specific bindings for various cell number injections were produced with increasing the cell number.
Conclusion:
The results displayed that cell detection can be performed in real- time form without any need to a time-consuming process used in conventional methods like immunocytochemistry, flow cytometry, and western blotting.
Keywords: Enhanced-surface plasmon resonance, Cell detection, VE-cadherin, Gold nanorods
Copyright and License Information
© 2019 The Author(s)
This work is published by BioImpacts as an open access article distributed under the terms of the Creative Commons Attribution License (
http://creativecommons.org/licenses/by-nc/4.0/). Non-commercial uses of the work are permitted, provided the original work is properly cited.
Introduction
Gold nanomaterials display localized surface plasmon resonances (LSPRs) at visible (400-700 nm) and near-infrared (700-1000 nm) wavelengths due to having resonant oscillations of surface electrons.
1
Having visible plasmon absorption of gold nanomaterials causes their attractive and suitable applications in enhanced surface plasmon resonance (SPR) biosensors and optical sensing.
2,3
Spherical gold nanoparticles (GNPs), gold nanorods (GNRs), and gold nanostars are the kinds of gold nanomaterials with the size ranging from 10 to 100 nm.
4
The most important applications of gold nanoparticles are related to cell imaging as contrast agents, ultra-sensitive biosensing, bioassays, and photothermal therapy.
5-8
Not only the synthesis of GNPs in various shapes, dimensions, and sizes is possible, but also they have a high surface-to-volume ratio for immobilizing large range of biomolecules like antibodies without changing their activities that lead to being an appropriate option for the development of biosensors based on GNPs for enhanced and sensitive detection.
9-12
The SPR enhancement of metal nanoparticles depends on their forms and dimensions especially in GNPs with different optical properties. For example, the rod and spherical forms of gold nanoparticles have different optical properties and also various signal intensities in enhancing the SPR measurements.
13,14
Nikoobakht and El-Sayed, for the first time, displayed a method used for synthesizing different aspect ratios (ARs) of GNRs with the maximum SPR absorption between 600 and 1300 nm.
15
One of the latest biological techniques for enhancement focused on using high molecular-weight and refractive index samples in sandwich analyses.
16
Nanoparticle tags as secondary proteins and intensifying labels cause the enhancement of sensing performance at the surface of gold bound molecules (e.g. antibody, aptamer, and DNA) during biorecognition events.
17,18
The coupling between the GNPs and secondary molecules attached with the thin gold surface leads to the amplification of refractive index changes, as well as increasing the shift in the SPR curve.
17
Nanostructures, like gold and magnetic nanoparticles, were used more than other nanoparticles in enhancing SPR responses.
19
Biocompatible gold nanoparticles, as unique probes in bio-systems, have attracted a lot of attention because of having diverse dimensions, forms (spherical, rod, stars and cages), and different optical properties for more than a decade.
20,21
This signal amplification and SPR detection method integrates the advantages of nanotechnology and biomedical analyses and provides a sensitive tool for sensing various fragments from small molecules like nucleoside, enzyme, hormone, peptide to medium particles like DNA, proteins and bacteria.
22,23
Gold nanoparticles have not been used for enhancing the SPR-signals-based cell detection up to now. The most usual applications of SPR method was devoted to biomolecular assays like the investigation of kinetic and thermodynamic parameters of antigen-antibody and drug-albumin interactions in clinical studies.
24-26
But a very limited number of researches have been allocated to the improvement of biosensors for cell detection by SPR technique.
27-29
Since SPR have the depth of evanescent wave about 300–500 nm, the use of this method is restricted to the studies on micrometer-sized elements, like cells.
30
Hence, intensifying SPR response for sensitive detection in micrometer size particles is essential. Herein, for the first time, a novel and sensitive SPR biosensor was developed based on the response amplification to cell detection. Human umbilical vein endothelial cell (HUVEC) line was selected as a cell model for detecting VE-cadherin on the cell surface. After specific antibody immobilization on the gold sensor surface and capturing the related cells on it, streptavidin-functionalized gold nanorods (GNR- strep) intensified SPR signals by binding to the biotinylated antibody of the cell surface. Furthermore, by an appropriate selection of laser wavelength in SPR device, an effective amplification was provided for the use of GNRs in cell detection in this study.
Materials and Methods
Materials
Chloroauric acid (HAuCl4) was purchased from Alfa Aesar (Karlsruhe, Germany; http://www.alfa.com). AgNO3 was obtained from Merck (Darmstadt, Germany; http://www.merck-chemicals.com) and used without further purification. Hexadecyl (cetyl) trimethylammonium bromide (CTAB) was from Fluka (Taufkrichen, Germany; http://www.sigmaaldrich.com). Mouse anti-human VE-cadherin (CD144) (Cat no: MAB938), and Alexa Fluor®488-conjugated mouse anti-human VE-Cadherin (Cat no: 53-1449-41) antibodies were prepared from R & D system. Pure gold chip was obtained from Bionavis
Company (Finland). Bovine serum albumin (BSA), streptavidin, 11-mercaptoundecanoic acid (11- MUA), ethanolamine-HCl, sodium hydroxide (NaOH), N-hydroxysuccinimide (NHS), and N-ethyl- N-(3- diethylaminopropyl) carbodiimide (EDC) were purchased from Sigma–Aldrich. All other chemicals were obtained from Sigma-Aldrich (Steinheim, Germany), were of analytical-reagent grade, and were applied without any refinement.
Instrumentation
SPR measurements were done using an SRPNavi 210A device (BioNavis Ltd., Tampere, Finland) that uses the Kretschmann prism configuration having a goniometer with twin flow tubes and cohesive peristaltic pump with 6-sample lines. All tests were completed in angular scan style in order to obtain the SPR angular site variations in a real-time mode. A flow rate of 15 μL/min was used throughout the tests with a device temperature fixed at 35°C. All gold slides were prepared from 240 mm2 BK7-glass with a layer of a 50 nm gold metal and 5 nm Titanium adhesion layer. The cell analysis was done in the fixed angle measurement at 670 nm wavelength at 35°C. Before the SPR tests, the whole flow track was cleaned and filled with definite running buffer in any step. The morphology of the GNRs and Stre-GNRs was measured with a transmission electron microscope (TEM) (LEO 906, Zeiss, German, 100 kv). The zeta potential and particle size analyses were performed using DLS, Nanosize 3500, Malvern, Germany. Uv-vis absorption spectra (Uv-vis) were recorded with Cytation™ 5 system (BioTek). All stability tests were done on freshly dispersed GNR solutions.
Preparation of GNRs
GNRs were prepared via a seed-mediated growth approach proposed by Nikoobakht and El-Sayed.
15
Briefly, a seed sphere solution was generated by adding 0.60 mL of ice-cold NaBH4 (0.038% w/v, 0.01 M) to a solution of 5.0 mL of HAuCl4 (0.2 % w/v, 0. 5 mM) and 5.0 mL CTAB solution (7.3% w/v, 0.2 M) and stirred vigorously for 2 minutes. This light-brown seed solution was kept at room temperature before any further use. For the growth stage, 5 mL of 1 mM (0.4% w/v) HAuCl4 and 5 mL of 0.2 M (7.3% w/v) CTAB were mixed followed by the addition of 150 μL of 4 mM (0.068% w/v) AgNO3 solution and mixed very gently. Then, to this solution, 70 μL of 78.8 mM (1.4% w/v) ascorbic acid was added, which changed the growth solution from dark yellow to colorless. Finally, 12 μL of seed solution was added to the growth solution. The reaction mixture was shaken gently and kept undisturbed for 2 hours at 27-30°C. The color of the solution gradually changed to intense purple–brown within 10-20 minutes. In order to eliminate additional CTAB and uncreated gold ions, samples were cleaned with two rounds of centrifugation (15 000 rpm, 6 minutes).
Preparation of streptavidin-conjugated GNR
Streptavidin conjugation to GNRs was carried out as reported by Yu & Irudayaraj and Politi et al.
31,32
In brief, 100 µL of 20 mM MUA solution was dissolved in ethanol and added to 2 mL of 1 nM GNR solution and kept under sonication for24 hours at room temperature. Then the GNR was collected by centrifugation at 20◦C at 1200 rpm for 20 minutes and the rod pellet resuspended in 1 mL of Millipore water. To immobilize the streptavidin on the GNR, MUA-GNR was immersed in a mixture of 0.4 M EDC and 0.1 M of NHS for 50 minutes to form an amine-reactive NHSS ester terminated rod surface. Then, 100 µL of 1 mg/mL streptavidin in PBS solution was dripped to GNR solution and mildly shaken for 60 minutes and kept for 20 hours at 4°C to allow covalent immobilization of streptavidin on activated GNR surface. Finally, the unbound proteins were removed by centrifugation at 10000 rpm at 20°C.
Modification of gold sensor surface with VE-cadherin antibody
First, the bare gold chips were immersed in the 50 mL hot solution of 30% ammonia (NH4OH), 30% hydrogen peroxide (H2O2), and purified water at the ratio of 1.5:1.5:5 for 10 minutes at 100°C. After washing with distilled water and pure ethanol for 3 times and drying under a stream of N2 gas, the sensors were inundated in the mixture of 2 mM MUA in ethanol solution and distilled water at the ratio of 7:3 at 25°C for 24 hours for formation of the self-assembled monolayer (SAM). Lastly, the covalent bonding formation of specific antibody on the MUA surface was completed by amine coupling technique. To reach this objective, the modified MUA-Au slides were submerged in 0.05 M NHS +0.2 M EDC for 1 hour. Then, they were cleaned 3 times with PBS and covered with 25 µg/mL VE-cadherin antibody in acetate buffer (pH=5) for 1 hour again. After washing with PBS, the deactivation was done using 1.0 M ethanolamine-HCl pH 7.5 for 15 minutes. Finally, 0.5% BSA was used for 30 minutes to block free sites on the gold surface.
Cell culture
HUVECs (NCBI code: C554) were used as cell samples from the National Cell Bank of Iran. The cell medium, high glucose-Dulbecco's modified Eagle's (DMEM/HG, Gibco), was applied for culturing the HUVECs. All media were enriched with 10% fetal bovine serum (FBS, Gibco) and 1% penicillin-streptomycin (Biosera). The cells were incubated at 37°C in the humidified atmosphere with 5% CO2. Cells were separated by 0.25% Trypsin-EDTA (Gibco) solution when they reached 75%–80% confluency.
Cytotoxicity assay of GNRs
Cytotoxicity of GNRs was investigated in HUVEC cell line by 3-4, 5-dimethylthiazol-2-yl
-2, 5-diphenyltetrazolium bromide (MTT) assay. HUVECs were seeded in a 96-well cell culture plate and cell amount was set to 1 × 10⁴ cells∕mL. After incubation for 24 hours, the 85%
confluent cells were added with different amounts (1, 2, 4, 8, 10 µL) to 1 nM GNR solution with DMEM/HG. Cells with GNRs were further incubated for 2 and 24 hours in a CO2 incubator. After incubation, the culture medium with GNRs was replaced with serum-free medium containing 1 mg ∕mL MTT and incubated for 4 hours. After adding DMSO on the cell surface in a well plate, its absorbance was observed at 630 nm by the ELISA microplate reader. The untreated HUVECs were applied as positive control (i.e., 100% viable).
Results and Discussion
Characterization of GNRs and modification
The detection of micrometer-sized particles was incomplete due to having the depth of evanescent wave <500 nm in SPR analyses.
33,34
So, we tried to develop a way for intensification of SPR signals in these cases. In the present work, antibody modified sensing film, along with capturing related specific cells and binding GNRs-strep on gold sensor surface, was functioned as a plasmonic coupling partner by integrating both the nanomaterial and immunoassay sensing technologies.
The GNRs for this study were synthesized by seed mediation, and their stability assessment was investigated through UV-VIS, zeta-potential, TEM and dynamic light scattering (DLS) analyses. In the well-known spectrum of the GNRs, they exhibited 2 separate SPR peaks. The first was related to transversal style in visible region, and the second one was the longitudinal peak in the near-infrared part of the spectrum. These resonance peaks related to the transversal and longitudinal peaks of plasmonic excitations that correlated to electron motion perpendicular and electron oscillations, respectively. With increasing the AR of GNRs, the wavelength of longitudinal plasmon absorbance enlarged compared to the transverse plasmon peak.
35
GNPs, compared with GNRs, display an absorption peak only in the visible region between 510 and 590 nm with relation to the dimension of particles. Fig. 1A displays the UV absorption spectra of the GNRs produced by the seed-mediated way. UV-Vis absorption spectra of GNRs have one transversal plasmon resonance peak at ∼515 nm and a longitudinal resonance peak at 735 nm. In addition, the dimensions of GNRs can be reformed by affecting the seed concentration via changing the seed-mediated growth technique defined by Babak Nikoobakht and El-Sayed.
15
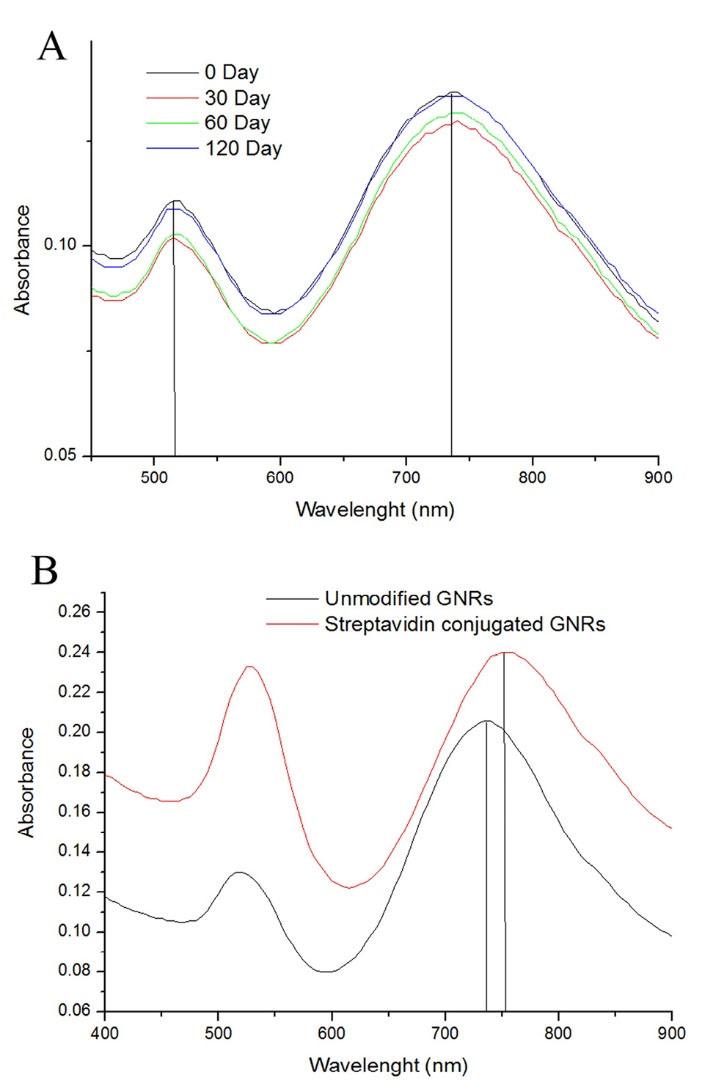
Fig. 1.
Characterization of GNRs. (A) Absorption spectra of gold nanorods with aspect ratios of 3.7 within 4 months (B) Absorption spectra of GNRs (black curve) and streptavidin conjugated GNRs (red curve).
.
Characterization of GNRs. (A) Absorption spectra of gold nanorods with aspect ratios of 3.7 within 4 months (B) Absorption spectra of GNRs (black curve) and streptavidin conjugated GNRs (red curve).
Fig. 1B shows the absorption spectrum of GNRs after modification with streptavidin. In modification steps after immobilizing thiolated molecules (MUA) at the surface of the GNRs, biomolecules like streptavidin or antibodies can be covalently immobilized via the NH2 bond of the proteins to the COOH groups of the MUA layer. Further shifting of the absorbing wavelength introduces a red-shift (a change in absorbance to a longer wavelength) due to change in dielectric properties and immobilizing protein molecules at the surface of the GNRs. Therefore, we could confirm that modification was certainly immobilized on GNRs. Fig. 1B shows a significant shift (up to 22 nm) compared to the bare rods after the streptavidin attachment. Not only streptavidin can form covalent bonding on COOH activated group, but also it is able to attach to the CTAB coated side sites by electrostatic interaction. They will attach to the CTAB cap with a positive charge via physical adsorption due to the negative charge of streptavidin under the physiological pH during the modification reaction. However, these absorptions are not forceful, like covalently bound ones on GNRs surfaces.
Moreover, the structural and morphological properties of the separated GNRs were characterized by TEM images and DLS analyses. DLS determines the agglomerate size and the particle size distribution using a light beam like a laser in a solution and shifts the wavelength of the arriving light which it is related to the particle size.
36
DLS data (Fig. 2A) of GNRs showed a major particle size distribution peak as a hydrodynamic diameter at 45.31 nm ± 2.3 and a minor particle size peak around 2 nm ± 1.2. The obtained data confirmed the work of Liu et al. for DLS studies of GNRs where they proved that in more AR, the small size peak increases. Moreover, the successful conjugation of GNR to streptavidin was confirmed by DLS measurement (Fig. S1). After conjugation with streptavidin, the hydrodynamic dimension of GNR increased from 45.31 to 50 nm. Zeta potential results determined that all the particles of CTAB-coated GNRs were a positive surface charge with a magnitude near to 58.9 mV ± 1.5 which indicates the excellent stability of colloidal GNRs dispersion (Fig. 2B). The amount of the zeta potential shows the electrostatic repulsion among charged atoms in a dispersion. For particles and elements that are minor enough, a high zeta potential will describe stability, it means, the solution or dispersion will diminish aggregation. Furthermore, TEM studies defined the primary size and confirmed the rod morphology of the GNRs. The width for the GNRs was around 12 nm, with a length of 45 for AR 3.7. Moreover, TEM images of GNRs and their pale pink suspension indicated that GNRs were present as well (Fig. 2C).
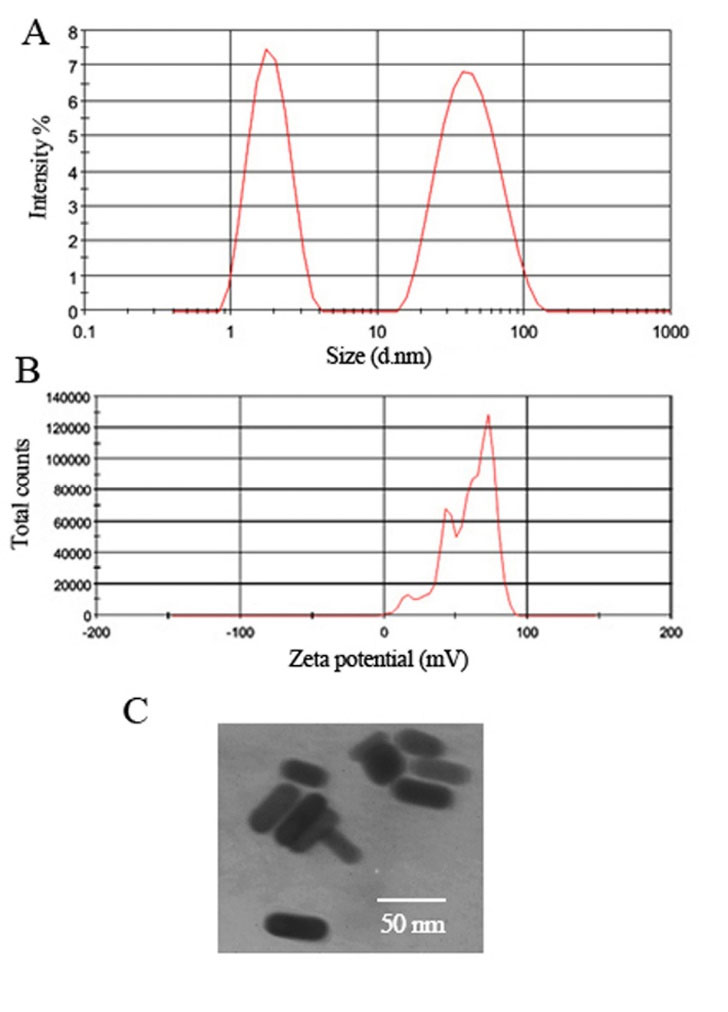
Fig. 2.
(A) Hydrodynamic diameter distribution plots as determined by DLS measurements (B) Zeta potential distribution of GNRs, and (C) TEM image of the CTAB-coated GNRs.
.
(A) Hydrodynamic diameter distribution plots as determined by DLS measurements (B) Zeta potential distribution of GNRs, and (C) TEM image of the CTAB-coated GNRs.
Selection of best laser wavelength in SPR instrument for enhancement
After GNRs preparation, to select the best laser wavelength in SPR instrument, the enhancement of GNPs and GNRs was examined at two different wavelengths (670 and 785 nm). As shown in Fig. 3A, we hypothesized that the maximum enhancement effect is obtained when the ʎ max of gold nanoparticles are matched or near the wavelength of excitation laser source in SPR instrument. For example, in Fig. 3B GNP with ʎ max 530 nm had a more intensifying effect in laser wavelength 670 nm compared with 785 nm. Moreover, when GNRs with ʎ max 735 nm was used, the intensification labels displayed a more intensifying effect in laser wavelength of 785 nm compared with 670 nm (Fig. 3C). Based on these facts, in this study, we used a laser operating at 785 nm as the excitation laser source in SPR device due to more amplification effect by plasmonic coupling between the GNRs and the gold sensing film.
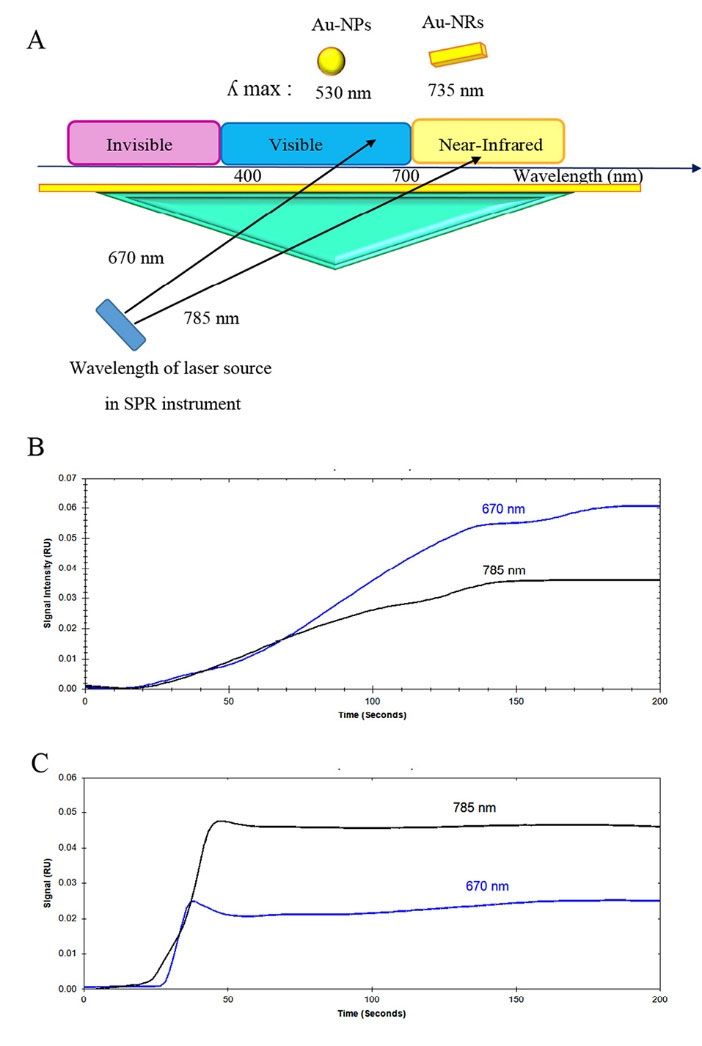
Fig. 3.
(A) Schematic image of laser wavelength in the SPR instrument. (B) Effect of LSPR of GNPs on the enhancement factor using laser source operating at (a) 670 nm and (b) 785 nm. (C) Effect of LSPR of GNRs on the enhancement factor using laser source operating at (a) 670 nm and (b) 785 nm (GNRs and GNPs injection on bare gold surface, flow rate: 30 µL/min, Injection time: 2 min).
.
(A) Schematic image of laser wavelength in the SPR instrument. (B) Effect of LSPR of GNPs on the enhancement factor using laser source operating at (a) 670 nm and (b) 785 nm. (C) Effect of LSPR of GNRs on the enhancement factor using laser source operating at (a) 670 nm and (b) 785 nm (GNRs and GNPs injection on bare gold surface, flow rate: 30 µL/min, Injection time: 2 min).
Preparation of VE-cadherin chip and HUVEC cell injection to it
In addition, for detection of the cell surface marker on HUVEC cells, immobilization of VE-cadherin antibody on the gold chip was performed according to our previous study (Fig. S2A).
25
As shown in Fig. S2D, the comparison between SPR curve in bare gold surface and antibody modified surface showed an increasing in angle shift (near 450 millidegree) which confirm the successful immobilization step. After immobilization of VE-cadherin antibody on the chip, for showing the selectivity of this chip, HUVEC cells were injected on three different surfaces. As shown in supporting material (Fig. S2B), cell injection on the bare gold surface has a more response unit (RU) compared with antibody and BSA coated chip. In addition, flow cytometry is able to define a small number of desired fluorescent cell populations against a high background of non-fluorescent cells. To confirm the sensitivity of SPR method in detecting HUVEC cells, we also used a fluorescent labeled antibody against VE-cadherin. The existing of VE-cadherin near 91 ± 7.09% of HUVEC cells was also proven by flow cytometry analyses (Fig. S2C).
Enchantment of SPR signals by GNRs
To study the application of GNRs in the enchantment of SPR signals, we injected HUVEC cells on VE-cadherin antibody coated chip. In Fig. 4A , the baseline was firstly set by running buffer PBS on the VE-cadherin (Ab)-functionalized sensing film for a few minutes. Then, HUVEC cells (diluted in running buffer) were injected to the sensor surface in one channel (blue curve) and the other channel was given up with no cell injection (red curve). Then biotynilated VE-cadherin antibody was introduced to the cell surface and the other channel was left with no injection. Subsequently, two channels were exposed to the GNRs-Strep solution for investigating specific and non-specific binding on the sensor surface. As seen in Fig. 4A (blue curve), in the channel with the HUVEC cell, the biotynilated VE-cadherin antibody was absorbed on the cell surface which led to the significant change of the SPR response after GNRs-strep solution injection (∆RU1). The method for calculation of RU values like ∆RU1 is the subtraction of RU value in time of 40 minutes of sensogram (Fig. 4A) after GNRs-strep injection from RU value before GNRs-Strep injection in time of 24 minutes (Eq. 1).
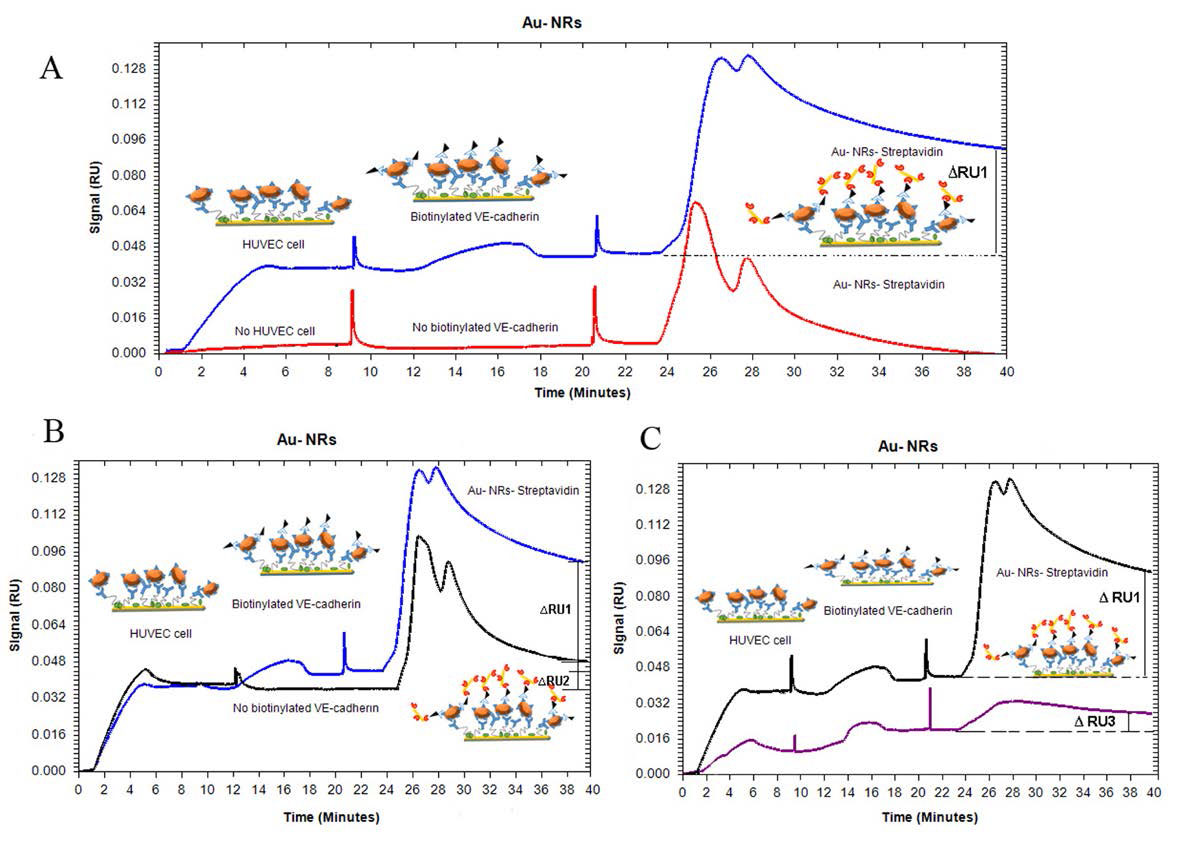
Fig. 4.
Real-time SPR curves for GNRs enhancement corresponds to the (A) cell and no cell detection (B) nonspecific binding between cell and GNR (C) two cell number detection (experiment conditions: injection duration for cells:5 min, biotinylated antibody: 7 min and GNRs-strep :3 min, flow rate: 10- 30 µL/min).
.
Real-time SPR curves for GNRs enhancement corresponds to the (A) cell and no cell detection (B) nonspecific binding between cell and GNR (C) two cell number detection (experiment conditions: injection duration for cells:5 min, biotinylated antibody: 7 min and GNRs-strep :3 min, flow rate: 10- 30 µL/min).
∆RU1= RU in 40 min- RU in 24 min = 0.096 – 0.048 = 0.048 (1)
But as given in Fig. 4A (red curve), there is no change in the SPR signal when GNRs-strep reacts with the antibody surface in the other channel.
In addition, a control experiment for the detection of non-specific binding between cell and GNRs was conducted under the same conditions but without exposure to biotynilated VE-cadherin antibody. For investigation of non-specific absorption, after defined cell attaching on the sensor surface, GNRs-strep solution within 3 minutes was injected on two surfaces, with and without biotynilated VE-cadherin antibody surfaces. Any response unit for attaching GNRs- strep to cell surface without biotynilated antibody is related to non-specific absorption.
The data shows less response unit (Eq. 2) between the cell and GNRs (see Fig. 4B), suggesting that the sensed signal was obtained from a very specific assay rather than a non-specific binding response (∆RU2<<∆RU1).
∆RU2= RU in 40 min- RU in 24 min = 0.048 – 0.032 = 0.016 (2)
It is worth to mention that this dramatic shift in RU is related to the binding reaction between the biotinylated antibodies on attached HUVEC cells and GNRs- strep on the sensor surface. The signals had not backshift after washing the chip surface with running buffer, which emphasizes that the binding step has been successful. To completely determine the potential of this sensitive detection, this experiment was carried out with less cell count under the same conditions by exposing the modified chip to different concentrations of cells. As shown in Fig. 4C, the enhancement of GNRs reduced by decreasing the number of cells (∆RU3). The growth of ∆RU value in specific and non-specific bindings for various cell number injections was produced with increasing the cell number (Fig. 5A). Moreover, because of exposing the cells to GNRs solution less than half an hour during the SPR test, the cell viability was assessed for 2 and 24 hours by MTT assay. As seen in Fig. 5B, even after 2 hours, cell viability did not change dramatically. Cell viability was assessed as a percentage compared to untreated control cells.
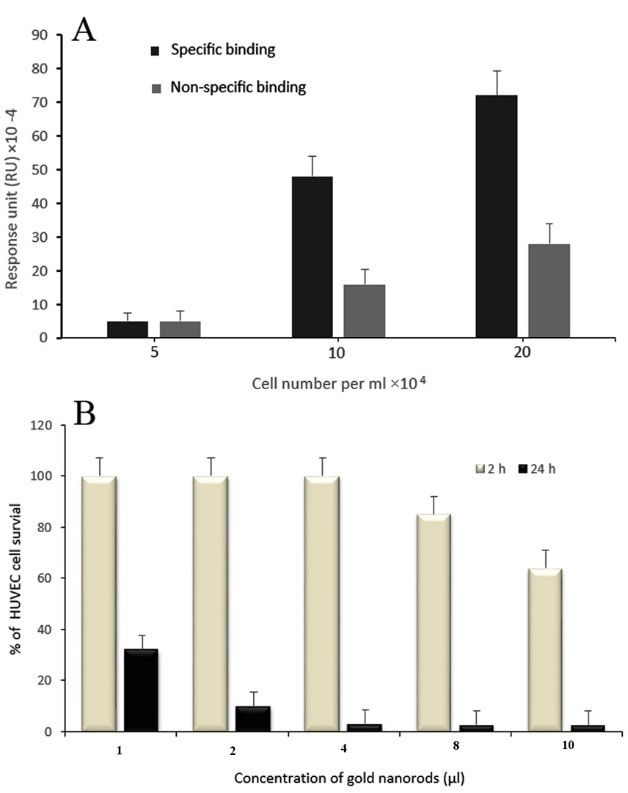
Fig. 5.
(A) RU value of specific and non-specific bindings for various cell number injections. (B) Cell viability investigation incubated with GNRs for 2 and 24 hours. All values are expressed as mean ± SD (n=3).
.
(A) RU value of specific and non-specific bindings for various cell number injections. (B) Cell viability investigation incubated with GNRs for 2 and 24 hours. All values are expressed as mean ± SD (n=3).
Conclusion
In this study, rapid and sensitive SPR biosensor using GNRs based on signal intensification method was presented for detection of a cell surface marker. We confirmed a simple sandwich assay using streptavidin-functionalized GNRs in combination with SPR to detect VE-cadherin on the HUVECs as the cell model. Our investigation revealed that the plasmonic field extension produced from the gold layer on the sensor surface and GNRs resulted in the multiple enhancement of SPR signals when the wavelength of the laser source in SPR instrument is matched with the wavelength of maximum absorbance in GNRs. The results showed that cell detection can be performed in a real- time form without any need to labeling process used in the conventional methods like immunocytochemistry, flow cytometry, and western blotting. Hence, this interdisciplinary field could be more extended to the tests of other targets and may contribute to the improvement of diagnosis and therapy of diseases. Further future studies may show the tasks associated with the integration of plasmonic and metal nanoparticles with real-life clinical applications.
Acknowledgment
The authors are grateful for financial support from the Research Center for Pharmaceutical Nanotechnology (RCPN) of Tabriz University of Medical Sciences (TUOMS).
Funding sources
This study is part of a PhD thesis (ID: 94- 008-154-1) funded by RCPN of TUOMS.
Ethical statement
This study was approved by the Research Ethics Committee at Tabriz University of Medical Science (Code of Ethics: IR.TBZMED.REC.1396.1307).
Competing interests
The authors declare that they have no conflict of interests.
Authors contribution
FF and MR-R conceived and planned the work, the main theoretical ideas and design of the research and experiments. FF and RJ implemented the experiments. FF contributed to writing and reviewing of the manuscript. MA and all other authors contributed to data analysis and interpretation of the results. MR-R was the supervisor of this work.
Supplementary Materials
Supplementary file 1 contains Figs. S1-S2.
(pdf)
Research Highlights
What is the current knowledge?
simple
-
√ Cell surface markers like VE-cadherin can be detected by
GNRs using SPR signal enhancement.
What is new here?
simple
-
√ For the first time, GNRs were used for the intesification of
SPR signals in cellular studies.
References
- Ferreira de Macedo E, Ducatti Formaggio DM, Salles Santos N, Batista Tada D. Gold Nanoparticles Used as Protein Scavengers Enhance Surface Plasmon Resonance Signal. Sensors 2017; 17:2765. doi: 10.3390/s17122765 [Crossref] [ Google Scholar]
- Zhang H, Song D, Gao S, Zhang H, Zhang J, Sun Y. Enhanced wavelength modulation SPR biosensor based on gold nanorods for immunoglobulin detection. Talanta 2013; 115:857-62. doi: 10.1016/j.talanta.2013.06.059 [Crossref] [ Google Scholar]
- Elahi N, Kamali M, Baghersad MH. Recent biomedical applications of gold nanoparticles: a review. Talanta 2018; 184:537-56. doi: 10.1016/j.talanta.2018.02.088 [Crossref] [ Google Scholar]
- Jennings T, Strouse G. Past, present, and future of gold nanoparticles. Adv Exp Med Biol 2007; 620:34-47. doi: 10.1007/978-0-387-76713-0_3 [Crossref] [ Google Scholar]
- Afsharan H, Khalilzadeh B, Tajalli H, Mollabashi M, Navaeipour F, Rashidi M-R. A sandwich type immunosensor for ultrasensitive electrochemical quantification of p53 protein based on gold nanoparticles/graphene oxide. Electrochimica Acta 2016; 188:153-64. doi: 10.1016/j.electacta.2015.11.133 [Crossref] [ Google Scholar]
- Gnedenko OV, Mezentsev YV, Molnar AA, Lisitsa AV, Ivanov AS, Archakov AI. Highly sensitive detection of human cardiac myoglobin using a reverse sandwich immunoassay with a gold nanoparticle-enhanced surface plasmon resonance biosensor. Anal Chim Acta 2013; 759:105-9. doi: 10.1016/j.aca.2012.10.053 [Crossref] [ Google Scholar]
- Law WC, Yong KT, Baev A, Prasad PN. Sensitivity improved surface plasmon resonance biosensor for cancer biomarker detection based on plasmonic enhancement. ACS Nano 2011; 5:4858-64. doi: 10.1021/nn2009485 [Crossref] [ Google Scholar]
-
Pakchin PS, Ghanbari H, Saber R, Omidi Y. Electrochemical immunosensor based on chitosan/gold nanoparticle-carbon nanotube as platform and lactate oxidase as the label for the detection of CA125. Biosens Bioelectron 2018.
- Cao Y, Griffith B, Bhomkar P, Wishart DS, McDermott MT. Functionalized gold nanoparticle-enhanced competitive assay for sensitive small-molecule metabolite detection using surface plasmon resonance. Analyst 2017; 143:289-96. doi: 10.1039/c7an01680h [Crossref] [ Google Scholar]
- Jazayeri MH, Amani H, Pourfatollah AA, Avan A, Ferns GA, Pazoki-Toroudi H. Enhanced detection sensitivity of prostate-specific antigen via PSA-conjugated gold nanoparticles based on localized surface plasmon resonance: GNP-coated anti-PSA/LSPR as a novel approach for the identification of prostate anomalies. Cancer Gene Ther 2016; 23:365-9. doi: 10.1038/cgt.2016.42 [Crossref] [ Google Scholar]
- Ebrahimi M, Johari-Ahar M, Hamzeiy H, Barar J, Mashinchian O, Omidi Y. Electrochemical impedance spectroscopic sensing of methamphetamine by a specific aptamer. BioImpacts 2012; 2:91-95. doi: 10.5681/bi.2012.013 [Crossref] [ Google Scholar]
- Pakchin PS, Nakhjavani SA, Saber R, Ghanbari H, Omidi Y. Recent advances in simultaneous electrochemical multi-analyte sensing platforms. Trends Anal Chem 2017; 92:32-41. doi: 10.1016/j.trac.2017.04.010 [Crossref] [ Google Scholar]
- Kwon MJ, Lee J, Wark AW, Lee HJ. Nanoparticle-enhanced surface plasmon resonance detection of proteins at attomolar concentrations: comparing different nanoparticle shapes and sizes. Anal Chem 2012; 84:1702-7. doi: 10.1021/ac202957h [Crossref] [ Google Scholar]
- Kabashin AV, Evans P, Pastkovsky S, Hendren W, Wurtz GA, Atkinson R. Plasmonic nanorod metamaterials for biosensing. Nat Mater 2009; 8:867-71. doi: 10.1038/nmat2546 [Crossref] [ Google Scholar]
- Nikoobakht B, El-Sayed MA. Preparation and growth mechanism of gold nanorods (NRs) using seed-mediated growth method. Chem Mater 2003; 15:1957-62. doi: 10.1021/cm020732l [Crossref] [ Google Scholar]
- Lyon LA, Musick MD, Natan MJ. Colloidal Au-enhanced surface plasmon resonance immunosensing. Anal Chem 1998; 70:5177-83. doi: 10.1021/ac9809940 [Crossref] [ Google Scholar]
- Wang J, Zhou HS. Aptamer-based Au nanoparticles-enhanced surface plasmon resonance detection of small molecules. Anal Chem 2008; 80:7174-8. doi: 10.1021/ac801281c [Crossref] [ Google Scholar]
- Aliakbarinodehi N, Stradolini F, Nakhjavani SA, Tzouvadaki I, Taurino I, De Micheli G. Performance of Carbon Nano-Scale Allotropes in Detecting Midazolam and Paracetamol in Undiluted Human Serum. IEEE Sens J 2018; 18:5073-81. doi: 10.1109/JSEN.2018.2828416 [Crossref] [ Google Scholar]
- Fathi F, Rashidi MR, Omidi Y. Ultra-sensitive detection by metal nanoparticles-mediated enhanced SPR biosensors. Talanta 2019; 192:118-27. doi: 10.1016/j.talanta.2018.09.023 [Crossref] [ Google Scholar]
- Gao Y, Zou F, Wu B, Wang X, Zhang J, Koh K. CB[7]-mediated signal amplification approach for sensitive surface plasmon resonance spectroscopy. Biosens Bioelectron 2016; 81:207-13. doi: 10.1016/j.bios.2016.02.075 [Crossref] [ Google Scholar]
- Wu B, Jiang R, Wang Q, Huang J, Yang X, Wang K. Detection of C-reactive protein using nanoparticle-enhanced surface plasmon resonance using an aptamer-antibody sandwich assay. Chem Commun (Camb) 2016; 52:3568-71. doi: 10.1039/c5cc10486f [Crossref] [ Google Scholar]
- Yuan J, Oliver R, Li J, Lee J, Aguilar M, Wu Y. Sensitivity enhancement of SPR assay of progesterone based on mixed self-assembled monolayers using nanogold particles. Biosens Bioelectron 2007; 23:144-8. doi: 10.1016/j.bios.2007.03.025 [Crossref] [ Google Scholar]
- Cao X, Ye Y, Liu S. Gold nanoparticle-based signal amplification for biosensing. Anal Biochem 2011; 417:1-16. doi: 10.1016/j.ab.2011.05.027 [Crossref] [ Google Scholar]
- Gelinsky-Wersing D, Wersing W, Pompe W. Bivalent kinetic binding model to surface plasmon resonance studies of antigen-antibody displacement reactions. Anal Biochem 2017; 518:110-25. doi: 10.1016/j.ab.2016.11.012 [Crossref] [ Google Scholar]
- Sharifi M, Dolatabadi JEN, Fathi F, Zakariazadeh M, Barzegar A, Rashidi M. Surface plasmon resonance and molecular docking studies of bovine serum albumin interaction with neomycin: kinetic and thermodynamic analysis. BioImpacts 2017; 7:91. doi: 10.15171/bi.2017.12 [Crossref] [ Google Scholar]
- Fathi F, Mohammadzadeh-Aghdash H, Sohrabi Y, Dehghan P, Dolatabadi JEN. Kinetic and thermodynamic studies of bovine serum albumin interaction with ascorbyl palmitate and ascorbyl stearate food additives using surface plasmon resonance. Food Chem 2018; 246:228-32. doi: 10.1016/j.foodchem.2017.11.023 [Crossref] [ Google Scholar]
- Fathi F, Rezabakhsh A, Rahbarghazi R, Rashidi M-R. Early-stage detection of VE-cadherin during endothelial differentiation of human mesenchymal stem cells using SPR biosensor. Biosens Bioelectron 2017; 96:358-66. doi: 10.1016/j.bios.2017.05.018 [Crossref] [ Google Scholar]
- Cortès S, Villiers CL, Colpo P, Couderc R, Brakha C, Rossi F. Biosensor for direct cell detection, quantification and analysis. Biosens Bioelectron 2011; 26:4162-8. doi: 10.1016/j.bios.2011.04.016 [Crossref] [ Google Scholar]
- Fathi F, Rahbarghazi R, Rashidi M-R. Label-free biosensors in the field of stem cell biology. Biosens Bioelectron 2018; 101:188-98. doi: 10.1016/j.bios.2017.10.028 [Crossref] [ Google Scholar]
- Rezabakhsh A, Nabat E, Yousefi M, Montazersaheb S, Cheraghi O, Mehdizadeh A, et al.
Endothelial cells' biophysical, biochemical,
and chromosomal aberrancies in high-glucose condition within
the diabetic range
. Cell Biochem Funct 2017; 35:83-97. doi: 10.1002/cbf.3251 [Crossref] [ Google Scholar]
- Yu C, Irudayaraj J. Multiplex biosensor using gold nanorods. Anal Chem 2007; 79:572-9. doi: 10.1021/ac061730d [Crossref] [ Google Scholar]
- Politi J, De Stefano L, Casale S, Spadavecchia J. Original covalent approach for gold nanorods immobilization onto acid-terminated-cysteamine self-assembled monolayers for ft-spr biosensor applications. Biosens Bioelectron 2015; 6:1. doi: 10.4172/2155-6210.1000167 [Crossref] [ Google Scholar]
- Piliarik M, Homola J. Surface plasmon resonance (SPR) sensors: approaching their limits?. Opt Express 2009; 17:16505-17. doi: 10.1364/OE.17.016505 [Crossref] [ Google Scholar]
- Wasowicz M, Milner M, Radecka D, Grzelak K, Radecka H. Immunosensor incorporating anti-His (C-term) IgG F(ab') fragments attached to gold nanorods for detection of His-tagged proteins in culture medium. Sensors (Basel) 2010; 10:5409-24. doi: 10.3390/s100605409 [Crossref] [ Google Scholar]
- Scaletti F, Kim CS, Messori L, Rotello VM. Rapid purification of gold nanorods for biomedical applications. MethodsX 2014; 1:118-23. doi: 10.1016/j.mex.2014.07.007 [Crossref] [ Google Scholar]
- Liu H, Pierre-Pierre N, Huo Q. Dynamic light scattering for gold nanorod size characterization and study of nanorod–protein interactions. Gold Bull 2012; 45:187-95. doi: 10.1007/s13404-012-0067-4 [Crossref] [ Google Scholar]