Bioimpacts. 11(2):147-156.
doi: 10.34172/bi.2021.22
Original Research
Metabolomic characterization of colorectal cancer cell lines highlighting stage-specific alterations during cancer progression
Hazwani Mohd Yusof 1  , Sharaniza Ab-Rahim 1, Wan Zurinah Wan Ngah 2, Sheila Nathan 3, A Rahman A Jamal 4, Musalmah Mazlan 1, *
Author information:
1Department of Biochemistry and Molecular Medicine, Faculty of Medicine, Universiti Teknologi MARA, Campus Sungai Buloh, 47000 Sungai Buloh, Selangor, Malaysia
2Universiti Kebangsaan Malaysia Medical Centre, Jalan Yaacob Latif, Bandar Tun Razak, 56000 Batu 9 Cheras, Wilayah Persekutuan Kuala Lumpur, Malaysia
3Department of Biosciences and Biotechnology, Faculty of Science and Technology, Universiti Kebangsaan Malaysia, 43600 UKM Bangi, Selangor, Malaysia
4UKM Medical Molecular Biology Institute, UKM Medical Centre, Jalan Yaacob Latif, Bandar Tun Razak, 56000 Cheras, Kuala Lumpur, Malaysia
Abstract
Introduction:
Metabolomic studies on various colorectal cancer (CRC) cell lines have improved our understanding of the biochemical events underlying the disease. However, the metabolic profile dynamics associated with different stages of CRC progression is still lacking. Such information can provide further insights into the pathophysiology and progression of the disease that will prove useful in identifying specific targets for drug designing and therapeutics. Thus, our study aims to characterize the metabolite profiles in the established cell lines corresponding to different stages of CRC.
Methods:
Metabolite profiling of normal colon cell lines (CCD 841 CoN) and CRC cell lines corresponding to different stages, i.e., SW 1116 (stage A), HT 29 and SW 480 (stage B), HCT 15 and DLD-1 (stage C), and HCT 116 (stage D), was carried out using liquid chromatography-mass spectrometry (LC-MS). Mass Profiler Professional and Metaboanalyst 4.0 software were used for statistical and pathway analysis. METLIN database was used for the identification of metabolites.
Results:
We identified 72 differential metabolites compared between CRC cell lines of all the stages and normal colon cells. Principle component analysis and partial least squares discriminant analysis score plot were used to segregate normal and CRC cells, as well as CRC cells in different stages of the disease. Variable importance in projection score identified unique differential metabolites in CRC cells of the different stages. We identified 7 differential metabolites unique to stage A, 3 in stage B, 5 in stage C, and 5 in stage D.
Conclusion:
This study highlights the differential metabolite profiling in CRC cell lines corresponding to different stages. The identification of the differential metabolites in CRC cells at individual stages will lead to a better understanding of the pathophysiology of CRC development and progression and, hence, its application in treatment strategies.
Keywords: Cell metabolomics, Metabolites, Colorectal cancer, Stages
Copyright and License Information
© 2021 The Author(s)
This work is published by BioImpacts as an open access article distributed under the terms of the Creative Commons Attribution License (
http://creativecommons.org/licenses/by-nc/4.0/). Non-commercial uses of the work are permitted, provided the original work is properly cited.
Introduction
Metabolomics is an ‘omics’ approach, involving the study of metabolites, which are considered to be the best indicator of an organism’s phenotype.
1,2
Metabolomic profiling has been performed widely on several cancer types including colorectal cancer (CRC).
3-7
However, the analysis of primary samples from bio-fluids or tissues is influenced by age, body mass, gender, and diet, which biasesdifferential metabolite profiling and affected pathways.
8-10
Metabolomics analysis of cell lines has been extensively used in disease research.
2
Cell metabolomics has many potential applications and advantages compared to human tissues and bio-fluids; these advantages include the ease of control, cheaper process, and the resulting data is easier to interpret than the analysis of animal and human subjects.
2
In addition, in vitro studies using cell culture, are not influenced by genetic/ethnic variations and environmental factors. Moreover, in contrast to studies on animal and human subjects, cell culture analysis does not require ethical consideration.
11
Cell metabolomics profiling is an effective tool to evaluate the effect of any disease and endogenous and exogenous factors on cellular metabolism.
12
Moreover, the metabolomics profile obtained may provide useful information for developing further models of biological pathways and networks, besides providing a better understanding of the molecular mechanism of disease progression.
12
The pathophysiology that occurs in cell culture may mirror what is happening in in vivo study. Hence, this will lead to the possibility of using cell culture in place of animal models in CRC studies, especially in testing treatment modalities.
Various factors like quenching of cells, variability of culture media formulations, differences in passage number, and contamination can contribute to inherent biases in cell metabolomics. Moreover, metabolite degradation may occur during metabolite extraction procedures, and a large quantity of cultured cells is required for analysis.
11
However, there has been considerable improvement in these methodologies, and presently, cell metabolomics is much more accurate, faster, and more informative.
13-15
CRC is one of the common causes of cancer death in the world.
16
Accurate staging and diagnosis for CRC are crucial to improving prognosis. Thus, characterization of CRC cell lines of different stages is important to understand the pathogenesis and pathophysiology of the disease progression, especially at the molecular level, to improve diagnosis, staging, and treatment strategies of CRC.
Several metabolomics studies have been reported using cancer cell lines including breast,
17
pancreatic,
18
ovarian,
19
gastric,
20
and CRC cell lines.
21
Metabolic profiling on CRC cell lines, SW 1116 and SW 480 using gas chromatography-mass spectrometry (GC-MS)
22
revealed the differences in metabolism between CRC and healthy cells. Additionally, metabolomics on CRC cell lines of HT 29 highlighted perturbed metabolic pathways like glycolysis, tricarboxylic acid cycle, and pentose phosphate pathways.
23
However, there is a lack of comprehensive metabolic characterization of the different stages of CRC progression.
In this study, metabolomics profiles of CRC cell lines representing all four stages of CRC were characterized to understand the metabolic changes in CRC, with disease progression using liquid chromatography-mass spectrometry (LC-MS).
Materials and Methods
Materials
All cell lines were purchased from AddexBio (San Diego, CA USA). Dulbecco's Modified Eagle Medium (DMEM, high glucose), Gibco cell culture media, fetal bovine serum and penicillin-streptomycin were purchased from Thermo Fisher Scientific (Waltham, MA USA). Methanol and acetonitrile (HPLC grade) were purchased from Sigma-Aldrich (St. Louis, MO, USA).
Cell culture
Normal colon cells (CCD 841 CoN) and CRC cells SW 1116 (Stage A), HT 29 and SW 480 (Stage B), HCT 15 and DLD-2 (Stage C), and HCT 116 (Stage D) were used for metabolomics analysis. The classification of CRC was based on Dukes classification criteria. The stages of CRC cells have been classified by American Type Culture Collection (ATCC) and previous studies.
24,25
All cells were grown in cell culture media (DMEM, high glucose) supplemented with 10% fetal bovine serum and 1% penicillin-streptomycin. Cells were incubated in a CO2 incubator, BINDER (Tuttlingen, Germany), at 37°C with 98% humidity and 5% CO2 (v/v) until they reached 80-90% confluency for extraction of cell lysate.
Extraction of cell metabolites
Intracellular metabolite extraction was performed according to previous studies.
14,26
Briefly, metabolites were extracted by incubating the cells (1 × 10⁶ cells) with 1 mL of chilled (-80°C) extraction solvent (methanol-water (8:2, v/v)) for 15 minutes. The supernatant was aliquoted into 1.5 ml tube and dried in the EppendorfTM concentrator plus and stored at −80°C for further analysis. Every extraction samples were prepared in three biological replicates.
LC/MS Q-TOF analysis
Samples were analyzed using LC-MS/MS Q-TOF, Agilent Technologies 6520 (Santa Clara, CA USA) system. Briefly, dried samples were dissolved with 30 µL of acetonitrile-water (1:1, v/v) (mobile phase), vortex for 1 minute, and then centrifuged at 11, 200 g, for 10 min at 4°C. The mass spectrometric data were analyzed as described in a previous study.
26,27
The analysis was performed in three technical replicates and three biological replicates with positive and negative modes.
Data processing
Data was processed according to the guideline provided by the Class Prediction with Agilent Mass Profiler Professional (Manual part number: 5991-1911EN). The steps included MassHunter Qualitative Analysis and Mass Hunter Profinder to identify untargeted and targeted (recursive) features in the sample data files. This analysis included extraction of molecular features, subtraction of background noise, filtering of data, statistical analysis, database search, and alignment. A compound exchange format file (.CEF) was created for each sample, and downstream analysis was performed using Mass Profiler Professional (MPP) (Agilent Technologies, Santa Clara, CA USA). METLIN Personal Metabolitedatabase
28
was then used to identify endogenous and exogenous metabolites.
Data analysis
Data analysis of intracellular extraction samples was performed using molecular feature extraction (MFE) algorithm and Mass Hunter for data mining. Entities presenting absolute height parameter less than 200 were removed. All data files were processed in a batch mode. For frequency analysis, the data was first filtered based on the presence of the compounds/entities in at least one out of all samples. Then the compounds present in all samples were selected (second filter). T-test analysis was performed to filter the selected entities that were significantly different between the two experimental groups. Fold change of 2 was set for the identification of metabolites that differed in abundance between the two groups and was also used to eliminate possible discriminating compounds. Data recursion was performed to re-examine data in order to ensure the validity of each entity. The software generated extracted ion chromatograms by re-extracting the final group of metabolites from the data. The peak inspection of resulted extracted ion chromatograms was conducted in order to eliminate false positives and false negatives. Statistical analysis was then performed on the confirmed metabolites.
Statistical analysis and visualization
Statistical analysis and visualization were performed using the MPP software. The significant differences in the abundance of compounds between the two groups were determined using a t test. Metabolomics Pathway Analysis (Metaboanalyst 3.5) was used to determine PLS-DA score plot, principle component analysis (PCA) score plot, variable importance in projection (VIP), and pathway analysis. VIP scores close to or greater than one were considered to be important in a given model. METLIN database was then used to determine the identified metabolites.
Results
Development of a predictive model for normal colon and CRC cell lines with various differentiation grades
A total of 72 metabolites were found to be expressed differently between all types of CRC cells compared to normal colon cells (Fig. 1). The data of these 72 differential metabolites were then analysed using PCA, an unsupervised multivariate statistical analysis. PCA score plot showed separation between the normal colon and CRC cells with few overlaps between stages B and C (Fig. 2).
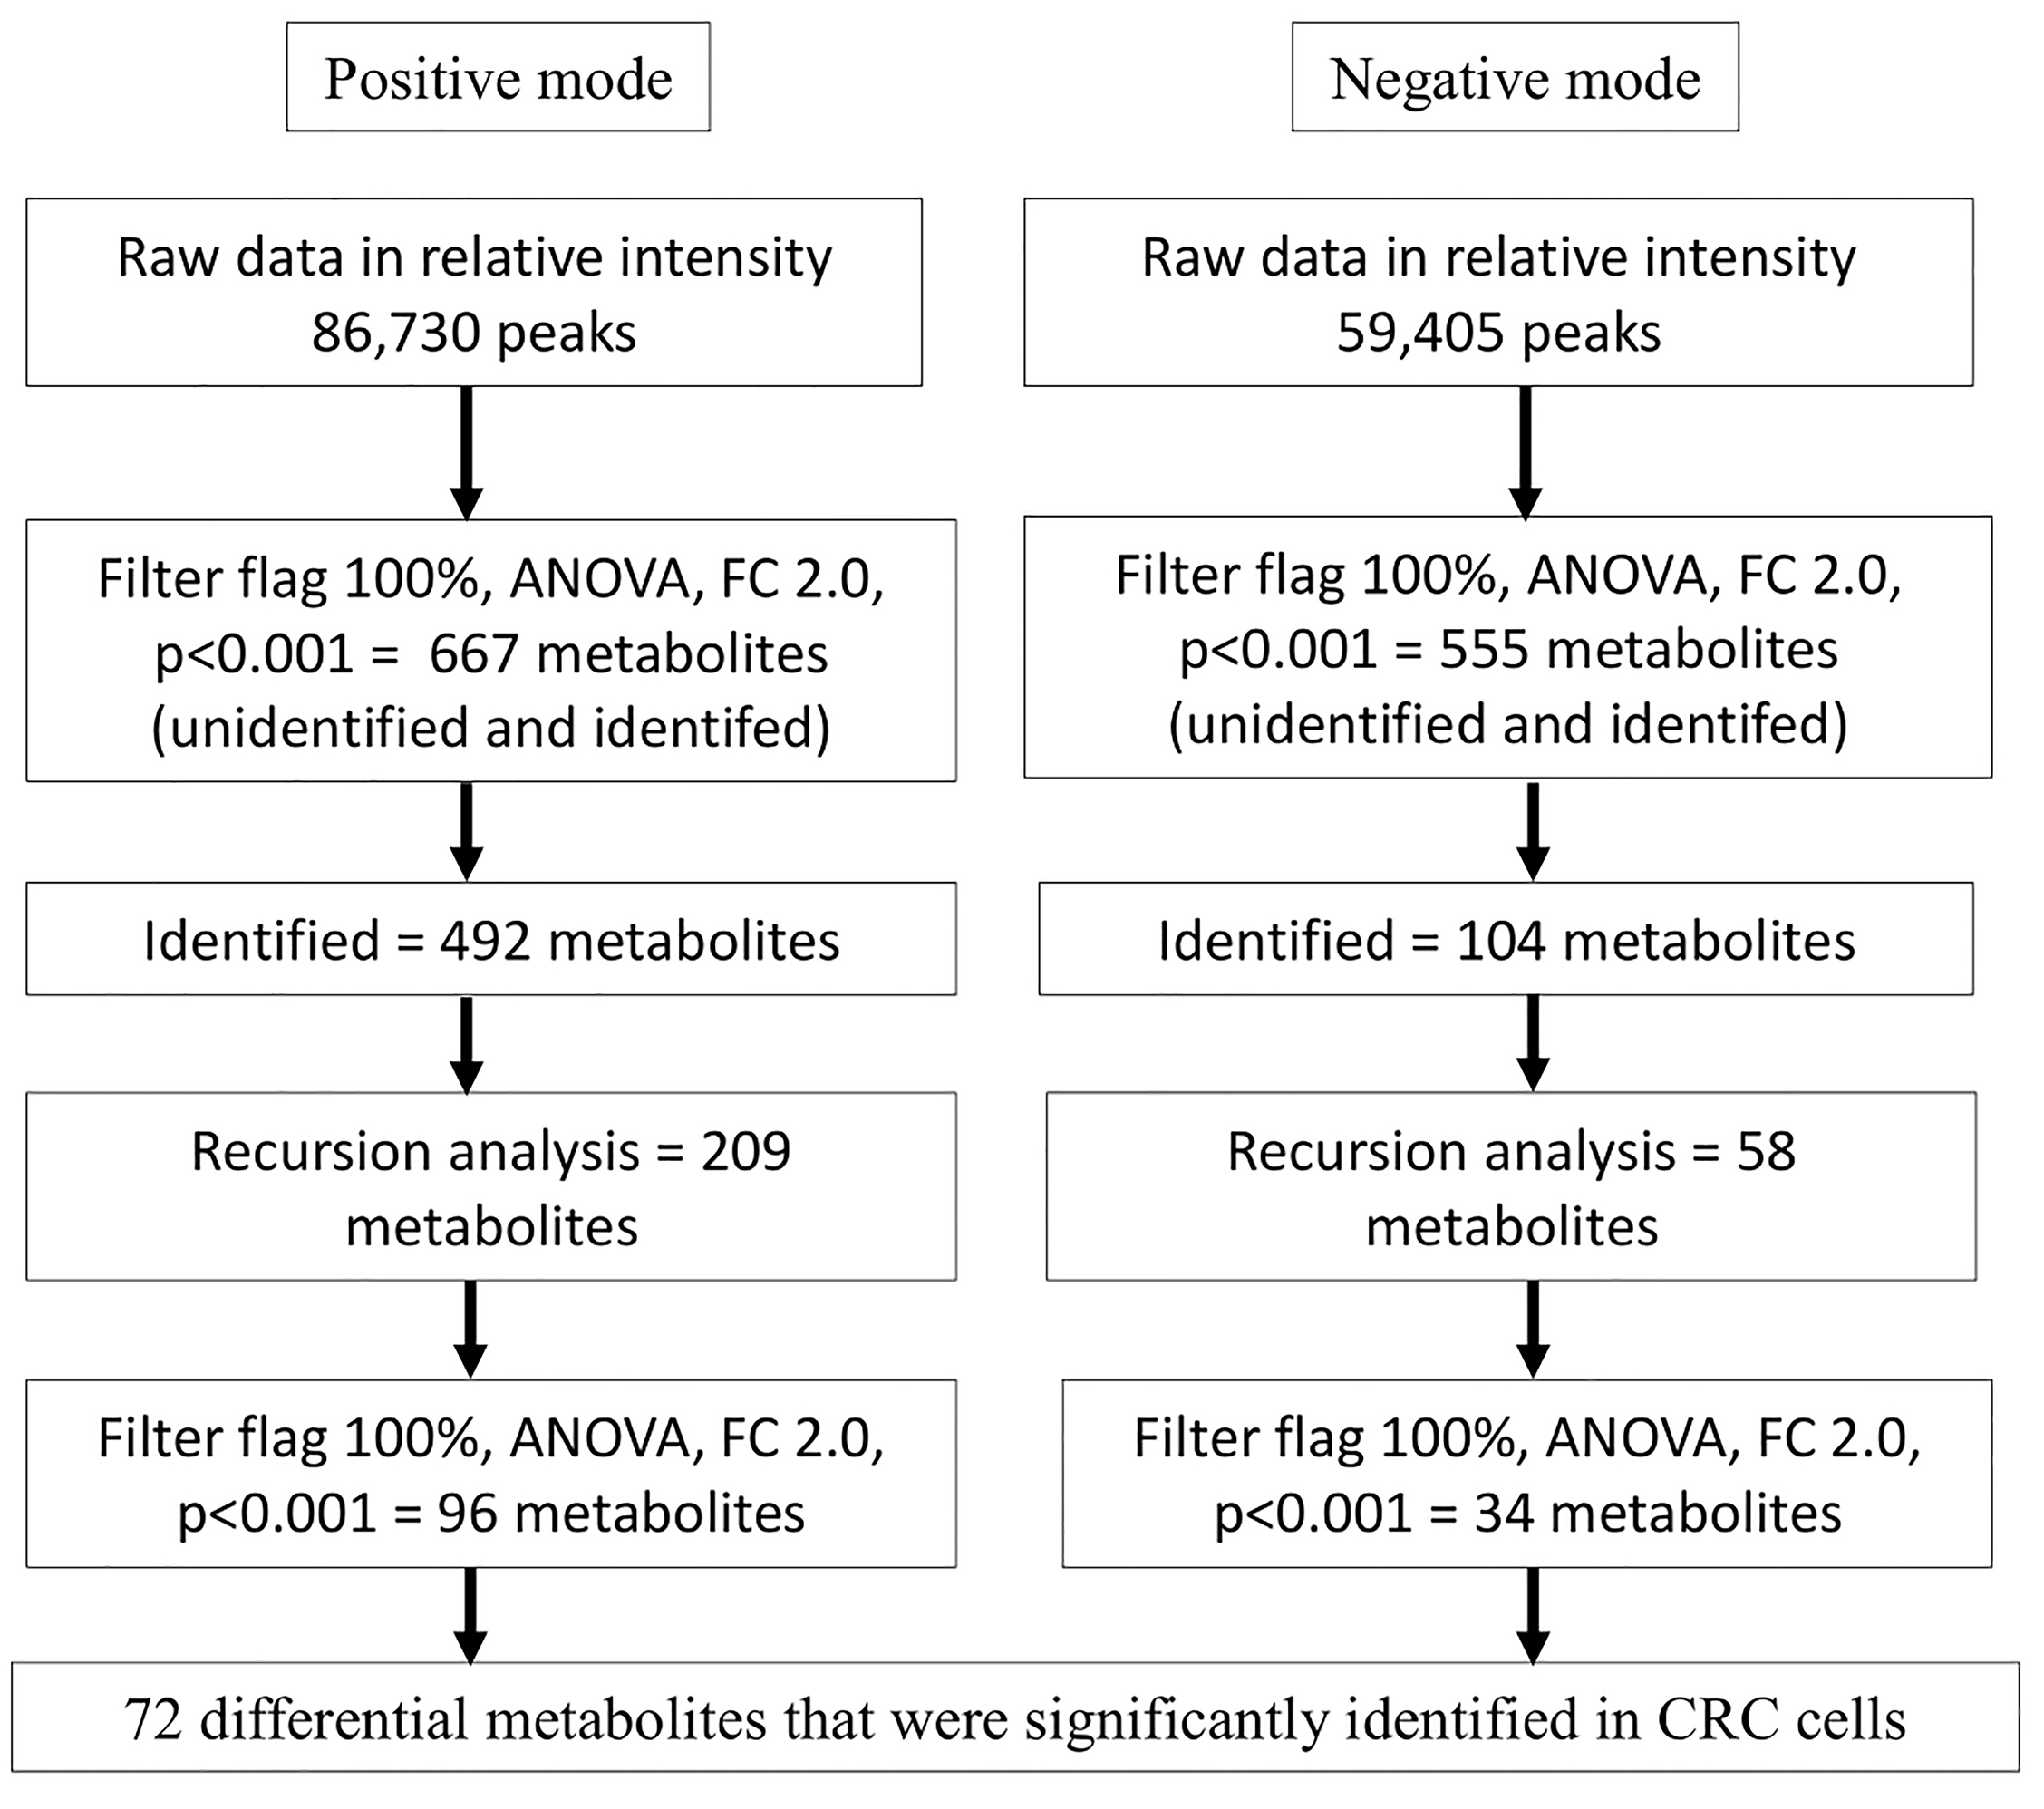
Fig. 1.
Flowchart of workflow analysis for intracellular metabolomics profiles in CRC cells.
.
Flowchart of workflow analysis for intracellular metabolomics profiles in CRC cells.
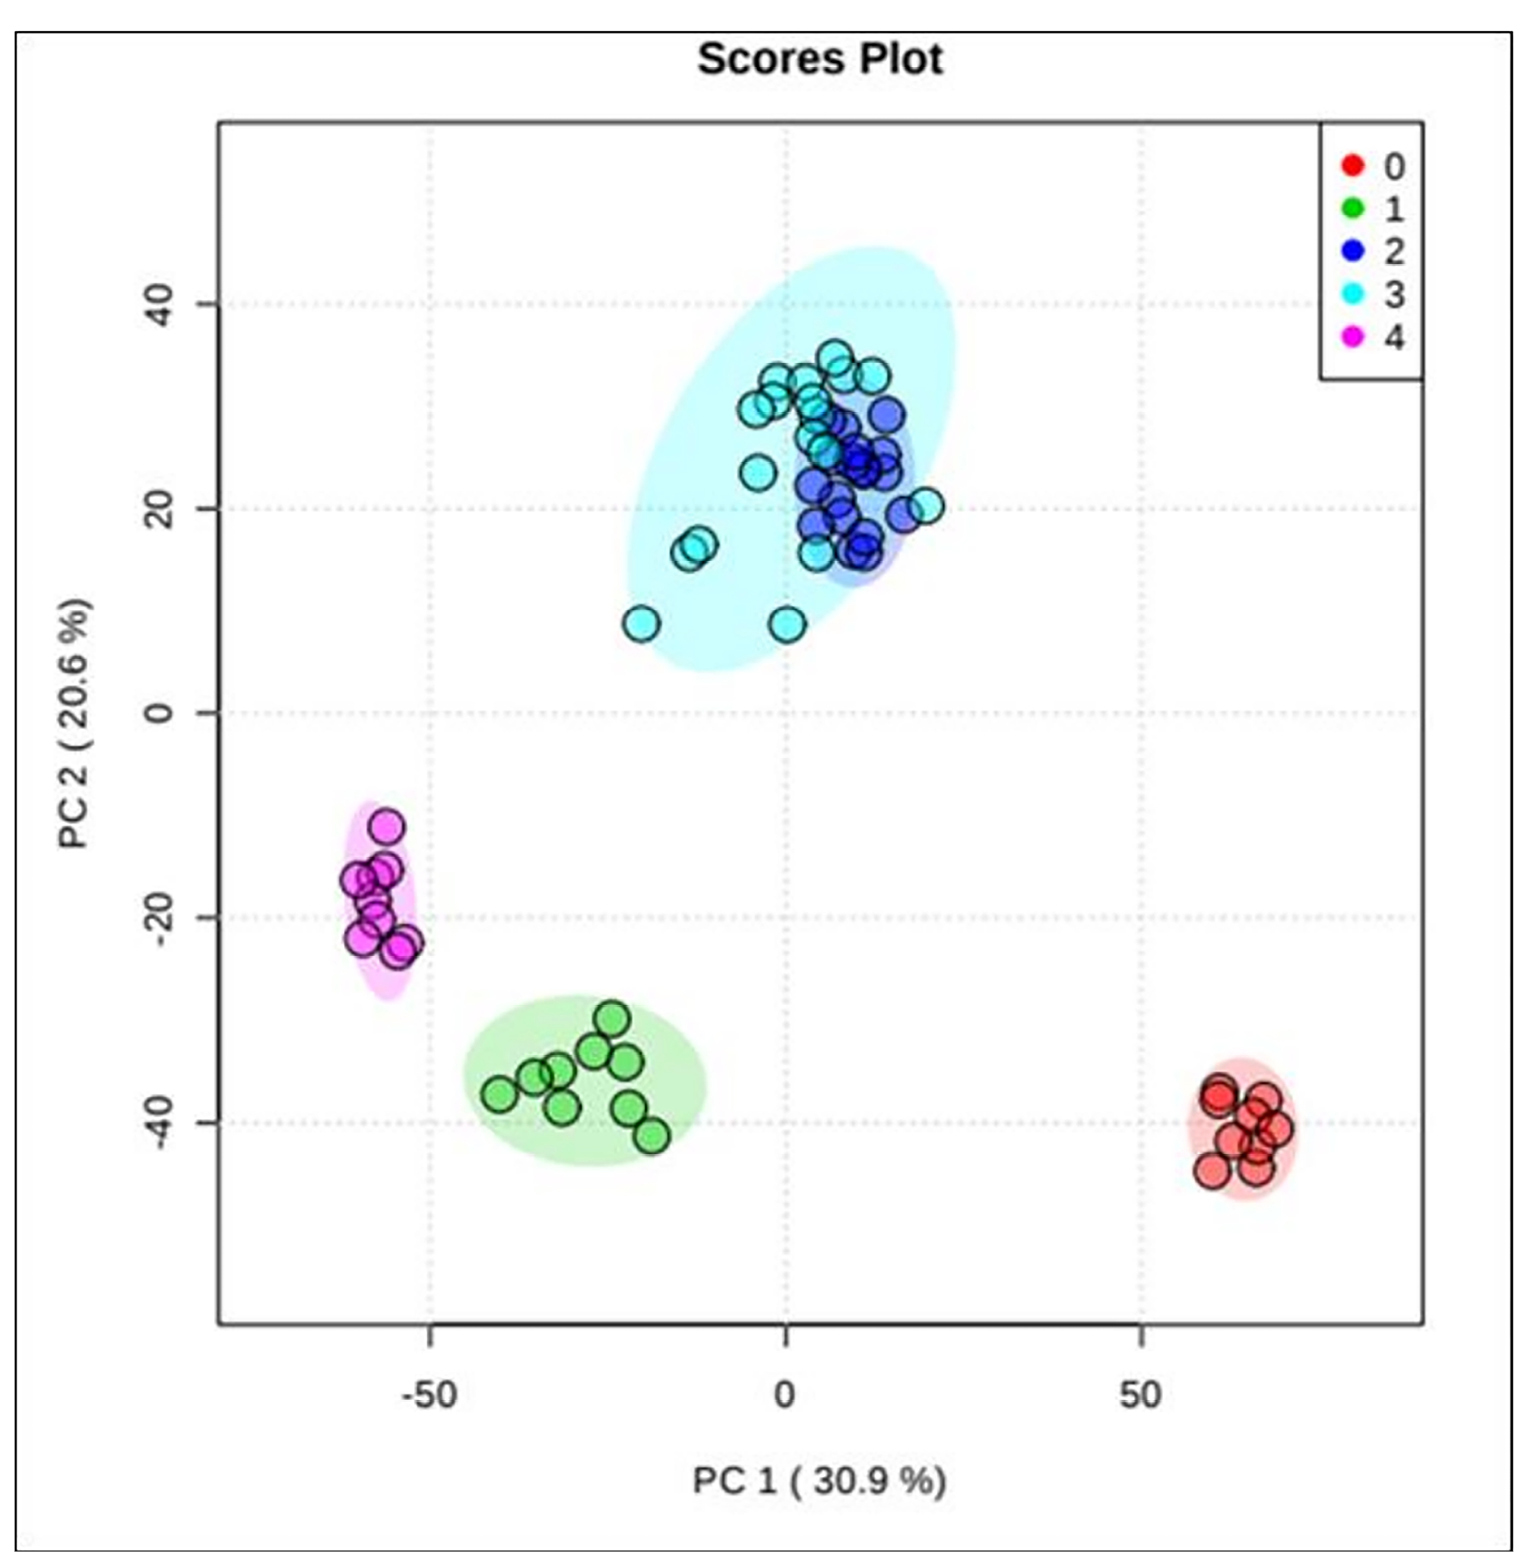
Fig. 2.
PCA analysis of LC/MS metabolites profiles. PCA score plot for normal colon and CRC cell lines with percentage variance for component 1 (30.9%) and component 2 (10.7%). Note: Red plots (0) represent normal colon cells, green plot (1) represent stage A, blue plot (2) represent stage B, turquoise plot (3) represent stage C, and purple plot (4) represent stage D.
.
PCA analysis of LC/MS metabolites profiles. PCA score plot for normal colon and CRC cell lines with percentage variance for component 1 (30.9%) and component 2 (10.7%). Note: Red plots (0) represent normal colon cells, green plot (1) represent stage A, blue plot (2) represent stage B, turquoise plot (3) represent stage C, and purple plot (4) represent stage D.
Bivariate statistical analysis between CRC cells of various differentiation grades and healthy controls
Bivariate statistical analysis of the metabolomic data from CRC cells and normal colon cells revealed several differential metabolites. A total of 39 differential metabolites were identified in stage A, 29 in stage B, 32 in stage C, and 60 in stage D when compared to normal colon cells (Supplementary data). Using these data, the PLS-DA model could segregate CRC cells, regardless of the degree of differentiation, from normal colon cells (Fig. 3).

Fig. 3.
PLS-DA score plot analysis of intracellular metabolites between CRC of different and normal colon cells. Notes: Plot A; Normal (0) Vs Stage A (1). Plot B; Normal (0) Vs Stage B (2). Plot C; Normal (0) Vs Stage C (3). Plot D; Normal (0) Vs Stage D (4).
.
PLS-DA score plot analysis of intracellular metabolites between CRC of different and normal colon cells. Notes: Plot A; Normal (0) Vs Stage A (1). Plot B; Normal (0) Vs Stage B (2). Plot C; Normal (0) Vs Stage C (3). Plot D; Normal (0) Vs Stage D (4).
Metabolites differentiated CRC cells of different stages versus normal
Following the PLS-DA model, VIP score was determined, which represents the most potential metabolite biomarkers expressed in a stage-specific manner of CRC. The results revealed several important metabolites unique to CRC cells of different stages (Fig. 4). Table 1 shows a list of the most important differential metabolites in differentiating CRC cells of different stages from normal colon cells.
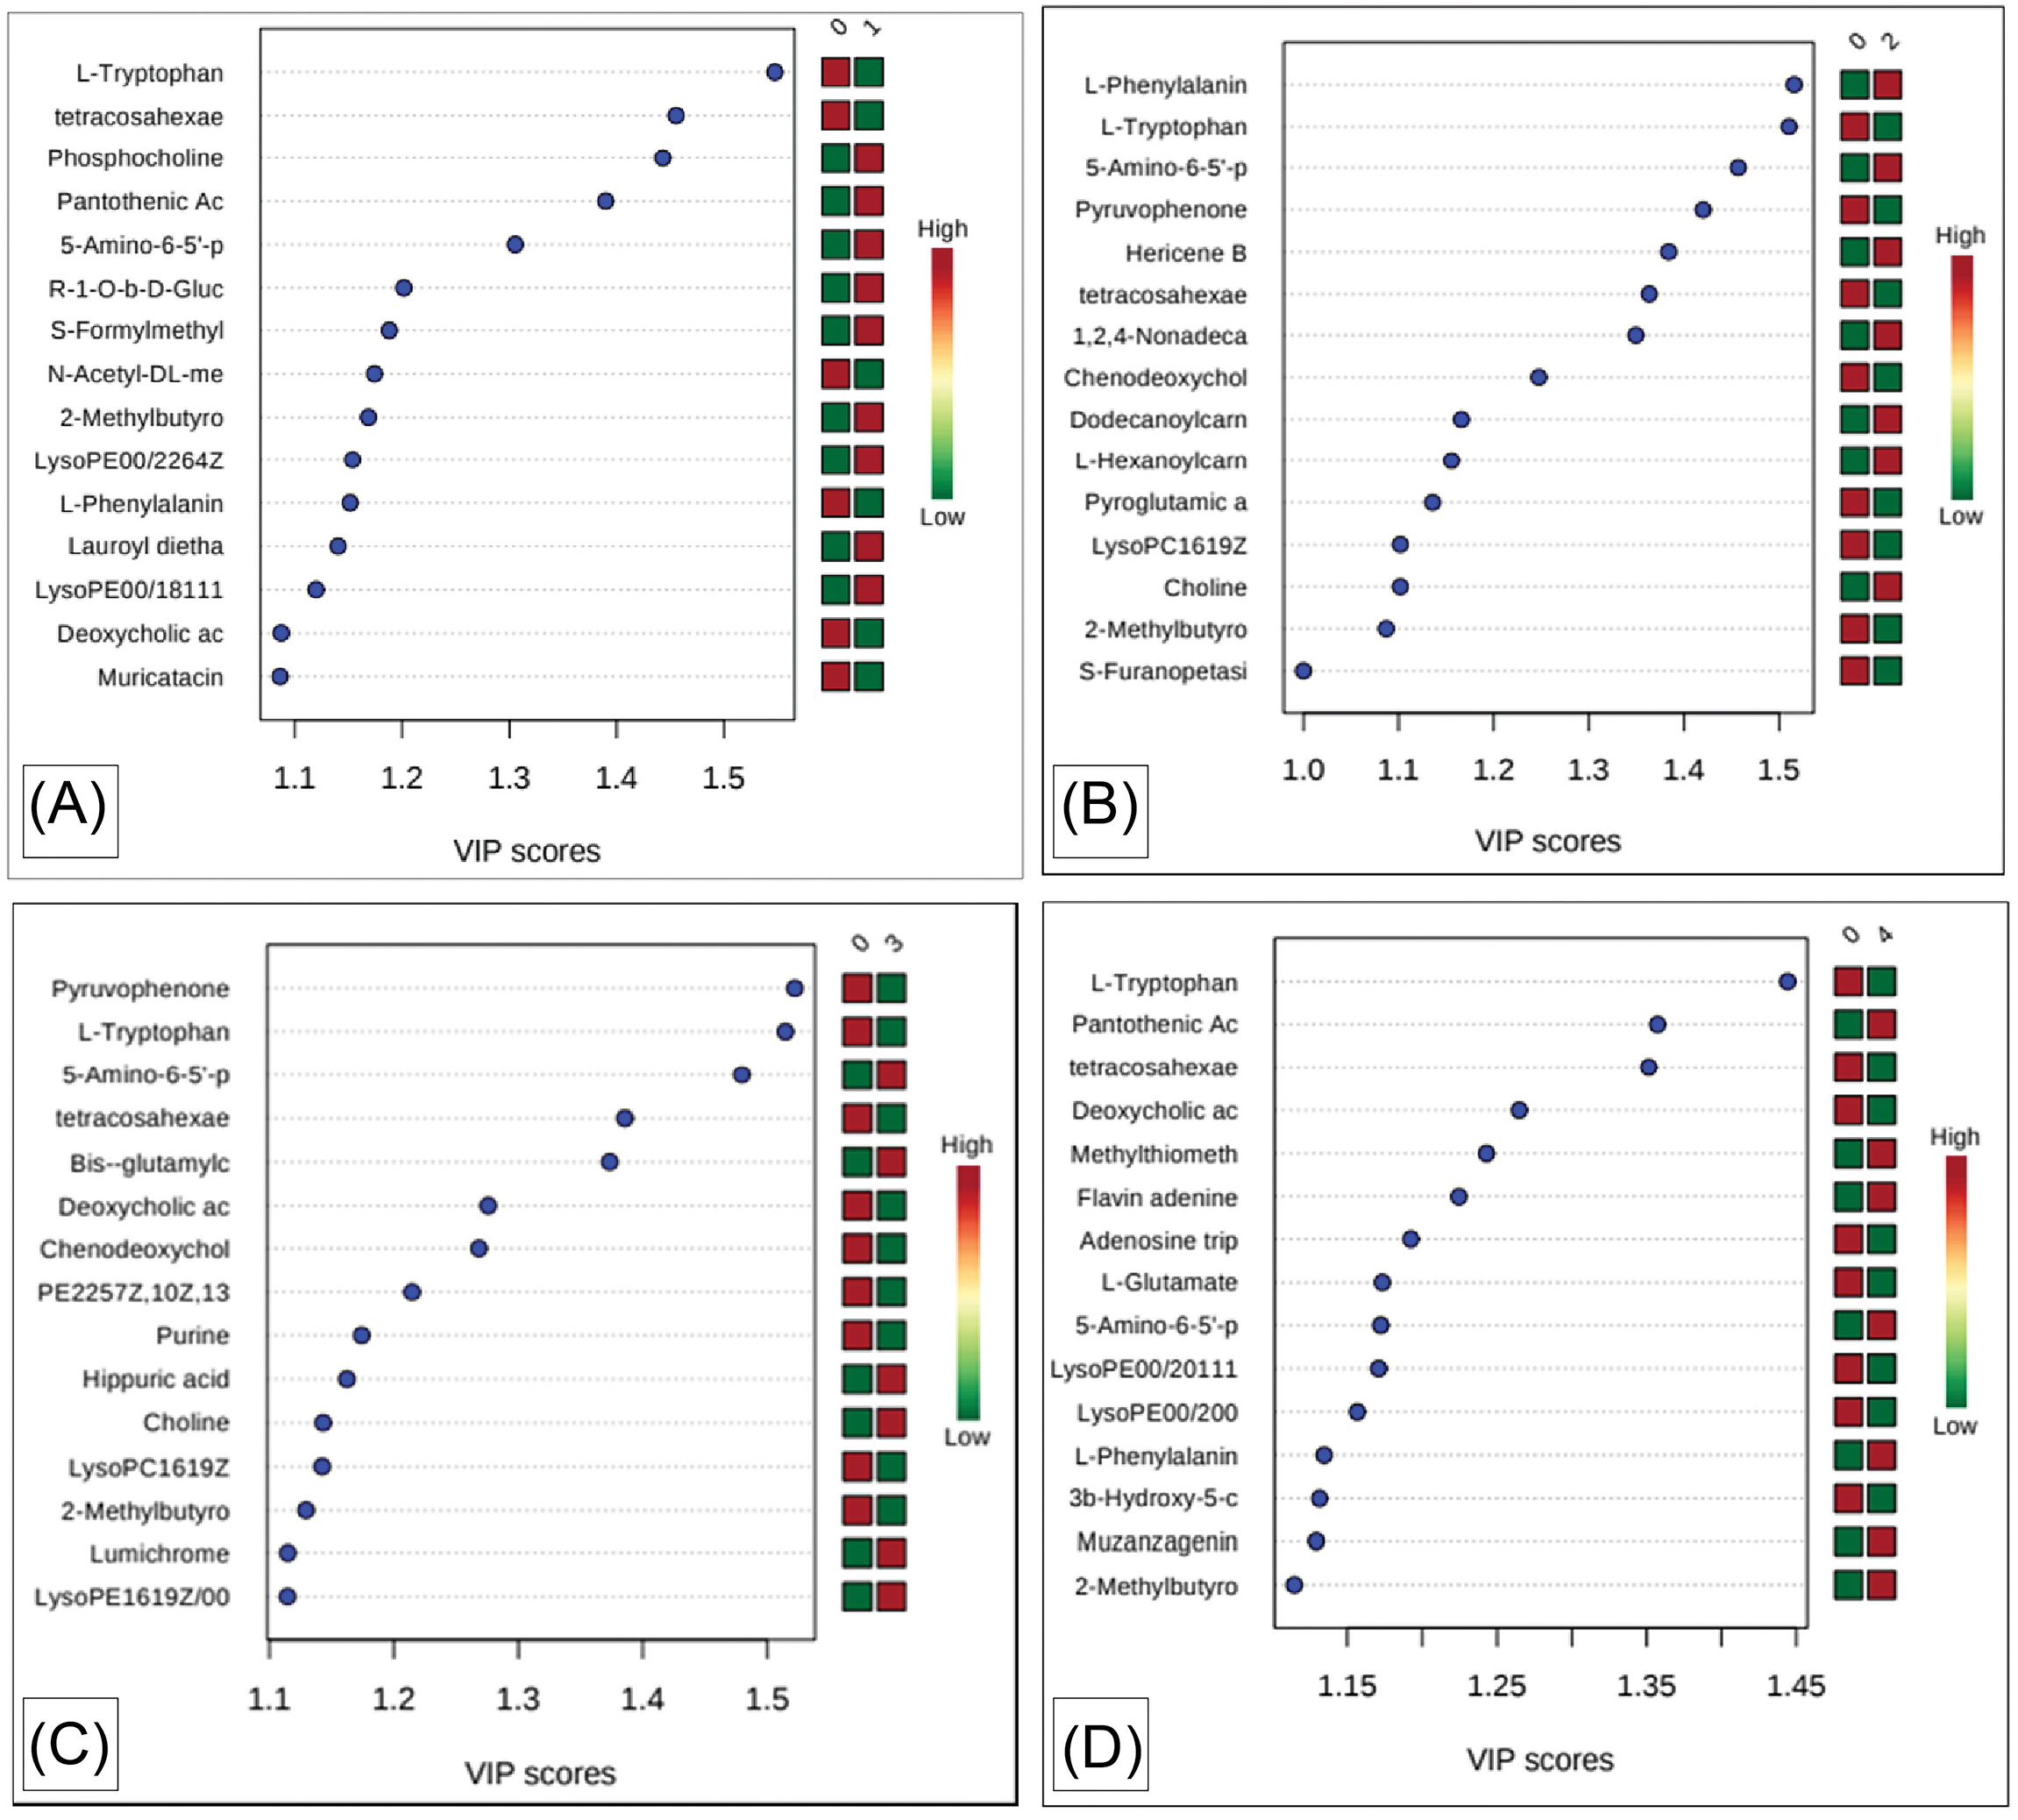
Fig. 4.
VIP scores of identified intracellular metabolites in CRC cells of different stages compared to normal colon cell. Note: Plot A; Normal (0) Vs Stage A (1). Plot B; Normal (0) Vs Stage B (2). Plot C; Normal (0) Vs Stage C (3). Plot D; Normal (0) Vs Stage D (4).
.
VIP scores of identified intracellular metabolites in CRC cells of different stages compared to normal colon cell. Note: Plot A; Normal (0) Vs Stage A (1). Plot B; Normal (0) Vs Stage B (2). Plot C; Normal (0) Vs Stage C (3). Plot D; Normal (0) Vs Stage D (4).
Table 1.
Differential metabolites profiles and their regulation in CRC cells of different stages compared to normal colon cells
|
Metabolites
|
Regulation
|
KEGG ID/HMDB
|
|
Stage A
|
Stage B
|
Stage C
|
Stage D
|
| (R)-1-O-[b-D-Glucopyranosyl-(1->6)-b-D-glucopyranoside]-1,3-octanediol |
↑ |
|
|
|
HMDB0032799 |
| 2-Methylbutyroylcarnitine |
↑ |
↓ |
↓ |
↑ |
HMDB0000378 |
| 3b-Hydroxy-5-cholenoic acid |
|
|
|
↓ |
HMDB0000308 |
| 5-Amino-6-(5'-phosphoribosylamino)uracil |
↑ |
↑ |
↑ |
↑ |
C01268 |
| Adenosine triphosphate (ATP) |
|
|
|
↓ |
C00002 |
| Bis-γ-glutamylcystine |
|
|
↑ |
|
C03646 |
| Chenodeoxycholic Acid |
|
↓ |
↓ |
|
C02528 |
| Choline |
|
↑ |
↑ |
|
C00114 |
| Deoxycholic acid |
|
|
↓ |
↓ |
C04483 |
| Dodecanoylcarnitine |
|
↑ |
|
|
HMDB0002250 |
| Flavin adenine dinucleotide (FAD) |
|
|
|
↑ |
C00016 |
| Hippuric acid |
|
|
↑ |
|
C01586 |
| L-Glutamate |
|
|
|
↓ |
C00025 |
| L-Hexanoylcarnitine |
|
↑ |
|
|
HMDB0000756 |
| L-Phenylalanine |
↓ |
↑ |
|
↑ |
C00079 |
| L-Tryptophan |
↓ |
↓ |
↓ |
↓ |
C00078 |
| LysoPC(16:1(9Z)) |
|
↓ |
↓ |
|
HMDB0010383 |
| LysoPE(0:0/18:1(11Z)) |
↑ |
|
|
|
HMDB0011475 |
| LysoPE(0:0/20:0) |
|
|
|
↓ |
HMDB0011481 |
| LysoPE(0:0/22:5(4Z,7Z,10Z,13Z,16Z)) |
↑ |
|
|
|
HMDB0011494 |
| LysoPE(16:1(9Z)/0:0) |
|
|
↑ |
|
HMDB0011504 |
| N-Acetyl-DL-methionine |
↓ |
|
|
|
HMDB0011745 |
| Pantothenic Acid |
↑ |
|
|
↑ |
C00864 |
| PE(22:5(7Z,10Z,13Z,16Z,19Z)/15:0) |
|
|
↓ |
|
HMDB0009648 |
| Phosphocholine |
↑ |
|
|
|
C00588 |
| Purine |
|
|
↓ |
|
HMDB0001366 |
| Pyroglutamic acid |
|
↓ |
|
|
HMDB0000267 |
| S-(Formylmethyl)glutathione |
↑ |
|
|
|
HMDB0060507 |
| Tetracosahexaenoic acid |
↓ |
↓ |
↓ |
↓ |
HMDB0002007 |
Based on the VIP score, the findings also revealed the metabolic pathways associated with differential metabolites in CRC of different stages. The result also revealed that there were several most important pathways affected by their impact and p-value as shown in Table 2.
Table 2.
The most important affected pathways in CRC cells of different stages
|
CRC stages
|
Affected pathways
|
P
value
|
Impact
|
|
A
|
Aminoacyl-tRNA biosynthesis |
1.30 x 10⁻²
|
0.00 |
| Phenylalanine, tyrosine and tryptophan biosynthesis |
1.54 x 10⁻²
|
0.50 |
| Phenylalanine metabolism |
3.81 x 10⁻²
|
0.35 |
| Pantothenate and CoA biosynthesis |
7.14 x 10⁻²
|
0.01 |
| Glycerophospholipid metabolism |
1.31 x 10⁻¹
|
0.01 |
| Tryptophan metabolism |
1.48 x 10⁻¹
|
0.14 |
|
B
|
Glycerophospholipid metabolism |
1.02 x 10⁻²
|
0.04 |
| Aminoacyl-tRNA biosynthesis |
1.79 x 10⁻²
|
0.00 |
| Phenylalanine, tyrosine and tryptophan biosynthesis |
1.80 x 10⁻²
|
0.50 |
| Phenylalanine metabolism |
4.44 x 10⁻²
|
0.36 |
| Glutathione metabolism |
1.20 x 10⁻¹
|
0.01 |
| Glycine, serine and threonine metabolism |
1.40 x 10⁻¹
|
0.00 |
| Tryptophan metabolism |
1.71 x 10⁻¹
|
0.14 |
| Primary bile acid biosynthesis |
1.90 x 10⁻¹
|
0.00 |
|
C
|
Glycerophospholipid metabolism |
1.24 x 10⁻³
|
0.15 |
| Phenylalanine metabolism |
6.29 x 10⁻²
|
0.00 |
| Glycosylphosphatidylinositol (GPI)-anchor biosynthesis |
8.70 x 10⁻²
|
0.00 |
| Glutathione metabolism |
1.67 x 10⁻¹
|
0.02 |
| Glycine, serine and threonine metabolism |
1.94 x 10⁻¹
|
0.00 |
| Tryptophan metabolism |
2.36 x 10⁻¹
|
0.14 |
| Primary bile acid biosynthesis |
2.61 x 10⁻¹
|
0.00 |
| Aminoacyl-tRNA biosynthesis |
2.71 x 10⁻¹
|
0.00 |
|
D
|
Aminoacyl-tRNA biosynthesis |
1.40 x 10⁻³
|
0.00 |
| Riboflavin metabolism |
2.05 x 10⁻²
|
0.00 |
| Phenylalanine, tyrosine and tryptophan biosynthesis |
2.05 x 10⁻²
|
0.50 |
| Nitrogen metabolism |
3.06 x 10⁻²
|
0.00 |
| D-Glutamine and D-glutamate metabolism |
3.06 x 10⁻²
|
0.50 |
| Phenylalanine metabolism |
5.06 x 10⁻²
|
0.36 |
| Arginine biosynthesis |
7.02 x 10⁻²
|
0.12 |
| Butanoate metabolism |
7.50 x 10⁻²
|
0.00 |
| Histidine metabolism |
7.98 x 10⁻²
|
0.00 |
| Pantothenate and CoA biosynthesis |
9.42 x 10⁻²
|
0.01 |
| Glutathione metabolism |
1.36 x 10⁻²
|
0.02 |
| Alanine, aspartate and glutamate metabolism |
1.36 x 10⁻¹
|
0.20 |
| Porphyrin and chlorophyll metabolism |
1.45 x 10⁻¹
|
0.00 |
| Glyoxylate and dicarboxylate metabolism |
1.54 x 10⁻¹
|
0.00 |
| Arginine and proline metabolism |
1.80 x 10⁻¹
|
0.09 |
| Tryptophan metabolism |
1.93 x 10⁻¹
|
0.14 |
| Purine metabolism |
2.91 x 10⁻¹
|
0.01 |
Discussion
Metabolomics is used to determine the overall metabolite composition in given biological samples. In cancer cells, there is an increased production of lactate from glucose, known as the Warburg effect.
29
The findings from global metabolomics studies using tissues from CRC patients showed the major metabolic pathways affected were those involved in energy production and utilization, redox status, and the metabolism of amino acid, choline, nucleotides, and lipid.
9
The present metabolomics study on CRC cells of different stages provided clear segregation between CRC cells and normal colon cells (Figs. 2 and 3). These findings indicate that all CRC cells showed significant changes in intracellular metabolites levels when compared with normal colon cell lines.
Based on the VIP score (Fig. 4), the most important differentiating metabolites were identified in CRC cell lines in individual stages compared to normal colon cell lines.
Some differential metabolites were common in all stages and include 2-methylbutyroylcarnitine, 5-amino-6-(5'-phosphoribosylamino)uracil, l-tryptophan, and tetracosahexaenoic acid. However, the enrichment of these common differential metabolites differed across the stages of CRC. 5-amino-6-(5'-phosphoribosylamino)uracil was up-regulated in all stages, l-tryptophan and tetracosahexaenoic acid were down-regulated in all stages, and 2-methylbutyroylcarnitine was up-regulated in stage A and D but down-regulated in stage B and C (Table 1).
5-amino-6-(5'-phosphoribosylamino)uracil was shown to be up-regulated in all stages. However, there are no previous reports on the alteration of this metabolite in CRC. 5-amino-6-(5'-phosphoribosylamino)uracil is involved in riboflavin metabolism.
30
Riboflavin metabolism is responsible for the biosynthesis of the flavocoenzymes, which are involved in several processes including redox homeostasis, bioenergetics pathways, deoxyribonucleic acid (DNA) repair mechanisms, remodeling of chromatin, protein structure, and apoptosis.
31
Thus, upregulation of 5-amino-6-(5'-phosphoribosylamino)uracil in CRC cells may affect the biosynthesis of flavocoenzymes and eventually will affect these relevant physiological processes.
L-tryptophan was shown to be down-regulated in all stages of CRC cells which agreed with the observation by Wang et al.
32
However, the expression of L-tryptophan was contrary to Wang et al., where they have reported that l-tryptophan was down-regulated only in CRC stage A and B. These contrary findings might be because Wang et al
32
used human tissues, while cell lines were used in the other studies. Tryptophan is one of the essential amino acids for humans.
33
The kynurenine pathway is the major route of tryptophan degradation,
34
and a decreased level of tryptophan observed may be associated with catabolism of tryptophan into kynurenine.
35
Kynurenine binds to aryl hydrocarbon receptor, promoting the generation of immune-suppressive T cells which support cancer development.
36
Tetracosahexaenoic acid was shown to be down-regulated across all the stages. Although alteration in tetracosahexaenoic acid is reported in cervical cancer, no reports were available in CRC.
37
Tetracosahexaenoic acid is a lipid molecule produced from docosahexaenoic acid (DHA).
38
Downregulation of tetracosahexaenoic acid in CRC may probably be due to dysregulation of DHA synthesis. Dysregulation of DHA is associated with alterations in the structure of membranes, functions of membrane protein, cellular signaling, and lipid mediator production.
39
We also found alterations in 2-methylbutyroylcarnitine in CRC, which is reported to be altered in other types of cancer,
40
in our study highlighting the involvement of 2-methylbutyroylcarnitine in CRC. We observed 2-methylbutyroylcarnitine was up-regulated in stages A and D but down-regulated in stages B and C. 2-methylbutyroylcarnitine is an acylcarnitine. Increased level of 2-methylbutyroylcarnitine in cancer is probably due to the alteration of metabolic pathways related to cell proliferation and energy metabolism in the tumor.
41
Some differential metabolites were identified in specific stages of CRC cell lines (Fig. 5), and these metabolites might be useful as potential metabolite biomarkers for the staging of CRC cell lines as well as illustrating the changes in metabolism as CRC progresses.
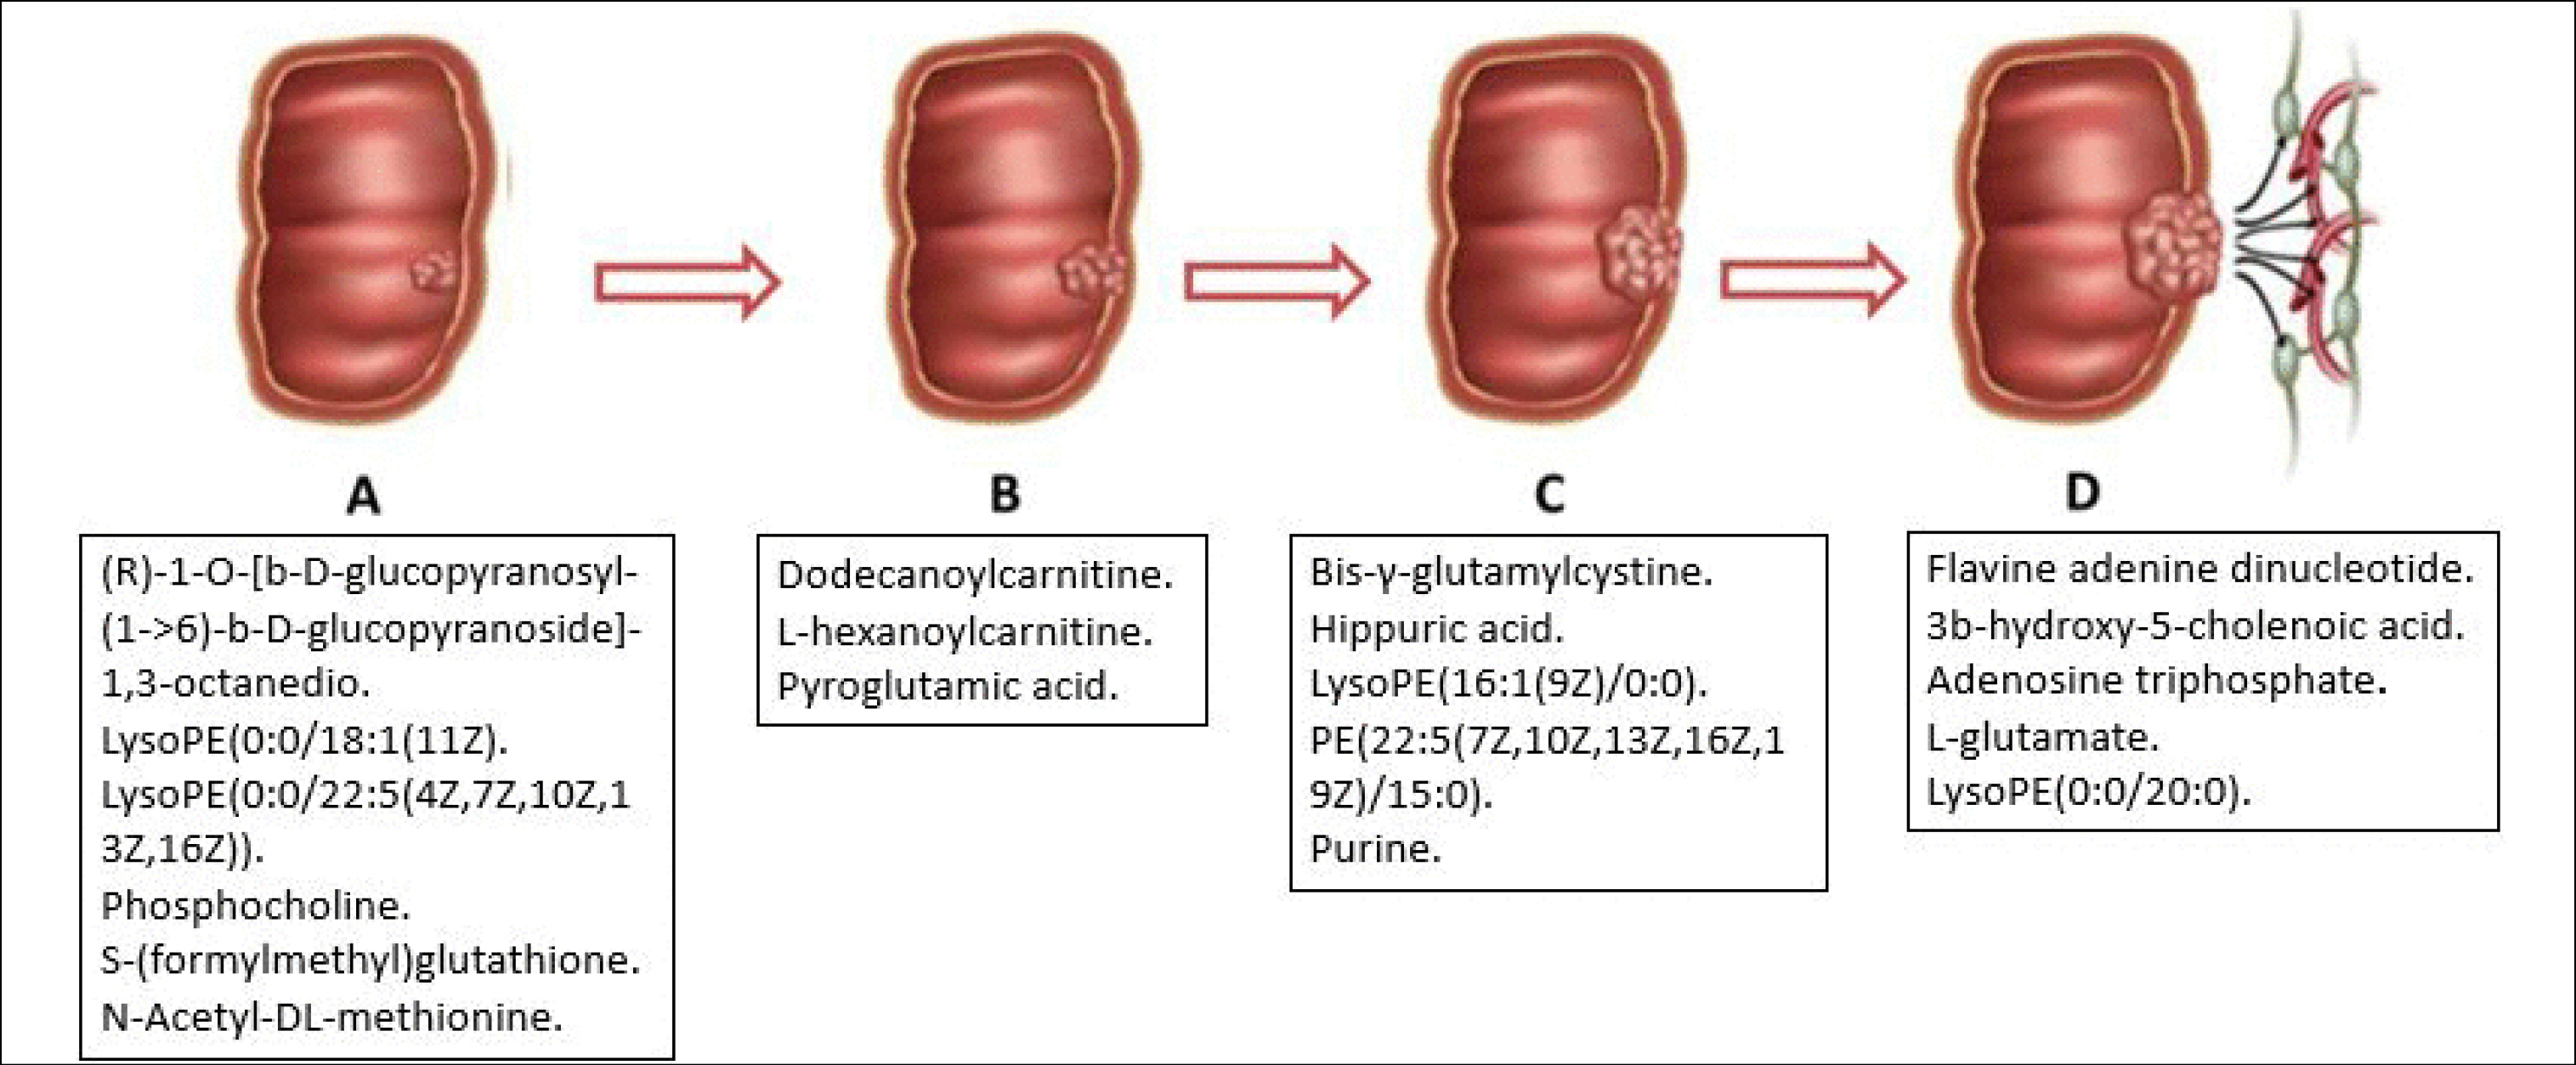
Fig. 5.
Schematic representation of differential metabolites unique to the stage of CRC cell lines compared to normal.
.
Schematic representation of differential metabolites unique to the stage of CRC cell lines compared to normal.
The differential metabolites in CRC stage A compared to normal may reflect the initial metabolic derangements or alterations in CRC development. C20H38O12, C23H46NO7P, C27H46NO7P), phosphocholine, S-(formylmethyl)glutathione, and N-Acetyl-DL-methionine were the most important differential metabolites identified in stage A. The expressions of these metabolites differed, where C20H38O12, phosphocholine, S-(formylmethyl)glutathione C23H46NO7P, and C27H46NO7P were up-regulated, and N-Acetyl-DL-methionine was down-regulated in stage A. This finding was contrary to another study by Zimmermann et al,
22
where they identified ketones and alcohols in CRC cells SW1116. The difference in expression is probably due to the use of different types of sample preparation, analytical platforms, and statistical analysis. Zimmermann et al
22
used GC-MS in their study, which preferentially detects low molecular mass metabolites.
42
C20H38O12, C23H46NO7P and C27H46NO7P are involved in lipid metabolism, and, hence, play important roles in the synthesis or breakdown of lipid molecules for energy or storage.
43
Hence, upregulation of these metabolites in the early stage of CRC (stage A) may reflect the role of lipid metabolism in favoring energy production for cancer development. Additionally, changes in the lipid metabolic pathway may also influence cell growth, proliferation, differentiation, and motility.
44
Phosphocholine is involved in choline and glycerophospholipid metabolism.
30
Upregulation of phosphocholine in cancer cells has been reported as a result of increased uptake of choline by the cells and increased intracellular choline kinase activity, which plays a vital role in cell proliferation.
45,46
S-(Formylmethyl)glutathione and N-Acetyl-DL-methionine are essential amino acids.
47
Upregulation of S-(formylmethyl)glutathione and downregulation of N-Acetyl-DL-methionine in the early stage of CRC cells (stage A) may reflect the role of amino acid metabolism, which act as building blocks for protein synthesis. Amino acids are also regulators of important signaling pathways and regulate gene expression, protein synthesis, nutrient metabolism, and oxidative status.
47,48
In stage B, the most important differential metabolites compared to normal colon cells were dodecanoylcarnitine, l-hexanoylcarnitine, and pyroglutamic acid. The data revealed that dodecanoylcarnitine and l-hexanoylcarnitine were up-regulated, while pyroglutamic acid was down-regulated. These findings were contrary to a previous report, where ketones and alcohols were the most important differential metabolites in CRC SW480 cells.
22
Dodecanoylcarnitine is involved in lipid metabolism. Upregulation of this metabolite in CRC cells stage B may reflect the role of lipid metabolism. L-hexanoylcarnitine is an acylcarnitine; therefore, upregulation of l-hexanoylcarnitine in CRC cells stage B may probably reflect the metabolic pathways related to cell growth and proliferation.
41
In CRC cells stage C, the most important differential metabolites identified were bis-γ-glutamylcystine, hippuric acid, C21H42NO7P, C42H74NO8P, and purine. The data shows bis-γ-glutamylcystine, hippuric acid, and C21H42NO7P were up-regulated, and C42H74NO8P and purine were down-regulated in CRC cells stage C. C21H42NO7P, and C42H74NO8P are involved in lipid metabolism
43
; thus, its alteration in CRC cells stage C may probably reflect the alteration of this pathway for cells growth and proliferation.
Bis-γ-glutamylcystine is involved in glutathione metabolism.
30
Hence, upregulation of bis-γ-glutamylcystine in CRC cells stage C might reflect the role of glutathione metabolism in preventing oxidative damage.
49
High level of glutathione in cancer tissues promotes tumor progression and increased metastasis.
50
Purines are basic components of nucleotides in cell proliferation. Therefore, impairment of purine metabolism in CRC cells stage C may affect many cellular functions such as alterations in the levels of DNA, RNA, energy production, signal transduction, and various other metabolic pathways that use the by-products of this purine metabolism as cofactors.
51
Impaired purine metabolism has been reported to be associated with the progression of various cancers.
52
FAD, 3b-hydroxy-5-cholenoic acid, ATP, l-glutamate, and C25H52NO7P) were the most important differential metabolites identified in CRC cells stage D. The results showed FAD was up-regulated, while 3b-hydroxy-5-cholenoic acid, ATP, l-glutamate, and C25H52NO7P) were down-regulated in CRC cells stage D.
In this study, we observed that L-glutamate is the most important differential metabolites in CRC cells stage D compared to normal colon cells. Tian et al.
4
previously reported up-regulation of L-glutamate; however, we found L-glutamate was down-regulated in our study. This difference may be because Tian et al.
4
used primary tissue samples, while in our study, cell lines were used. Hence, this illustrates the difference in in vitro and in vivo environments, where in vitro studies are conducted in a controlled environment, while metabolism in in vivo studies may be affected by several biological and endogenous factors.
Glutamate might play a role in the development of CRC. Increases in glutamate levels have been shown to stimulate tumor cell proliferation and motility by activation of glutamate receptors (GluRs).
53
In fact, glutamate receptors have been suggested to act as a potential growth factor in tumor development in CRC.
54
Until now, there are no reports on the alteration of FAD in CRC. FAD is involved in riboflavin metabolism.
30
Therefore, upregulation of FAD in CRC cells stage D may reflect the roles of riboflavin metabolism in energy production and utilization, maintenance of redox status, DNA repair mechanism, chromatin remodeling, protein structure, and apoptosis as described above.
31
ATP is the main source of energy for cell growth and proliferation. Decreased levels of ATP in CRC cells stage D reflect lower production of ATP due to the re-programming of their metabolic engines.
55
This phenomenon is known as Warburg effect, which involved switching biochemical pathways from favoring energy production to anabolic reactions that primarily support the growth and proliferation of cells.
55,56
Taken together, our findings revealed that the metabolite profiles in CRC cell lines corresponding to different stages of CRC differed significantly. Initially, in the early stage (stage A), lipid metabolism and amino acid metabolism were increased which favors energy production for cancer development and serves as building blocks for growth, respectively. As cancer progresses to stage B, metabolites present were mostly involved in lipid metabolism that is responsible for energy production. In stage C, the differential metabolites are mostly involved in lipid, glutathione, and purine metabolism that promote cancer progression and metastasis. However, in stage D, energy production is decreased, and metabolism is channeled to favor cell growth and proliferation. The differential metabolites identified in CRC cells of different stages indicate the requirements for each stage of CRC cells to support cell growth and proliferation. This stage-specific metabolic rewiring of CRC cells gives rise to unique metabolic signatures which can be useful in future in vitro studies for biomarker development and improving treatment strategies.
Conclusion
We identified several differential metabolites in CRC cell lines compared to normal colon cell lines, which were involved in metabolic rewiring favoring cell growth and proliferation.Our findings also revealed that there are specific differential metabolites at each stage of the disease.
These changes in metabolic profiles of CRC cells might represent the closest reflection of the phenotypes, which will help in interpreting the functional status of the cells. Thus, metabolic characterization is important in the development of in vitro models for future drug testing studies.
Acknowledgments
We thank Professor Dato' Dr. Mohd. Zaki Salleh, Professor Teh Lay Kek, and Mr. Mohd Izwan Mohamad Yusof from Integrative Pharmacogenomics Institute (iPROMISE), UiTM Campus Puncak Alam for their assistance in conducting this study.
Funding sources
This work is financially supported by the Department of Higher Education, Ministry of Education, Malaysia under the Long-Term Research Grant, No: LRGS/2014/ UKM-UiTM/K/03.
Ethical statement
There is none to be declared.
Competing interests
No potential conflict of interest was reported by the authors.
Authors’ contribution
HMY contributed to the idea, performed the data collection and analysis, and wrote the manuscript. SA contributed to the idea and reviewed the manuscript, WZWN and SN contributed to the idea. ARAJ contributed to the idea and obtained funding for this study. MM conceived the idea, contributed to the application for funding, reviewed and edited the manuscript.
Research Highlights
What is the current knowledge?
simple
-
√ Currently, metabolomics profiling on only three CRC cell lines (SW 1116, SW 480, and HT 29) is reported.
-
√ There are no reports on metabolomics profiling on other types of CRC cell lines.
What is new here?
simple
-
√ The current study performed global metabolomic studies on cell lines representing all 4 stages of CRC versus normal colon cancer and provided a comprehensive picture of the metabolic changes during development and progression of CRC. We further identified differential metabolites identified in each stage of CRC cell lines which could be useful in characterizing the stages of CRC cells.
References
- Schrimpe-Rutledge AC, Codreanu SG, Sherrod SD, McLean JA. Untargeted metabolomics strategies—challenges and emerging directions. J Am Soc Mass Spectrom 2016; 27:1897-905. doi: 10.1007/s13361-016-1469-y [Crossref] [ Google Scholar]
- Zhang A, Sun H, Xu H, Qiu S, Wang X. Cell metabolomics. OMICS 2013; 17:495-501. doi: 10.1089/omi.2012.0090 [Crossref] [ Google Scholar]
- Williams M, Zhang X, Park J-J, Siems W, Gang D, Resar L. Characterizing metabolic changes in human colorectal cancer. Anal Bioanal Chem 2015; 407:4581-95. doi: 10.1007/s00216-015-8662-x [Crossref] [ Google Scholar]
- Tian Y, Xu T, Huang J, Zhang L, Xu S, Xiong B. Tissue Metabonomic Phenotyping for Diagnosis and Prognosis of Human Colorectal Cancer. Sci Rep 2016; 6:20790. doi: 10.1038/srep20790 [Crossref] [ Google Scholar]
- Qiu YP, Cai GX, Su MM, Chen TL, Zheng XJ, Xu Y. Serum Metabolite Profiling of Human Colorectal Cancer Using GC-TOFMS and UPLC-QTOFMS. J Proteome Res 2009; 8:4844-50. doi: 10.1021/pr9004162 [Crossref] [ Google Scholar]
- Nishiumi S, Kobayashi T, Ikeda A, Yoshie T, Kibi M, Izumi Y. A novel serum metabolomics-based diagnostic approach for colorectal cancer. PloS One 2012; 7:e40459. doi: 10.1371/journal.pone.0040459 [Crossref] [ Google Scholar]
- Lin Y, Ma C, Liu C, Wang Z, Yang J, Liu X. NMR-based fecal metabolomics fingerprinting as predictors of earlier diagnosis in patients with colorectal cancer. Oncotarget 2016; 7:29454-64. doi: 10.18632/oncotarget.8762 [Crossref] [ Google Scholar]
- Halama A. Metabolomics in cell culture—a strategy to study crucial metabolic pathways in cancer development and the response to treatment. Arch Biochem Biophys 2014; 564:100-9. doi: 10.1016/j.abb.2014.09.002 [Crossref] [ Google Scholar]
- Yusof HM, Ab-Rahim S, Suddin LS, Saman MSA, Mazlan M. Metabolomics Profiling on Different Stages of Colorectal Cancer: A Systematic Review. Malays J Med Sci 2018; 25:16. doi: 10.21315/mjms2018.25.5.3 [Crossref] [ Google Scholar]
- Hashim A, Azmir N, Ab-Rahim S, Suddin LS, Saman A, Shahril M. Global serum metabolomics profiling of colorectal cancer. Mol Clin Oncol 2019; 11:3-14. doi: 10.3892/mco.2019.1853 [Crossref] [ Google Scholar]
- Čuperlović-Culf M, Barnett DA, Culf AS, Chute I. Cell culture metabolomics: applications and future directions. Drug Discov Today 2010; 15:610-21. doi: 10.1016/j.drudis.2010.06.012 [Crossref] [ Google Scholar]
- Lauri I, Savorani F, Iaccarino N, Zizza P, Pavone L, Novellino E. Development of an optimized protocol for NMR metabolomics studies of human colon cancer cell lines and first insight from testing of the protocol using DNA G-quadruplex ligands as novel anti-cancer drugs. Metabolites 2016; 6:4. doi: 10.3390/metabo6010004 [Crossref] [ Google Scholar]
- Teng Q, Huang W, Collette TW, Ekman DR, Tan C. A direct cell quenching method for cell-culture based metabolomics. Metabolomics 2009; 5:199. [ Google Scholar]
- Ser Z, Liu X, Tang NN, Locasale JW. Extraction parameters for metabolomics from cultured cells. Anal Biochem 2015; 475:22-8. doi: 10.1016/j.ab.2015.01.003 [Crossref] [ Google Scholar]
- Dettmer K, Nürnberger N, Kaspar H, Gruber MA, Almstetter MF, Oefner PJ. Metabolite extraction from adherently growing mammalian cells for metabolomics studies: optimization of harvesting and extraction protocols. Anal Bioanal Chem 2011; 399:1127-39. doi: 10.1007/s00216-010-4425-x [Crossref] [ Google Scholar]
- Bray F, Ferlay J, Soerjomataram I, Siegel RL, Torre LA, Jemal A. Global cancer statistics 2018: GLOBOCAN estimates of incidence and mortality worldwide for 36 cancers in 185 countries. CA Cancer J Clin 2018; 68:394-424. doi: 10.3322/caac.21492 [Crossref] [ Google Scholar]
- Dubuis S, Baenke F, Scherbichler N, Alexander LT, Schulze A, Zamboni N. Metabotypes of breast cancer cell lines revealed by non-targeted metabolomics. Metab Eng 2017; 43:173-86. doi: 10.1016/j.ymben.2016.12.009 [Crossref] [ Google Scholar]
- Gunda V, Kumar S, Dasgupta A, Singh PK. Hypoxia-induced metabolomic alterations in pancreatic cancer cells. Methods Mol Biol 2018; 1742:95-105. doi: 10.1007/978-1-4939-7665-2_9 [Crossref] [ Google Scholar]
- Bharti SK, Wildes F, Hung CF, Wu TC, Bhujwalla ZM, Penet MF. Metabolomic characterization of experimental ovarian cancer ascitic fluid. Metabolomics 2017; 13:113. doi: 10.1007/s11306-017-1254-3 [Crossref] [ Google Scholar]
- Jiang W, Zhou L, Lin S, Li Y, Xiao S, Liu J. Metabolic profiles of gastric cancer cell lines with different degrees of differentiation. Int J Clin Exp Pathol 2018; 11:869-875. [ Google Scholar]
- Graziani V, Scognamiglio M, Belli V, Esposito A, D’Abrosca B, Chambery A. Metabolomic approach for a rapid identification of natural products with cytotoxic activity against human colorectal cancer cells. Sci Rep 2018; 8(1):5309. doi: 10.1038/s41598-018-23704-9 [Crossref] [ Google Scholar]
- Zimmermann D, Hartmann M, Moyer MP, Nolte J, Baumbach JI. Determination of volatile products of human colon cell line metabolism by GC/MS analysis. Metabolomics 2007; 3:13-7. [ Google Scholar]
- Alcarraz-Vizán G, Sánchez-Tena S, Moyer MP, Cascante M. Validation of NCM460 cell model as control in antitumor strategies targeting colon adenocarcinoma metabolic reprogramming: trichostatin A as a case study. Biochim Biophys Acta 2014; 1840:1634-9. doi: 10.1016/j.bbagen.2013.12.024 [Crossref] [ Google Scholar]
- Ehrig K, Kilinc MO, Chen NG, Stritzker J, Buckel L, Zhang Q. Growth inhibition of different human colorectal cancer xenografts after a single intravenous injection of oncolytic vaccinia virus GLV-1h68. J Transl Med 2013; 11:79. doi: 10.1186/1479-5876-11-79 [Crossref] [ Google Scholar]
- Gatzidou E, Mantzourani M, Giaginis C, Giagini A, Patsouris E, Kouraklis G. Augmenter of liver regeneration gene expression in human colon cancer cell lines and clinical tissue samples. J BUON 2015; 20:84-91. [ Google Scholar]
- Hazwani Mohd Y, Sharaniza A-R, Wan Zurinah Wan N, Sheila N, Rahman AJA, Musalmah M. Metabolites profile of colorectal cancer cells at different stages. Int J App Pharm 2019:66-70. doi: 10.22159/ijap.2019.v11s1.T0051 [Crossref]
- Bannur Z, Teh L, Hennesy T, Rosli W, Mohamad N, Nasir A. The differential metabolite profiles of acute lymphoblastic leukaemic patients treated with 6-mercaptopurine using untargeted metabolomics approach. Clin Biochem 2014; 47:427-31. doi: 10.1016/j.clinbiochem.2014.02.013 [Crossref] [ Google Scholar]
- Guijas C, Montenegro-Burke JR, Domingo-Almenara X, Palermo A, Warth B, Hermann G. METLIN: a technology platform for identifying knowns and unknowns. Anal Chem 2018; 90:3156-64. doi: 10.1021/acs.analchem.7b04424 [Crossref] [ Google Scholar]
- Warburg O, Wind F, Negelein E. The metabolism of tumors in the body. J Gen Physiol 1927; 8:519. doi: 10.1085/jgp.8.6.519 [Crossref] [ Google Scholar]
- Kanehisa M, Sato Y, Furumichi M, Morishima K, Tanabe M. New approach for understanding genome variations in KEGG. Nucleic Acids Res 2018; 47:D590-D5. doi: 10.1093/nar/gky962 [Crossref] [ Google Scholar]
- Balasubramaniam S, Christodoulou J, Rahman S. Disorders of riboflavin metabolism. J Inherit Metab Dis 2019; 42(4):608-619. doi: 10.1002/jimd.12058 [Crossref] [ Google Scholar]
- Wang H, Wang L, Zhang H, Deng P, Chen J, Zhou B. ¹H NMR-based metabolic profiling of human rectal cancer tissue. Mol Cancer 2013; 12:121. doi: 10.1186/1476-4598-12-121 [Crossref] [ Google Scholar]
- Zhang HL, Zhang AH, Miao JH, Sun H, Yan GI, Wu FF. Targeting regulation of tryptophan metabolism for colorectal cancer therapy: a systematic review. RSC Advances 2019; 9:3072-80. doi: 10.1039/C8RA08520J [Crossref] [ Google Scholar]
- Crotti S, D’angelo E, Bedin C, Fassan M, Pucciarelli S, Nitti D. Tryptophan metabolism along the kynurenine and serotonin pathways reveals substantial differences in colon and rectal cancer. Metabolomics 2017; 13:148. doi: 10.1007/s11306-017-1288-6 [Crossref] [ Google Scholar]
- Grohmann U, Bronte V. Control of immune response by amino acid metabolism. Immunol Rev 2010; 236:243-64. doi: 10.1111/j.1600-065X.2010.00915.x [Crossref] [ Google Scholar]
- Mezrich JD, Fechner JH, Zhang X, Johnson BP, Burlingham WJ, Bradfield CA. An interaction between kynurenine and the aryl hydrocarbon receptor can generate regulatory T cells. J Immunol 2010; 185:3190-8. doi: 10.4049/jimmunol.0903670 [Crossref] [ Google Scholar]
- Yang K, Xia B, Wang W, Cheng J, Yin M, Xie H. A comprehensive analysis of metabolomics and transcriptomics in cervical cancer. Sci Rep 2017; 7:43353. doi: 10.1038/srep43353 [Crossref] [ Google Scholar]
- Ferdinandusse S, Denis S, Mooijer PA, Zhang Z, Reddy JK, Spector AA. Identification of the peroxisomal β-oxidation enzymes involved in the biosynthesis of docosahexaenoic acid. J Lipid Res 2001; 42:1987-95. [ Google Scholar]
- Calder PC. Docosahexaenoic acid. Ann Nutr Metab 2016; 69:8-21. doi: 10.1159/000448262 [Crossref] [ Google Scholar]
- Kanaan YM, Sampey BP, Beyene D, Esnakula AK, Naab TJ, Ricks-Santi LJ. Metabolic profile of triple-negative breast cancer in African-American women reveals potential biomarkers of aggressive disease. Cancer Genomics Proteomics 2014; 11:279-94. [ Google Scholar]
- Ganti S, Taylor SL, Kim K, Hoppel CL, Guo L, Yang J. Urinary acylcarnitines are altered in human kidney cancer. Int J Cancer 2012; 130:2791-800. doi: 10.1002/ijc.26274 [Crossref] [ Google Scholar]
- Qiu Y, Cai G, Su M, Chen T, Zheng X, Xu Y. Serum metabolite profiling of human colorectal cancer using GC−TOFMS and UPLC−QTOFMS. J Proteome Res 2009; 8:4844-50. doi: 10.1021/pr9004162 [Crossref] [ Google Scholar]
- Wishart DS, Feunang YD, Marcu A, Guo AC, Liang K, Vázquez-Fresno R. HMDB 4.0: the human metabolome database for 2018. Nucleic Acids Res 2018; 46:D608-D617. doi: 10.1093/nar/gkx1089 [Crossref] [ Google Scholar]
- Santos CR, Schulze A. Lipid metabolism in cancer. FEBS J 2012; 279:2610-23. doi: 10.1111/j.1742-4658.2012.08644.x [Crossref] [ Google Scholar]
- Eliyahu G, Kreizman T, Degani H. Phosphocholine as a biomarker of breast cancer: molecular and biochemical studies. Int J Cancer 2007; 120:1721-30. doi: 10.1002/ijc.22293 [Crossref] [ Google Scholar]
- Glunde K, Jie C, Bhujwalla ZM. Molecular causes of the aberrant choline phospholipid metabolism in breast cancer. Cancer Res 2004; 64:4270-6. doi: 10.1158/0008-5472.CAN-03-3829 [Crossref] [ Google Scholar]
- Wu G. Functional amino acids in growth, reproduction, and health. Adv Nutr 2010; 1:31-7. doi: 10.3945/an.110.1008 [Crossref] [ Google Scholar]
- Ananieva E. Targeting amino acid metabolism in cancer growth and anti-tumor immune response. World J Biol Chem 2015; 6:281. doi: 10.4331/wjbc.v6.i4.281 [Crossref] [ Google Scholar]
- Traverso N, Ricciarelli R, Nitti M, Marengo B, Furfaro AL, Pronzato MA. Role of glutathione in cancer progression and chemoresistance. Oxid Med Cell Longev 2013; 2013:972913. doi: 10.1155/2013/972913 [Crossref] [ Google Scholar]
- Bansal A, Simon MC. Glutathione metabolism in cancer progression and treatment resistance. J Cell Biol 2018; 217:2291-8. doi: 10.1083/jcb.201804161 [Crossref] [ Google Scholar]
-
Ichida K, Hosoyamada M, Hosoya T, Endou H. Primary metabolic and renal hyperuricemia. In: Lifton RP, Somlo S, Giebisch GH, Seldin DW, eds. Genetic Diseases of the Kidney. Academic Press; 2009. p. 651-660. 10.1016/B978-0-12-449851-8.00038-3
- Yin J, Ren W, Huang X, Deng J, Li T, Yin Y. Potential mechanisms connecting purine metabolism and cancer therapy. Front Immunol 2018; 9:1697. doi: 10.3389/fimmu.2018.01697 [Crossref] [ Google Scholar]
- Takano T, Lin JH-C, Arcuino G, Gao Q, Yang J, Nedergaard M. Glutamate release promotes growth of malignant gliomas. Nat Med 2001; 7:1010-5. doi: 10.1038/nm0901-1010 [Crossref] [ Google Scholar]
- Chang HJ, Yoo BC, Lim SB, Jeong SY, Kim WH, Park JG. Metabotropic glutamate receptor 4 expression in colorectal carcinoma and its prognostic significance. Clin Cancer Res 2005; 11:3288-95. doi: 10.1158/1078-0432.CCR-04-1912 [Crossref] [ Google Scholar]
-
Helsingin yliopisto (University of Helsinki). Cancer cell metabolism kills: Possible new therapies targeting energy supply of cancer cells? Science Daily 2013. Available rom: https://www.sciencedaily.com/releases/2013/04/130415172228.htm. Accessed August 20, 2019.
- Pavlova NN, Thompson CB. The emerging hallmarks of cancer metabolism. Cell Metab 2016; 23:27-47. doi: 10.1016/j.cmet.2015.12.006 [Crossref] [ Google Scholar]