Bioimpacts. 16:31007.
doi: 10.34172/bi.31007
Original Article
Moroccan virgin olive oil triterpenes: HPLC-DAD-ELSD profiling and computational investigation of anti-diabetic potential
Meryem Boutalaka Visualization, Writing – original draft, 1 
Noureddine Ouazzani Conceptualization, 2
Mohamed Ouabane Writing – original draft, 1
Panagiotis Stathopoulos Conceptualization, 3
Abdelkrim Guendouzi Software, Visualization, 4
Hamid Maghat Writing – review & editing, 1
Alexios-Leandros Skaltsounis Writing – review & editing, 3
Tahar Lakhlifi Supervision, 1
Mohammed Bouachrine Supervision, Writing – review & editing, 1, *
Author information:
1Department of Chemistry, Molecular Chemistry and Natural Substances Laboratory, Faculty of Science, University of Moulay Ismail, Meknes, Morocco
2Agro-pôle Olivier, National School of Agriculture of Meknes, BP S/40 Meknes, Morocco
3Department of Pharmacognosy and Natural Products Chemistry, Faculty of Pharmacy, University of Athens, 15771 Athens, Greece
4Department of Chemistry, Laboratory of Chemistry, Synthesis, Properties and Applications, Faculty of Science, University of Saida, Saida, Algeria
Abstract
Introduction:
Diabetes mellitus (DM) is a chronic metabolic disorder characterized by hyperglycemia due to impaired insulin secretion or resistance. Conventional treatments like acarbose, miglitol, and voglibose inhibit carbohydrate-digesting enzymes but often cause adverse effects and have bioavailability limitations. This has led to interest in plant-derived bioactive compounds as safer alternatives. Oleanolic and maslinic acids in Moroccan virgin olive oil have shown potent inhibitory activity against α-glucosidase and α-amylase, enzymes regulating postprandial glucose levels.
Methods:
This study quantified the levels of oleanolic and maslinic acids in olive oils from various Moroccan regions, considering factors such as olive variety, maturity index, production method, and geographic origin. Pharmacokinetic properties were assessed using in silico ADME analysis. Molecular docking was performed to evaluate inhibitory interactions with α-amylase and α-glucosidase. Molecular dynamics (MD) simulations (1000 ns) assessed complex stability, and MM-PBSA calculations determined binding free energies.
Results:
The concentrations of oleanolic and maslinic acids varied across olive oil samples. The Moroccan Picholine variety had the highest levels (58.3 mg/kg for maslinic acid and 55.06 mg/kg for oleanolic acid). Olive oil from the two-phase milling method contained higher concentrations than the three-phase system, and lower maturity index olives showed greater concentrations. Pharmacokinetic analysis indicated favorable drug-likeness properties for these bioactive compounds. In silico docking suggested notable binding of maslinic acid to α-amylase (-41.42 kJ/mol) and oleanolic acid to α-glucosidase (-32.22 kJ/mol), with interactions involving key amino acid residues. Molecular dynamics simulations indicated stable ligand-enzyme interactions, and MM-PBSA analysis estimated binding energies of -39.05±16.78 kJ/mol for the maslinic acid-α-amylase complex and -13.97±7.08 kJ/mol for the oleanolic acid-α-glucosidase complex.
Conclusion:
Moroccan virgin olive oil, rich in oleanolic and maslinic acids, may serve as a natural alternative for diabetes management by modulating key enzymatic pathways involved in glucose metabolism.
Graphical Abstract
Keywords: Moroccan virgin olive oil, Oleanolic acid, Maslinic acid, α-Amylase inhibition, α-Glucosidase inhibition, Molecular modeling
Copyright and License Information
© 2026 The Author(s).
This work is published by BioImpacts as an open access article distributed under the terms of the Creative Commons Attribution Non-Commercial License (
http://creativecommons.org/licenses/by-nc/4.0/). Non-commercial uses of the work are permitted, provided the original work is properly cited.
Funding Statement
This work was supported by the European Union Project OliveNet (EU 734899) and Agro-pôle Olivier.
Introduction
Diabetes mellitus is a chronic metabolic disorder characterized by persistent hyperglycemia caused by the body’s inability to produce sufficient insulin or properly utilize the insulin it produces.1 This imbalance disrupts glucose, protein, and lipid metabolism and can lead to various complications, including cardiovascular disease, neuropathy, and retinopathy.2 Controlling postprandial hyperglycemia is an important therapeutic approach for the treatment of diabetes, especially type 2 diabetes.3 An effective strategy is to inhibit carbohydrate-digesting enzymes, especially alpha-amylase and alpha-glucosidase, which play a vital role in the digestion and absorption of dietary carbohydrates.4
Alpha-amylase, found in saliva and the pancreas, breaks down complex polysaccharides such as starch into smaller oligosaccharides.5 These oligosaccharides are then further hydrolyzed by alpha-glucosidase, an enzyme present in the small intestine, into glucose, which is readily absorbed into the bloodstream.6 This rapid conversion of carbohydrates into glucose can cause postprandial spikes in blood sugar levels. Inhibiting these enzymes slows carbohydrate digestion and glucose absorption, promoting lower and more stable blood sugar levels.7 As a result, these enzymes are critical therapeutic targets for managing type 2 diabetes (Fig. 1).
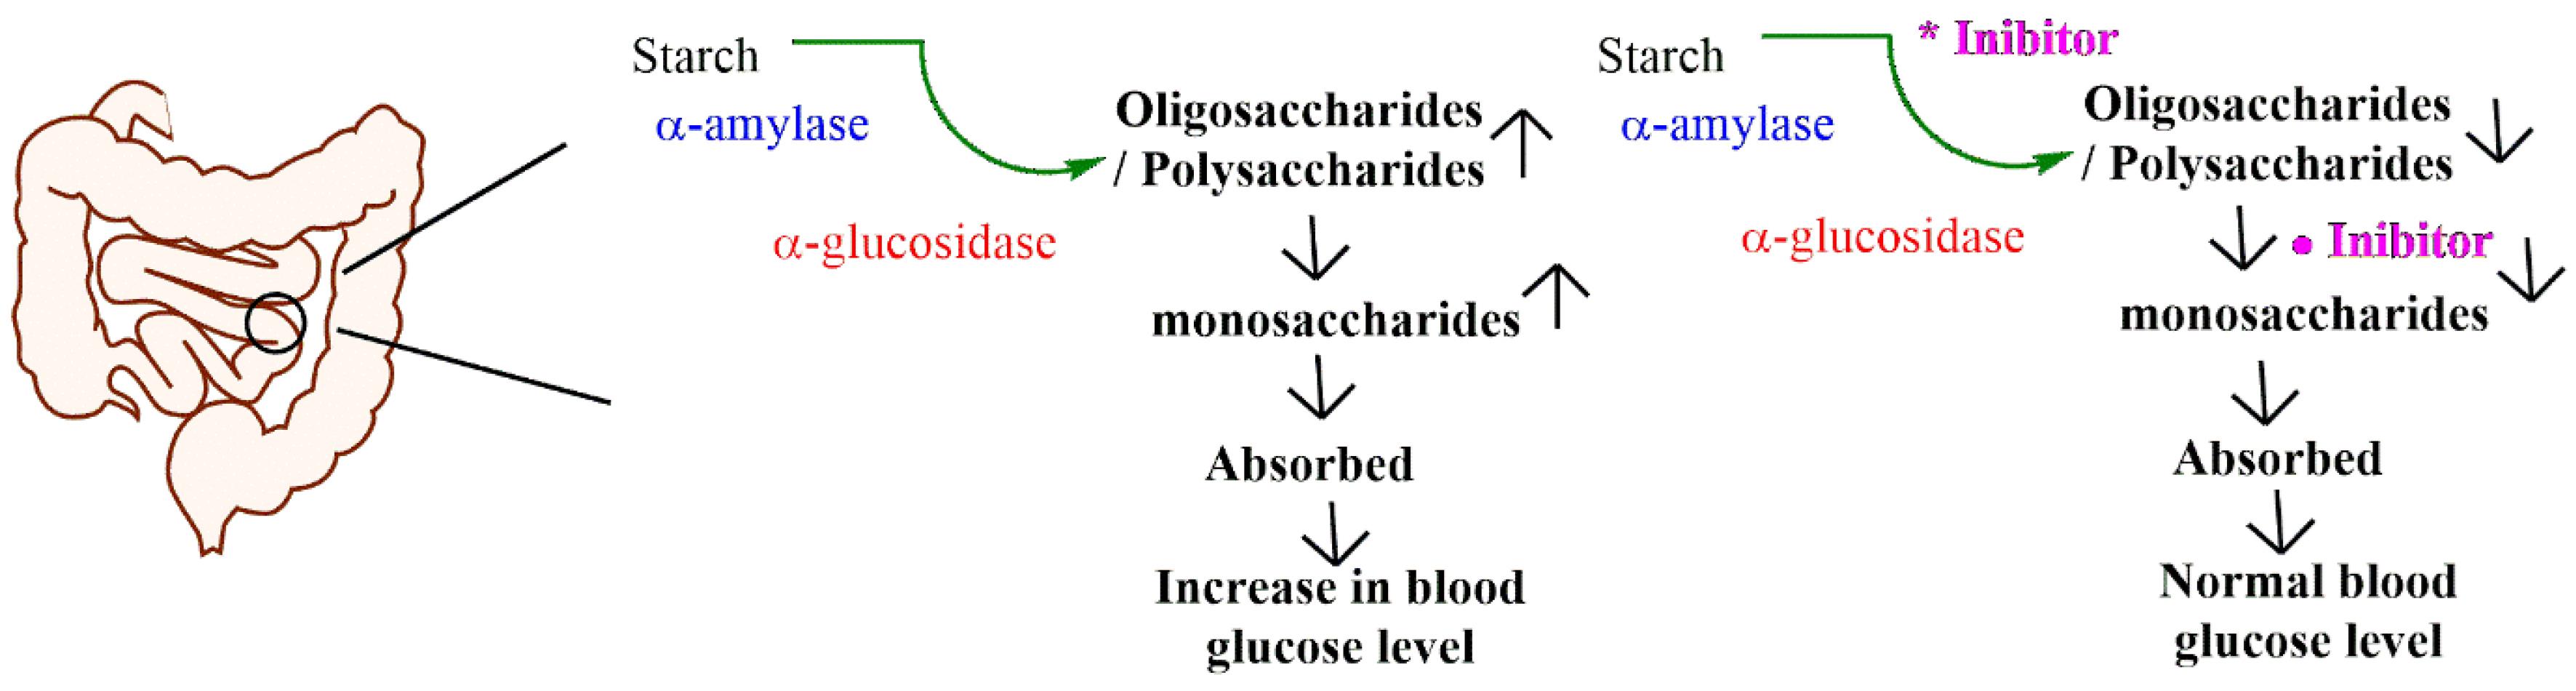
Fig. 1.
Role of α-amylase, α-glucosidase in starch digestion and metabolism.
.
Role of α-amylase, α-glucosidase in starch digestion and metabolism.
Conventional medications such as acarbose, miglitol, and voglibose inhibit alpha-amylase and alpha-glucosidase, but their use is often associated with gastrointestinal side effects, including bloating and flatulence.8,9 This has led to growing interest in natural inhibitors, particularly plant-derived compounds, which offer a safer alternative with fewer side effects.
Natural products have a long history of use in traditional medicine for the treatment of diabetes. Moroccan virgin olive oil (VOO), largely derived from the Picholine olive species, is a prime example of a natural product with both culinary and therapeutic benefits.10 Morocco is well-known for its high-quality olive oil, which contains beneficial compounds such as polyphenols and triterpenes.11 Among these, maslinic acid and oleanolic acid, two important triterpenes found in Moroccan VOO, have received a lot of attention for their substantial anti-diabetic, anti-inflammatory, and antioxidant properties.12,13
Maslinic acid and oleanolic acid are the primary triterpenes found in virgin olive oil (Fig. 2), with their concentrations varying depending on factors such as olive variety, ripeness, and the extraction process used.14,15 These compounds have been shown to exhibit a range of biological activities, including protection against oxidative stress, inflammation, and diabetes.16,17 Recent studies have emphasized their potential as natural inhibitors of alpha-amylase and alpha-glucosidase, suggesting that they may help regulate blood glucose levels by reducing the digestion and absorption of carbohydrates.18,19
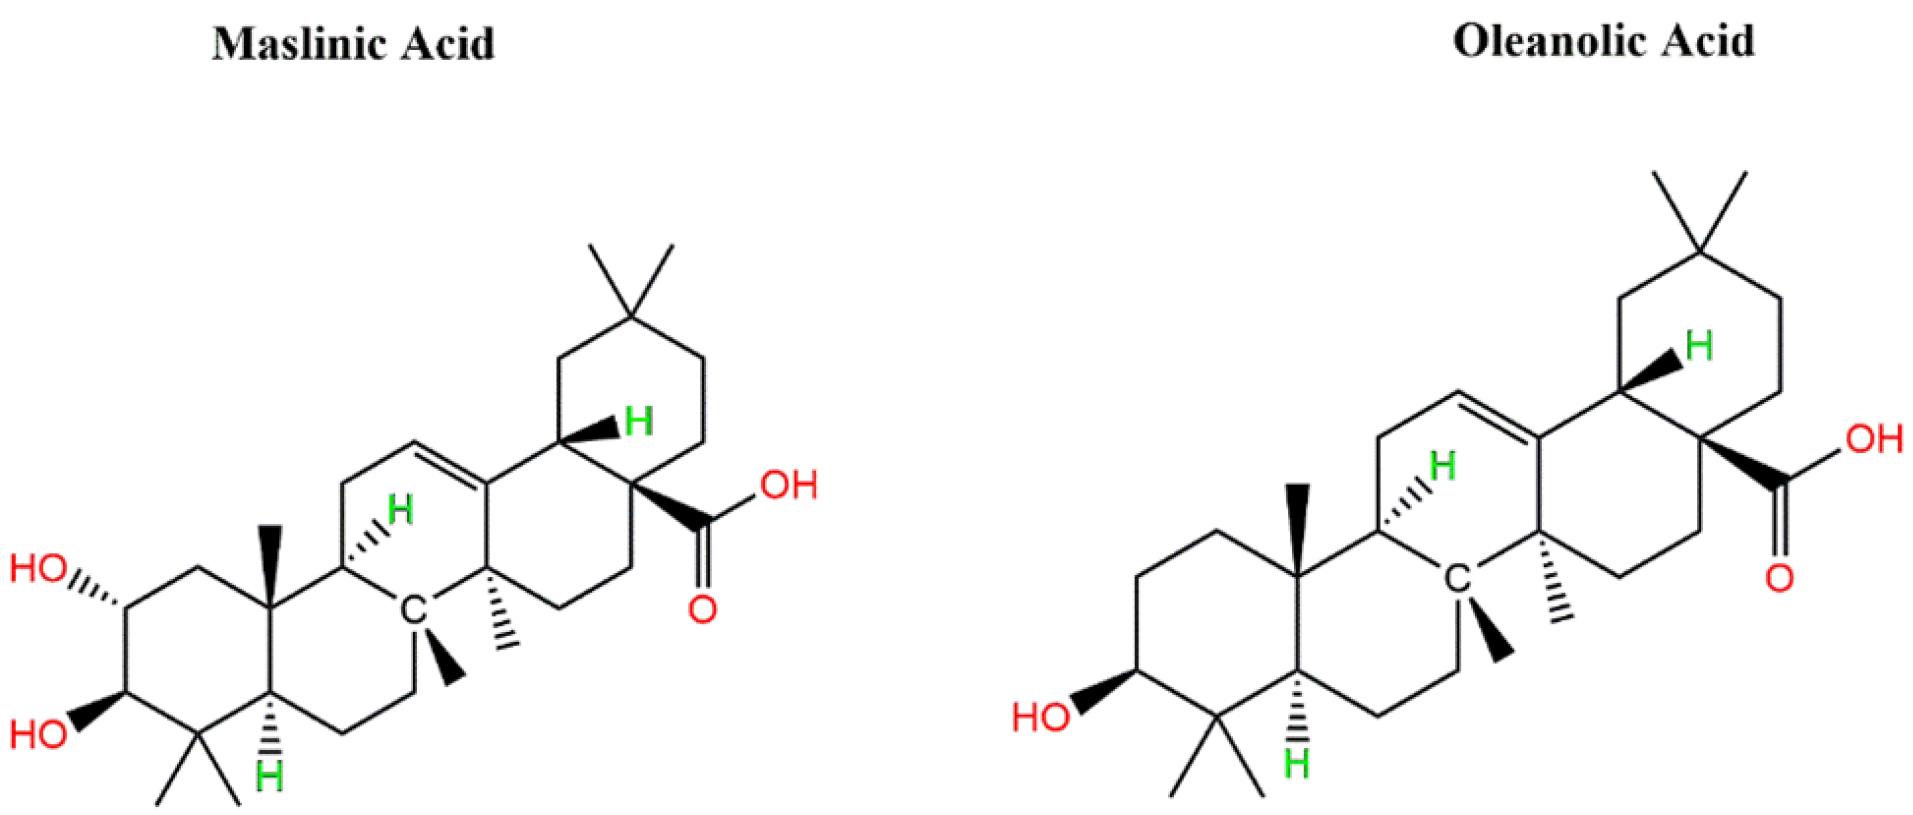
Fig. 2.
Chemical structures of maslinic acid and oleanolic acid found in virgin olive oil.
.
Chemical structures of maslinic acid and oleanolic acid found in virgin olive oil.
In this study, we conducted a comprehensive chemical analysis of 15 Moroccan virgin olive oil samples, focusing on how agronomic and technological factors influence the levels of terpene compounds. Additionally, in silico methods, including molecular docking, ADME-Tox analysis, and molecular dynamics simulations, were employed to investigate the inhibitory effects of maslinic acid and oleanolic acid on alpha-amylase and alpha-glucosidase. By combining chemical analysis with computational approaches, this research aims to reveal the mechanisms through which these triterpenes exert their anti-diabetic effects. Finally, the study seeks to provide valuable insights into the potential of Moroccan virgin olive oil as a functional food for diabetes management, further supporting its traditional use and expanding its therapeutic applications.
Materials and Methods
Plant material
The study included 15 virgin olive oil (VOO) samples numbered OLE01, OLE03, OLE04, OLE05, OLE06, OLE08, OLE10, OLE11, OLE12, OLE13, OLE14, OLE15, OLE17, OLE18, and OLE20. The samples were taken from different olive varieties grown in Morocco, including Picholine Morocco, Picholine Languedoc, Koroneiki, Arbosana, and Picual. The oils were produced in different geographical locations, production systems, agricultural types, and maturity levels, as shown in Table 1. To ensure the quality and storability of the oil, the oils were stored in amber bottles. The bottles were sealed immediately after production and kept in the dark. All samples were evaluated and classified as virgin olive oil according to EU regulations.
Table 1.
Characteristics of olive oil samples based on variety, geographical origin, production system, and maturity index
|
Sample code
|
Variety
|
Geographical origin
|
Production system
|
Agricultural type
|
Maturity index
|
| OLE01 |
Moroccan Picholine |
Meknes-Elhajeb |
Two-phase mill |
Irrigated |
1.8 |
| OLE03 |
Moroccan Picholine |
Meknes-My Driss Zerhoun |
Two-phase mill |
Irrigated |
1.7 |
| OLE04 |
Moroccan Picholine |
Rabat- Ain Aouda |
Two-phase mill |
Irrigated |
2.5 |
| OLE05 |
Picholine Languedoc |
Meknes |
Two-phase mill |
Irrigated |
1.5 |
| OLE06 |
Koroneiki |
Meknes- Ras jery |
Two-phase mill |
Irrigated |
3.5 |
| OLE08 |
Moroccan Picholine |
Meknes- Ras jery |
Two-phase mill |
Irrigated |
2 |
| OLE10 |
Arbosana /Picual |
Sefrou |
Two-phase mill |
Irrigated |
2 |
| OLE11 |
Moroccan Picholine |
Rabat- Ain Aouda |
Three-phase mill |
Non-irrigated |
2 |
| OLE12 |
Picholine Languedoc |
Sefrou |
Two-phase mill |
Irrigated |
1.8 |
| OLE13 |
Moroccan Picholine |
Marrakech |
Three-phase mill |
Non-irrigated |
2 |
| OLE14 |
Moroccan Picholine |
Sefrou |
Two-phase mill |
Irrigated |
0.16 |
| OLE15 |
Moroccan Picholine |
Marrakech |
Three-phase mill |
Irrigated |
3 |
| OLE17 |
Picholine Languedoc |
Meknes-Elhajeb |
Two-phase mill |
Irrigated |
1.5 |
| OLE18 |
Moroccan Picholine |
Meknes |
Two-phase mill |
Irrigated |
3 |
| OLE20 |
Moroccan Picholine |
Meknes-Elhajeb |
Two-phase mill |
Irrigated |
2 |
Chemicals
Water, methanol, acetonitrile, and formic acid were HPLC grade and purchased from Sigma Aldrich (Milan, Italy). In addition, maslinic acid and oleanolic acid were purchased from the same supplier as analytical standards. All solutions and solvents were filtered using 0.45 μm PVDF syringe filters from Sigma Aldrich before use.
Extraction, identification, and quantification of triterpenic acids (oleanolic acid and maslinic acid) in olive oils
To extract triterpenic acids, 4 g of olive oil were placed in a 50 mL test tube with a screw cap. Methanol (40 mL) was added. After shaking for 1 min, we extracted the solution in an ultrasonic bath for 10 min at room temperature. To separate the two phases, the emulsion was centrifuged at 4000 rpm for 15 min. The solvent extract was evaporated in vacuo. The supernatant was filtered using a 0.45 mm PVDF filter and an aliquot (20 μL) was used for HPLC analysis. 10 mg/mL was injected. For each sample, the extraction was performed at least three times. Analysis was performed using Agilent 1260 Infinity II HPLC equipped with DAD-ELSD (UV = 210nm) detector. The column was a C18 reverse-phase column (4.6 mm × 25 cm), type Spherisorb ODS-2 5 µm, 100 Aº. At a flow rate of 0.8 mL/ min, elution was performed at room temperature using a mixture of (15% water + 0.5% Formic acid (A)), acetonitrile (B) 85%. At 210 nm, the absorbance of the eluate was determined. Maslinic and oleanolic acids were quantified using standard curves (Fig. S1) plotted with pure maslinic and oleanolic acid solutions. Maslinic acid has a detection limit of 10 to 300 ppm, whereas oleanolic acid has a detection limit of 20 to 300 ppm.
In silico prediction of pharmacokinetics, ADME/Tox properties, and drug-likeness
Comprehensive ADME/Tox studies and drug-likeness predictions were performed on maslinic acid and oleanolic acid compounds to evaluate their bioavailability and pharmacological efficacy.20 Several pharmacokinetic factors have been extensively studied, including absorption, skin permeability, blood-brain barrier permeability, interactions with cytochrome P450 enzymes (CYP), toxicity, and synthetic accessibility. The study was performed using the web servers SwissADME (http://www.swissadme.ch/) and pkCSM (https://biosig.lab.uq.edu.au/pkcsm/prediction).21,22 The utilization of these two independent and established tools serves as an intrinsic cross-validation for the predicted ADME parameters, with consistency across the servers strengthening the reliability of the results. Furthermore, drug-likeness was evaluated using parameters established by Lipinski's Rule of Five and Veber's rules.
Molecular docking procedure
Molecular docking was employed to elucidate the binding modes and interaction profiles between the selected ligands and their target enzymes, providing atomic-level insights into ligand-receptor recognition.23,24 All docking simulations were performed using AutoDock Vina integrated with AutoDock Tools 1.5.6.25,26
Ligand preparation
The 3D structures of maslinic acid (PubChem CID: 73659) and oleanolic acid (PubChem CID: 10494) were retrieved from the PubChem database. Each ligand was energy-minimized at the DFT/B3LYP 6-31G(d,p) level to obtain the most stable conformation.27 The optimized structures were saved in.log format and converted to.pdbqt using AutoDock Tools 1.5.6 for docking analysis.25
Receptor preparation
The crystal structures of α-glucosidase (PDB ID: 3TOP) and α-amylase (PDB ID: 1SMD) were retrieved from the RCSB Protein Data Bank.28,29 The 3TOP structure represents the C-terminal catalytic domain of human maltase-glucoamylase (MGAM), while 1SMD corresponds to human salivary α-amylase. Receptor preparation was performed in Discovery Studio 2020, where non-essential water molecules and heteroatoms were removed to clean the protein for docking.30
Docking setup
For α-glucosidase, docking was focused on the catalytic site, with the grid box centered at x = -24.4592, y = 20.0948, and z = 48.0465, and dimensions of 40 × 40 × 40 Å. For α-amylase, blind docking was performed due to the absence of a clearly defined binding pocket. AutoDockTools 1.5.6 was then used for docking-specific preprocessing, including the addition of polar hydrogens, assignment of Gasteiger charges, and conversion of all structures into.pdbqt format to ensure compatibility with AutoDock Vina.31
Validation and visualization
The reliability of the docking protocol was confirmed by re-docking the native ligand, ensuring that the root-mean-square deviation (RMSD) between the experimental and predicted poses was below 2.0 Å.32 Docking poses and molecular interactions were analyzed and visualized using PyMOL (Version 2.0, Schrödinger, LLC) and Discovery Studio 2020.30
MD simulation
In this study, GROMACS 2023 was used to simulate the molecular dynamics (MD) of α-amylase and α-glucosidase complexes with maslinic and oleanolic acids. The docking poses generated by AutoDock Vina served as the starting structures and were prepared using CHARMM-GUI with the CHARMM36m force field for the proteins, while ligand topologies were generated using the CHARMM General Force Field (CGenFF) version 4.6, ensuring full compatibility and reproducibility. Each complex was embedded in a cubic water box with TIP3P water molecules, and Na+/Cl- ions (0.15 M) were added to neutralize the system and mimic physiological conditions.33
The systems were first energy-minimized using a steepest descent algorithm to remove geometric conflicts. Equilibration was then performed in two sequential phases: a 200 ps NVT ensemble (constant number of particles, volume, and temperature) using the V-rescale thermostat to stabilize the temperature at 310 K, followed by a 200 ps NPT ensemble (constant number of particles, pressure, and temperature) using the V-rescale thermostat and Parrinello–Rahman barostat to maintain a reference pressure of 1.0 bar.34
Following equilibration, MD production simulations were carried out for 1000 ns, integrating Newton’s equations of motion to simulate the atomic dynamics. Trajectories were analyzed using GROMACS’ integrated tools, including gmx rms for structural stability, gmx rmsf for flexibility, and gmx gyrate for compactness.
For MM-PBSA binding energy calculations, 5000 statistically independent frames were extracted from the 1000 ns trajectory by sampling every 200 ps.35 The internal dielectric constant was set to 2 for the protein-ligand system, and the external dielectric constant was set to 80 for the solvent, enabling accurate determination of polar solvation energies and binding free energies of maslinic and oleanolic acids with α-amylase and α-glucosidase.
Binding free energy (MM/PBSA calculations)
MM/PBSA (Molecular Mechanics/Poisson−Boltzmann Surface Area) calculations were carried out with g_mmpbsa, a GROMACS program designed to predict binding affinity.36 Generally, the binding free energy of the protein with ligand in solvent can be expressed as:
Eq. (1)
Where, ∆GComplexis the total free energy of the protein–ligand complex, and ∆GProtein and ∆GLignad are total free energies of the isolated protein and ligand in solvent, respectively.
Results and Discussion
Impact of olive variety and geographical origin on bioactive compound concentration
The analyses of maslinic acid and oleanolic acid in Moroccan virgin olive oil samples are detailed in Tables S1 and S2 and illustrated in Fig. S2. These results provide insights into the concentrations of these compounds across different samples.
The concentrations of maslinic acid displayed significant variability, ranging from 2.71 mg/kg in OLE15 (Moroccan Picholine, Marrakech) to a high of 58.3 mg/kg in OLE13 (Moroccan Picholine, Marrakech). oleanolic acid levels also varied greatly, with some samples falling below the limit of detection (LOD) and others reaching a maximum of 55.06 mg/kg in OLE01 (Moroccan Picholine, Meknes-Elhajeb). These differences highlight how both olive variety and geographical origin impact the levels of these compounds. For example, the Moroccan Picholine varieties from Meknes-Elhajeb (OLE01 and OLE20) and Meknes (OLE18) displayed higher maslinic acid concentrations of 27.46 mg/kg, 26.07 mg/kg, and 19.6 mg/kg, respectively, when compared to other samples. Conversely, the Picholine Languedoc varieties, such as OLE05 from Meknes and OLE17 from Meknes-Elhajeb, exhibited moderate maslinic acid levels of 9.81 mg/kg and 13.1 mg/kg, respectively, demonstrating the variability among different varieties. The concentrations of oleanolic acid in samples of Moroccan Picholine exhibited significant variability, with OLE01 displaying the highest level at 55.06 mg/kg. In contrast, several other samples, such as OLE05 and OLE10, recorded values that fell below the limit of detection (LOD). Notably, OLE13 from Marrakech had a substantial oleanolic acid concentration of 42.15 mg/kg, indicating that particular regional factors might promote the accumulation of this compound.
Impact of production system and agricultural type
The concentration of maslinic and oleanolic acids is greatly influenced by the type of agriculture and the production system employed. Samples processed through the two-phase mill system, including OLE01, OLE03, and OLE05, typically showed elevated levels of both acids. For example, OLE01 recorded a maslinic acid concentration of 27.46 mg/kg, while OLE03 had 8.21 mg/kg, suggesting that the two-phase mill system is more effective in preserving these compounds in comparison to the three-phase mill system.
The three-phase mill system, which consumes a greater amount of water, seems to reduce the concentrations of these acids. This is illustrated by the diminished levels of maslinic and oleanolic acids found in samples such as OLE11 and OLE13, which were processed with the three-phase mill system. For instance, OLE11 exhibited maslinic acid levels of 6.33 mg/kg and oleanolic acid levels of 16.36 mg/kg.
Maturity index influence
The maturity index during harvest has a substantial impact on maslinic and oleanolic acid concentrations. Samples harvested at lower maturity indices generally exhibited higher concentrations (Fig. S3). For example, OLE05 and OLE17, both with maturity indices of 1.5, had significantly high maslinic acid levels of 9.81 mg/kg and 13.1 mg/kg. Similarly, these samples included more oleanolic acid, showing that early harvesting helps to maintain larger amounts of these compounds.
In contrast, samples with higher maturity indices, such as OLE06 and OLE18, had lower levels of both acids. For example, OLE06 exhibited maslinic acid and oleanolic acid values of 19.14 mg/kg and 18.99 mg/kg, respectively, which were lower than those in early-harvest samples. This implies that these compounds decrease as olives mature.
Drug-likeness prediction
Drug-likeness reflects a compound's molecular and structural properties that determine its potential as a therapeutic agent.37 A widely accepted guideline is Lipinski's Rule of Five, which suggests that molecules are more likely to be orally bioavailable if they have a molecular weight (MW) < 500 Da, LogP < 5, hydrogen bond donors (HBD) < 5, and hydrogen bond acceptors (HBA) < 10.38
The predicted pharmacokinetic properties of maslinic acid and oleanolic acid were analyzed (Table S3). Both compounds satisfy Lipinski’s criteria, with MWs below 500 Da, LogP values within the optimal range ( < 5), and HBD and HBA counts compatible with good oral absorption, lipid solubility, and membrane permeability.
Total polar surface area (TPSA) is another key factor for bioavailability, with values < 140 Å2 generally considered favorable for target binding. Maslinic acid and oleanolic acid show TPSA values within this range, suggesting good predicted bioavailability.
Additionally, both compounds have synthetic accessibility (SA) values < 10 (where 1 is easiest and 10 is hardest to synthesize), indicating that these natural triterpenes could be feasibly produced.
Overall, the in-silico analysis predicts that maslinic acid and oleanolic acid possess favorable drug-likeness profiles, combining suitable physicochemical properties, bioavailability, and synthetic feasibility.
Results of ADMET/Tox predictions
The predicted pharmacokinetic and toxicity profiles of maslinic acid and oleanolic acid, alongside the reference drug Acarbose, are summarized in Table 2. These in silico results provide insights into their potential absorption, distribution, metabolism, excretion, and safety.
Table 2.
ADME-Tox profiling of maslinic acid, oleanolic acid, and acarbose
|
|
Compounds
|
|
Maslinic acid
|
Oleanolic acid
|
Acarbose
|
| Intestinal absorption (human) (%Absorbed) |
100 |
99.55 |
0 |
| Water solubility (log mol/L) |
-3.177 |
-3.261 |
-1.361 |
| VDss (human) (log L/Kg) |
-1.231 |
-1.009 |
-0.833 |
| BBB permeability (Log BB) |
-0.496 |
-0.143 |
-1.841 |
| CNS permeability (Log PS) |
-1.523 |
-1.176 |
-6.183 |
| CYP2D6 Substrate |
NO |
NO |
NO |
| CYP3A4 Substrate |
Yes |
Yes |
NO |
| CYP1A2 Inhibitior |
NO |
NO |
NO |
| CYP2C19 Inhibitior |
NO |
NO |
NO |
| CYP2C9 Inhibitior |
NO |
NO |
NO |
| CYP2D6 Inhibitior |
NO |
NO |
NO |
| CYP3A4 Inhibitior |
NO |
NO |
NO |
| Total Clearance (Log mL/min/kg) |
-0.071 |
-0.081 |
0.619 |
| AMES toxicity |
NO |
NO |
NO |
Absorption and distribution
Maslinic acid and oleanolic acid have remarkable intestine absorption rates of 100% and 99.55%, respectively, showing great oral bioavailability. We note that the 100% prediction is a calculated probability based on optimal structural parameters within the in-silico model and is best interpreted as representing the highest possible potential for absorption, rather than a confirmed in-vivo value. Furthermore, water solubility, expressed in log mol/L, indicates that both terpenes have moderate solubility, which is favorable to efficient delivery, with values of -3.177 for maslinic acid and -3.261 for oleanolic acid. In instance, acarbose has a greater solubility (-1.361), indicating its hydrophilic character. In terms of distribution, both terpenes have modest volume of distribution (VDss) values: -1.231 for maslinic acid and -1.009 for oleanolic acid, showing that they may efficiently spread throughout the body. Furthermore, the blood-brain barrier (BBB) and central nervous system (CNS) permeability values indicate that these substances are unlikely to cross the BBB significantly. Specifically, the Log BB values (-0.496 for maslinic acid and -0.143 for oleanolic acid) are close to the threshold for passive penetration (LogBB ≈ -0.3), but are low enough to be considered low-risk for CNS exposure. This property is desirable for a drug targeting peripheral carbohydrate metabolism, as it reduces the risk of neurological side effects. In contrast, Acarbose demonstrates significantly lower CNS permeability (Log PS: -6.183), limiting its neurological applicability.
Metabolism
The metabolic analysis of maslinic acid and oleanolic acid demonstrates selective interaction with cytochrome P450 (CYP) enzymes. Both compounds are substrates for CYP3A4 but not for CYP2D6. Additionally, they do not exhibit inhibitory activity against CYP1A2, CYP2C19, CYP2C9, CYP2D6, or CYP3A4, indicating a low potential for hepatic metabolism disruptions or enzyme-mediated drug-drug interactions. Acarbose, on the other hand, neither acts as a substrate nor an inhibitor for any of the tested CYP enzymes, aligning with its unique metabolic pathway.
Excretion and toxicity
Excretion rates, as measured by total clearance values (log mL/ min/kg), indicate that maslinic acid and oleanolic acid are efficiently eliminated, with values of -0.071 and -0.081, respectively. These rates indicate a balanced elimination profile that allows for prolonged therapeutic doses without excessive accumulation. Acarbose has a higher clearance value of 0.619, indicating a quicker elimination rate, which may need more frequent dosing. In terms of toxicity, none of the terpenes tested positive for Ames mutagenicity, suggesting a minimal likelihood of genotoxic consequences. These findings suggest a favorable safety profile for their potential therapeutic use, based on in silico predictions. Similarly, Acarbose is not mutagenic, which supports its proven safety profile in clinical usage.
Docking validation
To validate the reliability of our docking protocol, we re-docked the native co-crystallized ligand, Acarbose, into the active site of α-glucosidase (PDB: 3TOP) (Fig. 3). The resulting RMSD of 0.76 Å indicates excellent agreement with the crystallographic pose, remaining well below the established 2.0 Å threshold for validation. This confirms the accuracy of our docking methodology and ensures confidence in the subsequent analysis of binding modes.
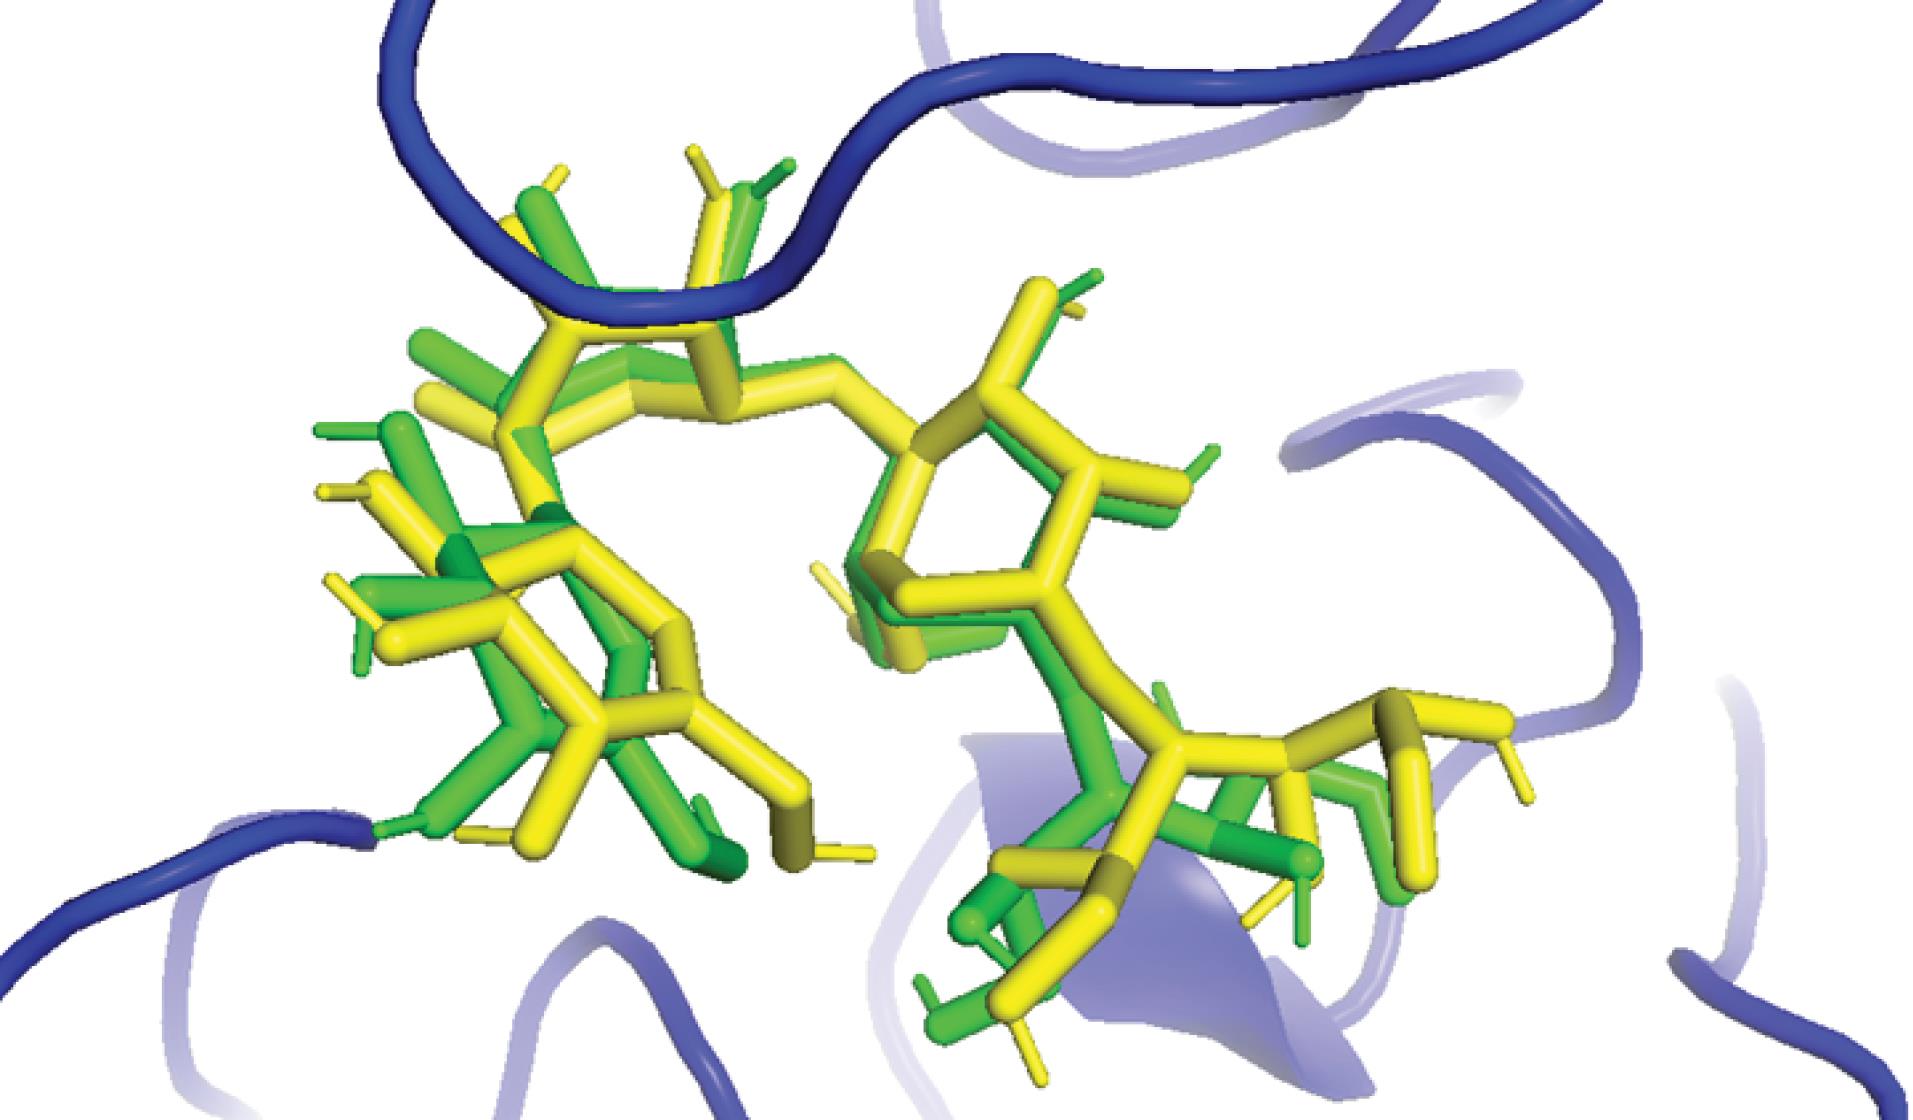
Fig. 3.
Superimposition of the native co-crystallized acarbose (green sticks) and the docked acarbose (yellow sticks).
.
Superimposition of the native co-crystallized acarbose (green sticks) and the docked acarbose (yellow sticks).
Docking results
To theoretically define the mechanism of anti-diabetic activity of the terpene compounds from Moroccan Olive Oil, a molecular docking study was performed using the AutoDock-Vina program.25 Table S4 presents the docking interactions of Maslinic Acid (M1 with α-amylase, M2 with α-glucosidase) and oleanolic acid (O1 with α-amylase, O2 with α-glucosidase), along with the reference drug Acarbose (A1 with α-amylase, A2 with α-glucosidase). The table presents binding affinities, hydrogen bonds, and hydrophobic interactions. Additionally, Figs. 4, 5, and 6 illustrate the non-bonded interactions between these enzymes and the compounds in 3D representations.
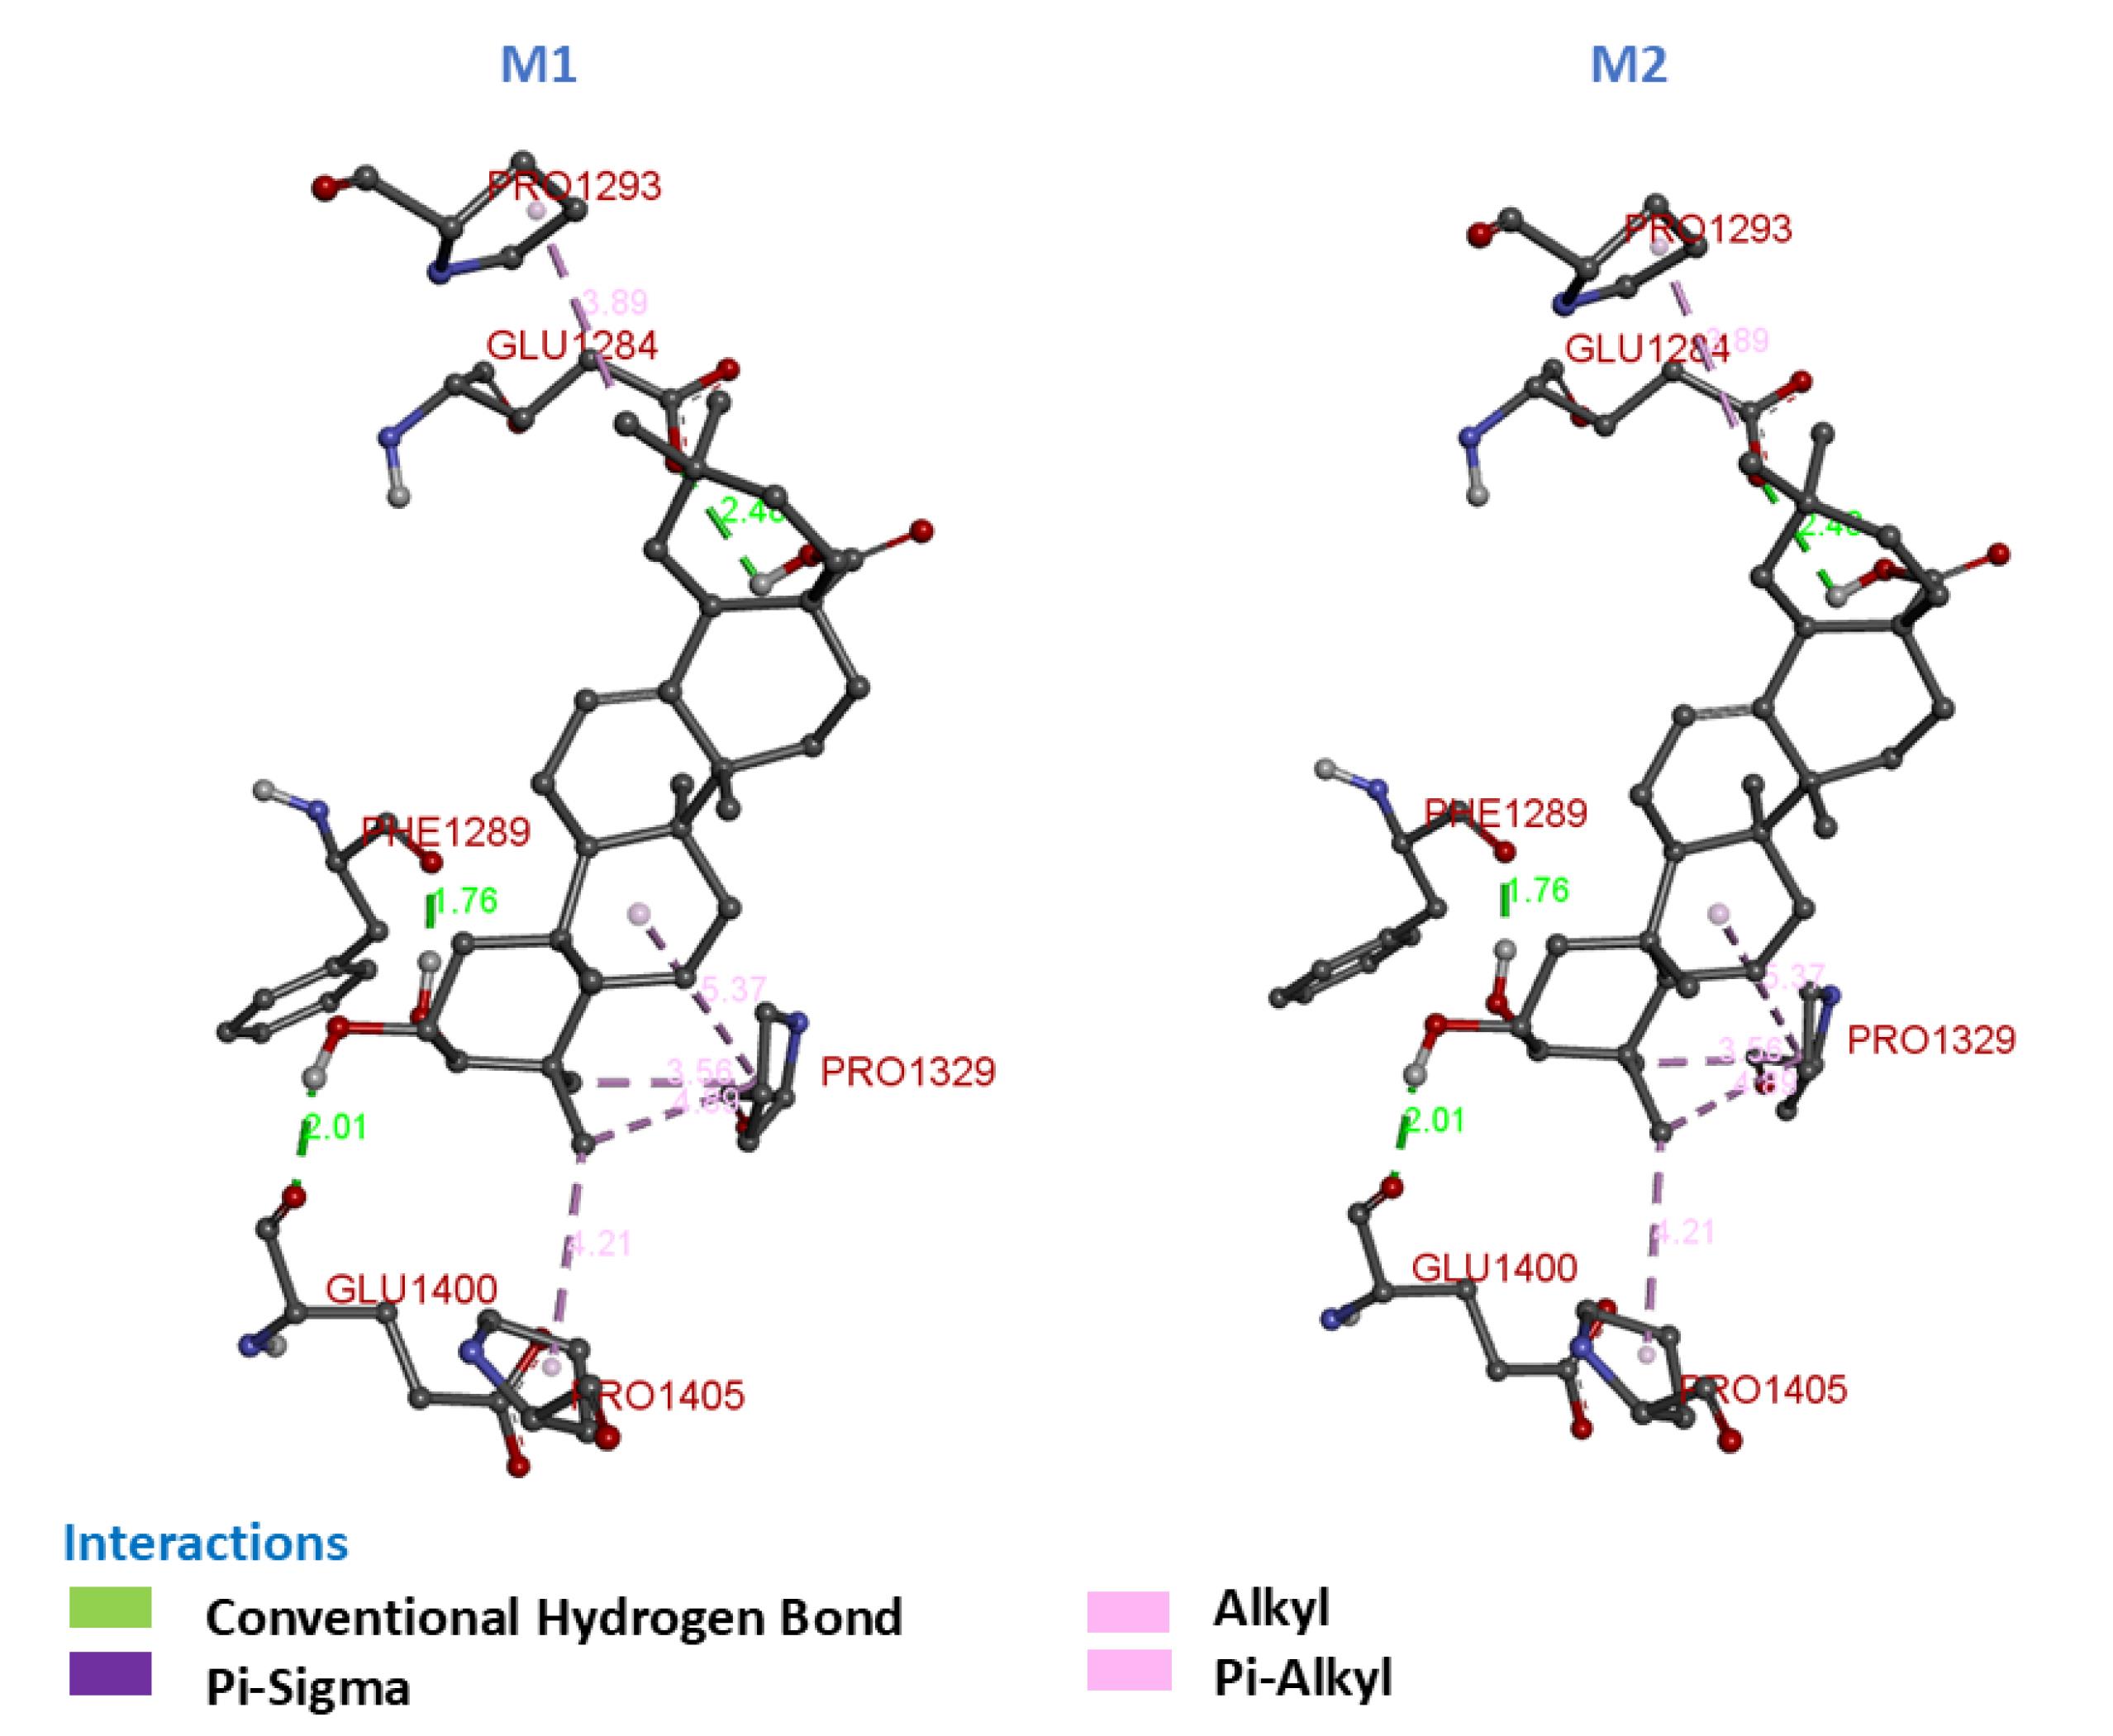
Fig. 4.
3D Molecular Interactions of compounds M1 and M2 with α-glucosidase and α-amylase.
.
3D Molecular Interactions of compounds M1 and M2 with α-glucosidase and α-amylase.
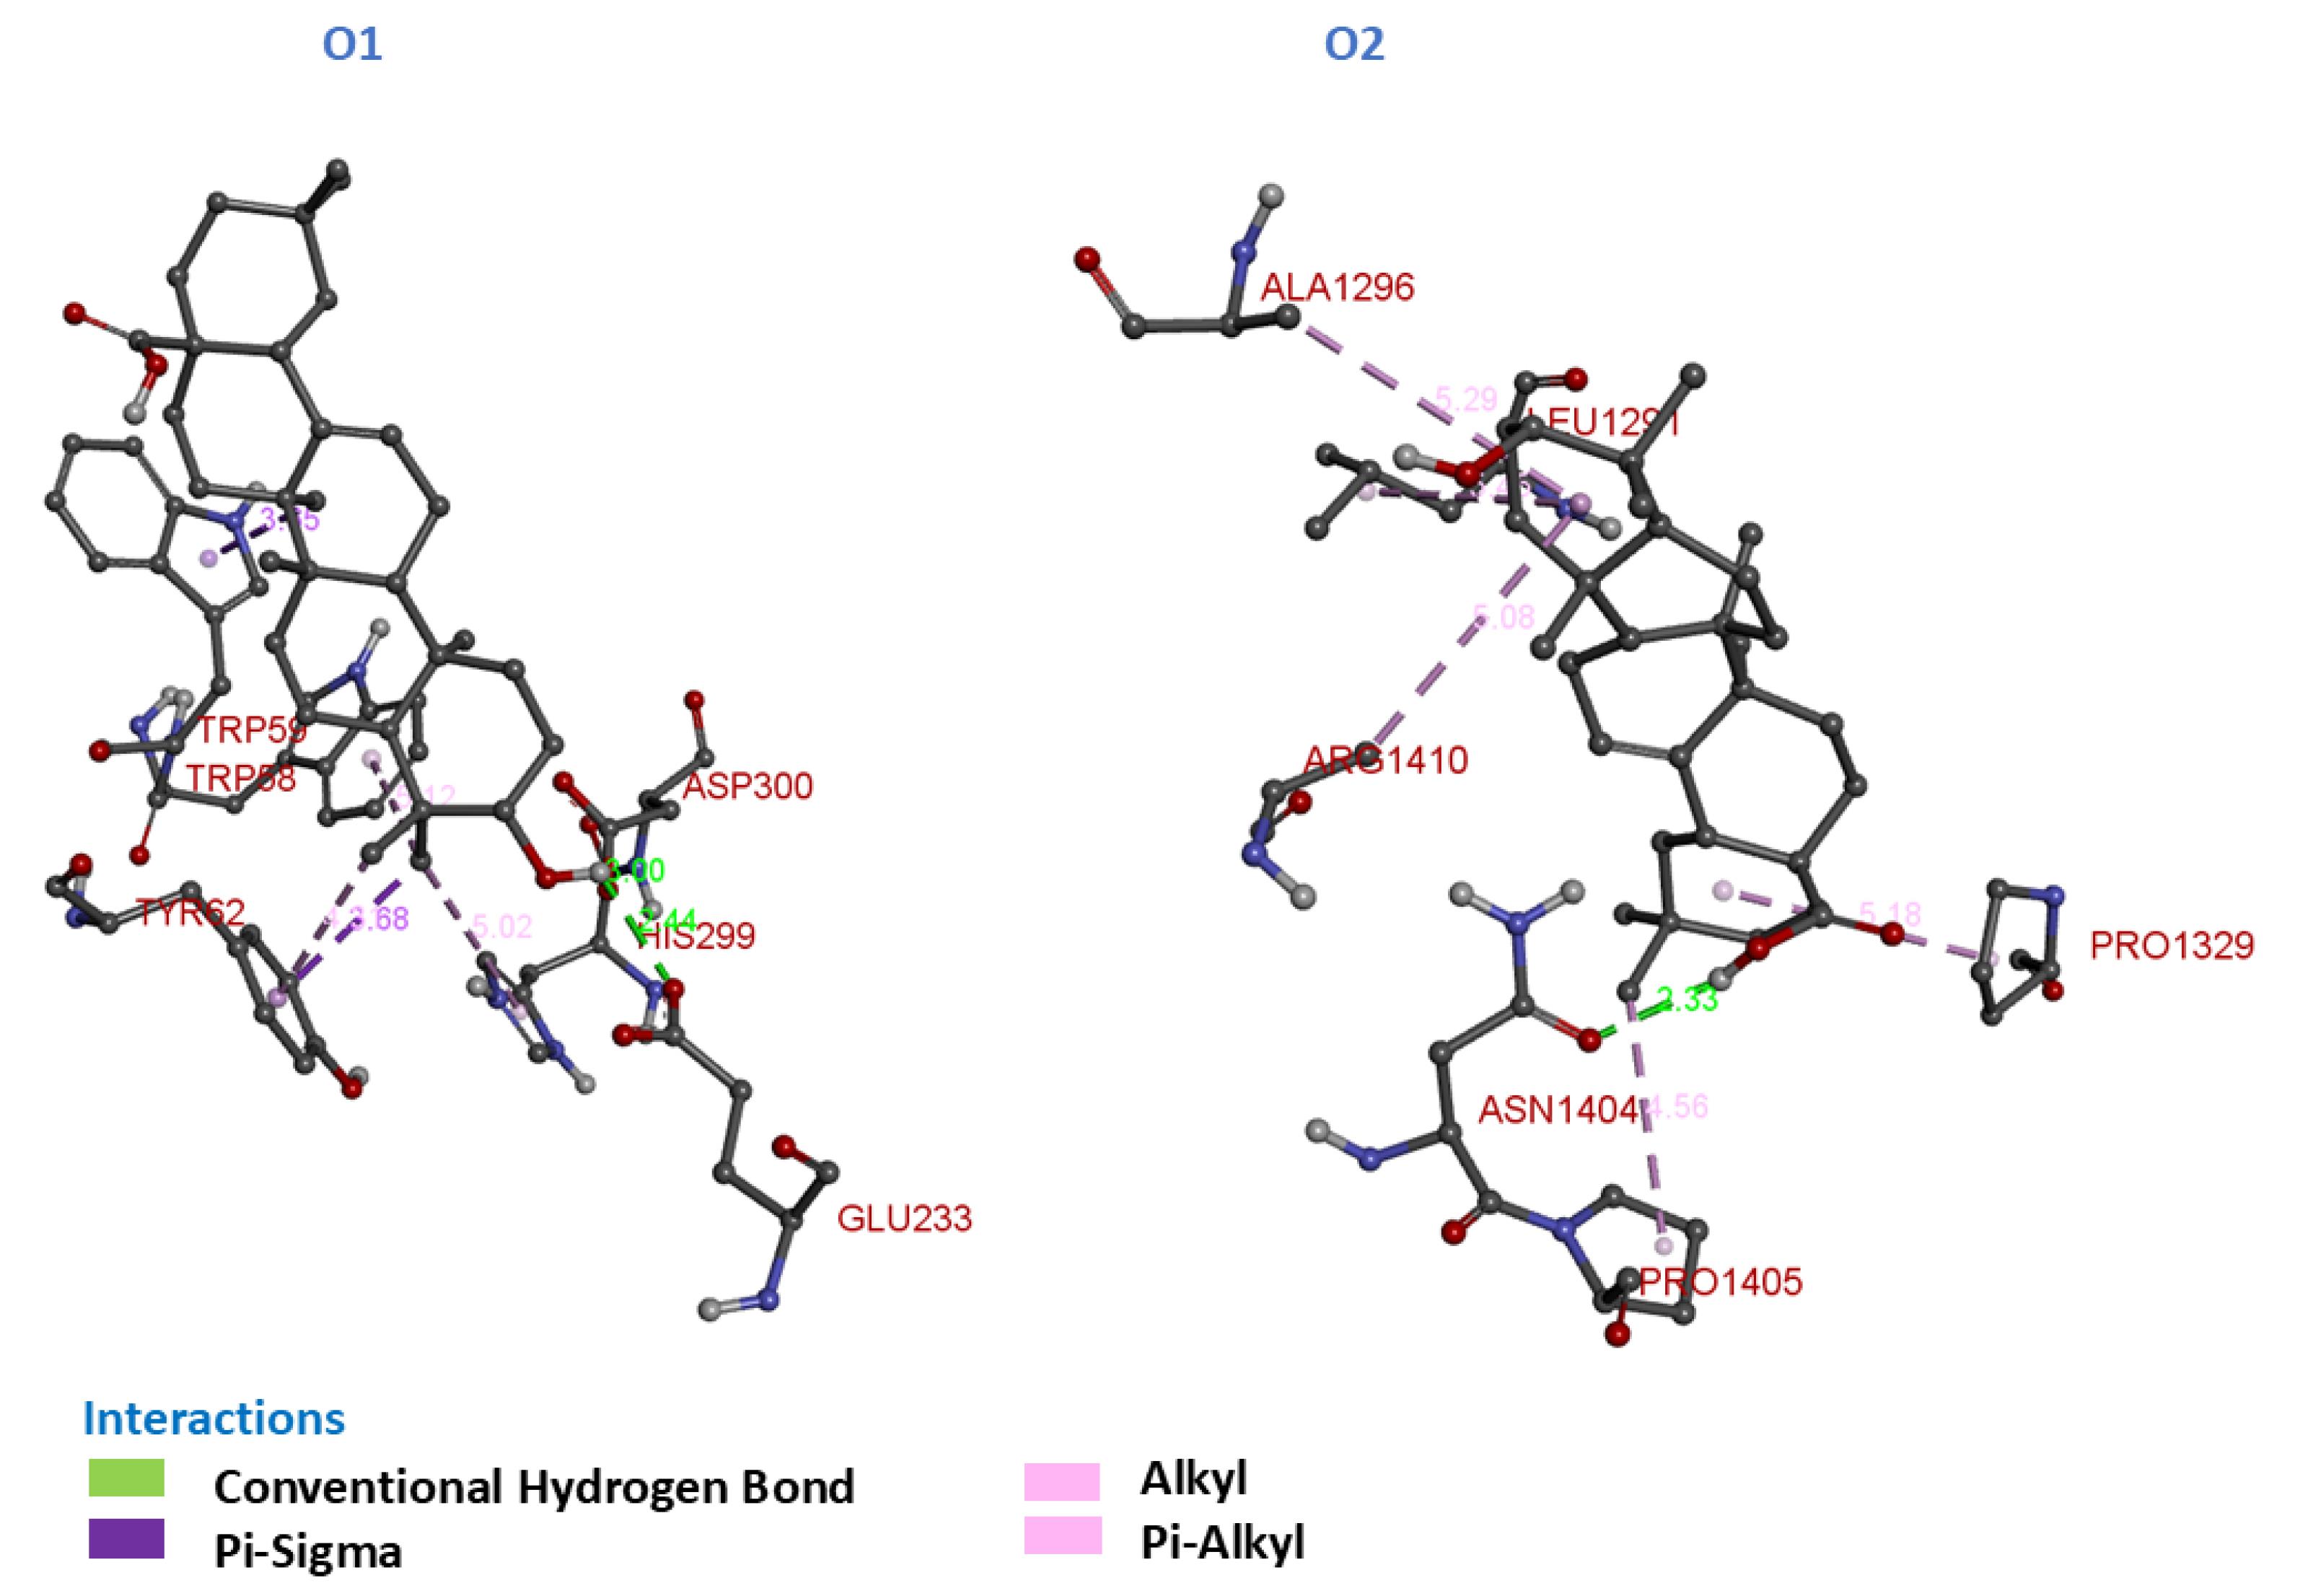
Fig. 5.
3D Molecular Interactions of compounds O1 and O2 with α-glucosidase and α-amylase.
.
3D Molecular Interactions of compounds O1 and O2 with α-glucosidase and α-amylase.
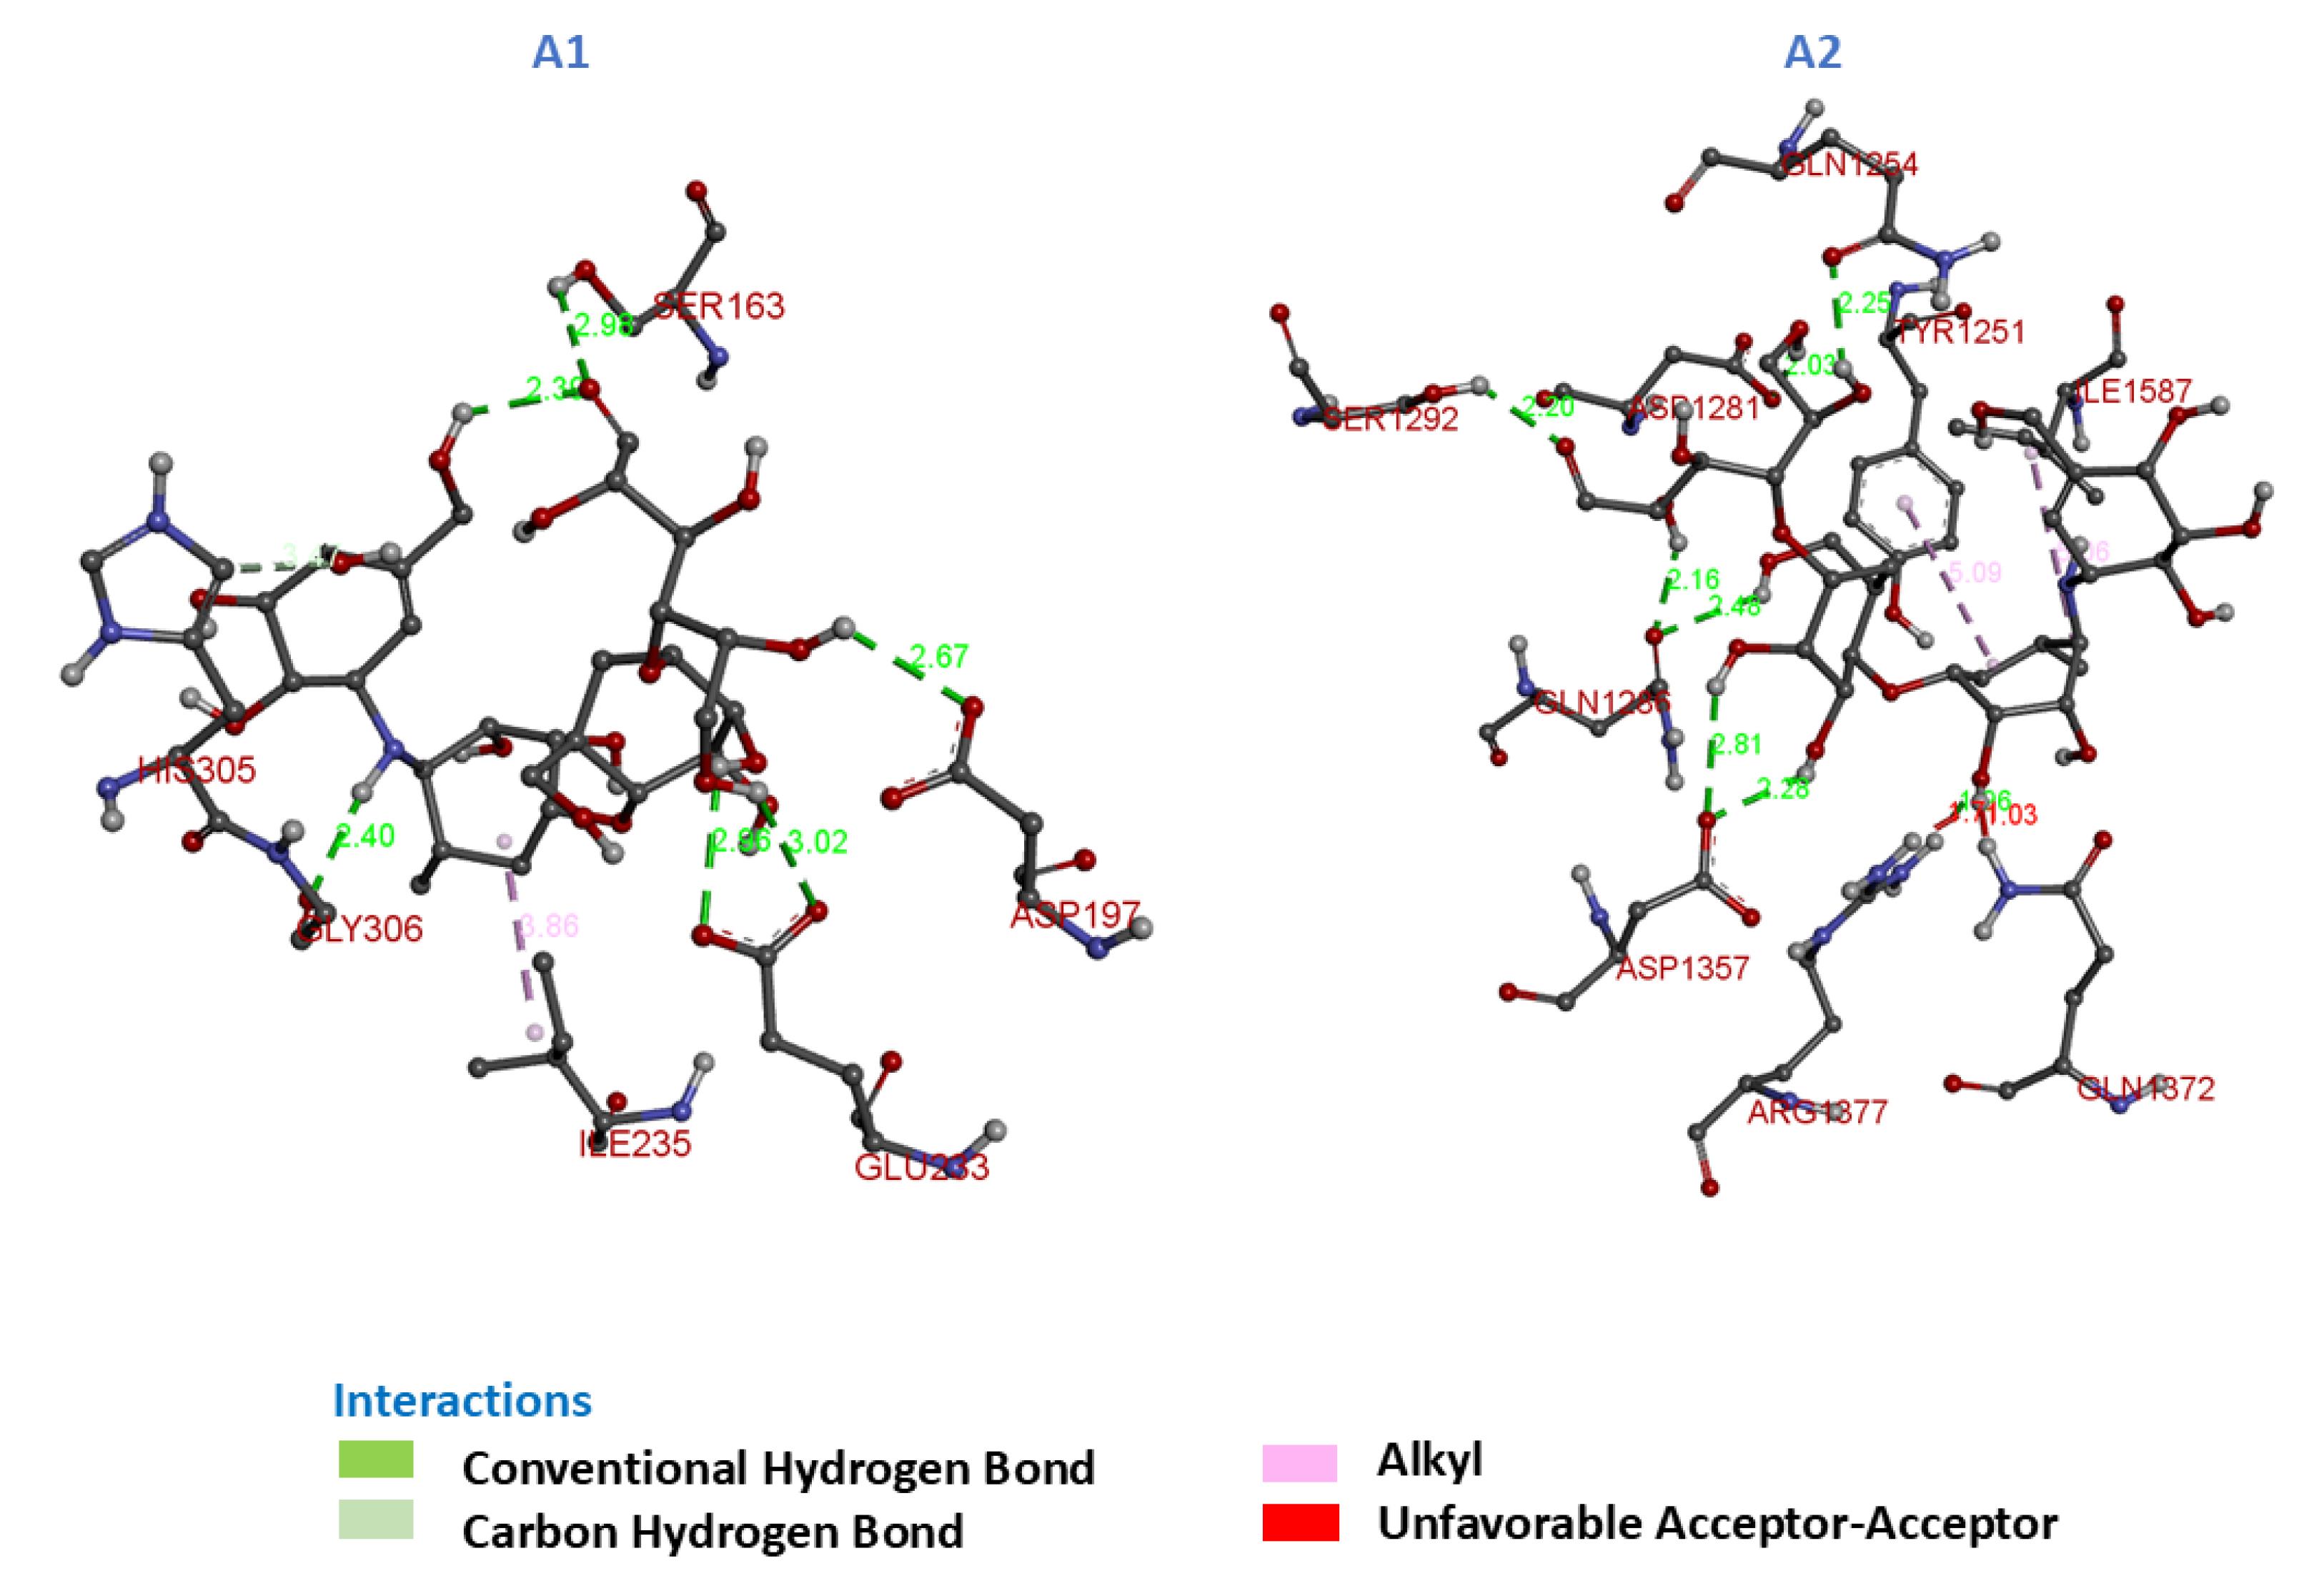
Fig. 6.
3D Molecular Interactions of compounds A1 and A2 with α-glucosidase and α-amylase.
.
3D Molecular Interactions of compounds A1 and A2 with α-glucosidase and α-amylase.
Interaction of Ligands M1 and M2
M1 exhibited a docking score of -41.42 kJ/mol against α-amylase, suggesting a potentially favorable binding interaction. The ligand formed two conventional hydrogen bonds: one between the hydrogen of the carboxylic acid group and Ser-163, and another between the hydroxy group and Asp-197. These interactions are key to stabilizing M1 within the active site. Furthermore, M1 formed three hydrophobic interactions, including π-alkyl and π-sigma interactions with residues Trp-59, Ile-51, and Val-107, contributing to the overall binding affinity. The hydrophobic interactions help anchor M1 in the enzyme’s hydrophobic pocket, providing further stability to the complex.
M2 showed a slightly lower binding affinity of -35.56 kJ/mol with α-glucosidase. M2 formed three conventional hydrogen bonds: the hydrogen from the carboxylic acid group interacted with Glu-1284, while the hydroxy groups formed bonds with Phe-1289 and Glu-1400. These hydrogen bonds help stabilize M2 in the active site of α-glucosidase. Additionally, three π-alkyl hydrophobic contacts with Pro-1293, Pro-1329, and Pro-1405 were identified, which could further support the predicted stability of the complex.
Interaction of ligands O1 and O2
O1 demonstrated a binding affinity of -38.91 kJ/mol with α-amylase. It formed two conventional hydrogen bonds: one with Asp-300 and the other with Glu-233, where the hydrogen of its hydroxyl group interacted with the carboxyl and amino acid side chains of the residues. These hydrogen bonds play a critical role in stabilizing the ligand within the active site of α-amylase. Furthermore, O1 exhibited four hydrophobic interactions, including π-alkyl and π-sigma interactions. These interactions were observed with residues His-299, Trp-58, Tyr-62, and Trp-59, enhancing the overall binding stability of the ligand. The presence of hydrogen bonds and hydrophobic interactions indicates favorable interactions between O1 and α-amylase, which may contribute to its significant predicted binding affinity.
O2 showed a lower binding affinity of -32.22 kJ/mol with α-glucosidase. O2 formed one conventional hydrogen bond with Asn-1404, where the hydrogen of the hydroxy group interacted with the amino acid side chain of Asn-1404. In addition to this hydrogen bond, O2 engaged in five hydrophobic interactions. These interactions included π-alkyl contacts with Leu-1291, Ala-1296, and Arg-1410, as well as with Pro-1329 and Pro-1405. These hydrophobic interactions contribute to the stability of the ligand within the enzyme's hydrophobic pocket, helping to anchor it effectively. Although O2 exhibited a lower predicted binding affinity compared to O1, the presence of multiple hydrophobic interactions may contribute to its notable predicted binding affinity.
Interaction of Reference Drug A1 & A2
Acarbose, the reference drug, exhibited significant binding interactions with both α-amylase (A1) and α-glucosidase (A2), underscoring its dual inhibitory potential. The docking results revealed a combination of hydrogen bonds and hydrophobic interactions that contribute to the stabilization of the ligand-enzyme complexes within the active sites.
For A1, acarbose formed multiple hydrogen bonds with residues Gly-306, Ser-163, Asp-193, and Glu-233, complemented by hydrophobic interactions with Ile-235 and His-305. However, an unfavorable acceptor-acceptor interaction with His-305 was also observed, which may slightly reduce its overall binding efficiency.
For A2, acarbose formed hydrogen bonds with residues Gln-1254, Ser-1292, Asp-1281, Gln-1286, Asp-1357, and Arg-1377, in addition to hydrophobic interactions with Ile-1587 and Tyr-1251. An unfavorable acceptor–Acceptor interaction with Gln-1372 was also observed, which may slightly affect the predicted binding stability of the ligand.
Although docking and ADMET analyses indicate that maslinic acid and oleanolic acid interact favorably with α-amylase and α-glucosidase, these in silico predictions do not capture the full pharmacokinetic, metabolic, or systemic factors that determine clinical efficacy. While the natural compounds show higher predicted binding affinities and favorable interaction profiles compared to acarbose, the latter remains a clinically proven inhibitor of both enzymes. Therefore, the computational results presented here should be interpreted as hypothesis-generating, providing insights into potential ligand-enzyme interactions, but not as direct evidence of therapeutic efficacy. Experimental validation is required to confirm the anti-diabetic potential of maslinic acid and oleanolic acid.
MD simulation results
To evaluate the structural stability of protein-ligand complexes within the binding sites of α-amylase and α-glucosidase, simulations were conducted for 1000 ns using maslinic acid and oleanolic acid compounds. These simulations provided insights into the conformational dynamics of the complexes. Specifically, M1 and M2 represent the maslinic acid complexes with α-amylase and α-glucosidase, respectively, while O1 and O2 denote the oleanolic acid complexes with α-amylase and α-glucosidase, respectively. Through these analyses, several key dynamic properties of each complex were characterized.
Root mean square deviation (RMSD) analysis
RMSD analysis was conducted to assess the structural stability and binding behavior of maslinic acid and oleanolic acid within the α-amylase and α-glucosidase active sites. Fig. 7 shows the RMSD profiles of the complexes, proteins, and ligands for each simulation, with detailed values summarized in Table 3.
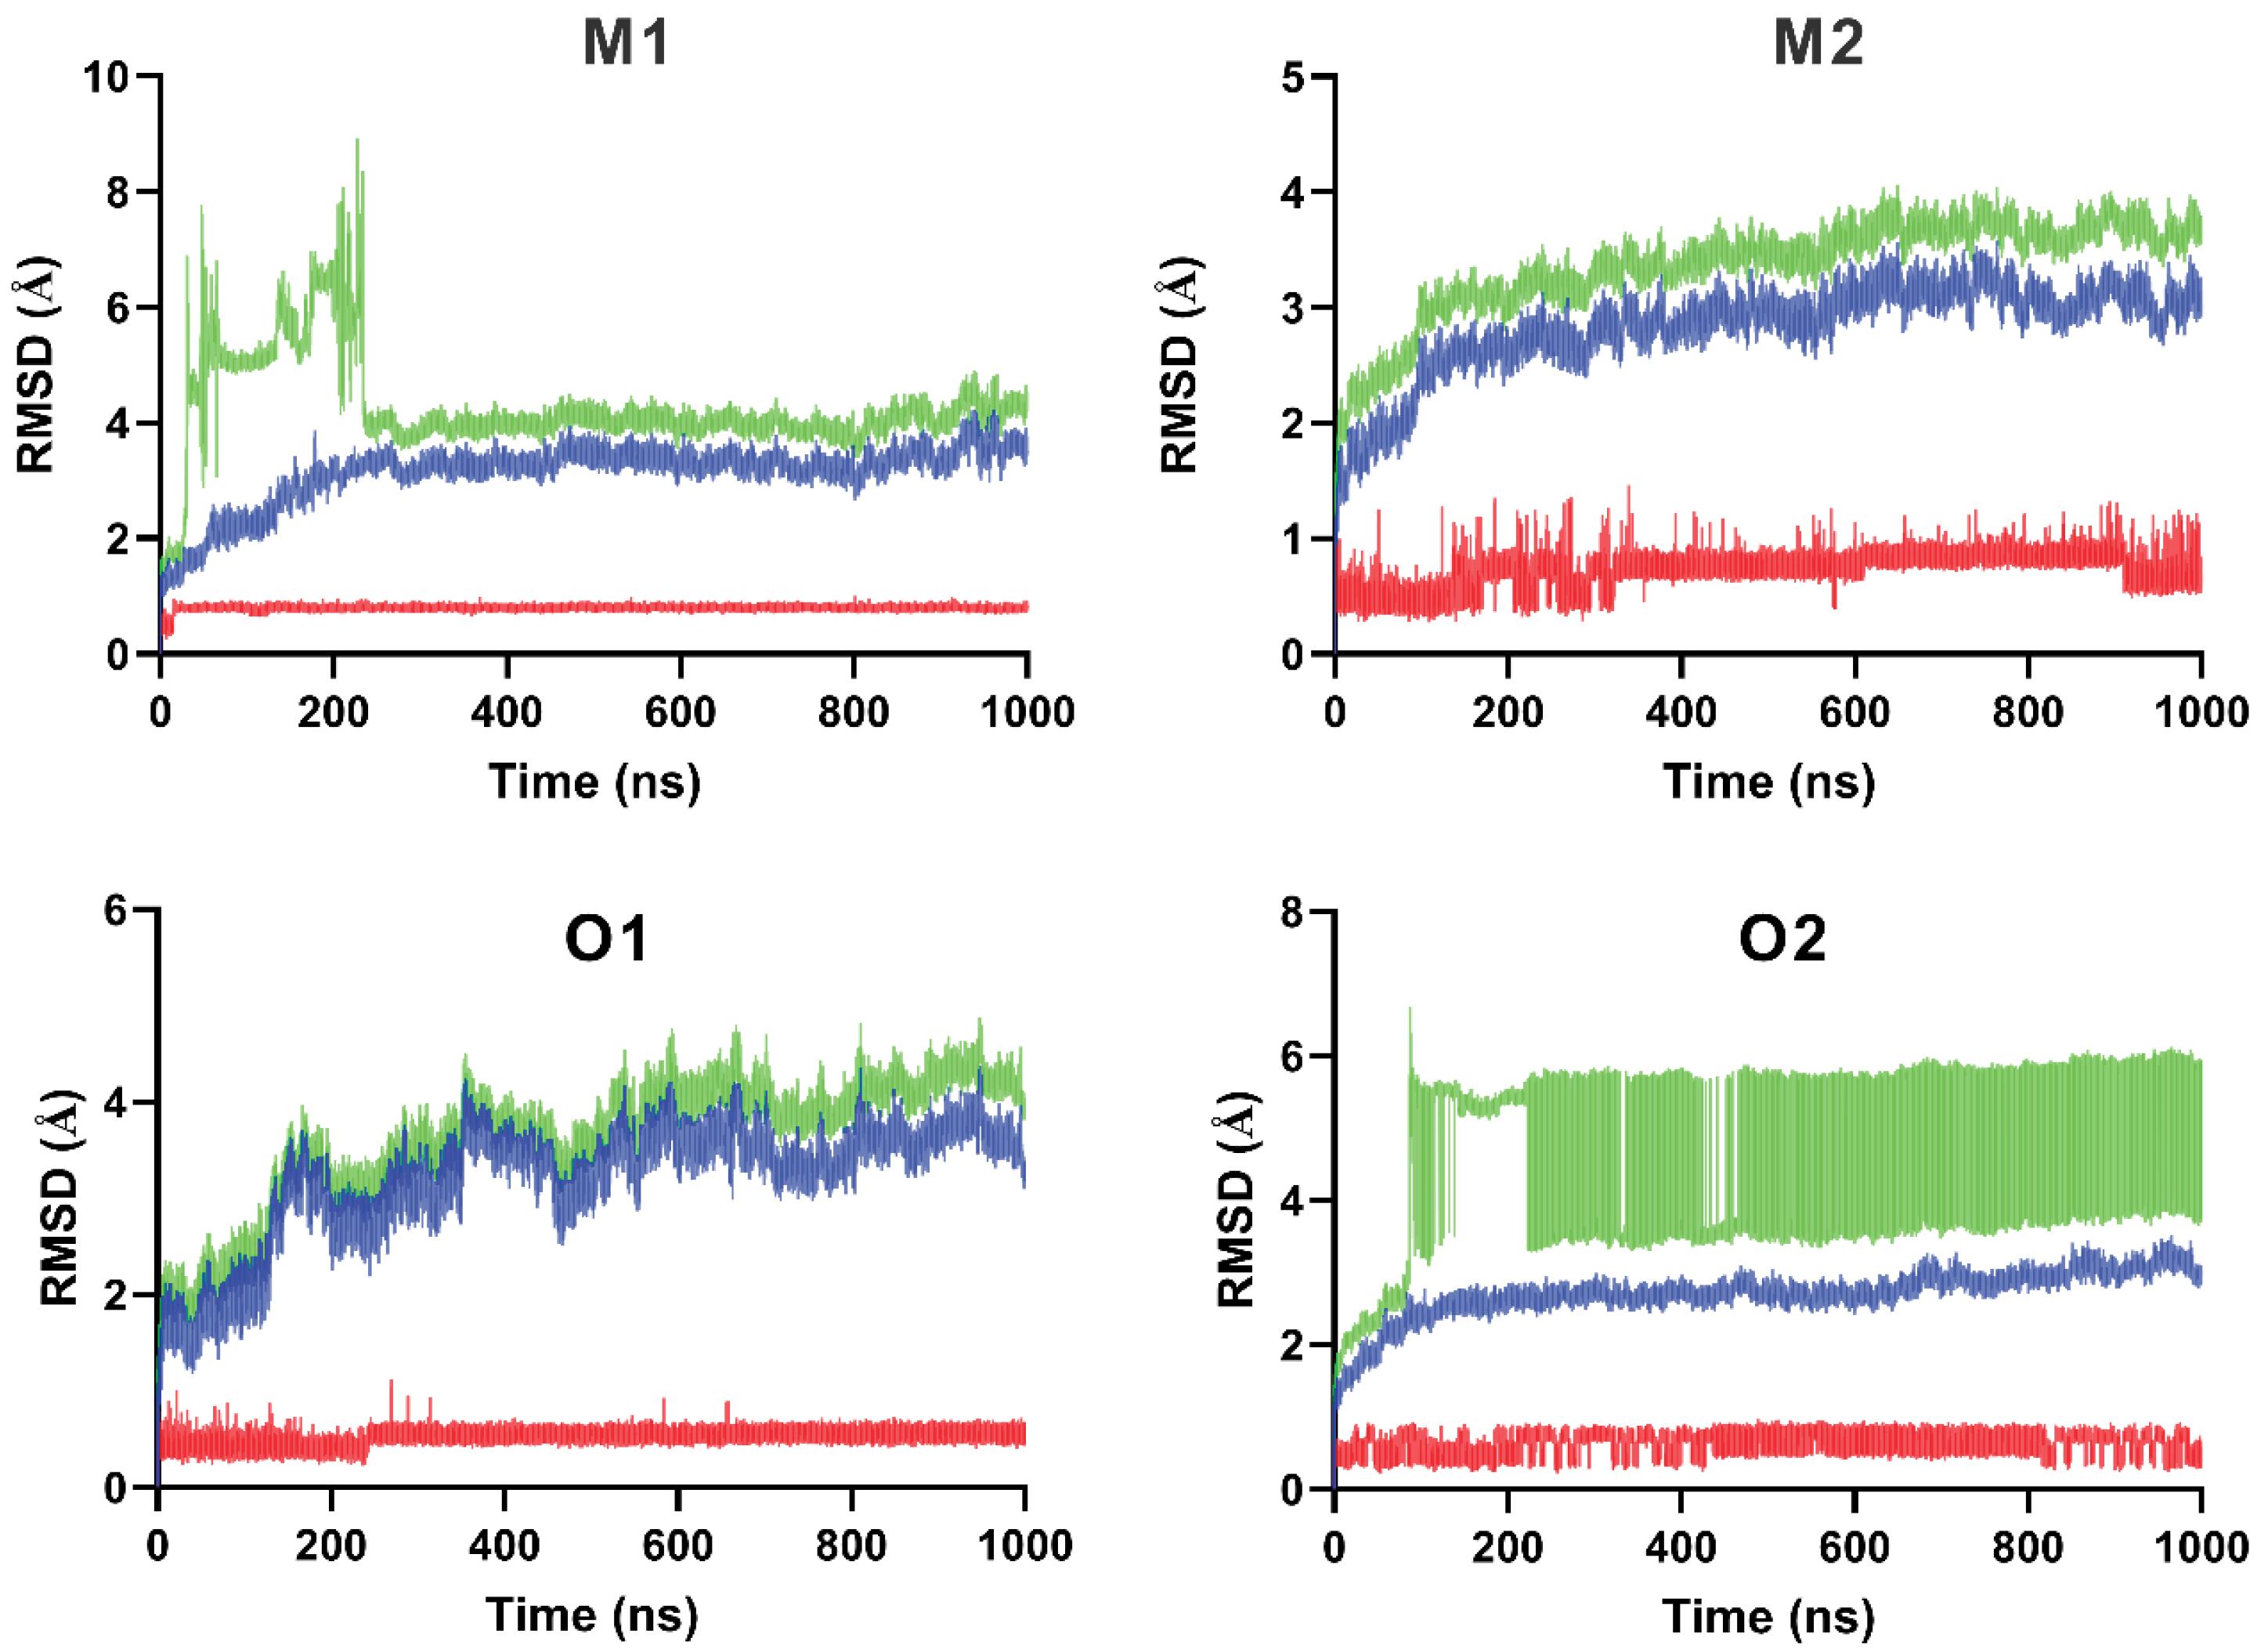
Fig. 7.
RMSD fluctuations over 1000 ns from molecular dynamics simulations of maslinic acid and oleanolic acid complexes with α-amylase and α-glucosidase. Color key: Blue = Protein, Red = Ligand, Green = Complex.
.
RMSD fluctuations over 1000 ns from molecular dynamics simulations of maslinic acid and oleanolic acid complexes with α-amylase and α-glucosidase. Color key: Blue = Protein, Red = Ligand, Green = Complex.
Table 3.
Average RMSD (Å) and RMSF (Å) values for maslinic acid (M1, M2) and oleanolic acid (O1, O2) complexes with α-glucosidaseand α-amylase proteins
|
Complex
|
Complex
RMSD ± SD
|
Backbone
RMSD ± SD
|
Ligand
RMSD ± SD
|
Complex
RMSF ± SD
|
|
M1
|
4.252 ± 0.829 |
3.115 ± 0.535 |
0.782 ± 0.051 |
1,645 ± 0,063 |
|
O1
|
3.610 ± 0.675 |
3.168 ± 0.628 |
0.516 ± 0.071 |
1,809 ± 0,073 |
|
M2
|
3.357 ± 0.419 |
2.825 ± 0.398 |
0.716 ± 0.142 |
1,542 ± 0,038 |
|
O2
|
4.418 ± 1.203 |
2.702 ± 0.336 |
0.613 ± 0.149 |
1,457 ± 0,031 |
The M1 complex exhibited fluctuations during the first 230 ns, followed by a sharp increase and subsequent stabilization. The average RMSD of the complex was 4.252 ± 0.829 Å, reflecting conformational rearrangements likely associated with domain or loop movements. The backbone RMSD settled at 3.115 ± 0.535 Å, indicating that the overall protein fold remained moderately stable despite global flexibility. Importantly, the ligand RMSD (0.782 ± 0.051 Å) remained low throughout the simulation, demonstrating that maslinic acid maintained a consistent orientation within the binding pocket.
The M2 complex exhibited relatively stable dynamics, with an average RMSD of 3.357 ± 0.419 Å, indicating limited structural drift. The backbone RMSD (2.825 ± 0.398 Å) remained consistent, supporting a well-preserved protein conformation, while the ligand RMSD (0.716 ± 0.142 Å) confirms stable interactions within the binding site.
The O1 complex showed initial fluctuations during the first 132 ns, after which the system stabilized. The average RMSD was 3.610 ± 0.675 Å, and the ligand RMSD (0.516 ± 0.071 Å) highlights the steady binding of oleanolic acid within the α-amylase active site.
The O2 complex exhibits the highest degree of global flexibility. The overall Complex showed a large initial jump and then sustained high deviation (around 5 - 6 Å) across the full 1000 ns. This substantial global movement, averaging 4.418 ± 1.203 Å, suggests the protein is undergoing large-scale domain movements or significant conformational changes. However, this high global fluctuation contrasts sharply with the local stability: the Ligand RMSD remains exceptionally low and stable, consistently below 1.0 Å (0.613 ± 0.149 Å). This difference is key, demonstrating that oleanolic acid maintains a robust, stable orientation within the binding pocket even as the external protein structure moves, confirming the active site retains a coherent, functional conformation.
Root mean square fluctuation (RMSF) analysis
The RMSF was calculated to evaluate the flexibility of individual residues around their average positions throughout the MD trajectories. RMSF profiles for all four complexes are shown in Fig. 8, with detailed values provided in Table 3.
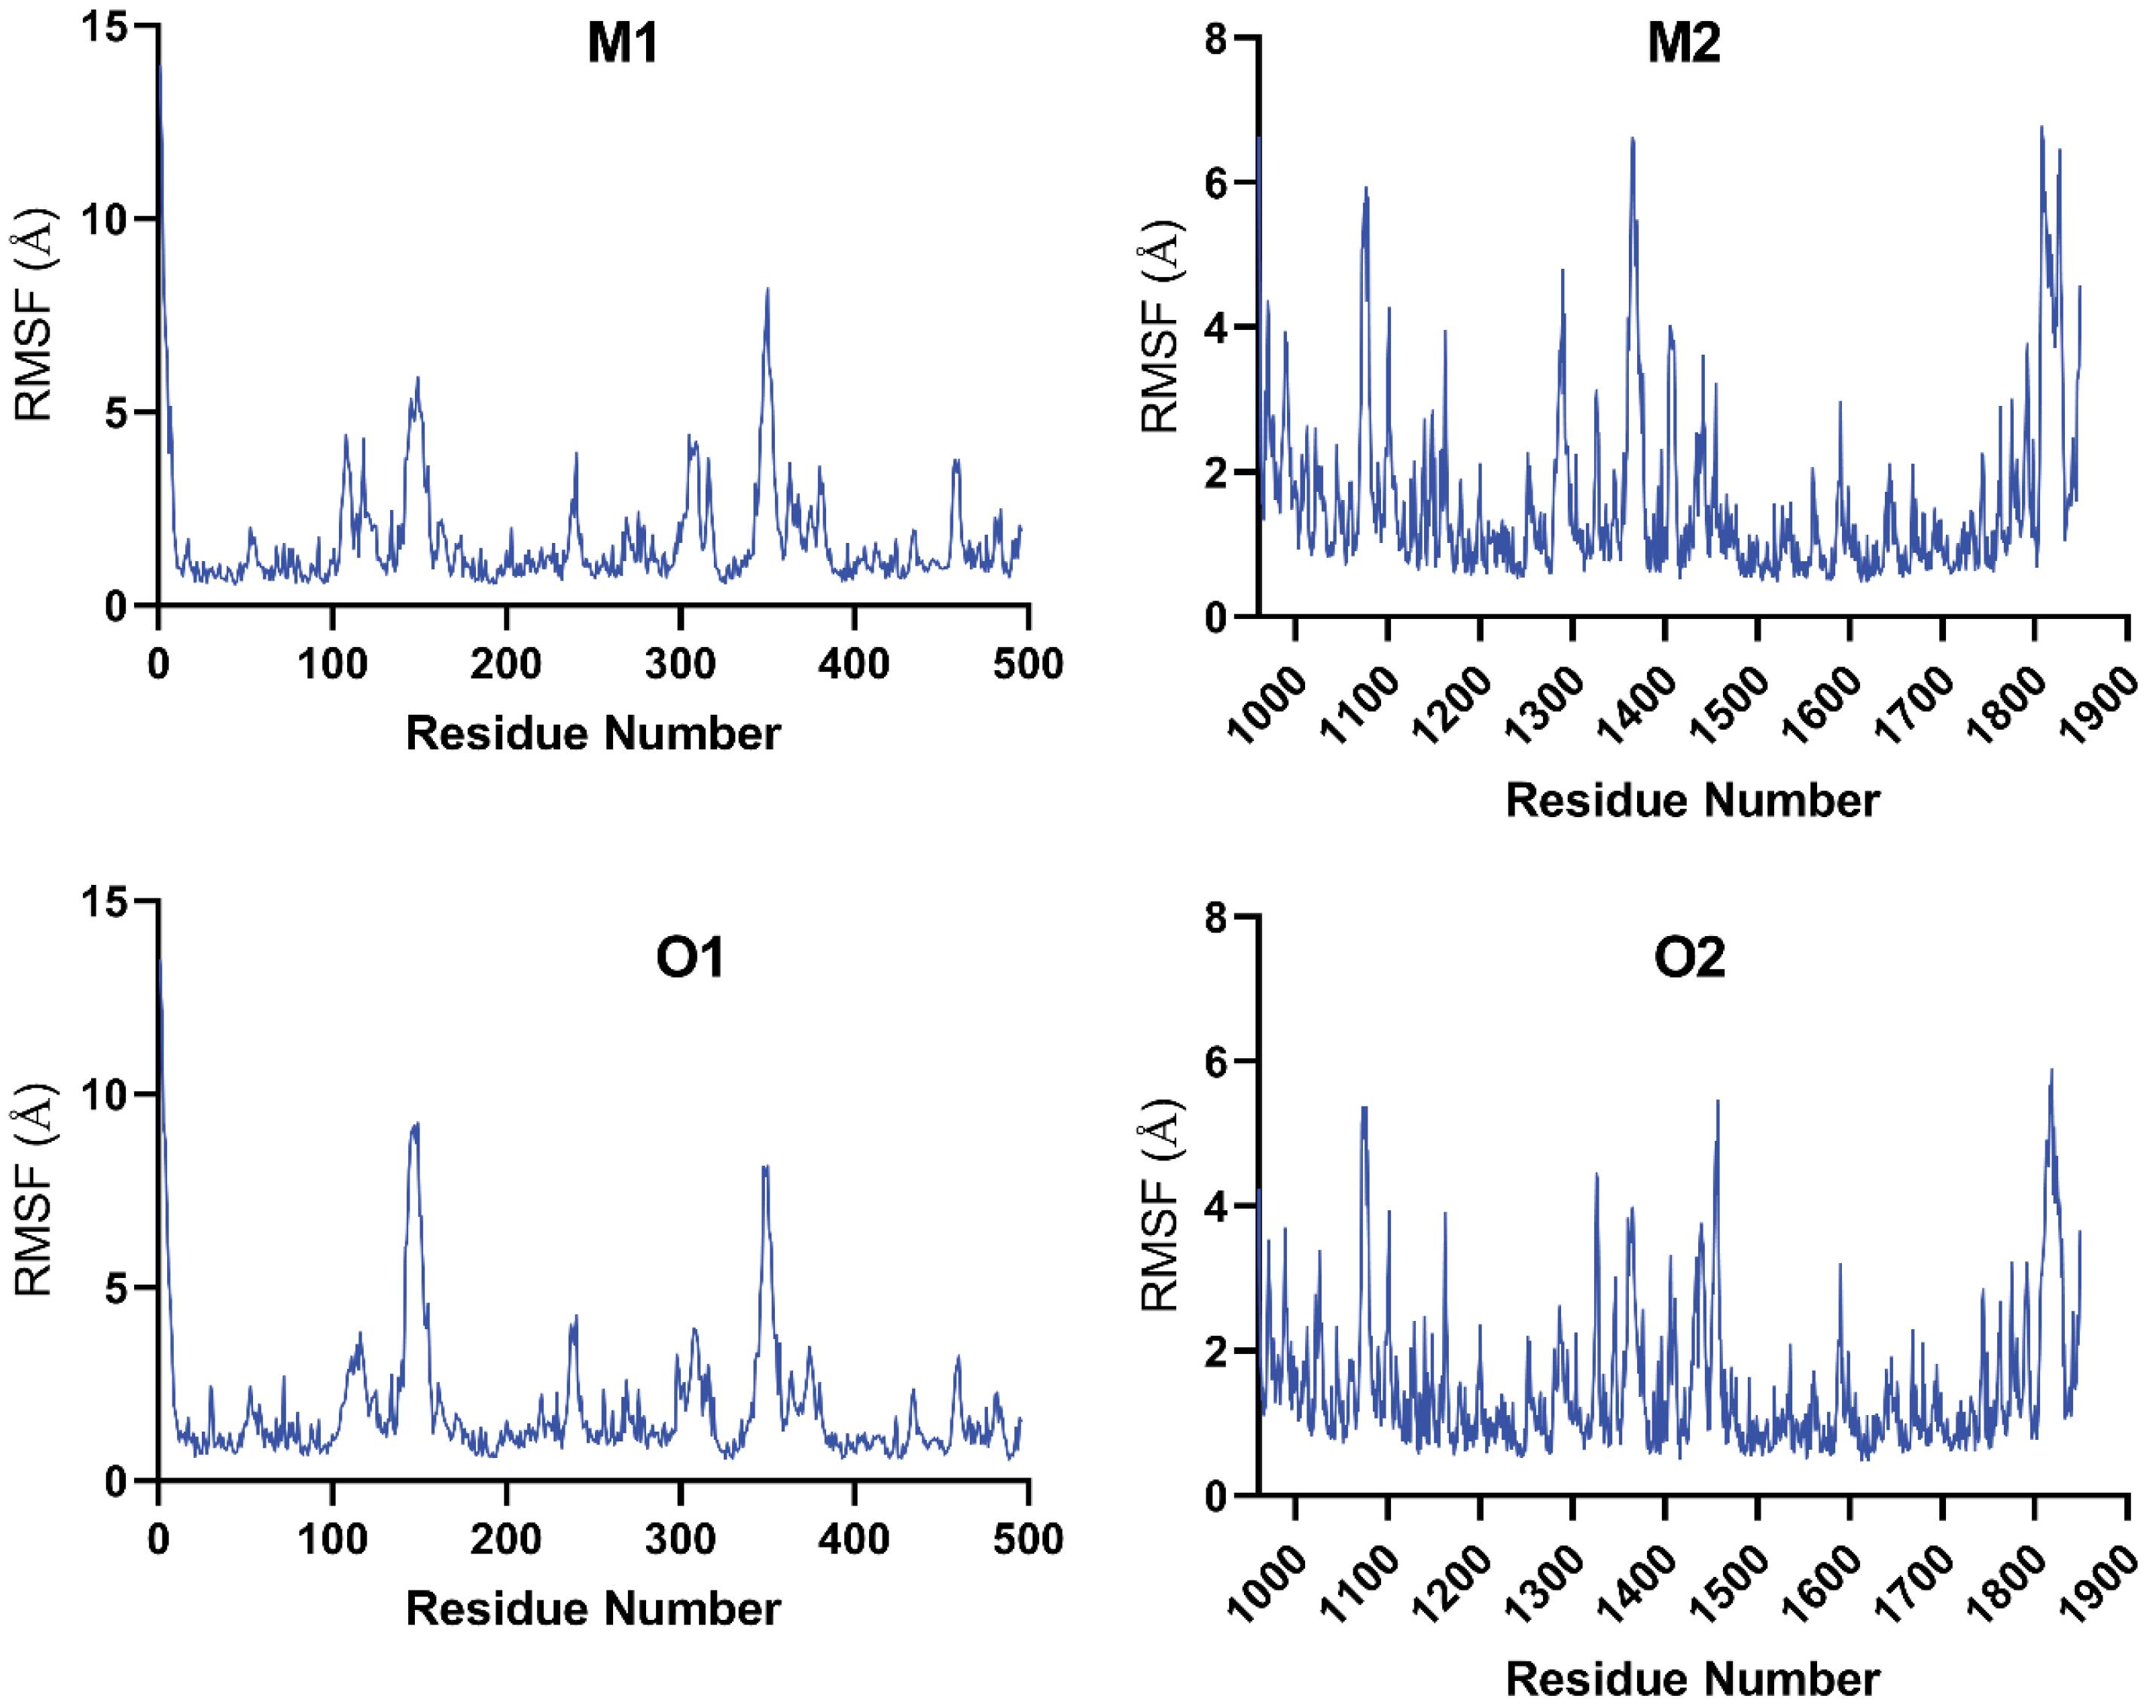
Fig. 8.
Root mean square fluctuation (RMSF) profile for residues in maslinic acid and oleanolic acid complexes with α-amylase and α-glucosidase proteins.
.
Root mean square fluctuation (RMSF) profile for residues in maslinic acid and oleanolic acid complexes with α-amylase and α-glucosidase proteins.
Regions with RMSF values above 2 Å generally correspond to flexible surface loops and terminal domains, reflecting global protein flexibility. In contrast, the binding pockets remained structurally stable, as indicated by consistently low RMSF values in functional regions:
M1 and O1 Complexes (α-amylase): The binding site is supported by low average RMSF values of 1.645 ± 0.063 Å (M1) and 1.809 ± 0.073 Å (O1). Key residues involved in ligand interactions; Ser-163, Asp-197, Trp-59 (M1) and Asp-300, Glu-233 (O1), exhibited RMSF values below 2 Å, confirming a rigid and well-maintained binding cavity.
M2 and O2 complexes (α-glucosidase): Both complexes showed high stability with average RMSF values of 1.542 ± 0.038 Å (M2) and 1.457 ± 0.031 Å (O2). Critical residues for ligand binding (Glu-1284, Phe-1289 for M2; Asn-1404, Leu-1291 for O2) also exhibited low fluctuations, supporting the structural conservation of the binding site.
Overall, the RMSF data indicate that the binding pockets of all four complexes remain conformationally constrained, ensuring stable ligand-protein interactions throughout the simulations.
Radius of gyration (Rg) analysis
A radius of Rg analysis was performed to evaluate the overall compactness and conformational stability of the protein molecules in each complex. By computing Rg throughout the simulation, any structural expansion or contraction that could reflect conformational rearrangements was monitored. Fig. S4 presents the Rg plots for the four complexes in comparison with the crystal structures of α-amylase and α-glucosidase.
The Rg values for the α-amylase complexes (M1 and O1) varied within 15.01 - 21.96 Å, while those for the α-glucosidase complexes (M2 and O2) fluctuated between 22.44 - 24.03 Å. These ranges indicate that the proteins maintained compact, folded conformations without major deviations. The average Rg values were 18.99 ± 1.96 Å for M1 and 19.13 ± 1.84 Å for O1 in α-amylase, and 23.21 ± 0.20 Å for M2 and 23.14 ± 0.12 Å for O2 in α-glucosidase, indicating that ligand binding contributes to the stabilization of the tertiary structures of both enzymes. The low amplitude of Rg fluctuations indicates that no significant unfolding occurred, implying that ligand association contributes to maintaining structural integrity and conformational equilibrium. Mechanistically, this stability suggests that the ligands reinforce intramolecular packing within the binding pocket, minimizing large-scale domain movements during the trajectory.
Solvent-accessible surface area (SASA) analysis
To complement the compactness analysis, the SASA was evaluated to assess protein surface exposure to solvent molecules, which is sensitive to folding, conformational breathing, and ligand-induced shielding. Fig. S5 presents the average SASA values for each complex during the simulation. The α-glucosidase complexes (M2 and O2) displayed higher SASA values (34,247 ± 776.00 Å2 and 33,886 ± 537.00 Å2, respectively) compared with the α-amylase complexes (M1 and O1), which averaged 21,781 ± 585.30 Å2 and 21,784 ± 813.20 Å2, respectively. The reduced SASA values for M1 and O1 indicate a more compact and less solvent-exposed structure, reflecting enhanced hydrophobic core packing and greater conformational stability. In contrast, the slightly higher SASA values for α-glucosidase complexes imply increased flexibility and solvent exposure, consistent with the enzyme’s inherently larger and more dynamic nature. Combined with the Rg data, these observations suggest that α-amylase complexes are more rigid and conformationally constrained, whereas α-glucosidase complexes exhibit controlled flexibility that may facilitate substrate accommodation or catalytic activity.
Bonded energy components (bond, angle, and dihedral) analysis
Table S5 and Fig. S6 summarize the bonded energy components that contribute to complex stability. The α-amylase complexes M1 and O1 exhibited lower total bonded energy values (1,708 ± 64.27 and 1,711 ± 66.22 kJ/mol, respectively) with moderate angle and dihedral terms, suggesting a relaxed internal geometry and stable intramolecular interactions. This reflects an energetically favorable accommodation of ligands within a well-preorganized binding pocket, reducing conformational strain during binding.
In contrast, the α-glucosidase complexes M2 and O2 displayed significantly higher bonded energy values (3,088 ± 108.7 kJ/mol) along with increased angle and dihedral components (7,250 ± 81.3 kJ/mol and 9,185 ± 45 kJ/mol, respectively). These elevated energies indicate a more flexible or adaptive binding environment that may require local conformational adjustments of the enzyme to stabilize ligand binding. Mechanistically, this suggests that α-glucosidase retains a degree of structural plasticity, allowing its active site to accommodate diverse ligands while maintaining overall structural integrity, as confirmed by stable Rg and SASA profiles.
MM-PBSA analysis
The binding free energies were decomposed into their energy components, including van der Waals energy, electrostatic energy, polar solvation energy, gas phase energy, and SASA non-polar solvation energy, to understand the individual contributions. These results are displayed in Table 4.
Table 4.
The binding free energies MM-PBSA determined for the four complexes along with the energy terms: Gas phase contribution; electrostatic contribution (ELE); van der Waals contribution (VDW); SASA nonpolar contribution (SASA) and the polar contribution (Polar) in kJ/mol
|
Complex
|
GP ± SD
|
Polar ± SD
|
SASA ± SD
|
VDW ± SD
|
ELE ± SD
|
MM-PBSA ± SD
|
|
M1
|
-112.20 ± 60.29 |
75.42 ± 45.73 |
-2.31 ± 0.55 |
-14.02 ± 5.286 |
-98.13 ± 60.30 |
-39.05 ± 16.78 |
|
O1
|
41.44 ± 12.60 |
-62.17 ± 11.51 |
-3.41 ± 0.24 |
-33.86 ± 3.31 |
75.30 ± 12.18 |
-24.14 ± 3.63 |
|
M2
|
-50.62 ± 8.90 |
31.50 ± 6.61 |
-3.52 ± 0.32 |
-31.21 ± 5.10 |
-19.40 ± 9.06 |
-22.63 ± 4.61 |
|
O2
|
-25.36 ± 13.99 |
13.57 ± 8.67 |
-2.18 ± 0.99 |
-19.10 ± 9.89 |
-6.25 ± 6.42 |
-13.97 ± 7.08 |
The results indicate that M1 exhibits the lowest binding free energy (-39.05 ± 16.78 kJ/mol), suggesting relatively higher stability among the complexes studied. In comparison, the other complexes (O1, M2, and O2) show less favorable binding energies, indicating comparatively lower predicted stability. The trends in binding energies correspond with the dynamic patterns illustrated in Figs. S6 and S7, which depict the contributions of different free energy components throughout the simulation frames.
M1's stability is mostly due to its strong electrostatic interactions (-98.13 ± 60.30 kJ/mol) and favorable gas-phase energy (-112.20 ± 60.29 kJ). Despite a large polar solvation penalty (75.42 ± 45.73 kJ/mol), M1 compensates with strong interactions. This pattern is consistent with the electrostatic energy trends seen in Fig. S8.
The other complexes, especially O2, exhibit weaker electrostatic and gas-phase contributions, explaining their reduced binding affinities. Non-polar solvation energy (SASA) and van der Waals interactions are relatively consistent across the complexes, as shown in Fig. S7, and contribute less to the observed differences in binding stability.
In summary, M1 stands out due to its strong electrostatic and overall favorable interactions, whereas the other complexes display weaker binding energy contributions. This observation is supported by the decomposed energy components in Table 4 and the energy fluctuation trends in Figs. S7 and S8.
Validation of affinity: KiMM-PBSA vs. IC50 correlation
To validate the predictive accuracy of our computational models, the binding free energies (ΔGMM-PBSA) for Maslinic Acid and Oleanolic Acid were converted into theoretical inhibition constants (Κi) and compared directly with published experimental values.39 This quantitative comparison provides a crucial external check on the reliability of our affinity predictions (Table S6).
The comparative analysis shows a close agreement between the calculated KiMM-PBSA for Oleanolic Acid (O1) and the experimental IC50 for α-amylase, with values of 62.55 μM and 81.3 μM, respectively. This suggests that the MD and MM-PBSA protocol provides a reasonable estimation of binding affinity for this system. Similarly, the prediction that Maslinic Acid (M1) interacts favorably with α-amylase is generally consistent with experimental observations indicating inhibitory activity.
The correlation is less direct for the α-glucosidase complexes (M2 and O2), where the experimental IC50 values (33.5μM to 34.5μM) are significantly lower (more potent) than the calculated KiMM-PBSA values. This discrepancy is often observed, as IC50 is influenced by factors not fully modeled in MM-PBSA. These factors include complex kinetic effects, multiple binding modes, or allosteric interactions that contribute to inhibition but are not captured by the active site binding calculation performed by MM-PBSA. Despite this variability, the consistent trend of favorable binding free energies validates the compounds' potential as potent lead molecules.
Conclusion
This study highlights the impact of olive variety, geographical origin, production systems, and maturity index on the concentrations of bioactive compounds, specifically maslinic acid and oleanolic acid, in Moroccan virgin olive oil. Among the varieties examined, the Moroccan Picholine variety exhibited the highest concentrations of both maslinic acid (58.3 mg/kg) and oleanolic acid (55.06 mg/kg). In terms of production systems, the two-phase milling method resulted in higher levels of these compounds compared to the three-phase system. Additionally, a lower maturity index of olives led to greater concentrations of both bioactive compounds. Pharmacokinetic analysis indicated favorable drug-likeness properties for maslinic acid and oleanolic acid, including human intestinal absorption greater than 85% and minimal predicted toxicity risks. Molecular docking suggested potential interactions of these compounds with key enzymes involved in diabetes management. Maslinic acid displayed favorable predicted binding to α-amylase (-41.42 kJ/mol), while oleanolic acid showed notable binding to α-glucosidase (-32.22 kJ/mol). Molecular dynamics simulations further indicated stable interactions with minimal fluctuations in the binding regions. MM-PBSA analysis supported these observations, with calculated binding free energies of -39.05 ± 16.78 kJ/mol for maslinic acid with α-amylase and -13.97 ± 7.08 kJ/mol for oleanolic acid with α-glucosidase. These results suggest that Moroccan virgin olive oil, particularly from the Picholine variety, may serve as a valuable source of bioactive compounds with potential anti-diabetic properties. Optimizing production methods and harvest conditions could enhance the levels of these compounds. However, it should be noted that the predicted binding affinities and therapeutic potential are based solely on in silico analyses, and experimental validation through in vitro and in vivo studies is required to confirm these effects.
Research Highlights
What is the current knowledge?
-
Diabetes mellitus is a chronic metabolic disorder requiring enzyme-targeted treatments to regulate postprandial glucose.
-
Conventional inhibitors of α-glucosidase and α-amylase (e.g., acarbose, miglitol) have side effects and bioavailability issues.
-
Oleanolic and maslinic acids, found in olive oil, have demonstrated inhibitory effects on carbohydrate-digesting enzymes.
-
Molecular docking and dynamics simulations are useful tools for evaluating enzyme-ligand interactions in drug discovery.
-
The composition of bioactive compounds in olive oil is influenced by olive variety, maturity index, and processing methods.
What is new here?
-
Oleanolic and maslinic acids were quantified in Moroccan virgin olive oils, highlighting their variability across regions.
-
The Moroccan Picholine variety had the highest concentrations of these bioactive triterpenes.
-
Olive oil from the two-phase milling process retained higher levels of bioactive compounds than the three-phase method.
-
Molecular docking and MD simulations confirmed strong and stable interactions between these acids and α-amylase/α-glucosidase.
-
MM-PBSA calculations validated the binding affinities, supporting the potential of Moroccan olive oil in diabetes management.
Competing Interests
No potential conflict of interest was reported by the authors.
Ethical Approval
Not applicable.
Supplementary files
Supplementary file 1 contains Figs. S1-S8 and Tables S1-S6.
(pdf)
References
- Ranjouri MR, Aob P, Mansoori Derakhshan S, Shekari Khaniani M, Chiti H, Ramazani A. Association study of IL2RA and CTLA4 gene variants with type I diabetes mellitus in children in the northwest of Iran. Bioimpacts 2016; 6:187-93. doi: 10.15171/bi.2016.25 [Crossref] [ Google Scholar]
- Ojo OA, Ibrahim HS, Rotimi DE, Ogunlakin AD, Ojo AB. Diabetes mellitus: from molecular mechanism to pathophysiology and pharmacology. Med Nov Technol Devices 2023; 19:100247. doi: 10.1016/j.medntd.2023.100247 [Crossref] [ Google Scholar]
- Li Y, Huang TH, Yamahara J. Salacia root, a unique Ayurvedic medicine, meets multiple targets in diabetes and obesity. Life Sci 2008; 82:1045-9. doi: 10.1016/j.lfs.2008.03.005 [Crossref] [ Google Scholar]
- Abchir O, Daoui O, Belaidi S, Ouassaf M, Qais FA, ElKhattabi S. Design of novel benzimidazole derivatives as potential α-amylase inhibitors using QSAR, pharmacokinetics, molecular docking, and molecular dynamics simulation studies. J Mol Model 2022; 28:106. doi: 10.1007/s00894-022-05097-9 [Crossref] [ Google Scholar]
- Peyrot des Gachons C, Breslin PA. Salivary amylase: digestion and metabolic syndrome. Curr Diab Rep 2016; 16:102. doi: 10.1007/s11892-016-0794-7 [Crossref] [ Google Scholar]
- Benrahou K, Naceiri Mrabti H, Bouyahya A, Daoudi NE, Bnouham M, Mezzour H. Inhibition of α-amylase, α-glucosidase, and lipase, intestinal glucose absorption, and antidiabetic properties by extracts of Erodium guttatum. Evid Based Complement Alternat Med 2022; 2022:5868682. doi: 10.1155/2022/5868682 [Crossref] [ Google Scholar]
- Dirir AM, Daou M, Yousef AF, Yousef LF. A review of alpha-glucosidase inhibitors from plants as potential candidates for the treatment of type-2 diabetes. Phytochem Rev 2022; 21:1049-79. doi: 10.1007/s11101-021-09773-1 [Crossref] [ Google Scholar]
- Halegoua-De Marzio D, Navarro VJ. Hepatotoxicity of cardiovascular and antidiabetic drugs. In: Kaplowitz N, DeLeve LD, eds. Drug-Induced Liver Disease. 3rd ed. Boston: Academic Press; 2013. p. 519-40. doi: 10.1016/b978-0-12-387817-5.00029-7.
- Krentz AJ. Evolution of glucose-lowering drugs for type 2 diabetes: a new era of cardioprotection. In: Bagchi D, Nair S, eds. Nutritional and Therapeutic Interventions for Diabetes and Metabolic Syndrome. 2nd ed. Academic Press; 2018. p. 431-54. doi: 10.1016/b978-0-12-812019-4.00033-7.
- Bajoub A, Sánchez-Ortiz A, Ajal EA, Ouazzani N, Fernández-Gutiérrez A, Beltrán G. First comprehensive characterization of volatile profile of north Moroccan olive oils: a geographic discriminant approach. Food Res Int 2015; 76:410-7. doi: 10.1016/j.foodres.2015.05.043 [Crossref] [ Google Scholar]
- Gagour J, El Ghailassi K, Ibourki M, Sakar EH, Gharby S. Physicochemical traits of olive fruit and oil from eight Moroccan wild olive (Olea europaea L subsp oleaster) populations. Biocatal Agric Biotechnol 2024; 56:103021. doi: 10.1016/j.bcab.2024.103021 [Crossref] [ Google Scholar]
- Olmo-García L, Bajoub A, Monasterio RP, Fernández-Gutiérrez A, Carrasco-Pancorbo A. Development and validation of LC-MS-based alternative methodologies to GC-MS for the simultaneous determination of triterpenic acids and dialcohols in virgin olive oil. Food Chem 2018; 239:631-9. doi: 10.1016/j.foodchem.2017.06.142 [Crossref] [ Google Scholar]
- Goncalves BG, Banerjee IA. A computational and laboratory approach for the investigation of interactions of peptide conjugated natural terpenes with EpHA2 receptor. J Mol Model 2023; 29:204. doi: 10.1007/s00894-023-05596-3 [Crossref] [ Google Scholar]
- Sánchez-Quesada C, López-Biedma A, Warleta F, Campos M, Beltrán G, Gaforio JJ. Bioactive properties of the main triterpenes found in olives, virgin olive oil, and leaves of Olea europaea. J Agric Food Chem 2013; 61:12173-82. doi: 10.1021/jf403154e [Crossref] [ Google Scholar]
- Tsimidou MZ, Papoti VT. Bioactive ingredients in olive leaves. In: Preedy VR, Watson RR, eds. Olives and Olive Oil in Health and Disease Prevention. San Diego: Academic Press; 2010. p. 349-56. doi: 10.1016/b978-0-12-374420-3.00039-5.
- Sánchez-Quesada C, Rodríguez-García C, Gaforio JJ. Antiinflammatory activity exerted by minor compounds found in virgin olive oils. In: Preedy VR, Watson RR, eds. The Mediterranean Diet. 2nd ed. Academic Press; 2020. p. 527-35. doi: 10.1016/b978-0-12-818649-7.00046-1.
- Sanchez-Rodriguez E, Biel-Glesson S, Fernandez-Navarro JR, Calleja MA, Espejo-Calvo JA, Gil-Extremera B. Effects of virgin olive oils differing in their bioactive compound contents on biomarkers of oxidative stress and inflammation in healthy adults: a randomized double-blind controlled trial. Nutrients 2019; 11:561. doi: 10.3390/nu11030561 [Crossref] [ Google Scholar]
- Tundis R, Loizzo MR, Menichini F. Natural products as alpha-amylase and alpha-glucosidase inhibitors and their hypoglycaemic potential in the treatment of diabetes: an update. Mini Rev Med Chem 2010; 10:315-31. doi: 10.2174/138955710791331007 [Crossref] [ Google Scholar]
- Collado-González J, Grosso C, Valentão P, Andrade PB, Ferreres F, Durand T. Inhibition of α-glucosidase and α-amylase by Spanish extra virgin olive oils: the involvement of bioactive compounds other than oleuropein and hydroxytyrosol. Food Chem 2017; 235:298-307. doi: 10.1016/j.foodchem.2017.04.171 [Crossref] [ Google Scholar]
- Boutalaka M, El Bahi S, Alaqarbeh M, El Alaouy MA, Koubi Y, Khatabi KE. Computational investigation of imidazo[2,1-b]oxazole derivatives as potential mutant BRAF kinase inhibitors: 3D-QSAR, molecular docking, molecular dynamics simulation, and ADMETox studies. J Biomol Struct Dyn 2024; 42:5268-87. doi: 10.1080/07391102.2023.2233629 [Crossref] [ Google Scholar]
- Daina A, Michielin O, Zoete V. SwissADME: a free web tool to evaluate pharmacokinetics, drug-likeness and medicinal chemistry friendliness of small molecules. Sci Rep 2017; 7:42717. doi: 10.1038/srep42717 [Crossref] [ Google Scholar]
- Pires DE, Blundell TL, Ascher DB. pkCSM: predicting small-molecule pharmacokinetic and toxicity properties using graph-based signatures. J Med Chem 2015; 58:4066-72. doi: 10.1021/acs.jmedchem.5b00104 [Crossref] [ Google Scholar]
- El Bahi S, Boutalaka M, El Alaouy MA, Bouamrane S, Alaqarbeh M, Choukrad MB. Computational investigation of novel pyrimidine derivatives as potent FAK inhibitors via 3D-QSAR, molecular docking, molecular dynamics simulation and retrosynthesis. New J Chem 2023; 47:12816-29. doi: 10.1039/d3nj02471g [Crossref] [ Google Scholar]
- Hamishehkar H, Hosseini S, Naseri A, Safarnejad A, Rasoulzadeh F. Interactions of cephalexin with bovine serum albumin: displacement reaction and molecular docking. Bioimpacts 2016; 6:125-33. doi: 10.15171/bi.2016.19 [Crossref] [ Google Scholar]
- Trott O, Olson AJ. AutoDock Vina: improving the speed and accuracy of docking with a new scoring function, efficient optimization, and multithreading. J Comput Chem 2010; 31:455-61. doi: 10.1002/jcc.21334 [Crossref] [ Google Scholar]
- Boutalaka M, El Bahi S, Maghat H, Lakhlifi T, Bouachrine M. Evaluating the anti-inflammatory potential of Thymus vulgaris extracts: in vitro assessment of solvent effects on 5-LOX inhibition and in silico analysis of bioactive compounds interacting with COX enzymes. Phys Chem Res 2025; 13:583-605. doi: 10.22036/pcr.2025.514842.2668 [Crossref] [ Google Scholar]
- Ouabane M, Zaki K, Zaki H, Guendouzi A, Sbai A, Sekkate C. Inhibition of the Janus kinase protein (JAK1) by the A pyrethrum root extract for the treatment of vitiligo pathology Design, molecular docking, ADME-Tox, MD simulation, and in-silico investigation. Comput Biol Med 2024; 179:108816. doi: 10.1016/j.compbiomed.2024.108816 [Crossref] [ Google Scholar]
- Ren L, Qin X, Cao X, Wang L, Bai F, Bai G. Structural insight into substrate specificity of human intestinal maltase-glucoamylase. Protein Cell 2011; 2:827-36. doi: 10.1007/s13238-011-1105-3 [Crossref] [ Google Scholar]
- Ramasubbu N, Paloth V, Luo Y, Brayer GD, Levine MJ. Structure of human salivary alpha-amylase at 16 A resolution: implications for its role in the oral cavity. Acta Crystallogr D Biol Crystallogr 1996; 52:435-46. doi: 10.1107/s0907444995014119 [Crossref] [ Google Scholar]
- Dassault Systèmes. BIOVIA Discovery Studio Visualizer. 2020. Available from: https://discover.3ds.com/discovery-studio-visualizer-download.
- Zrinej J, Ouabane M, Guendouzi A, Sekkate C, Lakhlifi T, Bouachrine M. Computational design of new 3-phenoxy β-lactams as tubulin polymerization inhibitors for breast cancer therapy. ChemistrySelect 2025; 10:e01238. doi: 10.1002/slct.202501238 [Crossref] [ Google Scholar]
- Zaki K, Ouabane M, Guendouzi A, Sbai A, Sekkate C, Bouachrine M. From farm to pharma: investigation of the therapeutic potential of the dietary plants Apium graveolens L, Coriandrum sativum, and Mentha longifolia, as AhR modulators for immunotherapy. Comput Biol Med 2024; 181:109051. doi: 10.1016/j.compbiomed.2024.109051 [Crossref] [ Google Scholar]
- Olfati AH, Akbarzadeh-Khiavi M, Safary A, Pourseif MM, Adibkia K. Biological characterisation and computational conformation dynamics of putative L-glutaminase YLaM identified from Bacillus licheniformis. Mol Simul 2024; 50:1367-78. doi: 10.1080/08927022.2024.2405693 [Crossref] [ Google Scholar]
- Rahmani A, Jafari R, Nadri S. Molecular dynamics simulation in tissue engineering. Bioimpacts 2025; 15:30160. doi: 10.34172/bi.30160 [Crossref] [ Google Scholar]
- Majidiani H, Pourseif MM, Kordi B, Sadeghi MR, Najafi A. TgVax452, an epitope-based candidate vaccine targeting Toxoplasma gondii tachyzoite-specific SAG1-related sequence (SRS) proteins: immunoinformatics, structural simulations and experimental evidence-based approaches. BMC Infect Dis 2024; 24:886. doi: 10.1186/s12879-024-09807-x [Crossref] [ Google Scholar]
- Yau MQ, Liew CWY, Toh JH, Loo JSE. A head-to-head comparison of MM/PBSA and MM/GBSA in predicting binding affinities for the CB1 cannabinoid ligands. J Mol Model 2024; 30:390. doi: 10.1007/s00894-024-06189-4 [Crossref] [ Google Scholar]
- Alam S, Khan F. QSAR, docking, ADMET, and system pharmacology studies on tormentic acid derivatives for anticancer activity. J Biomol Struct Dyn 2018; 36:2373-90. doi: 10.1080/07391102.2017.1355846 [Crossref] [ Google Scholar]
- Divyashri G, Krishna Murthy TP, Sundareshan S, Kamath P, Murahari M, Saraswathy GR. In silico approach towards the identification of potential inhibitors from Curcuma amada Roxb against H pylori: ADMET screening and molecular docking studies. Bioimpacts 2021; 11:119-27. doi: 10.34172/bi.2021.19 [Crossref] [ Google Scholar]
- Mwakalukwa R, Amen Y, Nagata M, Shimizu K. Postprandial hyperglycemia lowering effect of the isolated compounds from olive mill wastes - an inhibitory activity and kinetics studies on α-glucosidase and α-amylase enzymes. ACS Omega 2020; 5:20070-9. doi: 10.1021/acsomega.0c01622 [Crossref] [ Google Scholar]