Bioimpacts. 16:31358.
doi: 10.34172/bi.31358
Original Article
Computational analysis on design and optimization of low-frequency dielectrophoretic microfluidic lab on a chip for Staphylococcus aureus isolation from blood
Saeed Saedy Conceptualization, Data curation, Methodology, Resources, Validation, Visualization, Writing – original draft, Writing – review & editing, 1 
Navid Alaei-sheini Conceptualization, Data curation, Formal analysis, Methodology, Resources, Supervision, Validation, Writing – original draft, Writing – review & editing, 1, *
Shahrzad Ajabi Resources, Supervision, Writing – review & editing, 1
Karim Ansari-Asl Formal analysis, Methodology, Writing – review & editing, 1
Author information:
1Faculty of Engineering, Shahid Chamran University of Ahvaz, Ahvaz, Iran
Abstract
Introduction:
Bloodstream infections (BSIs) caused by Staphylococcus aureus, particularly methicillin-resistant (MRSA) and methicillin-sensitive (MSSA) strains, remain a critical clinical concern due to high mortality rates and delays in diagnosis. Traditional approaches, such as blood culture, are time consuming, whereas molecular methods are limited by their inability to assess bacterial viability. Dielectrophoresis (DEP)-based lab-on-a-chip (LOC) technology offers a label-free, rapid, and viability preserving alternative for pathogen isolation by exploiting differences in dielectric properties.
Methods:
A dual-channel microfluidic separation device was developed with independently operated pathways. The primary channel (2000×198 μm) integrated ten crown-shaped microelectrodes, while the secondary channel (1540×80 μm) incorporated eight microelectrodes. The primary channel isolated both target strains directly from whole blood; the secondary channel enabled further separation between standard Gram-positive MRSA and MSSA. Finite element modeling was performed using COMSOL Multiphysics, which integrated the Electric Currents, Creeping Flow, and Particle Tracing modules. Separation efficiency was evaluated across varying voltages, electrode geometries, and sample-to-buffer flow rate ratios at 1 Hz. Dielectric properties from published data were used to calculate the Clausius–Mossotti (CM) factor for predicting DEP behavior.
Results:
In the primary channel, nearly 100% separation efficiency and purity were achieved for isolating MRSA and MSSA from red blood cells (RBCs), white blood cells (WBCs), and platelets (PLTs) at 24–28 Vpp and a sample-to-buffer flow rate ratio of 1:2. The secondary channel successfully differentiated MSSA from MRSA at 42–46 Vpp and a 1:5 flow rate ratio, exploiting their distinct membrane characteristics. Crown-shaped electrodes outperformed rectangular designs by generating higher electric field gradients, thereby enhancing separation performance.
Conclusion:
The dual-channel LOC system enables high-efficiency, label-free separation and identification of MRSA and MSSA directly from whole blood using low-frequency negative DEP (nDEP). The optimized configuration supports rapid pathogen detection, offering substantial advantages over conventional diagnostic platforms.
Graphical Abstract
Keywords: Dielectrophoresis, Microfluidics, MSSA, MRSA, Lab on a chip
Copyright and License Information
© 2026 The Author(s).
This work is published by BioImpacts as an open access article distributed under the terms of the Creative Commons Attribution Non-Commercial License (
http://creativecommons.org/licenses/by-nc/4.0/). Non-commercial uses of the work are permitted, provided the original work is properly cited.
Funding Statement
This work in partially funded by Fabrication and Characterization Electronic Sensors (FCES) Research Laboratory of Shahid Chamran University of Ahvaz, under grant number: SCU.EE1403.747.
Introduction
Bloodstream infections (BSIs) caused by Staphylococcus aureus, including MRSA and MSSA strains, represent a persistent public health challenge due to their high mortality rates and the diagnostic delays that complicate timely intervention.1 The World Health Organization has identified BSIs as a leading contributor to hospital-related deaths, with S. aureus frequently implicated as the primary pathogen.2 Conventional diagnostic approaches, such as blood cultures, typically require 48 to 72 hours to yield results,3 often delaying the initiation of targeted antimicrobial therapy. This lag is particularly critical in MRSA cases, where multidrug resistance demands rapid identification to guide appropriate treatment. Molecular assays such as polymerase chain reaction (PCR) offer faster detection but are limited by labor-intensive sample preparation protocols and their inability to assess bacterial viability or antibiotic susceptibility.4 These limitations underscore the need for advanced diagnostic technologies capable of delivering rapid, functional, and clinically actionable information in the context of BSI management.
DEP, a label-free technique that manipulates neutral particles in non-uniform electric fields based on their dielectric properties, presents a promising solution for bacterial isolation.5 The DEP technique utilizes particle polarization, whereby the resultant force is modulated by parameters including electric field frequency, particle dimensions, morphology, and the conductivity of the ambient medium. Low-frequency DEP, operating typically between 10 kHz and 1 MHz, targets the electrical double layer around bacteria,6 thereby enhancing selectivity while reducing undesirable effects such as electrothermal flow and Joule heating that may compromise cell viability at higher frequencies.7 This preservation of bacterial viability is crucial for downstream applications, such as antibiotic susceptibility testing.
Recent studies have demonstrated the successful integration of DEP with complementary techniques such as impedance spectroscopy to produce portable, rapid diagnostic platforms.8 These hybrid systems are particularly relevant in the context of BSIs, where blood components often interfere with nucleic acid amplification methods.8,9 Microfluidic devices incorporating DEP have shown strong potential for continuous separation and concentration of pathogenic bacteria from complex clinical matrices, including whole blood.10 Such platforms address key challenges of traditional DEP systems, including the disruptive effects of high-conductivity physiological fluids, by employing advanced design strategies to improve field distribution and flow control.11 For example, innovations in membrane-free dialysis combined with DEP have facilitated the efficient concentration of bacteria without the need for physical filters. Furthermore, the ability to isolate bacterial cells smaller than 4 µm from blood components highlights the precision and adaptability of microfluidic DEP systems.12
Various electrode configurations, including interdigitated and co-planar quadrupole arrays, have been developed to generate the non-uniform electric fields necessary for effective DEP manipulation.13 Prior studies have demonstrated the utility of these designs in isolating clinically relevant bacteria such as Escherichia coli and S. aureus with high efficiency.14
This study presents the design and numerical evaluation of a microfluidic device engineered to isolate MRSA and MSSA from blood samples using low-frequency DEP. The platform integrates precisely fabricated microelectrodes within dual microfluidic channels to generate controlled electric field gradients that selectively separate S. aureus cells based on their differing outer layers. By optimizing key operational parameters including field frequency, applied voltage, and flow rate the system achieves efficient and specific bacterial isolation while minimizing interference from blood cells.
Background and Theory
DEP refers to the motion of neutral, polarizable particles subjected to a non-uniform electric field, where the induced dipole within the particle interacts with the field to generate a net translational force. This mechanism enables manipulation of a wide range of targets including biological cells, macromolecules, and nanoparticles based on differences in polarizability. Originally introduced by Herbert Pohl in the 1950s, DEP has since become a fundamental component in microfluidic and LOC systems, particularly due to its label-free, non-invasive capabilities in biomedical applications.15
Electric fields for DEP are generated using either alternating current (AC) or direct current (DC), with each current type producing distinct field characteristics suited to specific applications. The time-dependent force F (t) acting on a polarized particle in a medium exposed to an AC field can be calculated as follows:16
(1)
If the stationary field applies, Eq. (1) can be simplified to Eq. (2). 17
(2)
Here, Ɛm is the permittivity of the medium, r is the radius of the particle, and Erms is the root-mean-square of the electric field strength. A dimensionless parameter used to characterize the relationship between the dielectric properties of a particle and its surrounding medium, the CM factor is defined as the electric polarizability of a material divided by its dielectric constant (permittivity) relative to the surrounding medium, as shown in Eq. 3.
The DEP force can be either attractive (positive DEP, pDEP), driving particles toward high-field regions, or repulsive (negative DEP, nDEP), pushing them toward low-field regions (Fig. 1), This behavior is determined by the Clausius-Mossotti factor (CM), a parameter that reflects the relative complex permittivity of the particle and medium. Importantly, the DEP response is frequency-dependent, enabling selective manipulation of particles by adjusting the frequency of the applied alternating current (AC) electric field. The value of Re[fcm] ranges between −0.5 and 1. When, Re[fcm] > 0 particles migrate toward regions of higher electric field strength, a phenomenon referred to as pDEP. Conversely, when Re[fcm] > 0, particles migrate toward regions of lower electric field strength, termed nDEP.
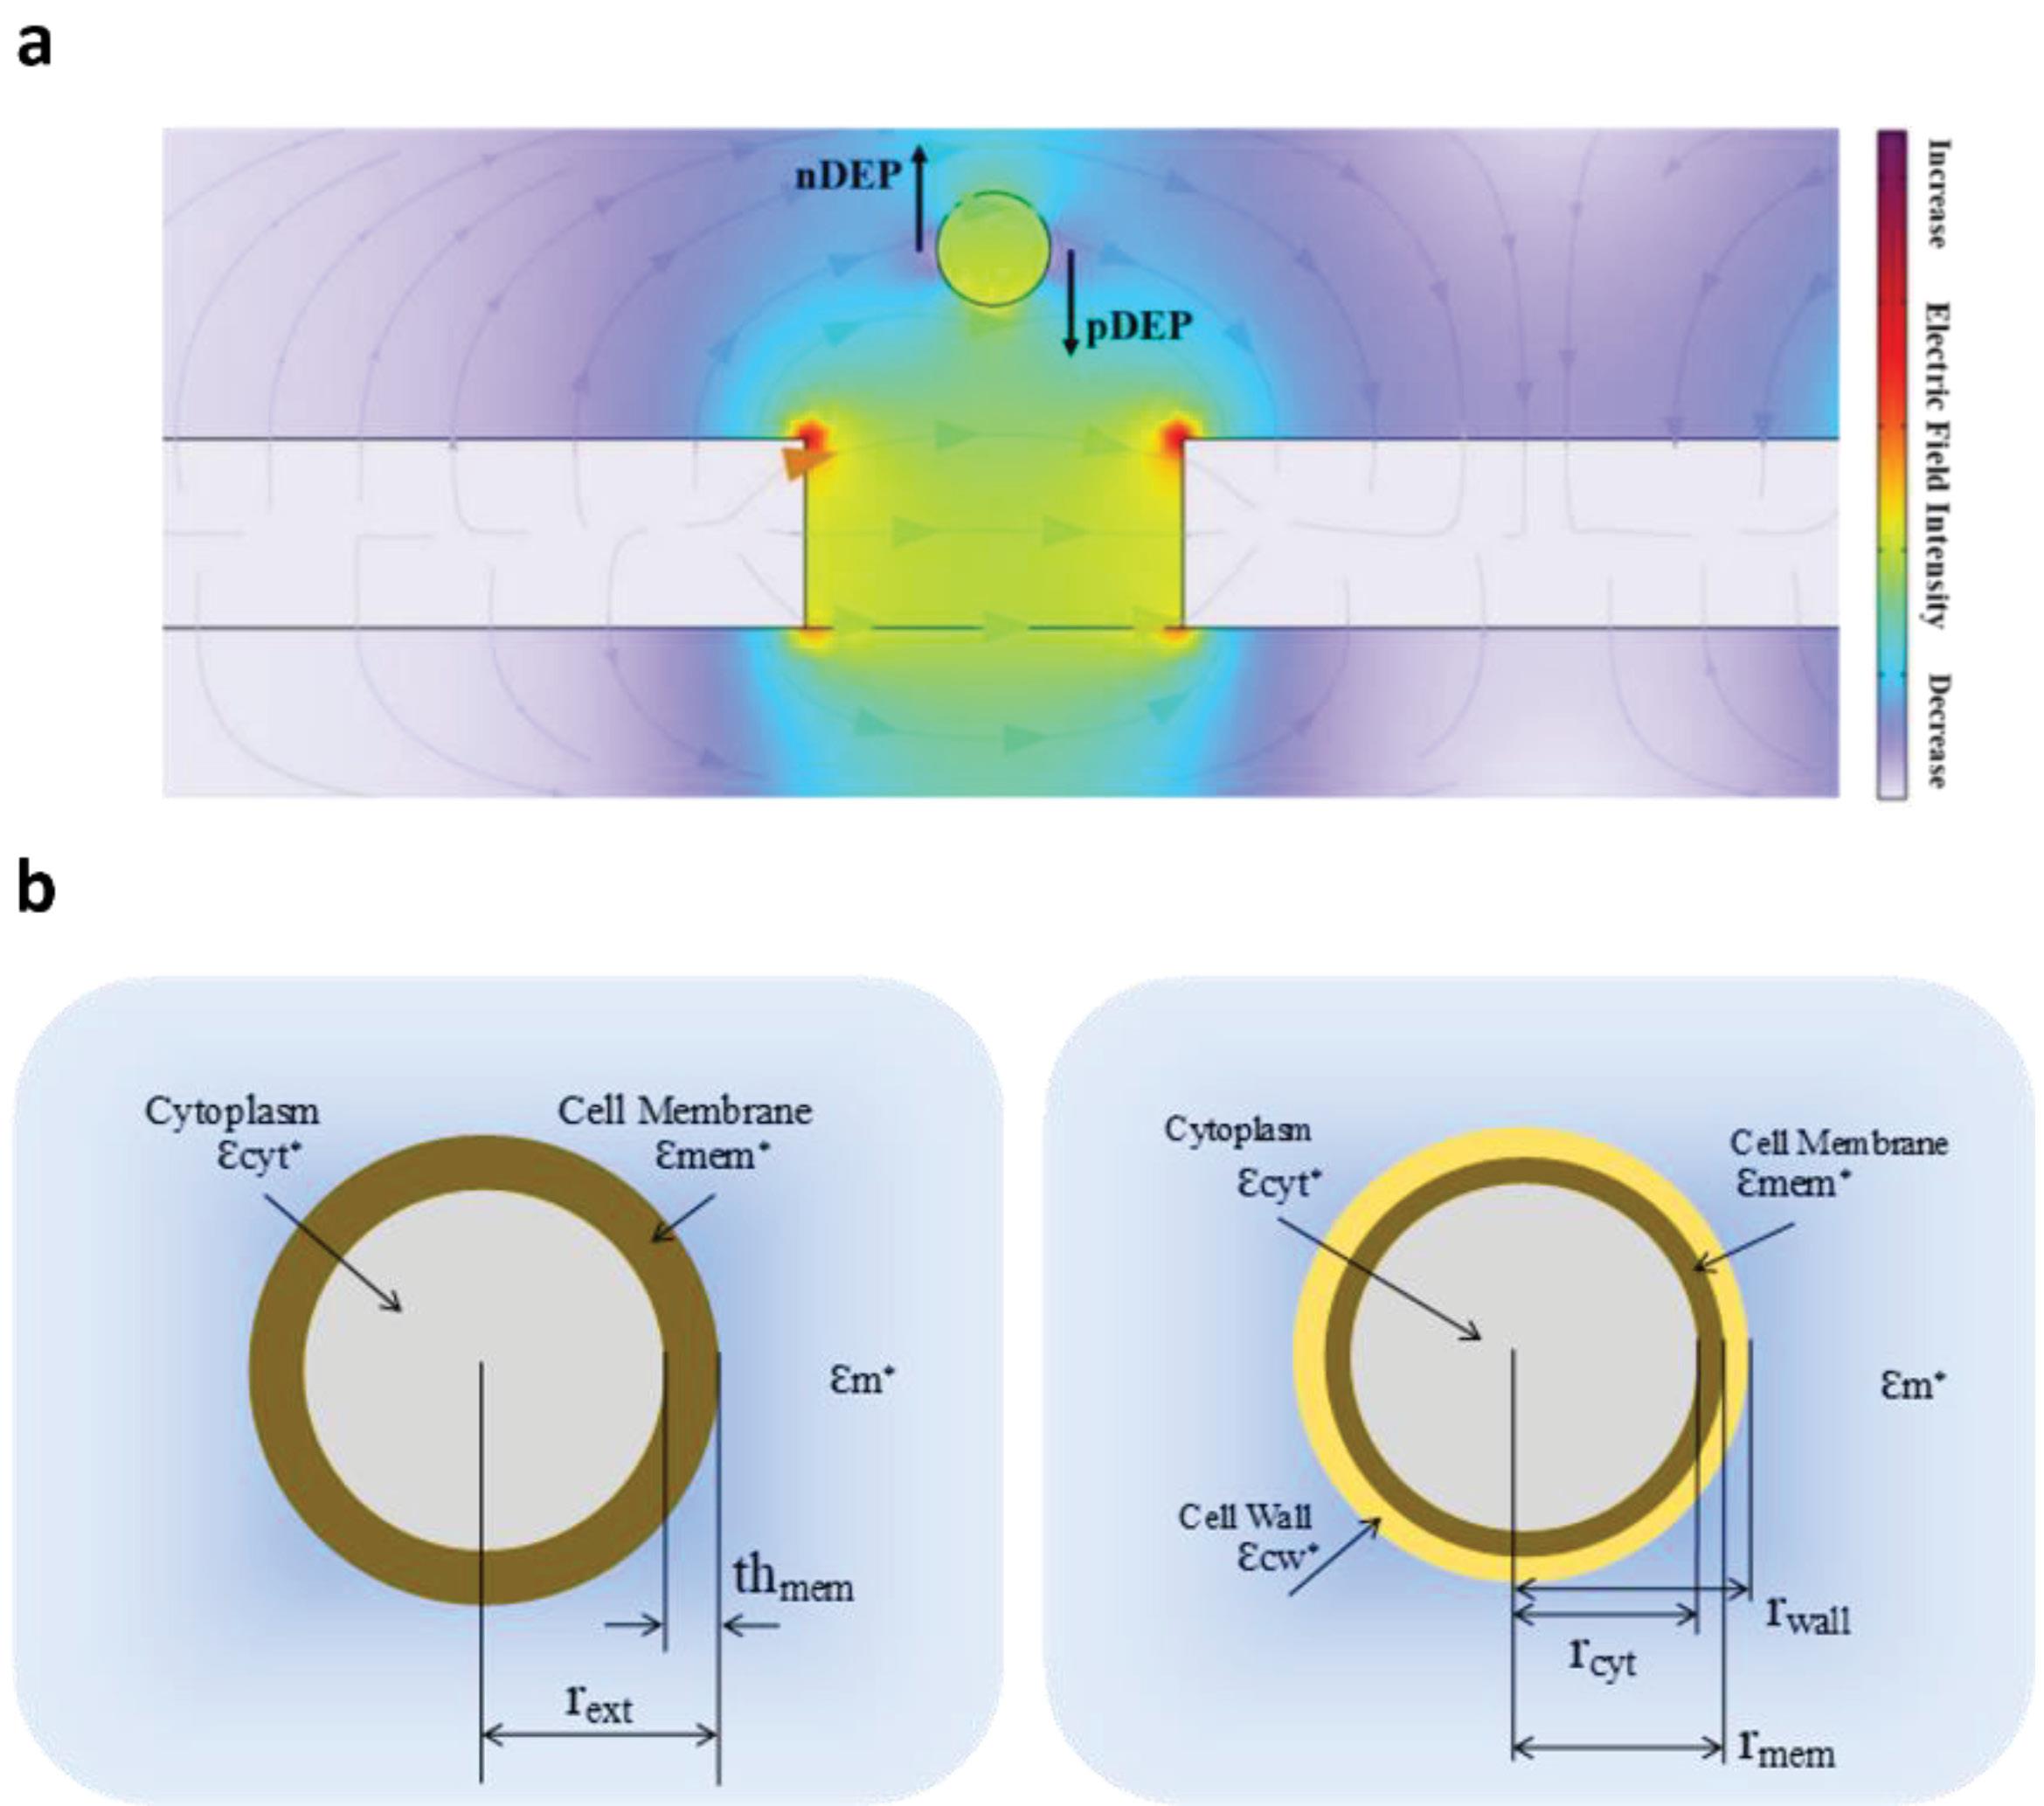
Fig. 1.
(a) Schematic illustration of positive and negative dielectrophoretic (pDEP and nDEP) forces acting on an individual cell. (b) Conceptual model of particles exhibiting single-layer (RBCs, WBCs, and PLTs) and double-layer (MSSA and MRSA) structural configurations.
.
(a) Schematic illustration of positive and negative dielectrophoretic (pDEP and nDEP) forces acting on an individual cell. (b) Conceptual model of particles exhibiting single-layer (RBCs, WBCs, and PLTs) and double-layer (MSSA and MRSA) structural configurations.
Most particles, particularly biological cells, exhibit a complex and heterogeneous structure rather than being homogeneous. Consequently, it is essential to model the distinct layers that comprise these particles, such as the cell membrane and cytoplasm. The calculation of the CM factor necessitates a stepwise determination of the equivalent permittivity of the internal layers, thereby enabling the derivation of a homogeneous equivalent particle.17
The equivalent relative permittivity of a single-layer particle is obtained using Eq. 5.5
(5)
The equivalent relative permittivity of a double-layer particle is determined using Eq. 6 and 7.5
(6)
(7)
The effective permittivity of a suspension, denoted as
, depends on the volume fraction
occupied by the suspended particles. When
, the Maxwell–Garnett mixing rule is applied, as expressed in Eq. 8.17
(8)
As shown by Sihvola et al,18 this formulation is mathematically equivalent to the direct expression given in Eq. 9.
(9)
Alternatively, the Asami–Hainaï model, shown in Eq. 10, extends theoretical validity up to volume fractions approaching
< 0.9: 19
(10)
The movement of microparticles in aqueous fluids is generally described using overdamped first-order dynamics. In this model, the friction coefficient is typically approximated by Stokes' drag on a spherical particle, as expressed in Eq. 11.20
Here,
represents the particle velocity, and ηf denotes the fluid viscosity. The potential energy of a particle modeled as a dipole under an external electric field is defined by Eq. 12.20
(12)
In this expression, Vp corresponds to the particle volume. The CM factor, which reflects the dielectric contrast between the particle and the surrounding medium, typically ranges from −0.5 to 1.
As the cells enter the channel, the buffer solution guides them toward the inner wall. Meanwhile, the DEP force acts as a counterbalance, pushing the cells toward the outer wall. This interplay between the buffer and DEP force effectively sorts the cells into distinct streams, each containing only one type of cell. Throughout the process, the DEP force continuously adjusts the cells' lateral position without altering their forward movement. The driving force for their forward motion comes from fluid drag, which remains stable due to the low Reynolds number of the fluid, ensuring a laminar flow. The expression for fluid drag force is given by Eq. 13.21
In this equation, τp represents the relaxation time, mp is the cell mass, u and v refer to the fluid and cell velocities at the cell location, respectively, and ρp is the cell density, dp is the cell diameter, and μ denotes the dynamic viscosity of the medium.
Design and simulation of LOC
Design of LOC
The dual-channel microfluidic device comprises two independently operated separation modules: a primary channel (2000 × 198 μm) for the initial isolation of bacterial strains from whole blood, and a secondary channel (1540 × 80 μm) designed for high-resolution differentiation between the isolated strains. The LOC platform, shown in Fig. 2, includes two inlets, four outlets, and ten crown-shaped microelectrodes positioned along one side of the chip. To establish a non-uniform electric field within the microchannel, alternating polarities (AC voltage) are applied to the electrodes. A diluted blood sample containing MSSA and MRSA along with RBCs, WBCs, and PLTs is introduced through the sample inlet at an initial flow velocity of 400 μm/s.
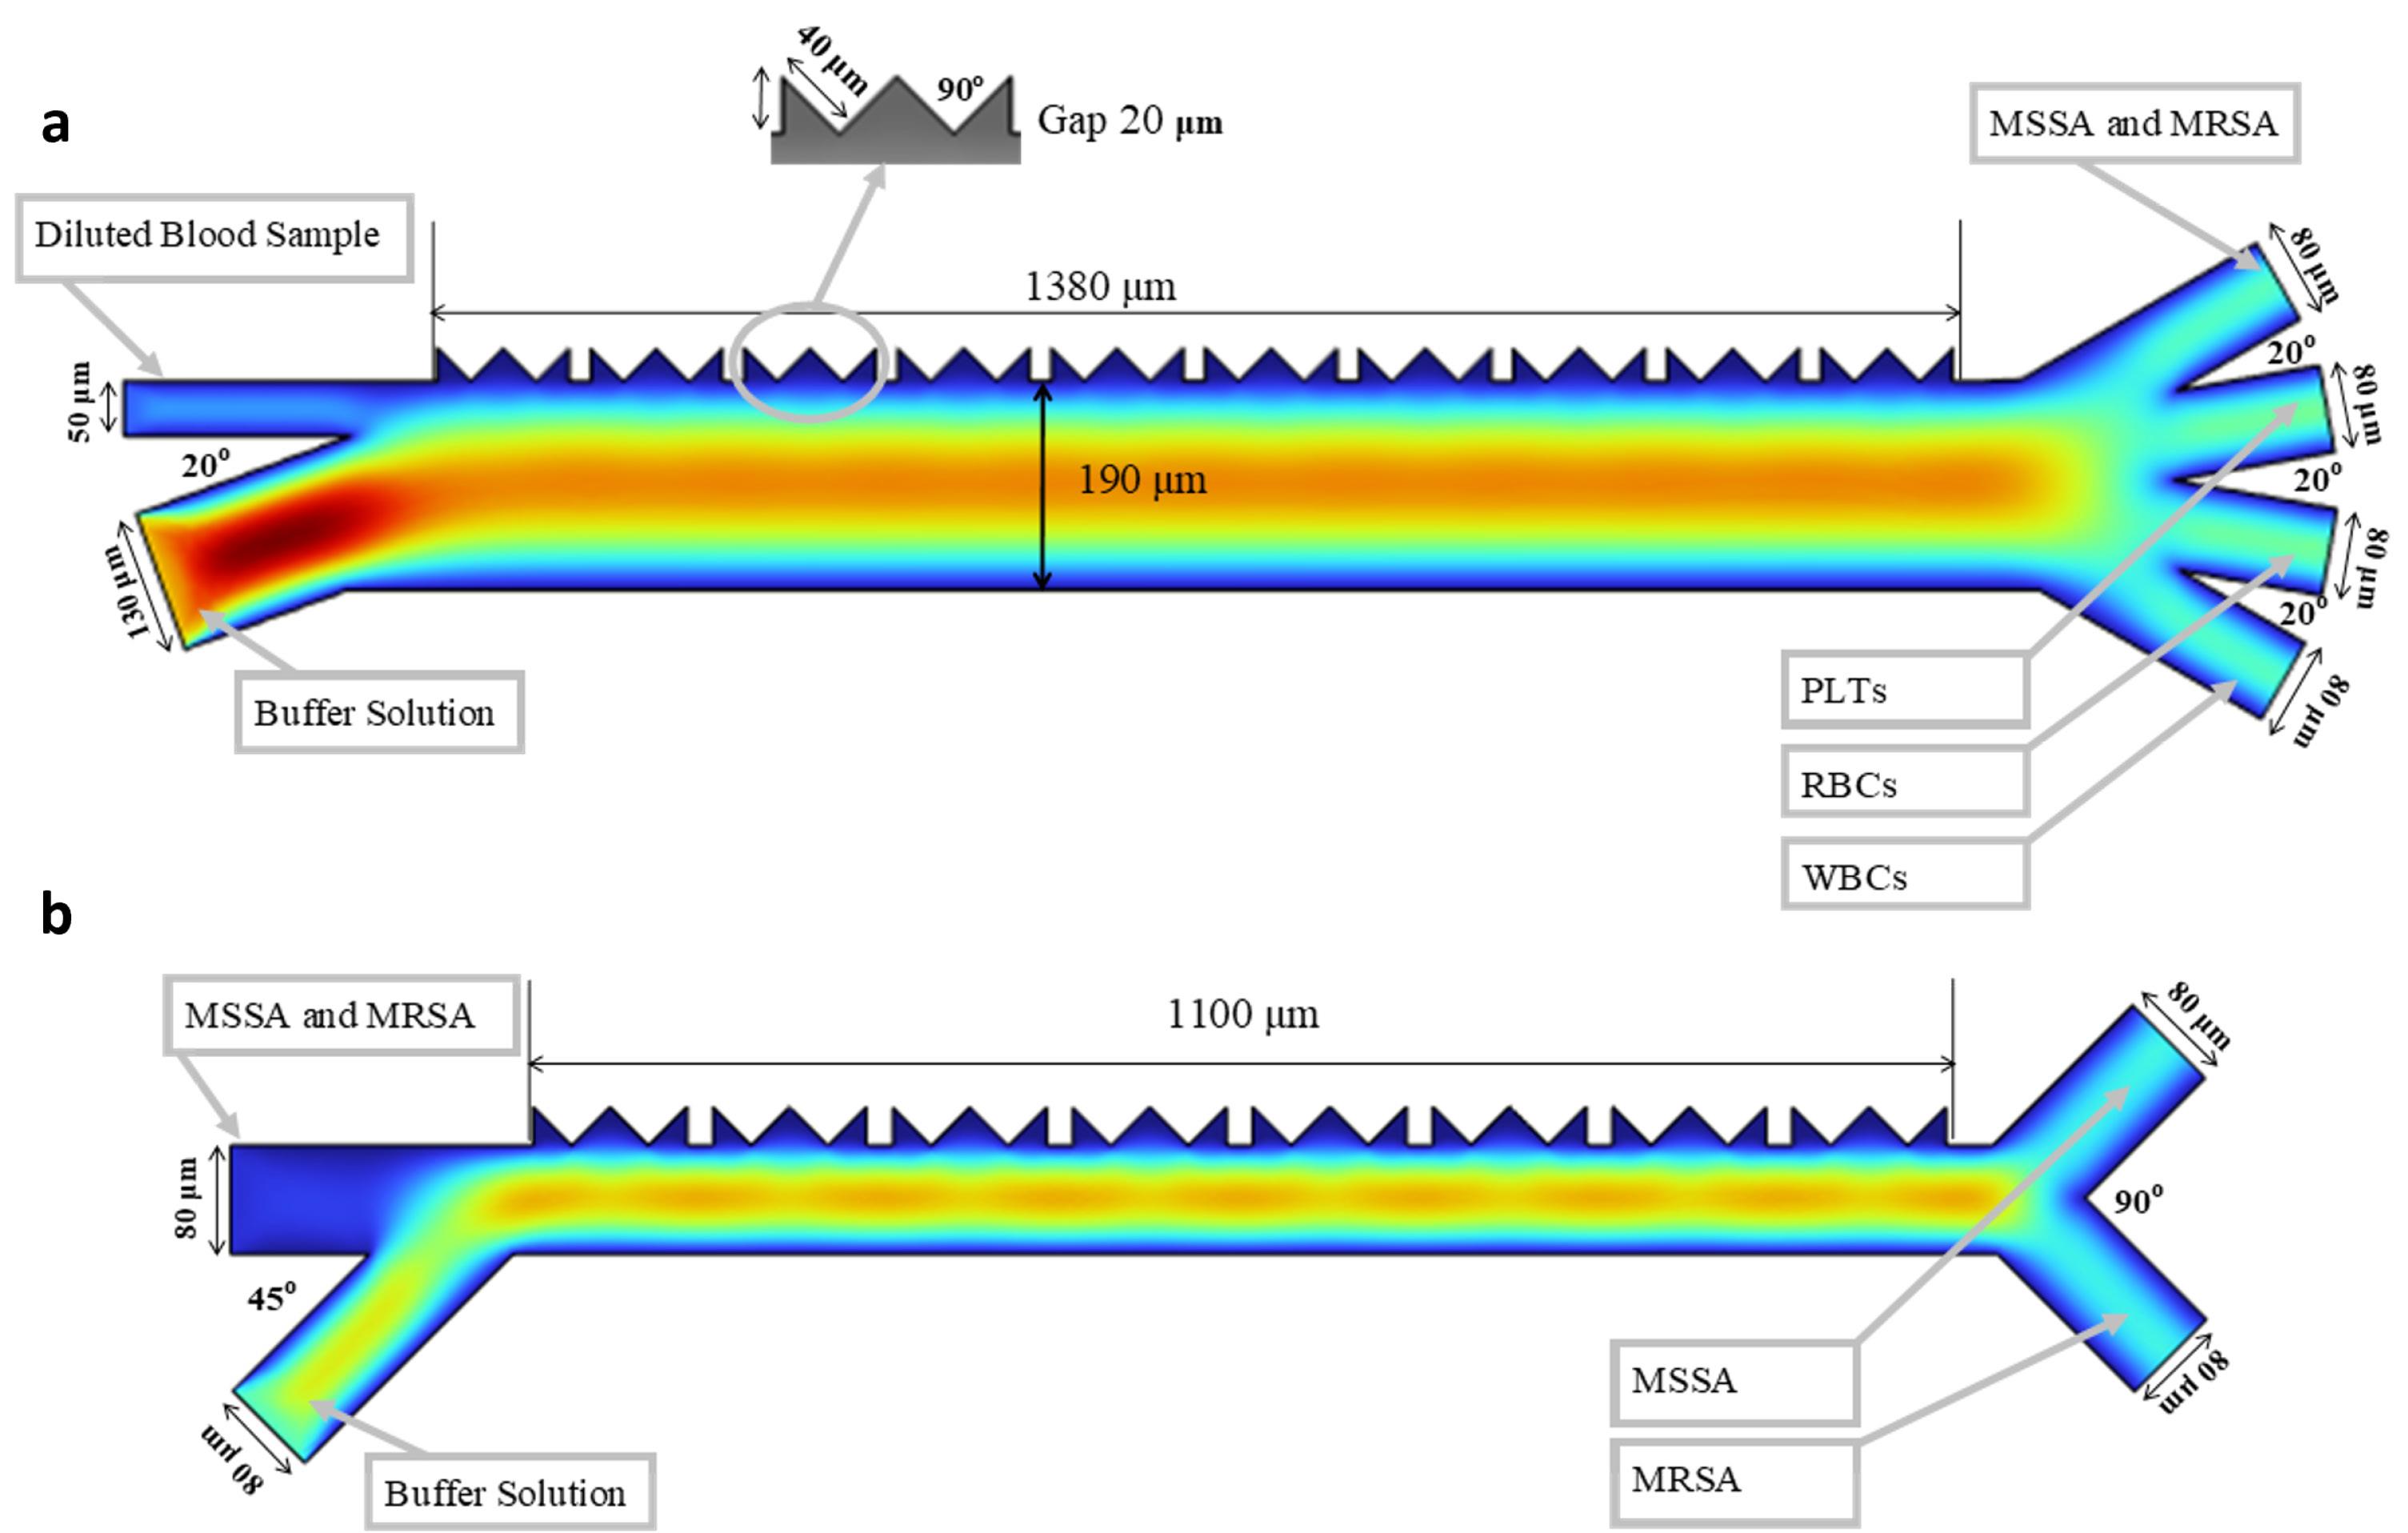
Fig. 2.
Proposed LOC design. (a) Primary channel for separating MSSA and MRSA from blood cells. (b) Secondary channel for differentiating MSSA from MRSA.
.
Proposed LOC design. (a) Primary channel for separating MSSA and MRSA from blood cells. (b) Secondary channel for differentiating MSSA from MRSA.
Simultaneously, a phosphate-buffered saline (PBS) solution is delivered through the buffer inlet at 800 μm/s, serving as the sheath flow. The electric field operates at a constant frequency of 1 Hz.
Although whole blood exhibits non-Newtonian rheology under physiological conditions, in LOC-based cell separation, it is typically diluted to approximate Newtonian behavior, which is more suitable for numerical modeling. Dilution with PBS adjusts the sample’s conductivity to 0.055 S/m and relative permittivity to 80. For simulation purposes, the diluted blood is modeled as a Newtonian fluid with a density of 1000 kg/m³ and a dynamic viscosity of 0.001 Pa·s.22 The dielectric properties of individual cell types are listed in Table 1.
Table 1.
Cell properties
|
Parameters
|
Dimension
|
RBCs
|
WBCs
|
PLTs
|
MSSA
|
MRSA
|
| Diameter (dp) |
μm |
5 |
14 |
2.5 |
0.7 |
1 |
| Particle Density(pd) |
Kg/M3 |
1050 |
1087 |
1064 |
1100 |
1100 |
| Cytoplasm Conductivity (ϭ cp) |
S/m |
0.31 |
0.76 |
0.25 |
0.75E-3 |
0.75E-3 |
| Cytoplasm relative permittivity (Ɛcp) |
1 |
59 |
150 |
50 |
60 |
60 |
| Cell membrane conductivity (ϭ cm) |
S/m |
1E-6 |
24E-6 |
1E-6 |
2.5E-7 |
2.5E-7 |
| Cell membrane relative permittivity (Ɛcm) |
1 |
4.44 |
6.01 |
6 |
6 |
6 |
| Cell membrane thickness (Thcm) |
nm |
9 |
7 |
7 |
8 |
10 |
| Cell wall conductivity (ϭ cm) |
S/m |
- |
- |
- |
6E-3 |
6E-3 |
| Cell wall relative permittivity (Ɛcm) |
1 |
- |
- |
- |
60 |
60 |
| Shell thickness |
nm |
- |
- |
- |
20 |
30 |
| Reference |
|
23
|
23
|
23
|
24,25
|
26
|
A two-dimensional numerical simulation was conducted using COMSOL 6 to evaluate the system’s performance. The finite element model integrated three modules: Creeping Flow for velocity field calculations, Electric Currents for electric field distribution, and Particle Tracing for tracking cell trajectories under combined hydrodynamic and DEP forces.
The separation functionality is distributed across two independent channels. As shown in Fig. 2a, the primary channel isolates MSSA and MRSA from blood components, ensuring that only target bacteria enter the second stage. This step is critical for eliminating interference from other cellular elements. The secondary channel, illustrated in Fig. 2b, functions independently to differentiate between MSSA and MRSA two closely related strains with distinct antibiotic resistance profiles. This distinction holds clinical significance for diagnostics and therapeutic decision-making, given MRSA’s resistance to multiple first-line antibiotics, in contrast to MSSA. Both channels are designed to operate at a frequency of 1 Hz.
The cellular properties used in the simulation are summarized in Table 1. RBCs, WBCs, and PLTs were modeled as single-shell spherical particles, whereas MSSA and MRSA were represented using double-shell sphere approximations.
Antibiotic-resistant bacteria such as MRSA often exhibit thicker cell walls than their MSSA. This structural difference alters their dielectric properties, resulting in a distinct DEP response. Simulations support this: MSSA and MRSA were modeled with cell wall thicknesses of 20 nm and 30 nm, respectively. The thicker MRSA wall enriched in anionic glycopolymers such as wall teichoic acids exhibits higher effective conductivity, leading to enhanced interfacial polarization and a stronger negative DEP response compared to MSSA.26 The differing slopes and capture thresholds observed for MRSA and MSSA indicate distinct electrokinetic mobilities, implying that their dielectrophoretic mobilities also differ. Although the primary known distinction is the presence of the mecA gene and its product, penicillin-binding protein PBP2a, in MRSA, other factors likely contribute. Differences in the cells’ outer layers particularly the cell wall and membrane are expected to exert a greater influence on their DC dielectrophoretic behavior than variations within the cytoplasm.27
Cytoplasmic and membrane electrical parameters were assumed identical for MRSA and MSSA, as published measurements reveal no consistent differences between the strains; the only structurally and statistically distinct feature associated with resistance is peptidoglycan layer thickness (30 nm vs. 20 nm), which was therefore the sole parameter varied in the model.
Simulation procedure with boundary conditions
Fluid flow in the microchannel was modeled under the creeping flow approximation, appropriate for low-Reynolds-number microfluidic conditions. The electric field was obtained by solving Laplace’s equation, and particle trajectories were computed by coupling this field with the fluid velocity, accounting for both dielectrophoretic and hydrodynamic drag forces.
Electric field module configuration
The electric field distribution in the LOC device was modeled using the Electric Currents module, which solves Laplace’s equation under the quasi-electrostatic approximation to determine the potential and field in the conductive medium. The governing equation is given below.
Where is the V is the electrical potential which is V = ± V0(V0 refers to the voltage applied across the electrodes) The electric field distribution is governed by the current density Eq. 16 where ϭ denotes electrical conductivity, E represents electric field intensity, and Jₑ accounts for externally generated current, with resistive losses given by Eq. 15 and the electric field derived from the potential as Eq. 17. The boundary conditions consist of: (i) insulated surfaces at the channel walls, inlet, and outlet; and (ii) a constant AC voltage applied to the crown-shaped microelectrodes.
Creeping flow module for flow field
The creeping flow module was implemented to simulate the fluid dynamics within the LOC device, capturing the low Reynolds number hydrodynamics typical of microfluidic systems, where viscous forces dominate inertial effects. The fluid behavior inside the channel is governed by the Navier–Stokes equations.28
(19)
(20)
u and v represent the velocity components of the fluid, ρ denotes the liquid density, and μ is the dynamic viscosity. The inlet boundary conditions are defined by the normal inflow velocities of blood us and buffer ub, in this regime, the Navier-Stokes equations simplify by neglecting inertial terms, as indicated by the typically small Reynolds number (Re
1). The governing equations for this system are as follows 29
(22)
In Eq. 22, the fluid motion is governed by a balance of several forces. The term
represents the pressure gradient that drives the flow, while
accounts for viscous forces, with η denoting the dynamic viscosity of the fluid. The gravitational body force, ∆ρmg, arises from local density variations ∆ρm typically induced by temperature gradients, the time-averaged electrical body force
.
The simulation applied the following boundary conditions: (i) no-slip conditions at all microchannel walls, (ii) prescribed inlet velocities of 400 μm/s for the blood sample and 800 μm/s for the buffer inlets, and (iii) atmospheric pressure (P0= 0Pa) at all outlets to regulate fluid discharge.
Particle tracking module configuration
The trajectories of cells are determined by solving the equation of motion, derived from the impulse-momentum theorem.28
Here, mp denotes the particle mass, while Fx and Fy represent the components of the total force F. This net force comprises three distinct contributions.28
where Fd represents the drag force, which is proportional to the relative velocity between the particle and the surrounding fluid ur = uf-up.28
where μf represents the fluid viscosity, ρ denotes the fluid density, and dρ is the particle diameter. The Brownian force Fb depends on both the system temperature T and the particle size.28
Here, ξ is a zero-mean Gaussian random variable, kb is the Boltzmann constant 1.38064852 × 10⁻²³ J/K, and ∆t denotes the time step.30 The third term corresponds to the DEP force, which is proportional to the gradient of the electric field squared in Eq. 2. The particle tracing for fluid flow module enables comprehensive simulation of particle-laden flows by coupling discrete particle motion with continuum fluid dynamics. This approach resolves particle trajectories under the influence of hydrodynamic forces. In this module, the following boundary conditions are applied: (i) a bouncing boundary condition is imposed at the microchannel wall; (ii) Stokes’ law is used to regulate the drag force; (iii) the primary flow velocity at the inlets is defined based on the creeping flow velocity field; and (iv) the outlets are configured with the freezing wall condition.
Clausius-Mossotti factor of the particles
The CM relation is a key principle in understanding the dielectric behavior of particles within a medium, particularly in applications involving DEP.31 This relation describes how the polarizability of a particle is influenced by its permittivity relative to the surrounding medium. In our study, we leverage this principle to design a two-step separation process for biological components. The real part of the CM factor for RBCs, WBCs, and PLTs is shown in Fig. 3a, while Fig. 3b shows the real part for the S aureus strains. MRSA and MSSA exhibit differences in diameter, cell membrane thickness and outer shell thickness, yielding complex permittivities per bacterial cell according to Eq. 3. This divergence, results in variations in the real part of the CM polarization factor and their corresponding DEP responses.26 By operating at a frequency of 1 Hz, our system effectively isolates these components, demonstrating the utility of the CM relation in achieving efficient separations for biomedical applications.
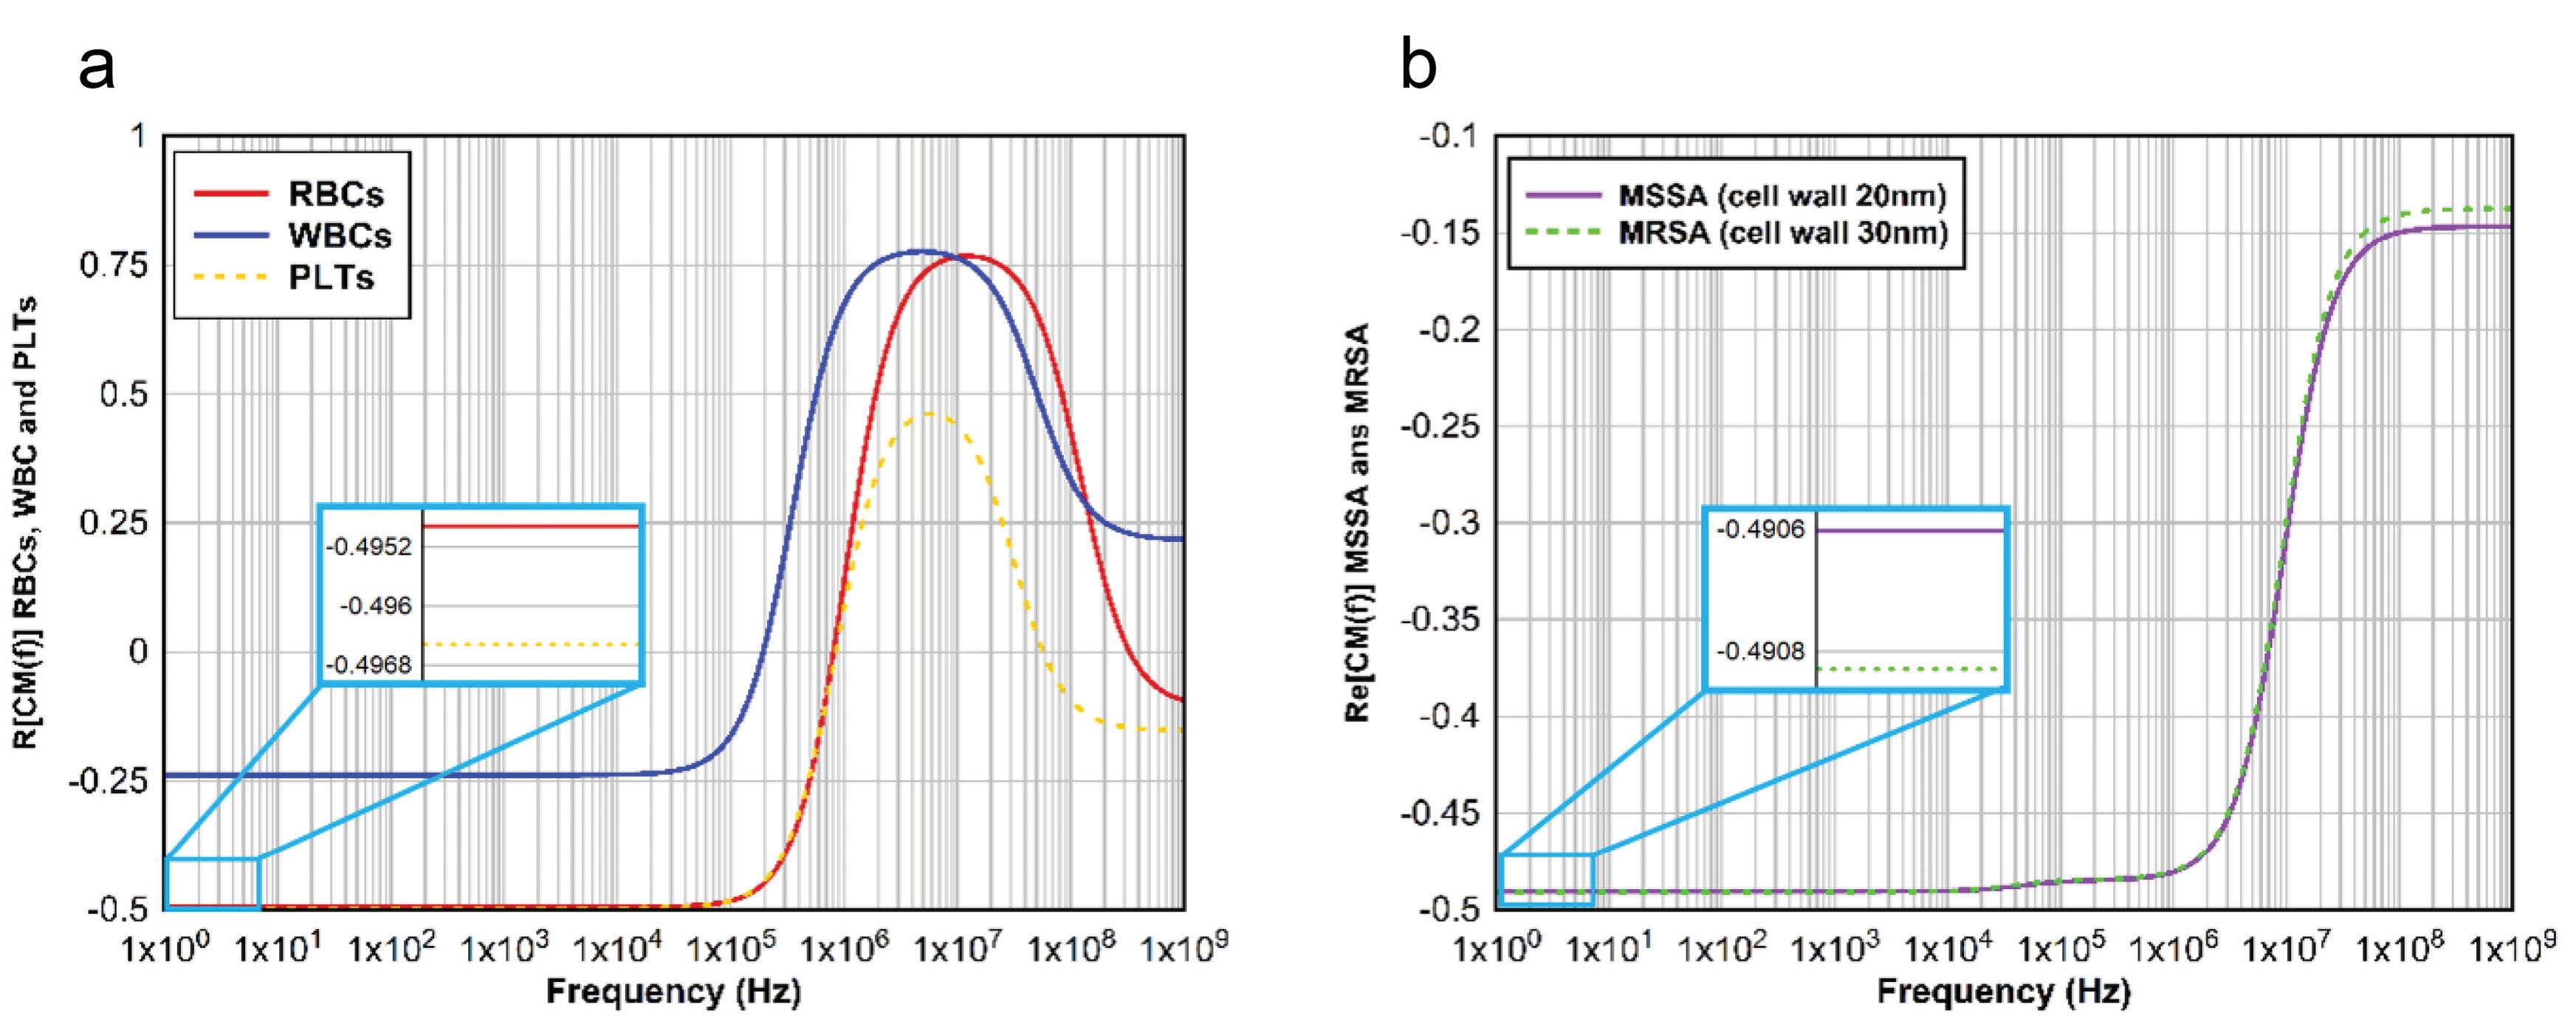
Fig. 3.
The real part of the CM factor as a function of frequency for particles experiencing nDEP at 1 Hz: (a) RBCs, WBCs, and PLTs; (b) MRSA and MSSA.
.
The real part of the CM factor as a function of frequency for particles experiencing nDEP at 1 Hz: (a) RBCs, WBCs, and PLTs; (b) MRSA and MSSA.
The aim of this research to achieve separation using the nDEP force is clearly illustrated in Fig. 3a. The nDEP region for these cells occurs below the WBC crossover frequency in the simulation. Based on the chip outlets design and DEP force intensity, the effective separation range was found to be between 1 Hz and 90 kHz. Therefore, the lower frequency limit of 1 Hz was selected for operation. Table 2 shows the Re[CM(f)] and the DEP force on the particle divided by of the square of the field at the selected frequency.
Table 2.
Value of CM real part at the 1 Hz
|
Particle
|
Re [CM(f)]
|
Fdep/∇| E2|
|
| RBC |
-0.49492 |
-5.93902E-26 |
| WBC |
-0.23835 |
-3.63348E-25 |
| Platelet |
-0.49652 |
-1.28698E-26 |
| MSSA |
-0.4906 |
-9.34871E-29 |
| MRSA |
-0.49083 |
-3.43501E-28 |
Results and Discussion
In this section, we present a detailed analysis of the key parameters that influence the performance of the LOC device, with emphasis on four core aspects: (i) the effect of electrode geometry on electric field distribution within the microchannel, (ii) the influence of applied voltage on separation efficiency, (iii) the impact of the sample-to-buffer velocity ratio on both resolution and throughput, and (iv) a systematic mesh convergence study to validate the accuracy and reliability of the numerical simulations.
Experimental validation
To validate nDEP functionality, we compared our simulation results with experimental data reported in the literature.32 Specifically, the cell trajectories of PLTs and RBCs obtained from simulations were compared with corresponding experimental observations (Fig. 4a). A strong correlation between the simulated and experimental trajectories was observed, as shown in Fig. 4b, confirming the accuracy and reliability of the numerical approach used to model nDEP-driven separation.22
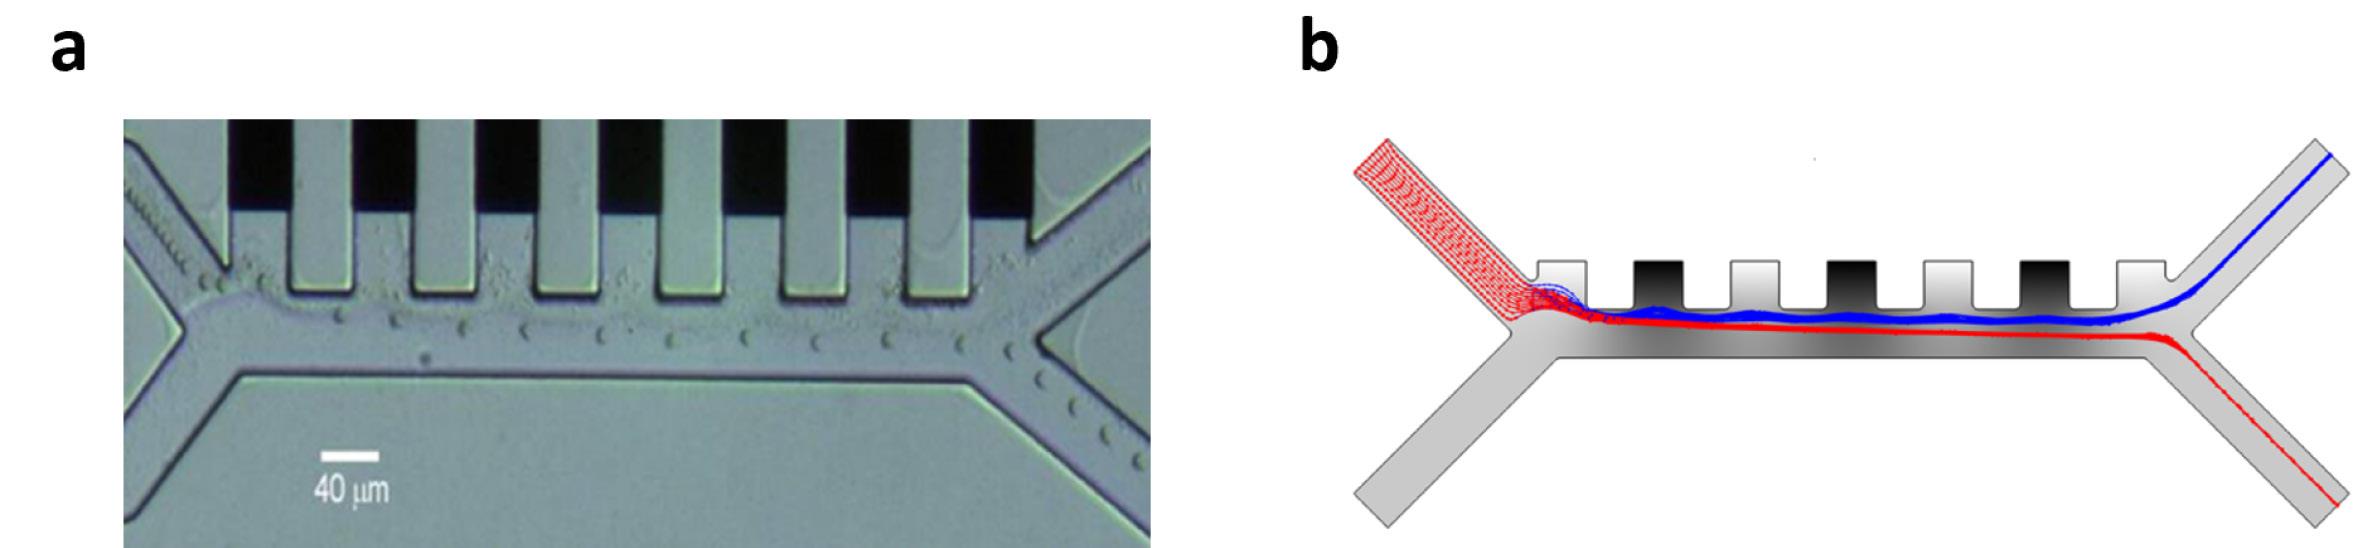
Fig. 4.
Comparison of simulation and experimental data: (a) experimental trajectories, (b) simulation results
.
Comparison of simulation and experimental data: (a) experimental trajectories, (b) simulation results
Although this study primarily targets standard Gram-positive bacterial strains, experimental data from Roziani et al26 indicate that MRSA exhibits a positive real part of the CM factor, Re[CM(f)], at frequencies below 2 MHz. In response to these findings, a modified microchannel configuration was introduced to account for the specific dielectric behavior of MRSA under low-frequency DEP conditions. Details of this revised design are provided in Supplementary file 1, where the geometry has been optimized to enhance the separation of MRSA based on its distinct polarization characteristics.
Electrode shape effect on the LOC’s internal electrical field strengths
The geometry of the electrodes plays a critical role in shaping the internal electric field distribution within the LOC device and directly affects its ability to isolate target cells. Variations in electrode design alter the field strength, uniformity, and gradient factors that are essential for precise cell manipulation under dielectrophoretic conditions. Electrode configurations such as interdigitated, sawtooth, or tapered structures can create localized zones of intensified electric fields or generate tailored field distributions that enhance separation efficiency. In this study, different electrode geometries were evaluated to identify designs that maximize electric field intensity while maintaining controlled gradients across the microchannel, thereby enabling efficient and targeted cell separation.
Non-uniform electric fields were generated by applying a peak-to-peak voltage (Vpp) across the electrodes. Achieving a sufficiently strong field depends heavily on the electrode geometry. As shown in Fig. 5a, two distinct geometries were investigated: conventional rectangular microelectrodes and crown-shaped electrodes. An input of 16 Vpp was applied in both cases. The spatial distribution of the resulting electric field demonstrates higher intensity near electrode edges and directly in front of the structures, with a noticeable decline toward the channel center. This localization effect amplifies the field strength in regions proximal to the electrode surfaces.
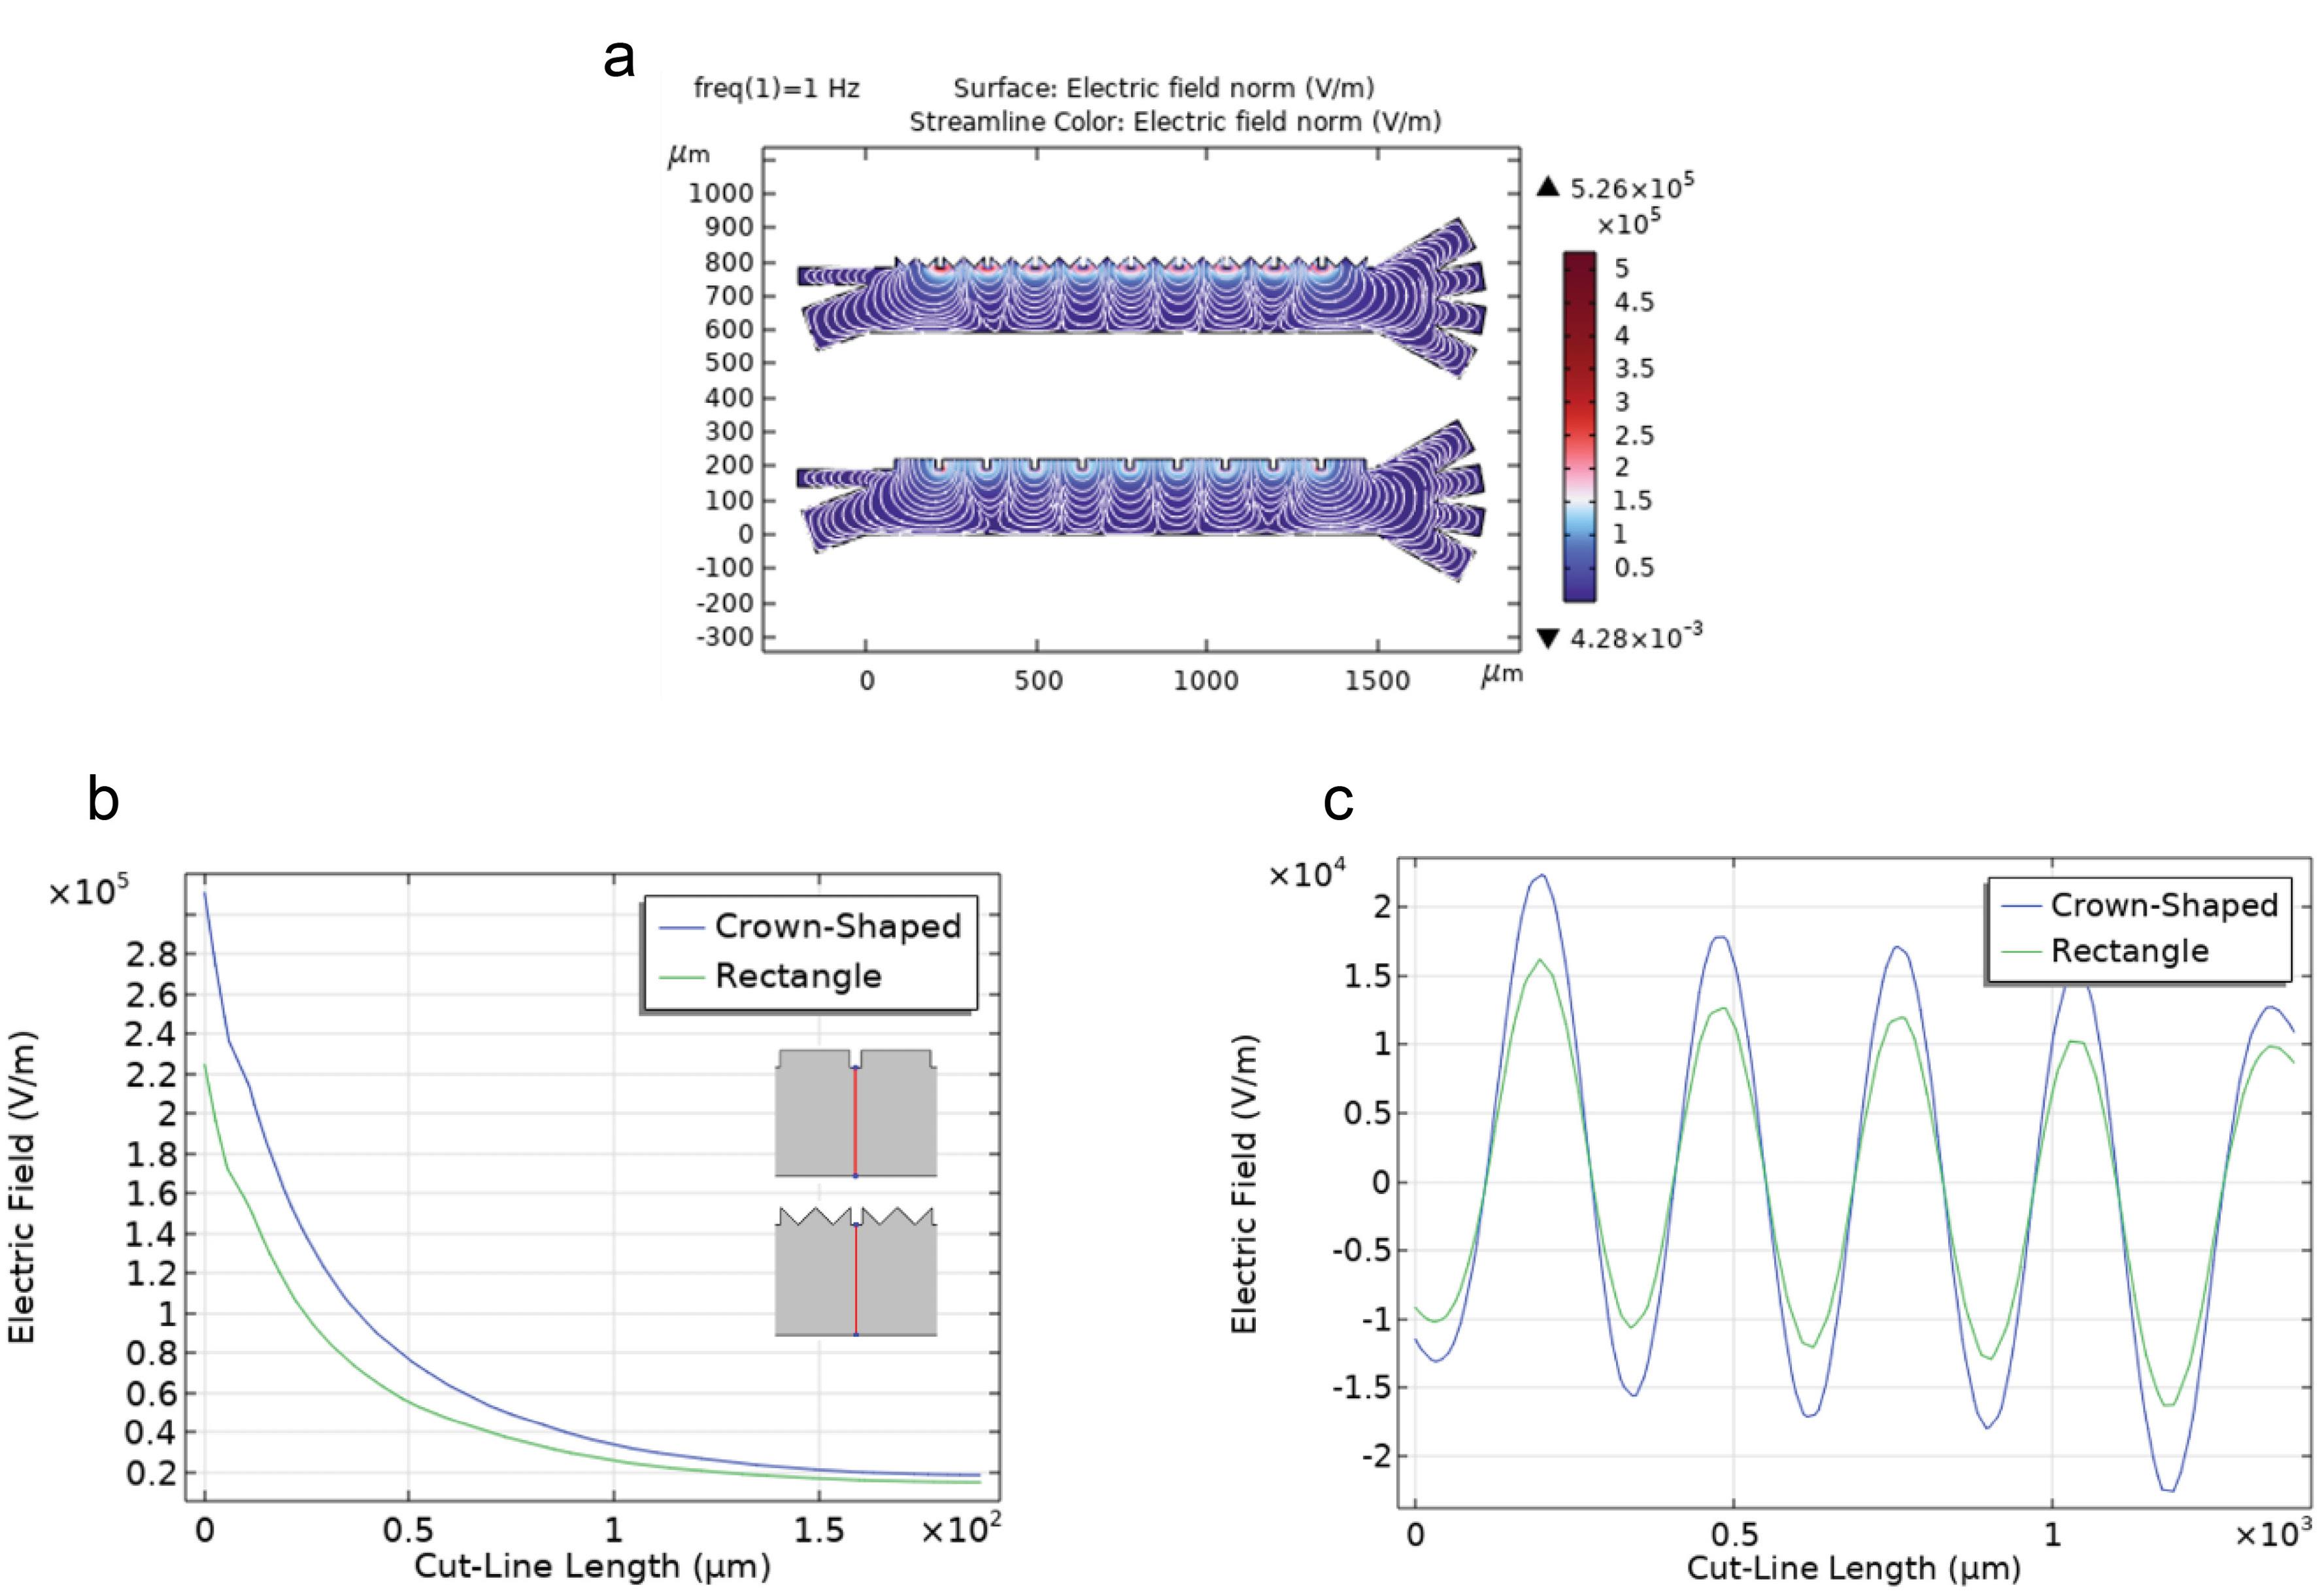
Fig. 5.
(a) Electric field distribution for both electrode geometries. (b) Electric field intensity along a verticalcutline at 40 μm. (c) Comparative field strengths of rectangular vs. crown-shaped electrodes
.
(a) Electric field distribution for both electrode geometries. (b) Electric field intensity along a verticalcutline at 40 μm. (c) Comparative field strengths of rectangular vs. crown-shaped electrodes
To facilitate quantitative comparison, a reference line was drawn 40 μm from the electrode surfaces. As illustrated in Figs. 5b and 5c, crown-shaped microelectrodes produce significantly stronger electric field intensities along this line compared to the rectangular configuration, confirming their superior performance in generating gradient-rich environments for DEP-based cell manipulation.
Electrode voltages’ effect on separation performance
The performance of the LOC device in separating target cells is governed by the voltage applied across its electrodes. This voltage dictates the electric field strength and, consequently, the magnitude of DEP forces. Higher voltages intensify the electric field, enhancing cell deflection and improving both separation purity (SP) the proportion of target cells among all cells collected at the outlet channel and separation efficiency (SE) the fraction of injected target cells recovered at the outlet. Elevated SP indicates fewer contaminating cells, while higher SE reflects better target cell capture and delivery. However, excessively high voltages can induce adverse effects such as localized Joule heating, fluid instability, or laminar flow disruption, compromising separation integrity.
Following optimization of the electrode geometry, voltage was systematically varied to assess its effect on field strength and subsequent DEP-driven separation. As depicted in Fig. 6a, the first separation channel effectively isolated MRSA and MSSA from RBCs, WBCs, and PLTs. In the second stage, as shown in Fig. 6b, a voltage of 42 Vpp yielded optimal resolution between MSSA and MRSA, confirming the design's ability to discriminate between these two closely related strains based on their distinct dielectric signatures.
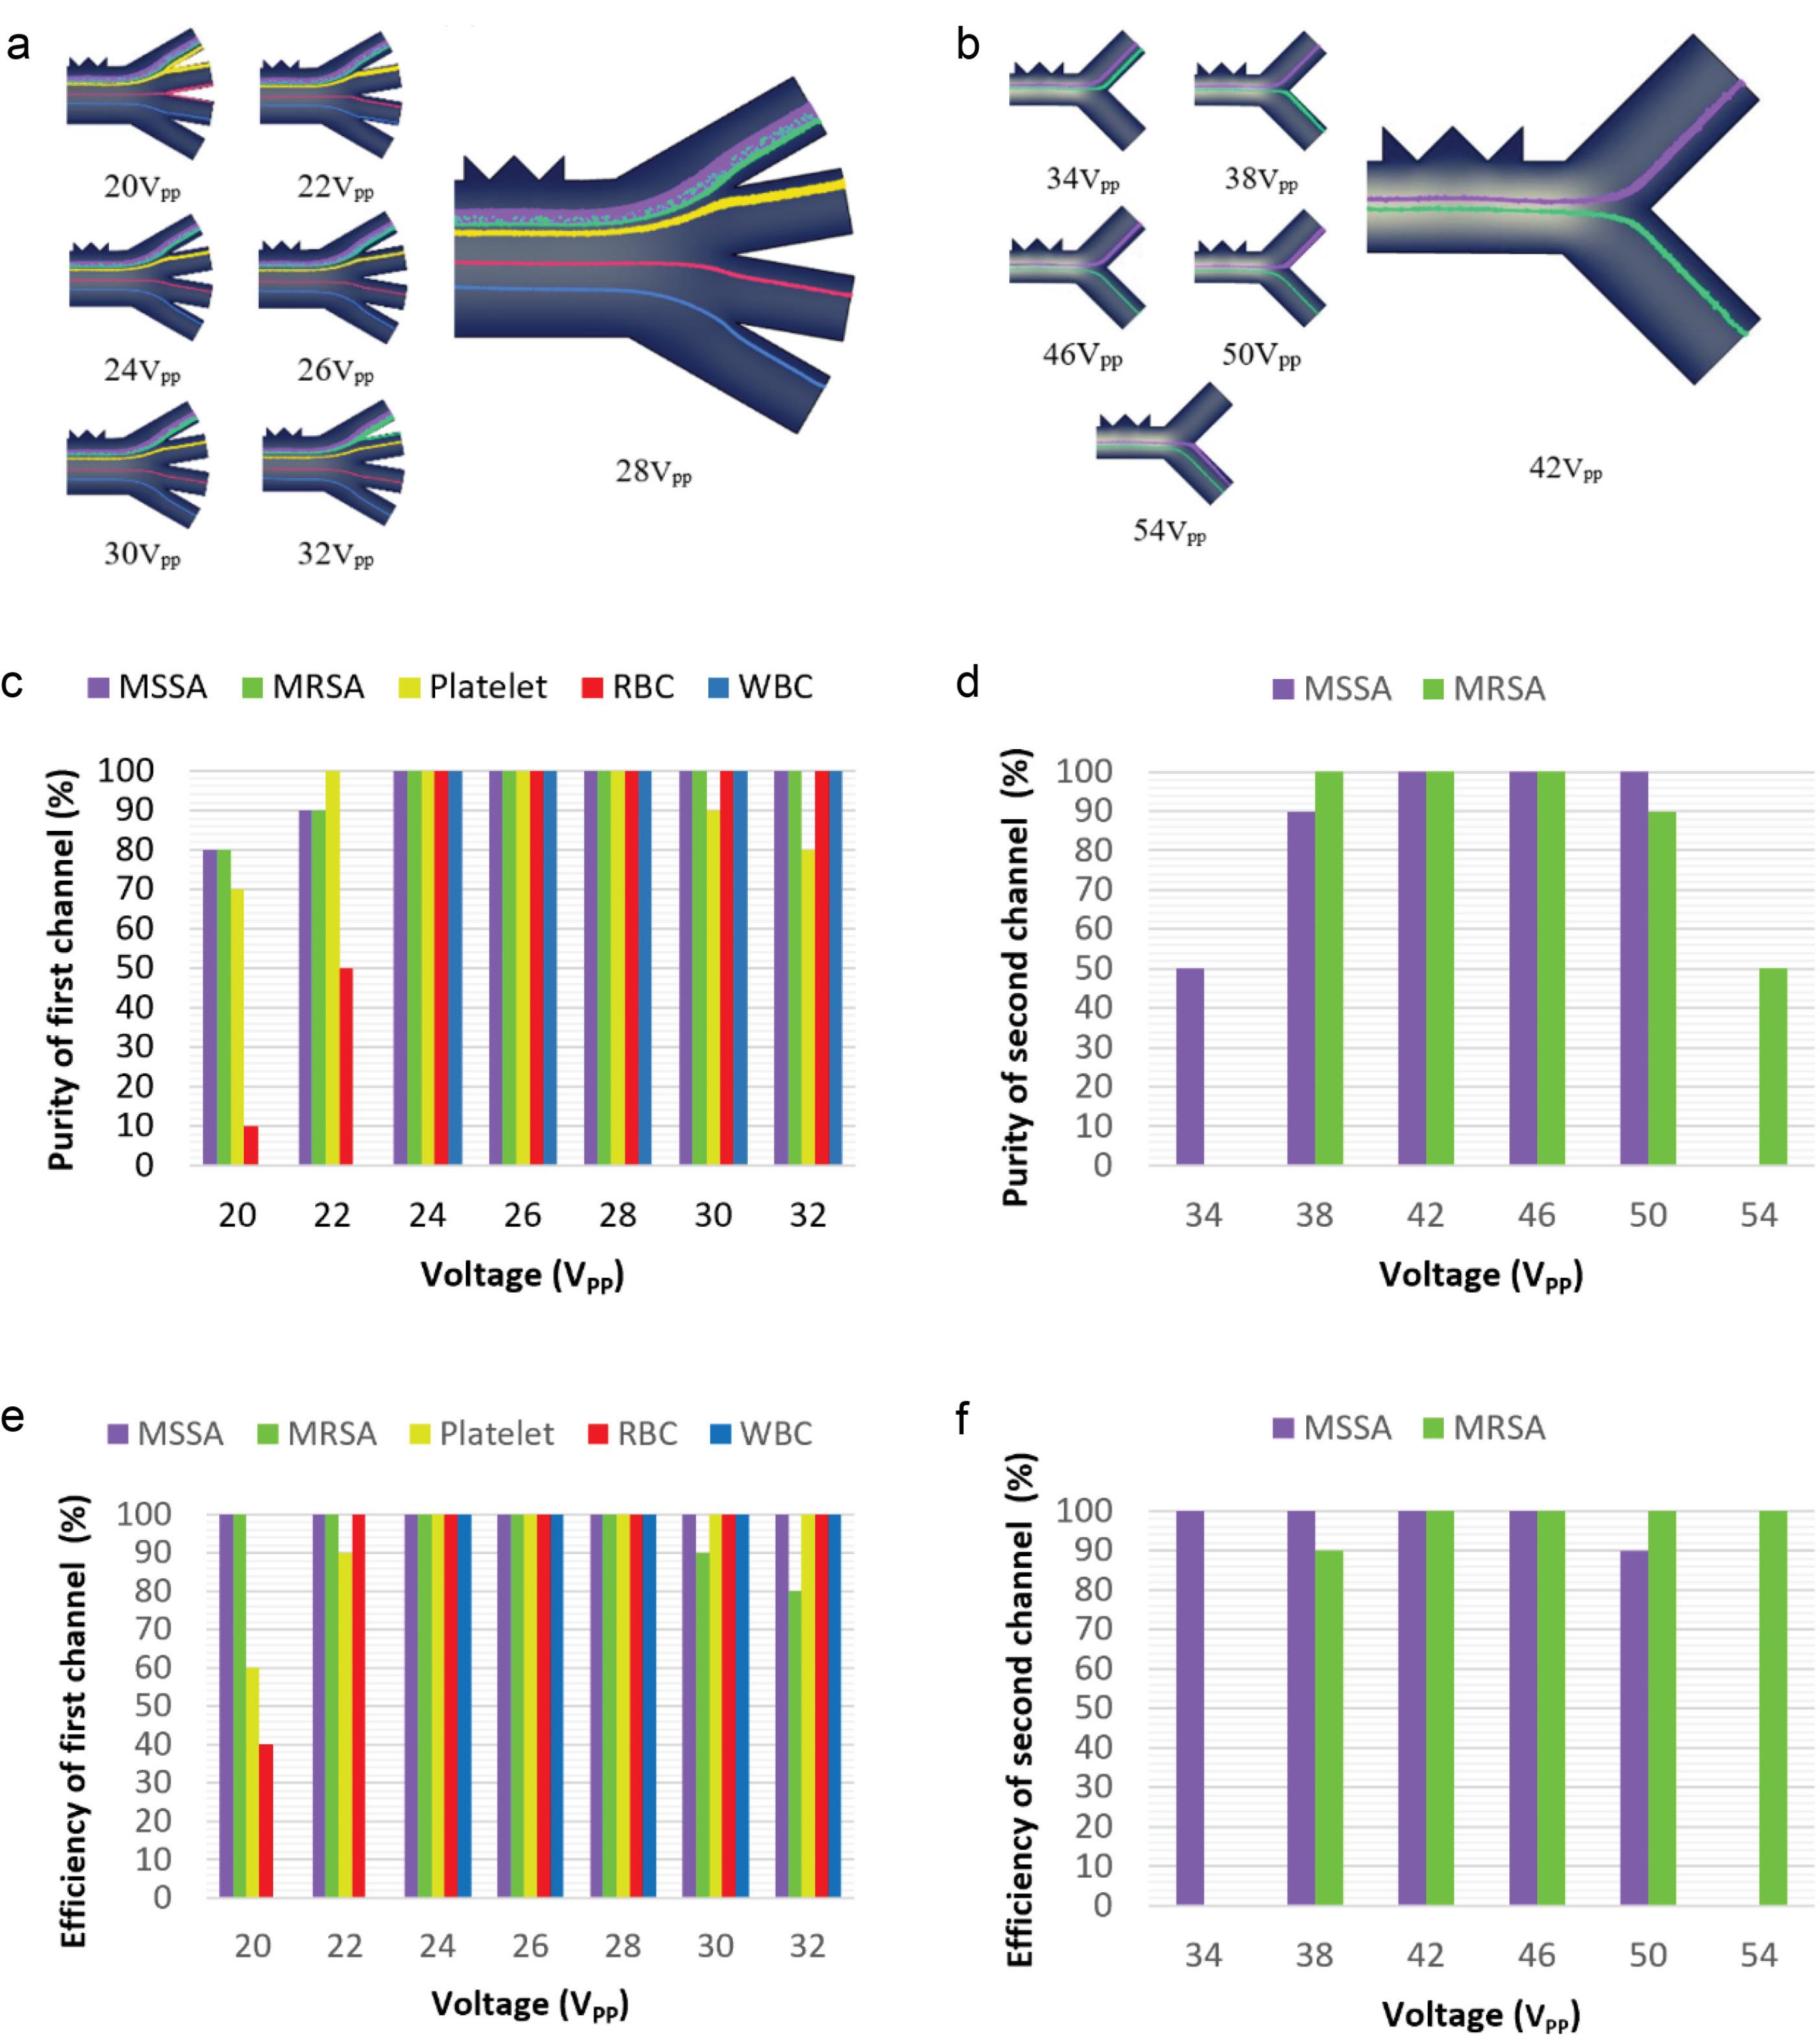
Fig. 6.
Effect of applied voltage on separation performance. (a) First-stage separation of MRSA and MSSA from blood cells. (b) Second-stage resolution of MRSA and MSSA. (c, e) Purity and efficiency for the first channel under varying voltages. (d, f) Purity and efficiency for the second channel under varying voltages
.
Effect of applied voltage on separation performance. (a) First-stage separation of MRSA and MSSA from blood cells. (b) Second-stage resolution of MRSA and MSSA. (c, e) Purity and efficiency for the first channel under varying voltages. (d, f) Purity and efficiency for the second channel under varying voltages
Quantitative results presented in Fig. 6c–f demonstrate the impact of voltage variation on SP and SE across both channels. Specifically, Figs. 6c and 6e illustrate SP and SE for the initial separation of bacteria from blood cells, while Figs. 6d and 6f report these metrics for the second-stage differentiation between MSSA and MRSA.
Effect of electrode potential at V = 0
At 0 V, the simulation results show that all particles exit through the first outlet due to the absence of an electric field, confirming that particle trajectory is governed solely by the fluid flow. Without dielectrophoretic or electrokinetic forces, there is no lateral deflection of particles, resulting in no separation and complete passage through the first outlet, as illustrated in Fig. S1.
Velocity ratio effect on separation performance
Separation performance in the LOC device is significantly affected by the velocity ratio between the sample and buffer inlets, which governs fluid shear dynamics and particle residence time within the microchannel. This ratio directly modulates the interaction between hydrodynamic forces and dielectrophoretic displacement, influencing both the precision and efficiency of bacterial isolation.
Increasing the sample inlet velocity relative to the buffer inlet accelerates particle transit through the electric field, thereby reducing the exposure time to DEP forces. Although this configuration may enhance throughput, it limits lateral deflection and can compromise the purity of separation. In contrast, increasing buffer inlet velocity prolongs particle residence within the high-gradient field region, enabling more effective cell manipulation and improving both SP and SE. However, excessive buffer flow may cause dilution effects or shift particles beyond the effective capture region.
The velocity ratio must be optimized based on the dielectric and physical properties of the target particles and the separation objectives. In this study, a ratio of 1:2 (sample: 400 μm/s, buffer: 800 μm/s) yielded optimal performance. Under these conditions, DEP forces acted efficiently on both blood cells and bacterial targets, producing high-purity isolation with minimal cross-contamination across both separation stages. Quantitative analysis of SP and SE metrics under different inlet conditions is presented in Fig. 7c–f, confirming superior separation outcomes at the 1:2 ratio. Fig. 7a and 7b illustrate cell trajectory distributions for the first-stage (MRSA and MSSA from RBCs, WBCs, and PLTs) and second-stage (MRSA from MSSA) separations, respectively.
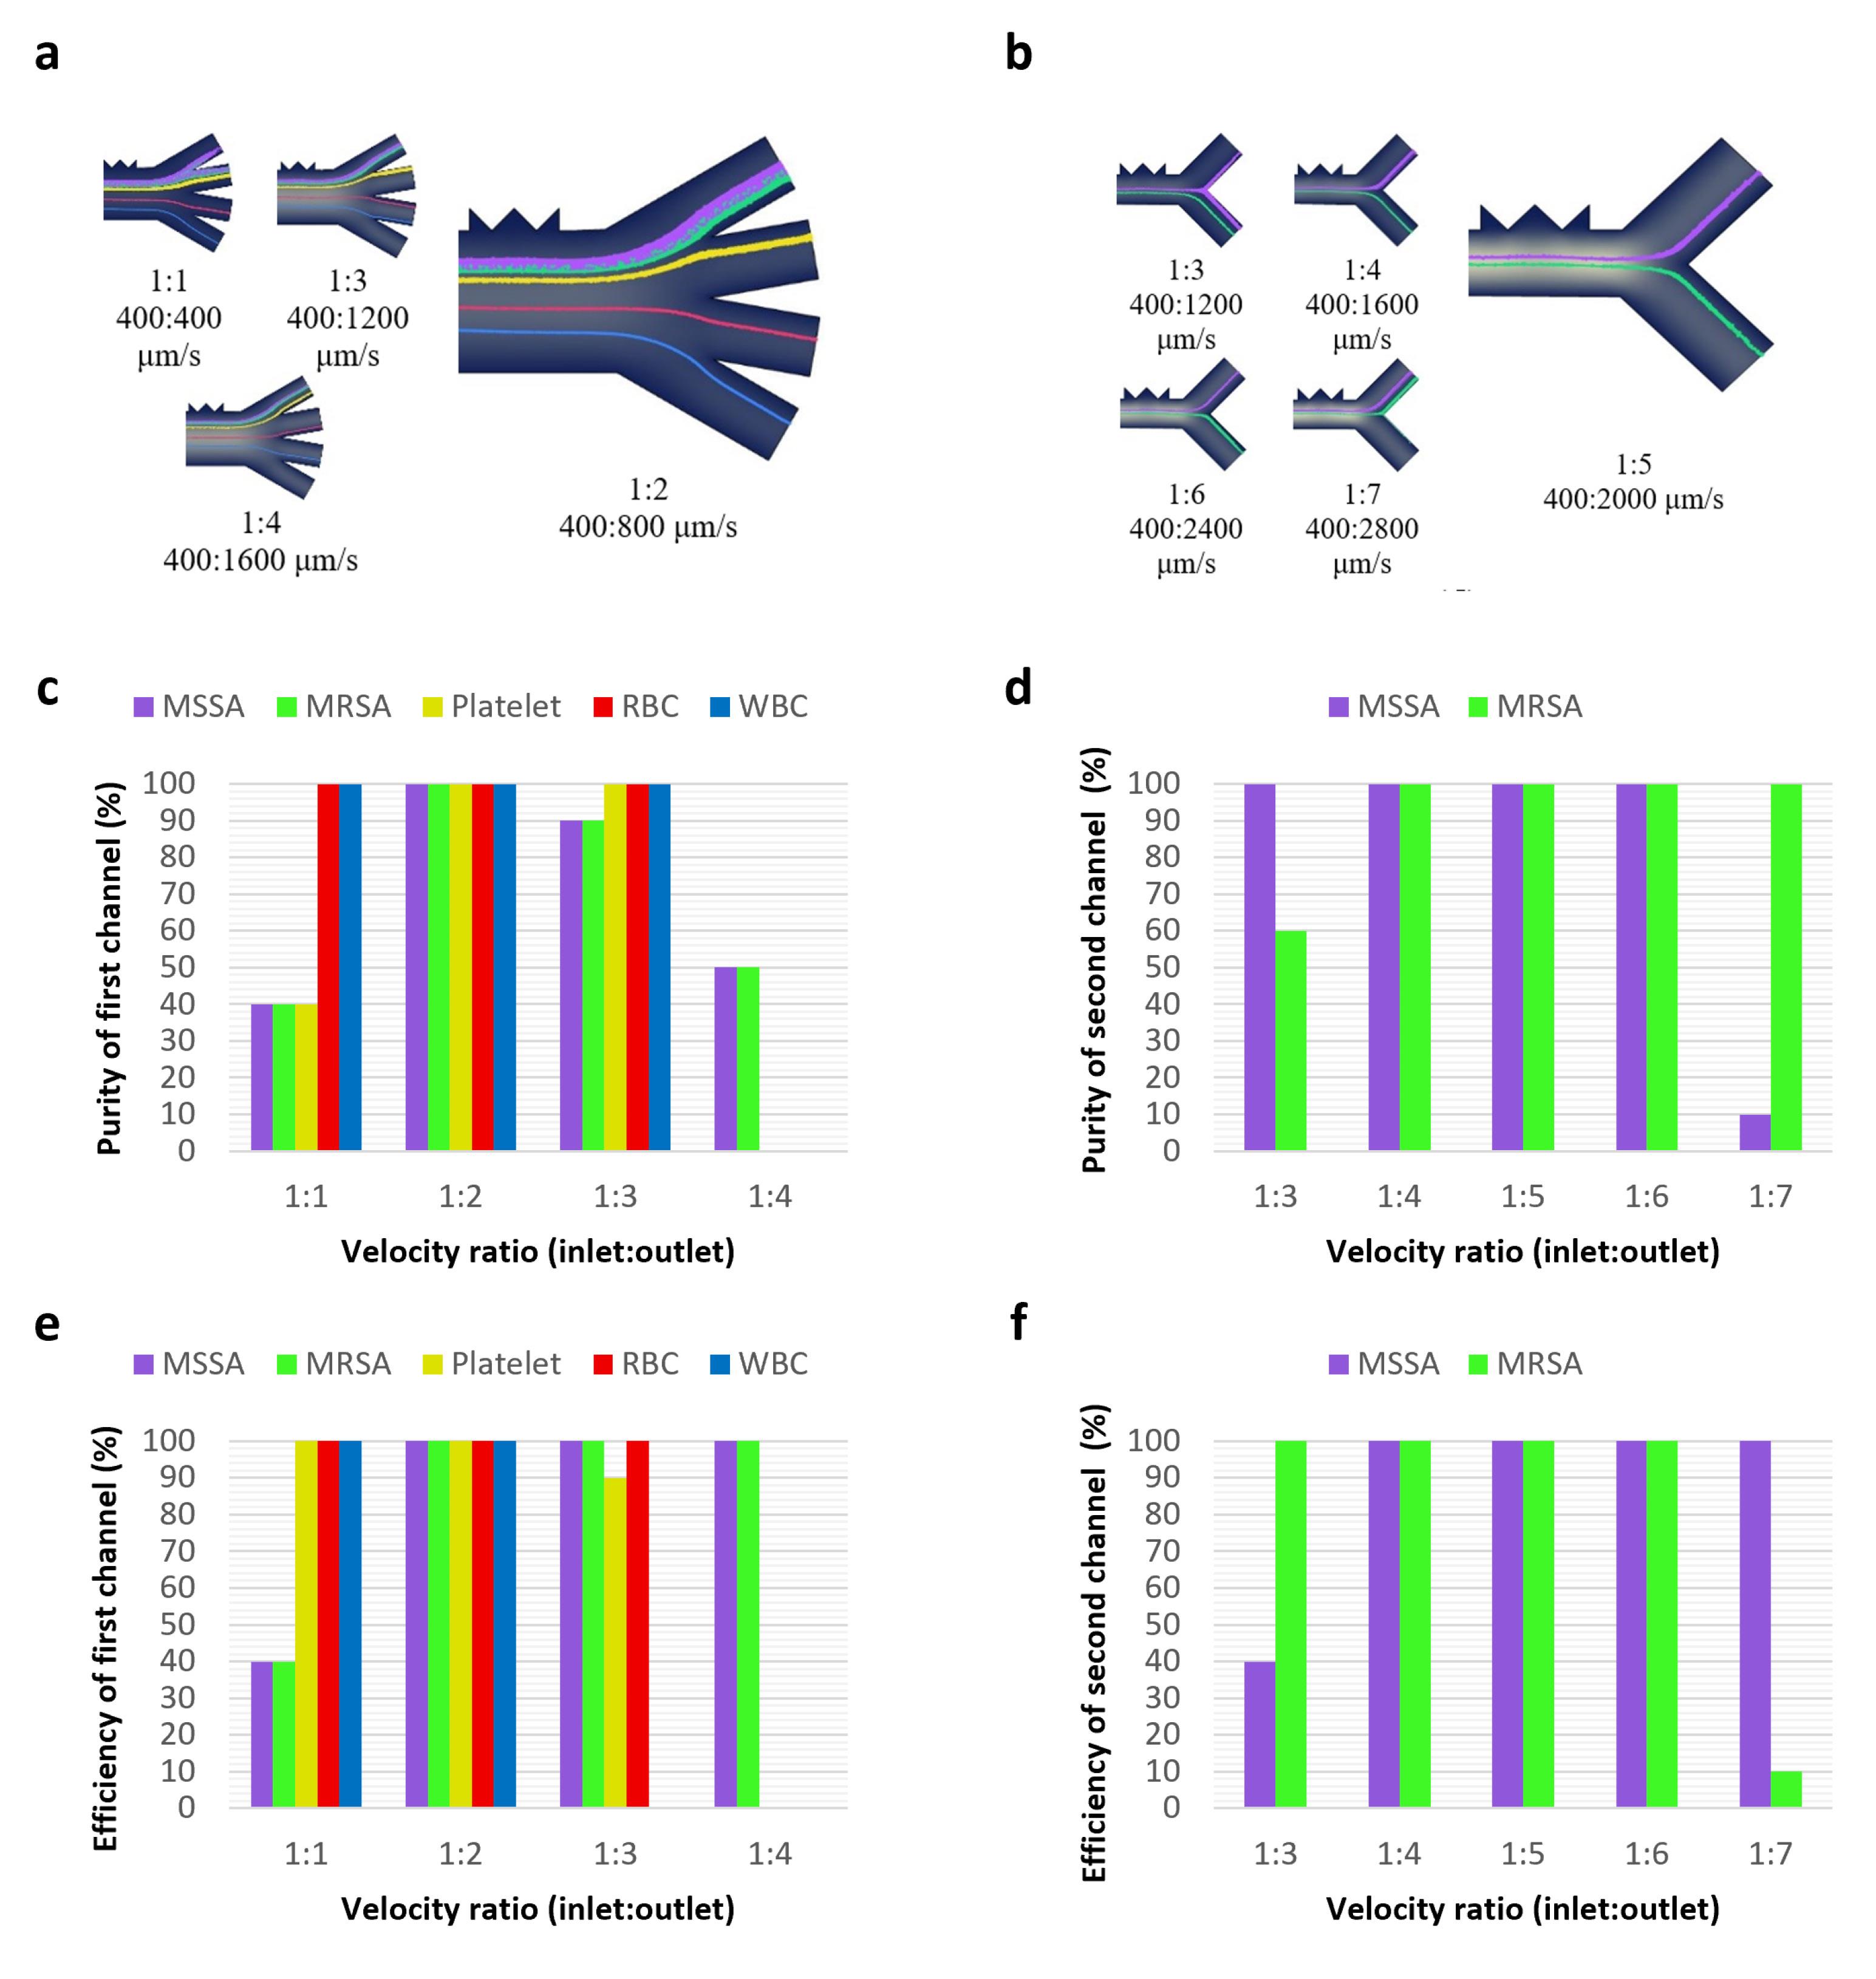
Fig. 7.
Effect of inlet velocity ratio on separation performance. (a) First-stage separation trajectories of MRSA and MSSA from blood cells. (b) Second-stage resolution of MRSA from MSSA. (c, e) Separation purity and efficiency in the first channel. (d, f) Separation purity and efficiency in the second channel
.
Effect of inlet velocity ratio on separation performance. (a) First-stage separation trajectories of MRSA and MSSA from blood cells. (b) Second-stage resolution of MRSA from MSSA. (c, e) Separation purity and efficiency in the first channel. (d, f) Separation purity and efficiency in the second channel
Analyzing mesh convergence
The fidelity of numerical simulations in LOC systems critically depends on mesh convergence, which ensures that simulation outcomes are no longer sensitive to the resolution of the computational mesh. In finite element modeling, mesh domains discretize the geometry, allowing the numerical solution of partial differential equations governing electric field distributions, flow dynamics, and cell trajectories.
To validate mesh independence, we conducted a mesh convergence study by refining the grid from coarse to fine resolutions. As shown in Fig. 8b, the electric field distribution remained stable across mesh densities, confirming that further refinement yields negligible variation in computed results. The associated mesh parameters are summarized in Table 3, including total element counts and refinement grades.
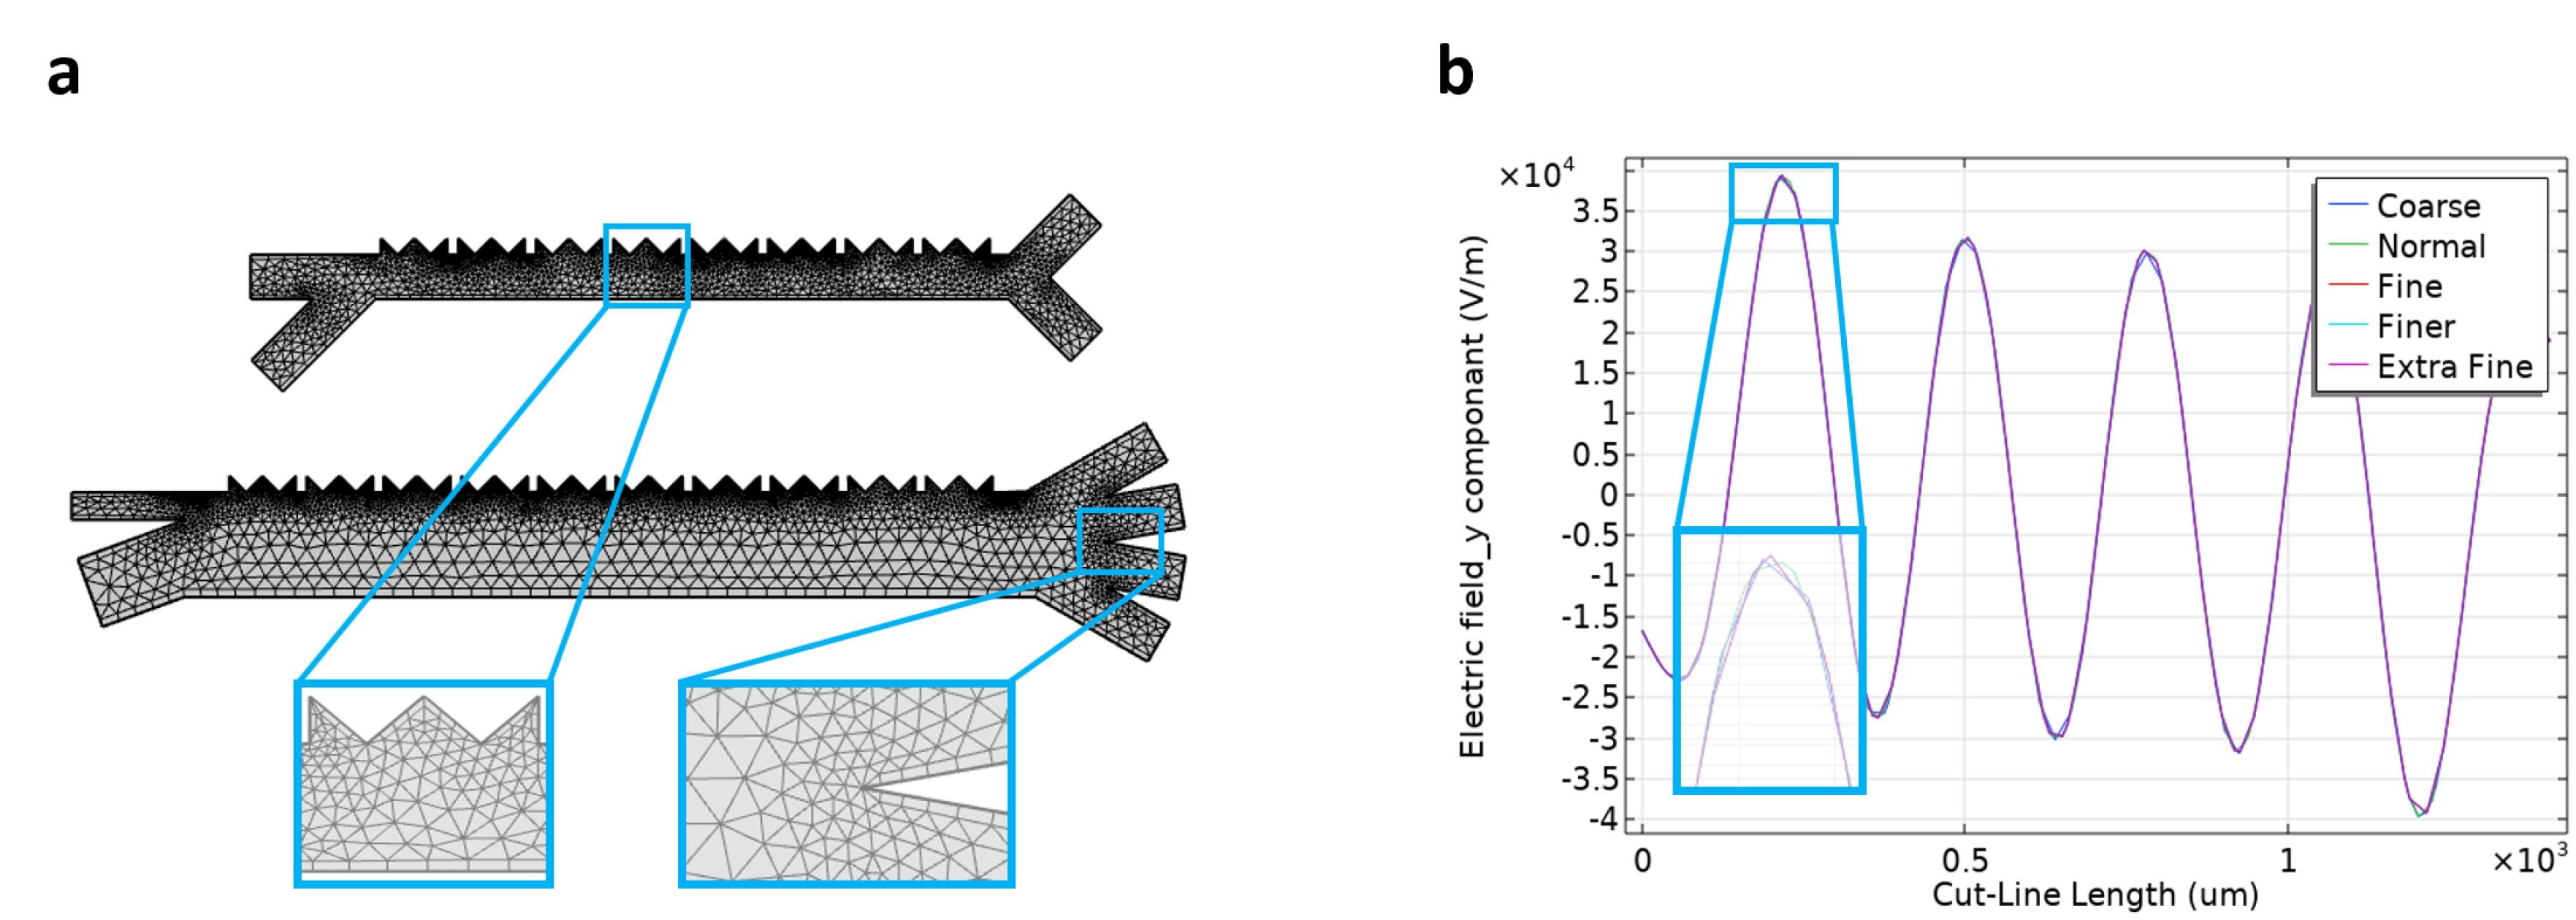
Fig. 8.
Microfluidic Mesh Network Analysis. (a) Converging solution with increasing mesh density. (b) Mesh-independent electric field strength along a reference line
.
Microfluidic Mesh Network Analysis. (a) Converging solution with increasing mesh density. (b) Mesh-independent electric field strength along a reference line
Table 3.
Properties of the meshes
|
Mesh mode
|
Element number
|
Min quality
|
Ave quality
|
| Extra fine |
69074 |
0.131 |
0.8596 |
| Finer |
42647 |
0.01761 |
0.8511 |
| Fine |
27779 |
0.05183 |
0.8345 |
| Normal |
24143 |
0.04433 |
0.7976 |
| Coarse |
14522 |
0.01303 |
0.7759 |
By achieving mesh convergence, the model gains robustness and reliability, ensuring accurate prediction of system-level behaviors such as DEP-induced particle motion and electric field gradients. This verification step is essential in bridging the gap between theoretical design and experimental implementation, providing a validated foundation for optimizing LOC performance with minimal computational overhead.
Analysis of performance comparison
This study presents a dual-stage separation of Staphylococcus aureus strains from blood components, extending beyond single-strain isolation to achieve effective resolution between MRSA, MSSA, and blood cells (RBCs, WBCs, and PLTs) at an operational frequency as low as 1 Hz. A novel electrode configuration featuring crown-shaped microelectrodes was introduced to generate intensified electric field gradients while maintaining low voltage input, enhancing the overall separation efficiency without compromising device stability.
The design optimization process involved tuning key parameters, including frequency, applied voltage, and flow velocity. In parallel, the microchannel geometry was refined through precise adjustments to inlet/outlet angles and channel dimensions to maximize hydrodynamic focusing and field interaction. To balance accuracy with computational efficiency, the simulations were conducted usin
g a two-dimensional (2D) model instead of a three-dimensional (3D) one, justified by the near-constant electric potential along the channel height. This substitution significantly reduced simulation time while preserving the integrity of the results.
To contextualize our device’s performance, Table 4 compares the separation efficiency and operational characteristics of the proposed system with those reported in recent studies. The data illustrate the distinct advantages of our LOC platform, notably its ability to simultaneously isolate two bacterial strains from whole blood and its improved resolution across multiple cell types.
Table 4.
Comparative performance of various DEP-based separation platforms
|
Reference
|
Design
|
Separation quality
|
Method
|
Frequency
|
Cells
|
| This work |
2-D |
100% |
Numerical simulation |
1 Hz |
Staphylococcus aureus (MRSA, MSSA), RBC, WBC, PLT |
| Hewlin et al33 |
2-D |
99% |
Numerical simulation |
1 Hz |
RBC, PLT |
| Ganesan et al34 |
2-D |
Efficient separation |
Numerical simulation |
10 kHz |
Staphylococcus aureus, RBC, PLT |
| Kumar et al35 |
2-D |
Efficient separation |
Numerical simulation |
50 MHz |
E. coli, RBC, PLT |
| Shiriny et al36 |
2-D |
Efficient separation |
Numerical simulation |
100 kHz |
E. coli, Staphylococcus aureus, RBC, PLT |
| Yoon et al37 |
2-D |
99% |
Experimental |
10 MHz |
E. coli, Staphylococcus aureus, Pseudomonas aeruginosa, Blood |
Conclusion
This study presents a low-frequency nDEP-based LOC system capable of selectively isolating Staphylococcus aureus strains from complex whole blood matrices with high precision. Numerical simulations conducted in COMSOL enabled fine-tuning of key design parameters, including electrode architecture, voltage input, and sample-to-buffer flow ratios, to maximize separation performance.
In the primary microchannel, crown-shaped electrodes operating at 1 Hz and 24–28 Vpp, with a flow rate ratio of 1:2, enabled near-complete purification of MRSA and MSSA from RBCs, WBCs, and PLTs. In the secondary channel, further differentiation between MRSA and MSSA was achieved under identical frequency conditions. However, at elevated voltages of 42–46 Vpp and a flow ratio of 1:5, this two-stage configuration demonstrated that an optimized microelectrode geometry particularly the crown-shaped design substantially enhances the generation of electric field gradients and the dielectrophoretic response.
Overall, the results validate a reliable, label-free microfluidic platform for bacterial separation, offering a compact and efficient alternative to conventional diagnostic techniques. Beyond pathogen isolation, the system lays a foundation for integrated antibiotic susceptibility testing, with potential for point-of-care deployment in clinical microbiology.
Research Highlights
What is the current knowledge?
-
Design a microscale Lab-on-a-Chip (LOC) device based on dielectrophoresis.
-
Explain how key parameters such as frequency, flow velocity, and applied voltage affect the performance and functionality of the LOC design.
-
Describe how electrode geometry influences the distribution of the electric field within the LOC device.
What is new here?
-
Separation of MSSA and MRSA from blood using nDEP and pDEP techniques (pDEP details provided in Supplementary File 1).
-
Successful separation was achieved at a very-low frequency of 1 Hz.
-
Purity and separation efficiency approached 100%.
Competing Interests
The authors declare that they have no conflicts of interest.
Ethical Approval
Not applicable.
Supplementary Files
Supplementary file 1 contains Figs. S1-S7.
(pdf)
Acknowledgements
Figures were created using MyDEP for CM figures and COMSOL Multiphysics Ver 6.0 and Dplot software.
References
- Klevens RM, Morrison MA, Nadle J, Petit S, Gershman K, Ray S. Invasive methicillin-resistant Staphylococcus aureus infections in the United States. JAMA 2007; 298:1763-71. doi: 10.1001/jama.298.15.1763 [Crossref] [ Google Scholar]
- Jee Y, Carlson J, Rafai E, Musonda K, Huong TTG, Daza P. Antimicrobial resistance: a threat to global health. Lancet Infect Dis 2018; 18:939-40. doi: 10.1016/s1473-3099(18)30471-7 [Crossref] [ Google Scholar]
- Opota O, Croxatto A, Prod'hom G, Greub G. Blood culture-based diagnosis of bacteraemia: state of the art. Clin Microbiol Infect 2015; 21:313-22. doi: 10.1016/j.cmi.2015.01.003 [Crossref] [ Google Scholar]
- Cheng H, Macaluso M, Vermund SH, Hook EW 3rd. Relative accuracy of nucleic acid amplification tests and culture in detecting Chlamydia in asymptomatic men. J Clin Microbiol 2001; 39:3927-37. doi: 10.1128/jcm.39.11.3927-3937.2001 [Crossref] [ Google Scholar]
- Pethig R. Review article-dielectrophoresis: status of the theory, technology, and applications. Biomicrofluidics 2010; 4:022811. doi: 10.1063/1.3456626 [Crossref] [ Google Scholar]
- Wang J, Wei MT, Ou-Yang HD. Low-frequency dielectrophoretic response of a single particle in aqueous suspensions. Biomicrofluidics 2016; 10:014108. doi: 10.1063/1.4940037 [Crossref] [ Google Scholar]
- Ramos A, Morgan H, Green NG, Castellanos A. Ac electrokinetics: a review of forces in microelectrode structures. J Phys D Appl Phys 1998; 31:2338. doi: 10.1088/0022-3727/31/18/021 [Crossref] [ Google Scholar]
- Julius LAN, Akgül D, Krishnan G, Falk F, Korvink J, Badilita V. Portable dielectrophoresis for biology: ADEPT facilitates cell trapping, separation, and interactions. Microsyst Nanoeng 2024; 10:29. doi: 10.1038/s41378-024-00654-z [Crossref] [ Google Scholar]
- Addabbo T, Fort A, Mugnaini M, Parri L, Pinzi M, Vignoli V. On the suitability of low-cost compact instrumentation for blood impedance measurements. IEEE Trans Instrum Meas 2019; 68:2412-24. doi: 10.1109/tim.2019.2899475 [Crossref] [ Google Scholar]
- Fernandez RE, Rohani A, Farmehini V, Swami NS. Review: microbial analysis in dielectrophoretic microfluidic systems. Anal Chim Acta 2017; 966:11-33. doi: 10.1016/j.aca.2017.02.024 [Crossref] [ Google Scholar]
- Torres-Castro K, Acuña-Umaña K, Lesser-Rojas L, Reyes DR. Microfluidic blood separation: key technologies and critical figures of merit. Micromachines (Basel) 2023; 14:2117. doi: 10.3390/mi14112117 [Crossref] [ Google Scholar]
- Zhang X, Zhu X, Hu J, Gao D. Nucleic acid detection of pathogenic microorganisms on chip. In: Microfluidics in Food Processing. CRC Press. 2025. p. 10-54.
- Voldman J. Electrical forces for microscale cell manipulation. Annu Rev Biomed Eng 2006; 8:425-54. doi: 10.1146/annurev.bioeng.8.061505.095739 [Crossref] [ Google Scholar]
- D'Amico L, Ajami NJ, Adachi JA, Gascoyne PR, Petrosino JF. Isolation and concentration of bacteria from blood using microfluidic membraneless dialysis and dielectrophoresis. Lab Chip 2017; 17:1340-8. doi: 10.1039/c6lc01277a [Crossref] [ Google Scholar]
- Pohl HA. Theoritical aspects of dielectrophoretic deposition and separation of particles. J Electrochem Soc 1968; 115:155C. doi: 10.1149/1.2411333 [Crossref] [ Google Scholar]
- Hughes MP. Nanoelectromechanics in Engineering and Biology. CRC Press; 2018. doi: 10.1201/9781315219202.
- Cottet J, Fabregue O, Berger C, Buret F, Renaud P, Frénéa-Robin M. MyDEP: a new computational tool for dielectric modeling of particles and cells. Biophys J 2019; 116:12-8. doi: 10.1016/j.bpj.2018.11.021 [Crossref] [ Google Scholar]
- Sihvola AH, Kong JA. Effective permittivity of dielectric mixtures. IEEE Trans Geosci Remote Sens 1988; 26:420-9. doi: 10.1109/36.3045 [Crossref] [ Google Scholar]
- Hanai T. Theory of the dielectric dispersion due to the interfacial polarization and its application to emulsions. Kolloid-Zeitschrift 1960; 171:23-31. doi: 10.1007/bf01520320 [Crossref] [ Google Scholar]
- Dashti R, Abedini-Nassab R. A high-throughput hybrid electromicrofluidic platform for organizing single-cell protein secretion profiling assays. IEEE Sens J 2024; 24:7448-55. doi: 10.1109/jsen.2024.3355770 [Crossref] [ Google Scholar]
- Lyu C, Wang J, Powell-Palm M, Rubinsky B. Simultaneous electroporation and dielectrophoresis in non-electrolytic micro/nano-electroporation. Sci Rep 2018; 8:2481. doi: 10.1038/s41598-018-20535-6 [Crossref] [ Google Scholar]
- Pakhira W, Kumar R, Ibrahimi KM. Design and numerical simulation of a microfluidic lab-on-a-chip utilizing positive and negative dielectrophoresis technique for separation of multiple CTCs distinctly. Comput Part Mech 2024; 11:2869-82. doi: 10.1007/s40571-024-00760-9 [Crossref] [ Google Scholar]
- Nguyen TH, Nguyen MC, Nguyen HT, Thi YVT, Vu NT, Thu HB. Numerical analysis of dielectrophoresis-based microfluidic chip with a facing-electrode design for cell separation. J Biosyst Eng 2024; 49:29-40. doi: 10.1007/s42853-024-00211-6 [Crossref] [ Google Scholar]
- Morley ST, Walsh MT, Newport DT. The advection of microparticles, MCF-7 and MDA-MB-231 breast cancer cells in response to very low Reynolds numbers. Biomicrofluidics 2017; 11:034105. doi: 10.1063/1.4983149 [Crossref] [ Google Scholar]
- Nan X, Zhang J, Wang X, Kang T, Cao X, Hao J. Design of a low-frequency dielectrophoresis-based arc microfluidic chip for multigroup cell sorting. Micromachines (Basel) 2023; 14:1561. doi: 10.3390/mi14081561 [Crossref] [ Google Scholar]
- Rozaini AZA, Abdulhameed A, Deivasigamani R, Nadzreen N, Zin NM, Kayani AA. Dielectrophoresis microbial characterization and isolation of Staphylococcus aureus based on optimum crossover frequency. Electrophoresis 2023; 44:1220-33. doi: 10.1002/elps.202200276 [Crossref] [ Google Scholar]
- Hilton SH, Crowther CV, McLaren A, Smithers JP, Hayes MA. Biophysical differentiation of susceptibility and chemical differences in Staphylococcus aureus. Analyst 2020; 145:2904-14. doi: 10.1039/c9an01449g [Crossref] [ Google Scholar]
- Zhang X, Xu X, Ren Y, Yan Y, Wu A. Numerical simulation of circulating tumor cell separation in a dielectrophoresis based Y-Y shaped microfluidic device. Sep Purif Technol 2021; 255:117343. doi: 10.1016/j.seppur.2020.117343 [Crossref] [ Google Scholar]
- Castellanos A, Ramos A, González A, Green NG, Morgan H. Electrohydrodynamics and dielectrophoresis in microsystems: scaling laws. J Phys D Appl Phys 2003; 36:2584. doi: 10.1088/0022-3727/36/20/023 [Crossref] [ Google Scholar]
- Fischer P. Understanding viscoelasticity-an introduction to rheology (Nhan Phan-Thien). Appl Rheol 2013; 23:329. doi: 10.1515/arh-2013-0029 [Crossref] [ Google Scholar]
- Lo YJ, Lin YY, Lei U, Wu MS, Yang PC. Measurement of the Clausius-Mossotti factor of generalized dielectrophoresis. Appl Phys Lett 2014; 104:083701. doi: 10.1063/1.4866341 [Crossref] [ Google Scholar]
- Piacentini N, Mernier G, Tornay R, Renaud P. Separation of platelets from other blood cells in continuous-flow by dielectrophoresis field-flow-fractionation. Biomicrofluidics 2011; 5:34122-341228. doi: 10.1063/1.3640045 [Crossref] [ Google Scholar]
- Hewlin RL Jr, Edwards M. Continuous flow separation of red blood cells and platelets in a y-microfluidic channel device with saw-tooth profile electrodes via low voltage dielectrophoresis. Curr Issues Mol Biol 2023; 45:3048-67. doi: 10.3390/cimb45040200 [Crossref] [ Google Scholar]
- Ganesan S, Juliet AV. Computational analysis on design and optimization of microfluidic channel for the separation of Staphylococcus aureus from blood using dielectrophoresis. J Braz Soc Mech Sci Eng 2023; 45:624. doi: 10.1007/s40430-023-04523-0 [Crossref] [ Google Scholar]
- Kumar CL, Juliet AV, Ramakrishna B, Chakraborty S, Mohammed MA, Sunny KA. Computational microfluidic channel for separation of Escherichia coli from blood-cells. Comput Mater Contin 2021; 67:1369. doi: 10.32604/cmc.2021.015116 [Crossref] [ Google Scholar]
- Shiriny A, Bayareh M, Taheri Z. Dielectrophoretic microfluidic device for the separation of foodborne bacteria from blood. Iran J Chem Chem Eng 2024; 43:469-9. doi: 10.30492/ijcce.2023.2000793.5987 [Crossref] [ Google Scholar]
- Yoon T, Moon HS, Song JW, Hyun KA, Jung HI. Automatically controlled microfluidic system for continuous separation of rare bacteria from blood. Cytometry A 2019; 95:1135-44. doi: 10.1002/cyto.a.23909 [Crossref] [ Google Scholar]