Bioimpacts. 15:32628.
doi: 10.34172/bi.32628
Original Article
Cell-imprinted substrates as biomimetic platforms for osteoarthritis modeling with mesenchymal stem cells
Hanieh Sadat Hashemi Motahar Data curation, Formal analysis, Investigation, Methodology, Software, Validation, Visualization, Writing – original draft, 1 
Mojtaba Tajbakhsh Resources, 2
Mahboobeh Tavassoli Resources, 3
Shahin Bonakdar Conceptualization, Methodology, Project administration, Resources, Supervision, Validation, Writing – review & editing, 4, *
Mohammad Reza Sadeghi Project administration, Supervision, Validation, Writing – review & editing, 1, 5, *
Author information:
1Department of Molecular Medicine, Faculty of Advanced Medical Sciences, Tabriz University of Medical Sciences, Tabriz, Iran
2Orthopedic Clinic, Mardom Hospital, Tehran, Iran
3Obstetrics and Gynecology Clinic, Mardom Hospital, Tehran, Iran
4National Cell Bank Department, Pasteur Institute of Iran, Tehran, Iran
5Research Center for Pharmaceutical Nanotechnology, Biomedicine Institute, Tabriz University of Medical Sciences, Tabriz, Iran
Abstract
Introduction:
The objective of this study is twofold: first, to investigate the relationship between chondrocyte morphology and their own gene and protein expression profiles in healthy and osteoarthritic (OA) cartilage; and second, to assess whether replicating the morphology of OA chondrocytes (OACs) can induce a hypertrophic expression pattern in MSCs.
Methods:
Polydimethylsiloxane (PDMS) substrates were fabricated to replicate the morphologies of human OACs and healthy chondrocytes (HCs). MSCs were cultured on these imprinted substrates, and differentiation was assessed using real-time PCR, immunocytochemistry, Alcian blue/Safranin O staining, and scanning electron microscopy (SEM).
Results:
SEM and optical microscopy revealed that OACs had a larger surface area than HCs. Real-time PCR analysis showed morphology-dependent variations in the expression of cartilage- and OA-related markers, with statistically significant differences observed only for SOX9. Immunofluorescence analysis of collagen types I and II supported these findings, though visual inspection of the staining did not indicate any significant changes.
Conclusion:
The results show that OACs-imprinted substrates can be effectively combined with other methods to improve in vitro models of OA. This offers a useful tool for exploring disease mechanisms and potential therapies.
Keywords: Cell-imprinting, Osteoarthritis, Chondrocyte, Mesenchymal stem cell
Copyright and License Information
© 2025 The Author(s).
This work is published by BioImpacts as an open access article distributed under the terms of the Creative Commons Attribution Non-Commercial License (
http://creativecommons.org/licenses/by-nc/4.0/). Non-commercial uses of the work are permitted, provided the original work is properly cited.
Funding Statement
Tabriz University of Medical Sciences supported this study.
Introduction
Osteoarthritis (OA) is a multifactorial degenerative joint disease, primarily characterized by progressive articular cartilage destruction.1 As the most prevalent musculoskeletal disorder, OA affected approximately 7.6% of the global population in 2020.2 In OA, the homeostasis of chondrocytes, the sole cell type within cartilage, shifts from an anabolic to a catabolic state, accompanied by inflammation and excessive production of matrix-degrading enzymes.3 This pathological transition involves downregulation of SRY-box 9 (SOX9) (the master transcription factor for chondrogenic genes), leading to reduced synthesis of cartilage matrix components such as type II collagen and aggrecan, along with upregulation of Runt-related transcription factor 2 (RUNX2), which promotes terminal differentiation and chondrocyte hypertrophy.4,5 Hypertrophic chondrocytes contribute to matrix remodeling through proteolytic activity, increased type X collagen expression, and matrix mineralization.4,6,7 The hypertrophic chondrocytes exhibit increased volume, which correlates with the extent of joint damage.8,9 Factors such as inflammation,10,11 altered cytoskeletal dynamics,12 and changes in matrix stiffness13 have been demonstrated to play a role in this volume increase. Alternatively, some chondrocytes may undergo dedifferentiation into a fibroblastic phenotype, characterized by elevated fibrotic markers, leading to the formation of fibrocartilaginous tissue.7 These morphological changes directly influence cellular transcriptomic profiles. Notably, chondrocytes in two-dimensional (2D) culture systems undergo dedifferentiation, characterized by increased expression of type I collagen and decreased expression of type II collagen. However, when transferred to three-dimensional (3D) environments, they regain their native morphology and restore regular gene expression patterns.14 Cell shape and size modulate cellular behavior through multiple mechanisms, with alterations in the cytoskeleton representing the most prominent factor. In OA, cytoskeletal integrity is disrupted, resulting in decreased immunopositivity for actin, microtubules, and vimentin in chondrocytes.15 Significantly, well-organized cytoskeletal networks enhance matrix synthesis,16-18 whereas increased actin stress fiber formation or microtubule instability promotes fibrotic changes.17,19
Cell shape significantly influences cell signaling by affecting the distance between key cellular structures, such as the plasma membrane, endoplasmic reticulum, and nuclear membrane, which regulates the strength of calcium signals.20 Additionally, changes in cell volume can lead to intracellular crowding, which in turn impacts cellular homeostasis.21 In curved regions of cells, the accumulation of active receptors enhances signal intensity,22 while nuclear-to-membrane distance critically influences kinase activation states. Spherical cell morphology typically maintains signaling molecules inactive due to greater intermembrane distances. In contrast, flattened cells promote constitutive activation through the proximity of cytosolic components to the plasma membrane.23 Building on these principles, we investigated whether imposing hypertrophic chondrocyte morphology on mesenchymal stem cells (MSCs) could modulate chondrogenic gene expression or OA-associated markers. Using established cell imprinting technology, previously successful in directing the differentiation of MSCs into osteoblasts,24 keratinocytes,25 Schwann cells,26 and tenocytes,27 we replicated the morphology of OA chondrocytes (OACs). This approach may provide novel insights into OA pathogenesis by elucidating shape-dependent cellular responses, which could potentially reveal new therapeutic targets. Given that cell morphology is critical in regulating gene expression and extracellular matrix production, we hypothesized that replicating osteoarthritic chondrocyte morphology on synthetic substrates could provide a controllable platform to investigate how disease-specific shapes influence stem cell behavior.
Materials and Methods
Chondrocyte isolation
Osteoarthritis (OA) cartilage samples were obtained from the femoral condyles and tibial plateaus during total knee arthroplasty procedures at Mardom Hospital, with prior written consent obtained from patients (n = 11, age range: 44-74 years).
Healthy knee cartilage samples were collected from the Legal Medicine Research Center of IRI within 10 hours post-mortem (n = 2, age: 32 years). Multiple donor variables, including age, body mass index (BMI), trauma history, and medical background, were evaluated to identify potential risk factors for OA.
Full-thickness cartilage fragments (3-4 mm2) were minced using a No. 11 scalpel and digested in DMEM/F12 medium (Gibco, USA) containing 1 mg/ml collagenase type II (Sigma, USA) for 16 hours at 37°C with 5% CO₂. Following digestion, chondrocytes were washed with DMEM/F12 supplemented with 10% fetal bovine serum (FBS) and antimicrobial agents (100 U/mL penicillin, 100 μg/mL streptomycin, and 0.25 μg/mL amphotericin B), then seeded into 6-, 12-, and 24-well tissue culture plates via centrifugation at 300 × g for 5 minutes. Before dedifferentiation, chondrocytes were fixed with either 4% glutaraldehyde or 4% paraformaldehyde for 20 minutes. Following fixation, cells were washed with phosphate-buffered saline (PBS) to remove excess fixative, preparing them for subsequent substrate imprinting and staining procedures.
Fabrication of chondrocyte-imprinted substrates
In this study, the term "cell imprinting" refers to a biomaterial-based approach in which the topographical features of chondrocytes are replicated onto a silicon substrate to create a biomimetic culture surface. Cell-imprinted substrates were fabricated using polydimethylsiloxane (PDMS; SYLGARDTM 184, Dow Corning, USA) following manufacturer specifications. A 10:1 (w/w) mixture of silicone base and curing agent was prepared and applied to fixed samples of OACs, healthy chondrocytes (HCs), and empty wells (negative control), followed by incubation at 37 °C for 24 hours to complete polymerization. After curing, the PDMS replicas were carefully detached and sequentially cleaned with 1 M NaOH, 70% ethanol, and boiling distilled water to remove cellular debris. The substrates were then sterilized using a 70% ethanol treatment and a 40-minute UV exposure before being adapted for use in 6-well culture plates. This imprinting technique preserved the morphological features of both OA and healthy chondrocytes for subsequent experimental applications.
Isolation and characterization of mesenchymal stem cells
Human adipose tissue was obtained from subepidermal fat during elective abdominoplasty procedures. Adipose tissue represents a readily accessible and valuable source of MSCs, characterized by a high cellular yield. Moreover, it permits the procurement of substantial tissue volumes compared to alternative sources. Fat tissue can be harvested through various techniques, including liposuction and surgical excision, facilitating efficient collection.28
Adipose-derived mesenchymal stem cells (AD-MSCs) were isolated using a modified protocol based on Schneider et al.28 Briefly, a 5 cm2 fat specimen was minced and repeatedly washed with PBS (430 × g, 10 min) until complete removal of erythrocyte contamination. Tissue digestion was performed using 0.5 mg/ml collagenase type II (Sigma, USA) in an equal volume at 37°C with intermittent agitation (every 15 minutes). After 60 minutes of digestion, the reaction was neutralized with warm DMEM/F12 containing 10% FBS to a final volume of 50 mL. The cellular suspension was centrifuged (600 × g, 10 min), and the stromal vascular fraction pellet was resuspended in complete culture medium (DMEM/F12 supplemented with 10% FBS and antimicrobials: 100 U/mL penicillin, 100 μg/mL streptomycin, and 0.25 μg/mL amphotericin B). Cells were plated in T25 flasks and maintained at 37 °C in a humidified atmosphere of 5% CO₂. The incubator was maintained at 95% relative humidity to ensure optimal culture conditions. Following 24 hours of incubation, non-adherent components were removed by medium replacement to obtain a purified MSC population.
The cells collected from the passage 3 culture were subjected to flow cytometry to assess the expression of cell surface markers CD34, CD45, CD73, CD105, and CD90. Cells were gated on forward scatter and side scatter to exclude debris and doublets before analysis. The differentiation potential of MSCs into adipocytes and osteoblasts was investigated by subjecting the cells to adipogenic and osteogenic media, respectively. After 2–3 weeks of culture in adipogenic or osteogenic induction media (Sigma, USA), cells were fixed with 4% paraformaldehyde for 30 minutes at room temperature. For adipogenic differentiation, cells were stained with Oil Red O working solution for 30 minutes and rinsed with distilled water. For osteogenic differentiation, cells were stained with Alizarin Red S solution (pH ~4.2) for 30 minutes and subsequently washed with distilled water. Stained cells were imaged under bright-field microscopy to confirm the accumulation of lipid droplets and calcium deposition, respectively.
MSCs seeding on chondrocyte-imprinted substrates
MSCs were plated at a density of 10 × 10⁴ cells per substrate and incubated at 37 °C with 5% CO₂. The following day, culture medium was added to cover the surface of each substrate completely. Medium changes were performed every three days. After 21 days, cells were either harvested for gene expression analysis or fixed for immunocytochemistry and staining.
Gene expression
Total RNA was extracted from fresh OA cartilage, healthy cartilage, and MSCs cultured on both patterned substrates and non-imprinted PDMS controls using the FavorPrepTM Total RNA Mini Kit (Favorgen, Taiwan) following the manufacturer's protocol. RNA quality was verified by A260/A280 ratio measurement (Denovix DS-11 spectrophotometer), followed by cDNA synthesis (Viragen cDNA Synthesis Kit, Iran). Quantitative real-time PCR was performed on a StepOnePlusTM system (Applied Biosystems, USA) using qPCRBIO SYGreen Mix Hi-ROX (PCR Biosystems, UK) with cycling conditions: 95°C for 2 minutes, then 40 cycles of 95 °C (5 seconds) and 61 °C (25 sec). Melt curve analysis was performed to confirm the specificity of the primers. We evaluated cartilage markers (COL2A1, SOX9, ACAN), hypertrophy/OA-associated genes (ITGA2, MMP13, RUNX2, ADAMTS5, COL10A1), fibrosis marker (COL1A1), and housekeeping gene (GAPDH)—with primer sequences detailed in Table 1. Gene expression levels were calculated using the 2−ΔΔCt method.
Table 1.
Sequences of primers used in qPCR
|
Gene
|
Sequence 5’-3’
|
Product size
|
Tm
|
|
SOX9
|
F: ACGCACATCAAGACGGAGC
R: GGAGTTCTGGTGGTCGGTGT |
162 |
60.74
61.76 |
|
COL2A1
|
F: CCAGATGACCTTGCTACGCC
R: TTCAGGGCAGTGTACGTGAAC |
186 |
60.81
60.54 |
|
ACAN
|
F: GAATCAACTGCTGGAGACCA
R: CCACTGGTAGTCTTGGGCAT |
198 |
57.52
59.38 |
|
RUNX2
|
F: TCCAGACCAGCAGCACTCC
R: CCATCAGCGTCAACACCATC |
184 |
61.59
59.27 |
|
MMP13
|
F: TGACTATGCGTGGCTGGAAC
R: GTCCCATTTGTGGTGTGGGA |
130 |
60.39
60.18 |
|
ADAMTS5
|
F: ACTTGAACTGAGCCGTTTGG
R: TTATGCCCACTGAACCCACA |
136 |
58.69
59.23 |
|
COL10A1
|
F: GGATCAGGCTTCAGGGAGTG
R: CCATTTGACTCGGCATTGGG |
84 |
59.82
59.54 |
|
COL1A1
|
F: GCTCAGAGCCGAAGGCAACA
R: GCGGGAGGTCTTGGTGGTTT |
118 |
63.07
62.69 |
|
ITGA2
|
F: CCAGAGGAAGGAAAAGGAGGA
R: AGGGAGGAGGAAGGTTGCC |
141 |
58.73
60.93 |
|
GAPDH
|
F: GGTGTGAACCATGAGAAGTATGA
R: GAGTCCTTCCACGATACCAAAG |
123 |
58.17
58.48 |
Immunofluorescence
Both freshly isolated chondrocytes and MSCs cultured on patterned/unpatterned substrates were fixed with 4% paraformaldehyde in phosphate buffer (pH 7.4) for 20 minutes, permeabilized with 0.2% Triton X-100 (7 minutes), and blocked with 2% bovine serum albumin (40 minutes at room temperature). Samples were incubated with primary antibodies against collagen type II (Col2) and type I (Col1) at 4°C overnight, followed by species-matched fluorescent secondary antibodies (1 hour, room temperature). Nuclei were counterstained with 4′,6-diamidino-2-phenylindole (DAPI; 10 minutes), and fluorescence images were acquired using an OPTIKA microscope (Italy) with consistent exposure settings across compared samples.
Alcian blue and Safranin O staining
Proteoglycan expression in chondrocytes and MSCs cultured on patterned and plain substrates was evaluated using Alcian Blue (pH 1.0) and Safranin O staining. For Alcian Blue staining, cells were briefly rinsed with 3% acetic acid, then incubated with 1% Alcian Blue solution (pH 1.0) at 4 °C for 30 minutes. After PBS washing, counterstaining was performed with Neutral Red for 5 minutes, followed by a final wash in PBS. The Safranin O protocol involved rapid rinsing with 1% acetic acid, staining with a 0.1% Safranin O solution for 5 minutes, and then washing with PBS. Stained samples were visualized and documented under bright-field microscopy.
Scanning electron microscopy
Morphology of chondrocytes and MSCs on PDMS was observed by scanning electron microscopy (SEM) (Seron, AIS 2100, Korea) after which the cells were coated with gold. Representative areas were randomly selected to avoid bias. The size of chondrocytes was measured using Fiji software.
Celecoxib treatment
Chondrocytes derived from cartilage tissues were cultured in pellet form and treated with celecoxib (TEMAD Co, IRI) at a concentration of 10 𝜇m for 24 hours, alongside MSCs grown on patterned substrates. Changes in the expression of the genes COL2A1, ACAN, MMP13, and ADAMTS5 were examined using RT-PCR, following the described method.
Statistical analysis
Data normality was initially assessed using IBM SPSS Statistics (version 27) to determine appropriate statistical tests. For morphological comparisons, we employed Student's t-test (two-tailed, unpaired) for normally distributed data and the Mann-Whitney U test for non-parametric datasets. Gene expression analyses were performed with one-way ANOVA followed by post-hoc Tukey's test in GraphPad Prism (version 10.0.1). Throughout all analyses, results were considered statistically significant at P < 0.05. Effect sizes and 95% confidence intervals were calculated where applicable to support significance testing.
Results
Characterization of MSCs
To confirm the mesenchymal identity of isolated cells, we examined their surface markers and differentiation capacity. The initial characterization of AD-MSCs was conducted using light microscopy, which confirmed their fibroblast-like appearance (Fig. 1a). Flow cytometric analysis confirmed their mesenchymal lineage, demonstrating strong expression of standard MSC surface markers (CD90: 99.1%; CD105: 96.4%; CD73: 90.4%) while showing negligible hematopoietic marker expression (CD34/CD45 < 1%) (Fig. 1b and 1c).
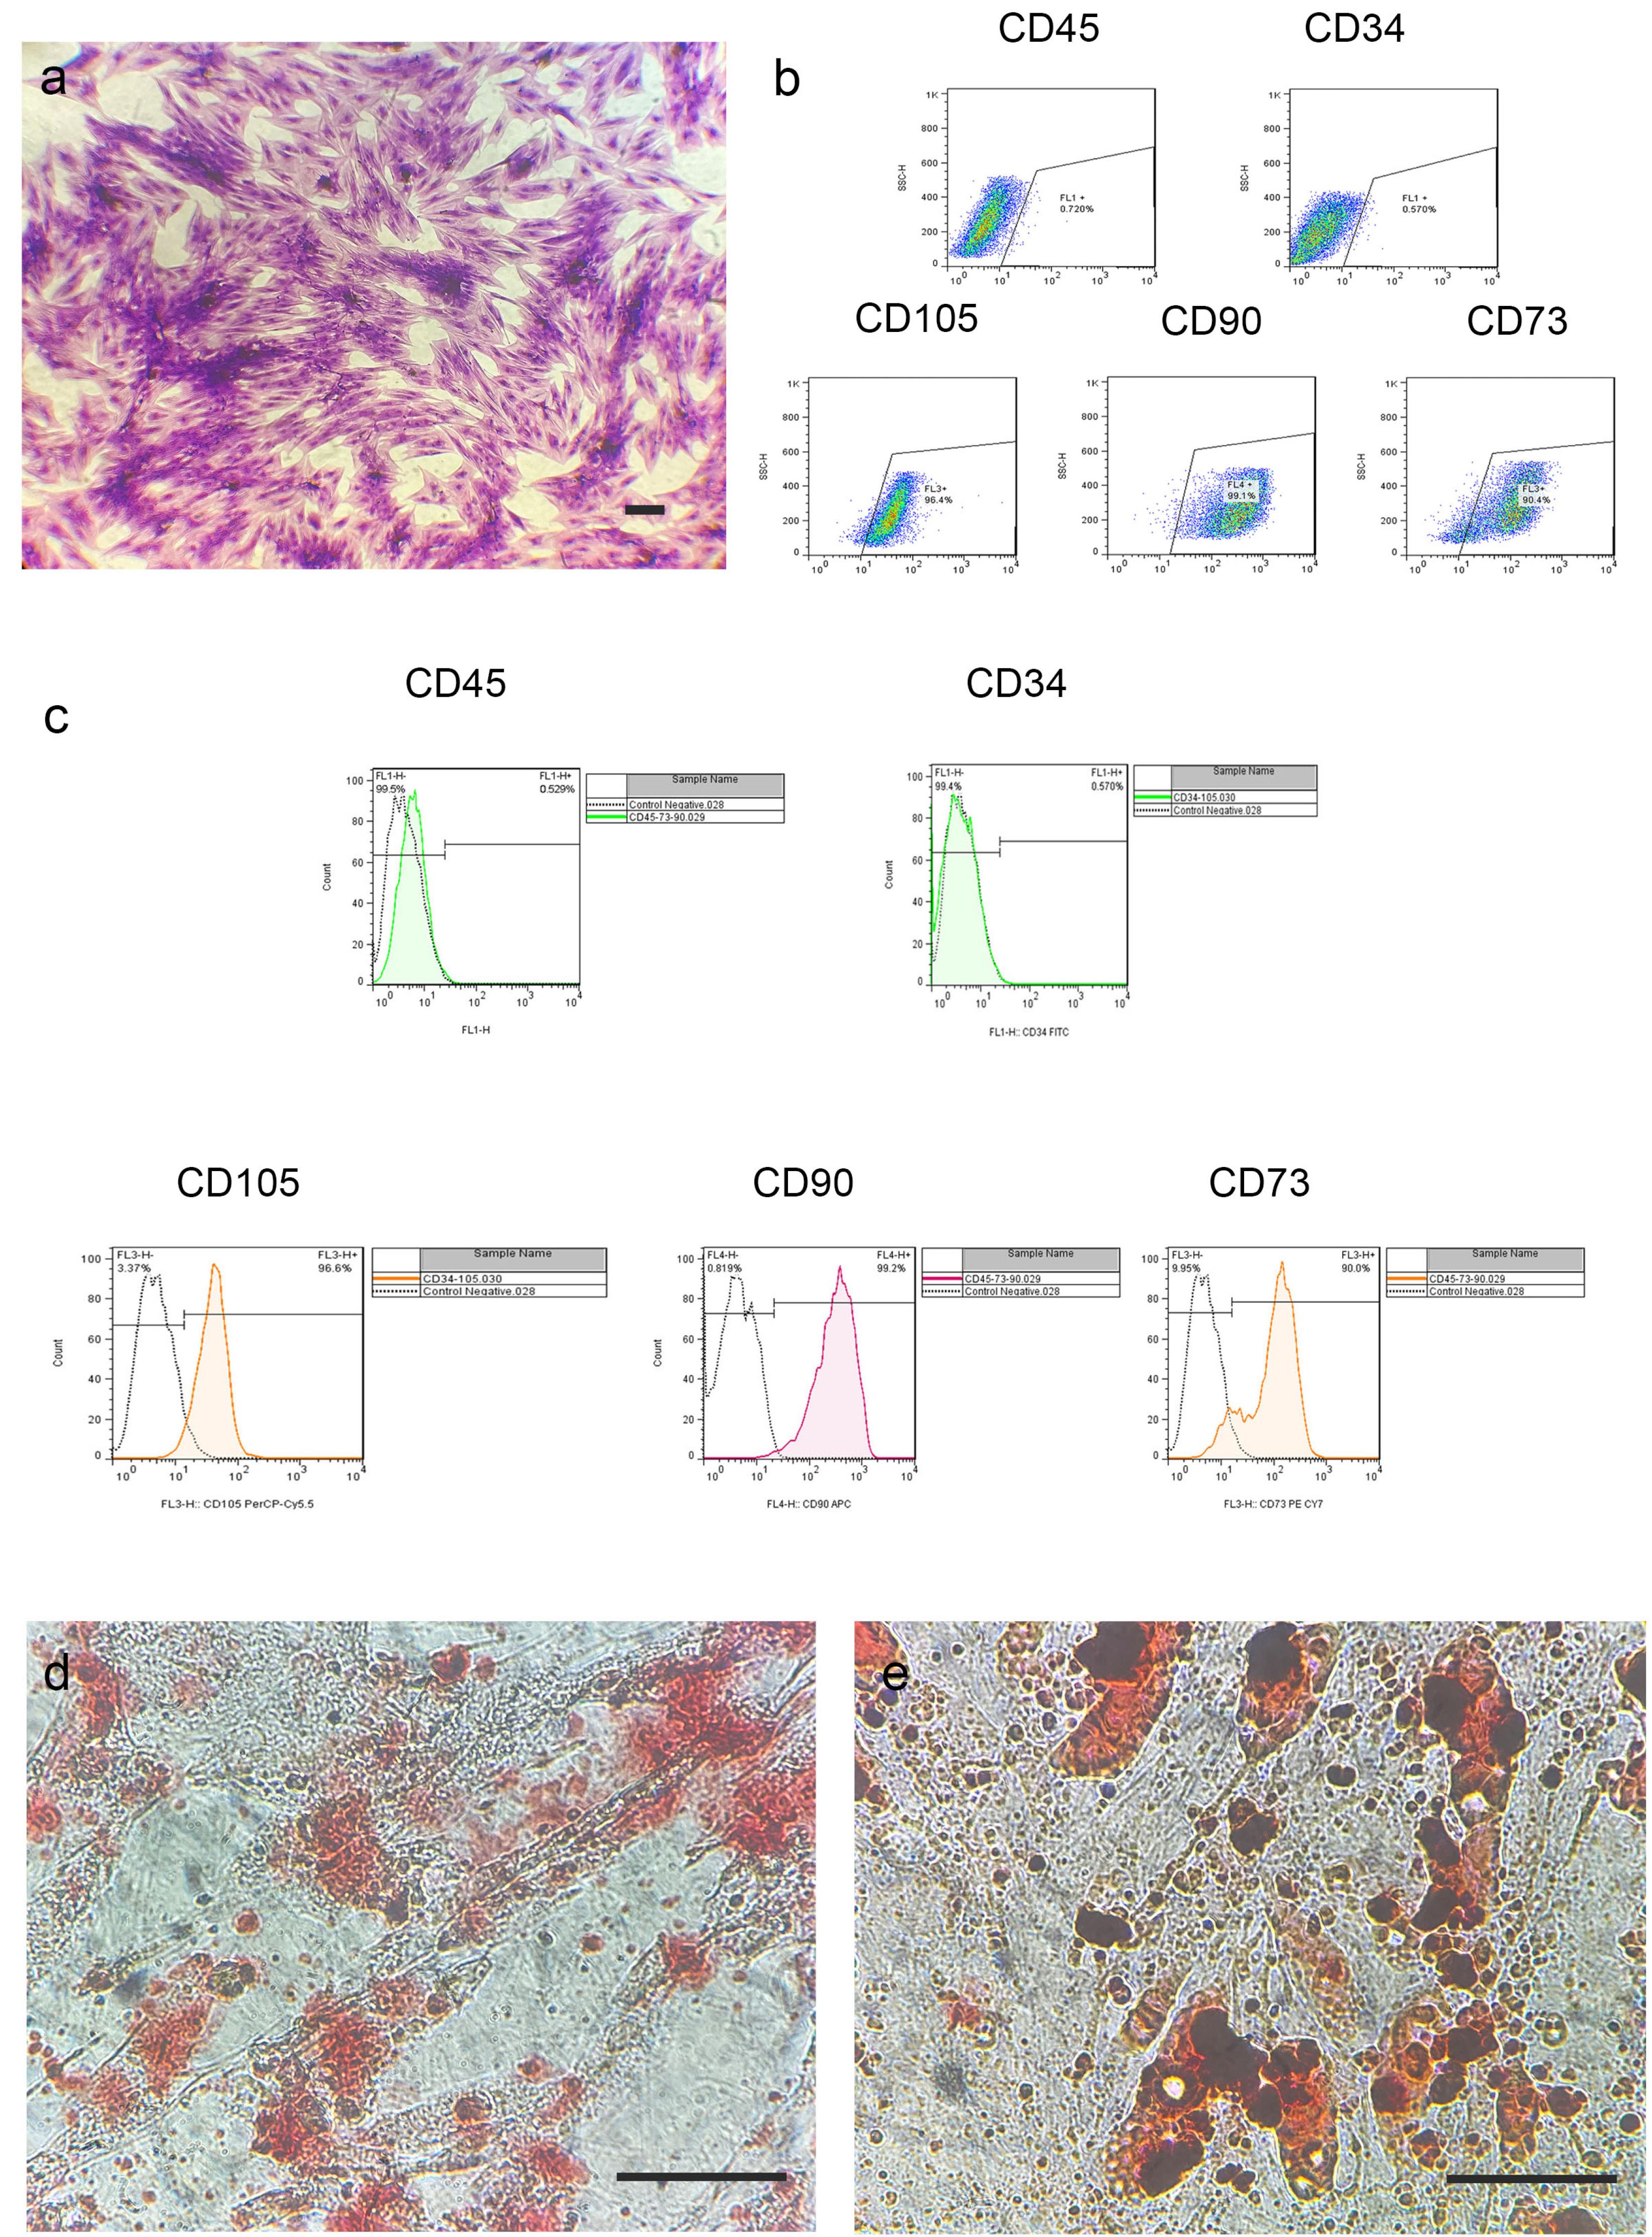
Fig. 1.
Characterization of adipose-derived mesenchymal stem cells (AD-MSCs).(a) Microscopy image of AD-MSCs stained with crystal violet, demonstrating characteristic spindle-shaped morphology. (b) FSC/SSC plot showing gating strategy: Absence of hematopoietic markers (CD45⁻/CD34⁻) and High expression ( > 90% positive) of mesenchymal markers (CD105⁺, CD90⁺, CD73⁺). (c) Histograms of surface marker expression. Unstained controls (dashed line) are overlaid with stained populations (solid line). (d) and (e) Multilineage differentiation potential: (d) Calcium deposition visualized by Alizarin Red S staining after osteogenic induction; (e) Lipid droplet formation shown by Oil Red O staining following adipogenic induction (21-day culture). Scale bars: 250 μm (a), 125 μm (c).
.
Characterization of adipose-derived mesenchymal stem cells (AD-MSCs).(a) Microscopy image of AD-MSCs stained with crystal violet, demonstrating characteristic spindle-shaped morphology. (b) FSC/SSC plot showing gating strategy: Absence of hematopoietic markers (CD45⁻/CD34⁻) and High expression ( > 90% positive) of mesenchymal markers (CD105⁺, CD90⁺, CD73⁺). (c) Histograms of surface marker expression. Unstained controls (dashed line) are overlaid with stained populations (solid line). (d) and (e) Multilineage differentiation potential: (d) Calcium deposition visualized by Alizarin Red S staining after osteogenic induction; (e) Lipid droplet formation shown by Oil Red O staining following adipogenic induction (21-day culture). Scale bars: 250 μm (a), 125 μm (c).
The AD-MSCs successfully differentiated into adipogenic and osteogenic lineages when cultured in induction media. Osteogenic differentiation was evidenced by extracellular calcium deposition (Alizarin Red S staining), while adipogenic differentiation was confirmed by intracellular lipid droplet formation (Oil Red O staining) (Fig. 1d and 1e). These findings collectively verify that the isolated cells meet all defining criteria for multipotent mesenchymal stem cells.
Morphological study
To examine whether MSCs respond to the morphological cues of different substrates, we compared their cell shape with that of native healthy and OA chondrocytes.
Chondrocytes
The cartilage samples collected from the patients exhibited evident signs of degradation, ossification, and erosion, in stark contrast to the healthy cartilage, which appeared entirely smooth and uniform (Fig. 2a).
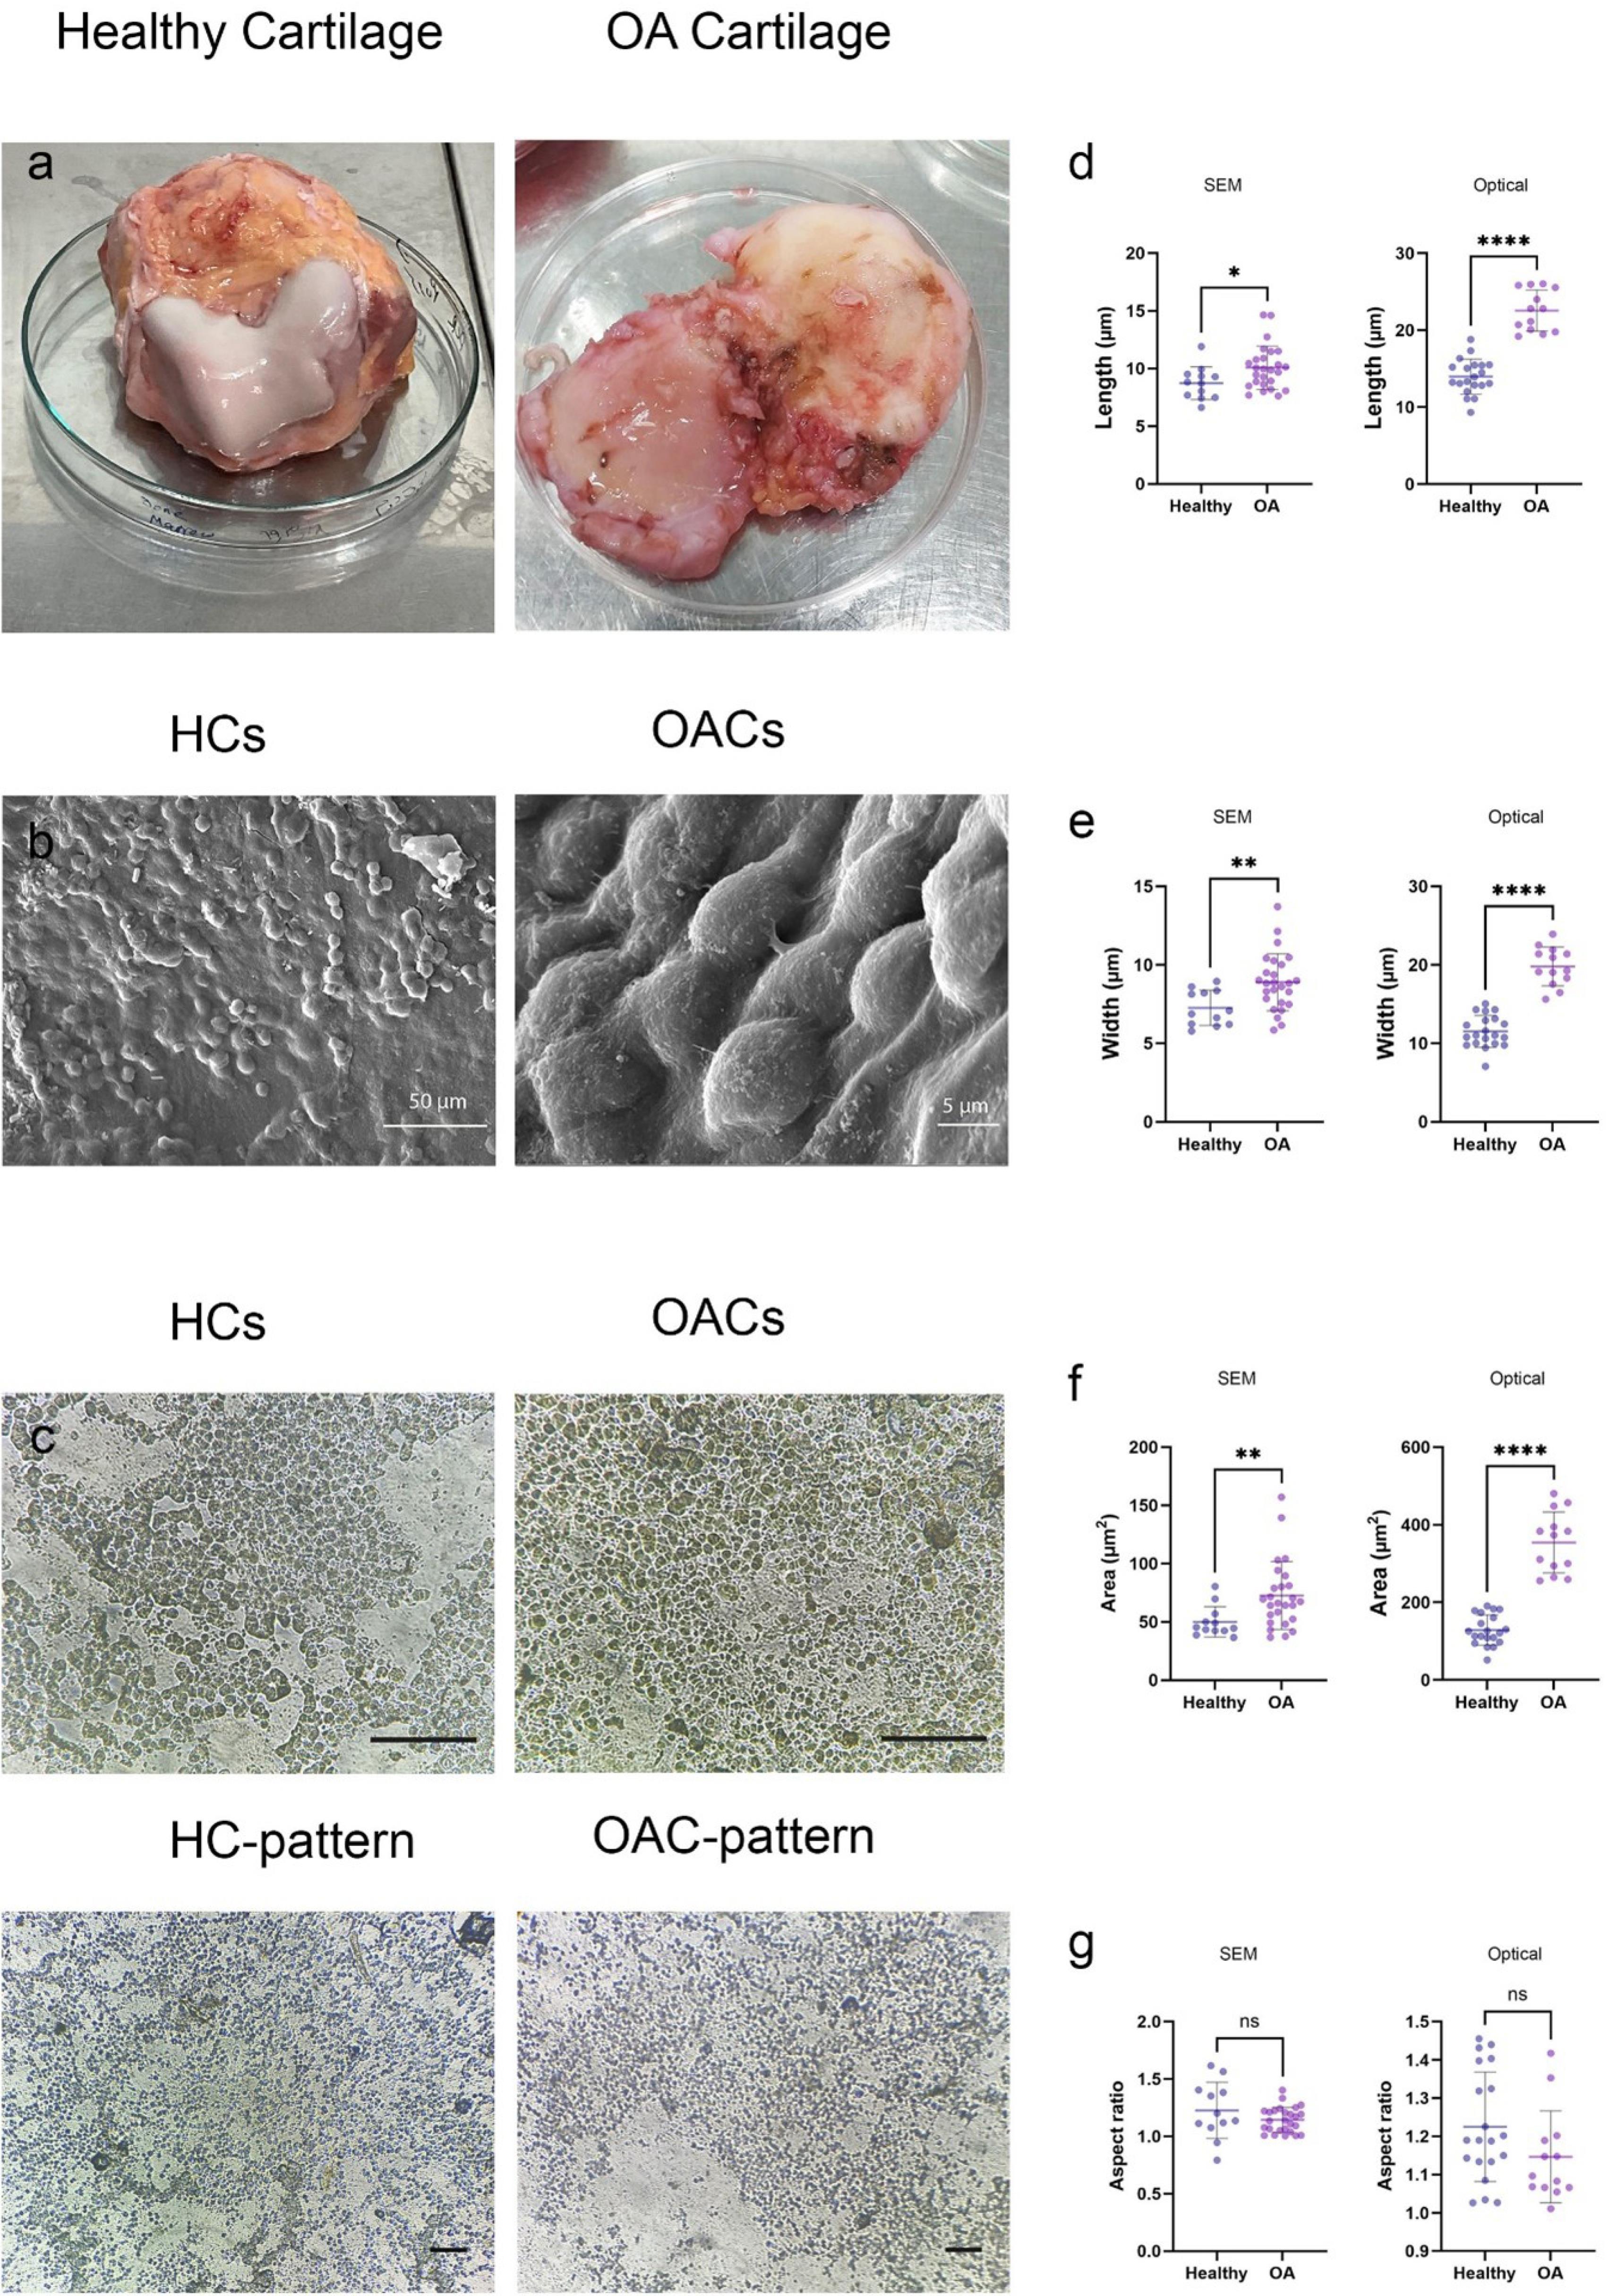
Fig. 2.
Morphological characterization of osteoarthritis chondrocytes (OACs) versus healthy chondrocytes (HCs).(a) Macroscopic appearance showing the distinct surface morphology between healthy (smooth, translucent) and osteoarthritic (fibrillated, eroded) cartilage. (b) SEM micrographs demonstrating characteristic cell shapes: HCs and OACs show rounded or elliptical morphology. (c) Comparative analysis of fixed cells and corresponding silicon substrate imprints, confirming faithful pattern transfer. (d-f) Quantitative morphometric analysis of (d) major axis (length), (e) minor axis (width), (f) cellular area, and (g) aspect ratio from both SEM and optical imaging modalities. Scale bars: 125 μm (c)
.
Morphological characterization of osteoarthritis chondrocytes (OACs) versus healthy chondrocytes (HCs).(a) Macroscopic appearance showing the distinct surface morphology between healthy (smooth, translucent) and osteoarthritic (fibrillated, eroded) cartilage. (b) SEM micrographs demonstrating characteristic cell shapes: HCs and OACs show rounded or elliptical morphology. (c) Comparative analysis of fixed cells and corresponding silicon substrate imprints, confirming faithful pattern transfer. (d-f) Quantitative morphometric analysis of (d) major axis (length), (e) minor axis (width), (f) cellular area, and (g) aspect ratio from both SEM and optical imaging modalities. Scale bars: 125 μm (c)
The isolated chondrocytes were fixed before undergoing dedifferentiation, and these cells were utilized for the subsequent experimental steps. Morphological features of OACs and HCs were examined using SEM (number of cells: HC = 12, OAC = 26) and optical microscopy (number of cells: HC = 20, OAC = 13), which confirmed their rounded or ellipsoid shapes (Fig. 2b and 2c).
Analysis of electron micrographs using Fiji software showed that the minor and major axes of OACs were significantly greater than those of HCs (major axis: 8.73 µm (HC) vs. 10.24 µm (OAC), P = 0.025; minor axis: 7.26 µm (HC) vs. 9.11 µm (OAC), P = 0.007) (Fig. 2d and 2e). As expected, the area derived from the ellipsoid area formula was significantly larger in arthritic chondrocytes than in their normal counterparts (49.98 µm2 (HC) vs. 73.26 µm2 (OAC), P= 0.008) (Fig. 2f). The aspect ratio, defined as the major axis to minor axis ratio, did not demonstrate any significant differences between groups (1.20 (HC) vs. 1.12 (OAC), P = 0.16) (Fig. 2g).
The values of these variables were obtained from light microscope images using the Adjust Threshold and ROI Manager features of Fiji software. The major and minor axes of the chondrocytes demonstrated that both axes were markedly larger in OACs compared to HCs (major axis: 13.98 µm (HC) vs. 22.57 µm (OAC), P < 0.0001; minor axis: 11.51 µm (HC) vs. 19.80 µm (OAC), P < 0.0001) (Fig. 2d and 2e). Moreover, area measurements were significantly larger in OACs compared to HCs (128.9 µm2 (HC) vs. 354.19 µm2 (OAC), P < 0.0001) (Fig. 2f). These results indicate that OACs have undergone hypertrophy. Consistent with the SEM analysis, there was no significant difference in the aspect ratio between the two groups (1.22 (HC) vs. 1.14 (OAC), P = 0.10) (Fig. 2g).
Chondrocyte-imprinted substrates
Optical microscopy and SEM were used to analyze the morphology of patterns formed by HCs and OACs. Fig. 2c illustrates the similarity between the morphology of chondrocytes and the patterns, as captured in both optical and SEM images. Measurements of the minor and major axes, area, and aspect ratio in chondrocyte-shaped cavities were conducted on both OA and healthy patterns, revealing no significant differences between the obtained values and those associated with native chondrocytes (data not shown). The SEM micrographs demonstrate that the imprinted patterns accurately replicate the characteristic rounded or ellipsoidal morphology of chondrocytes (Fig. 3a). These results demonstrate that the PDMS substrates successfully captured the characteristic nanotopographical features of both chondrocyte phenotypes with high fidelity.
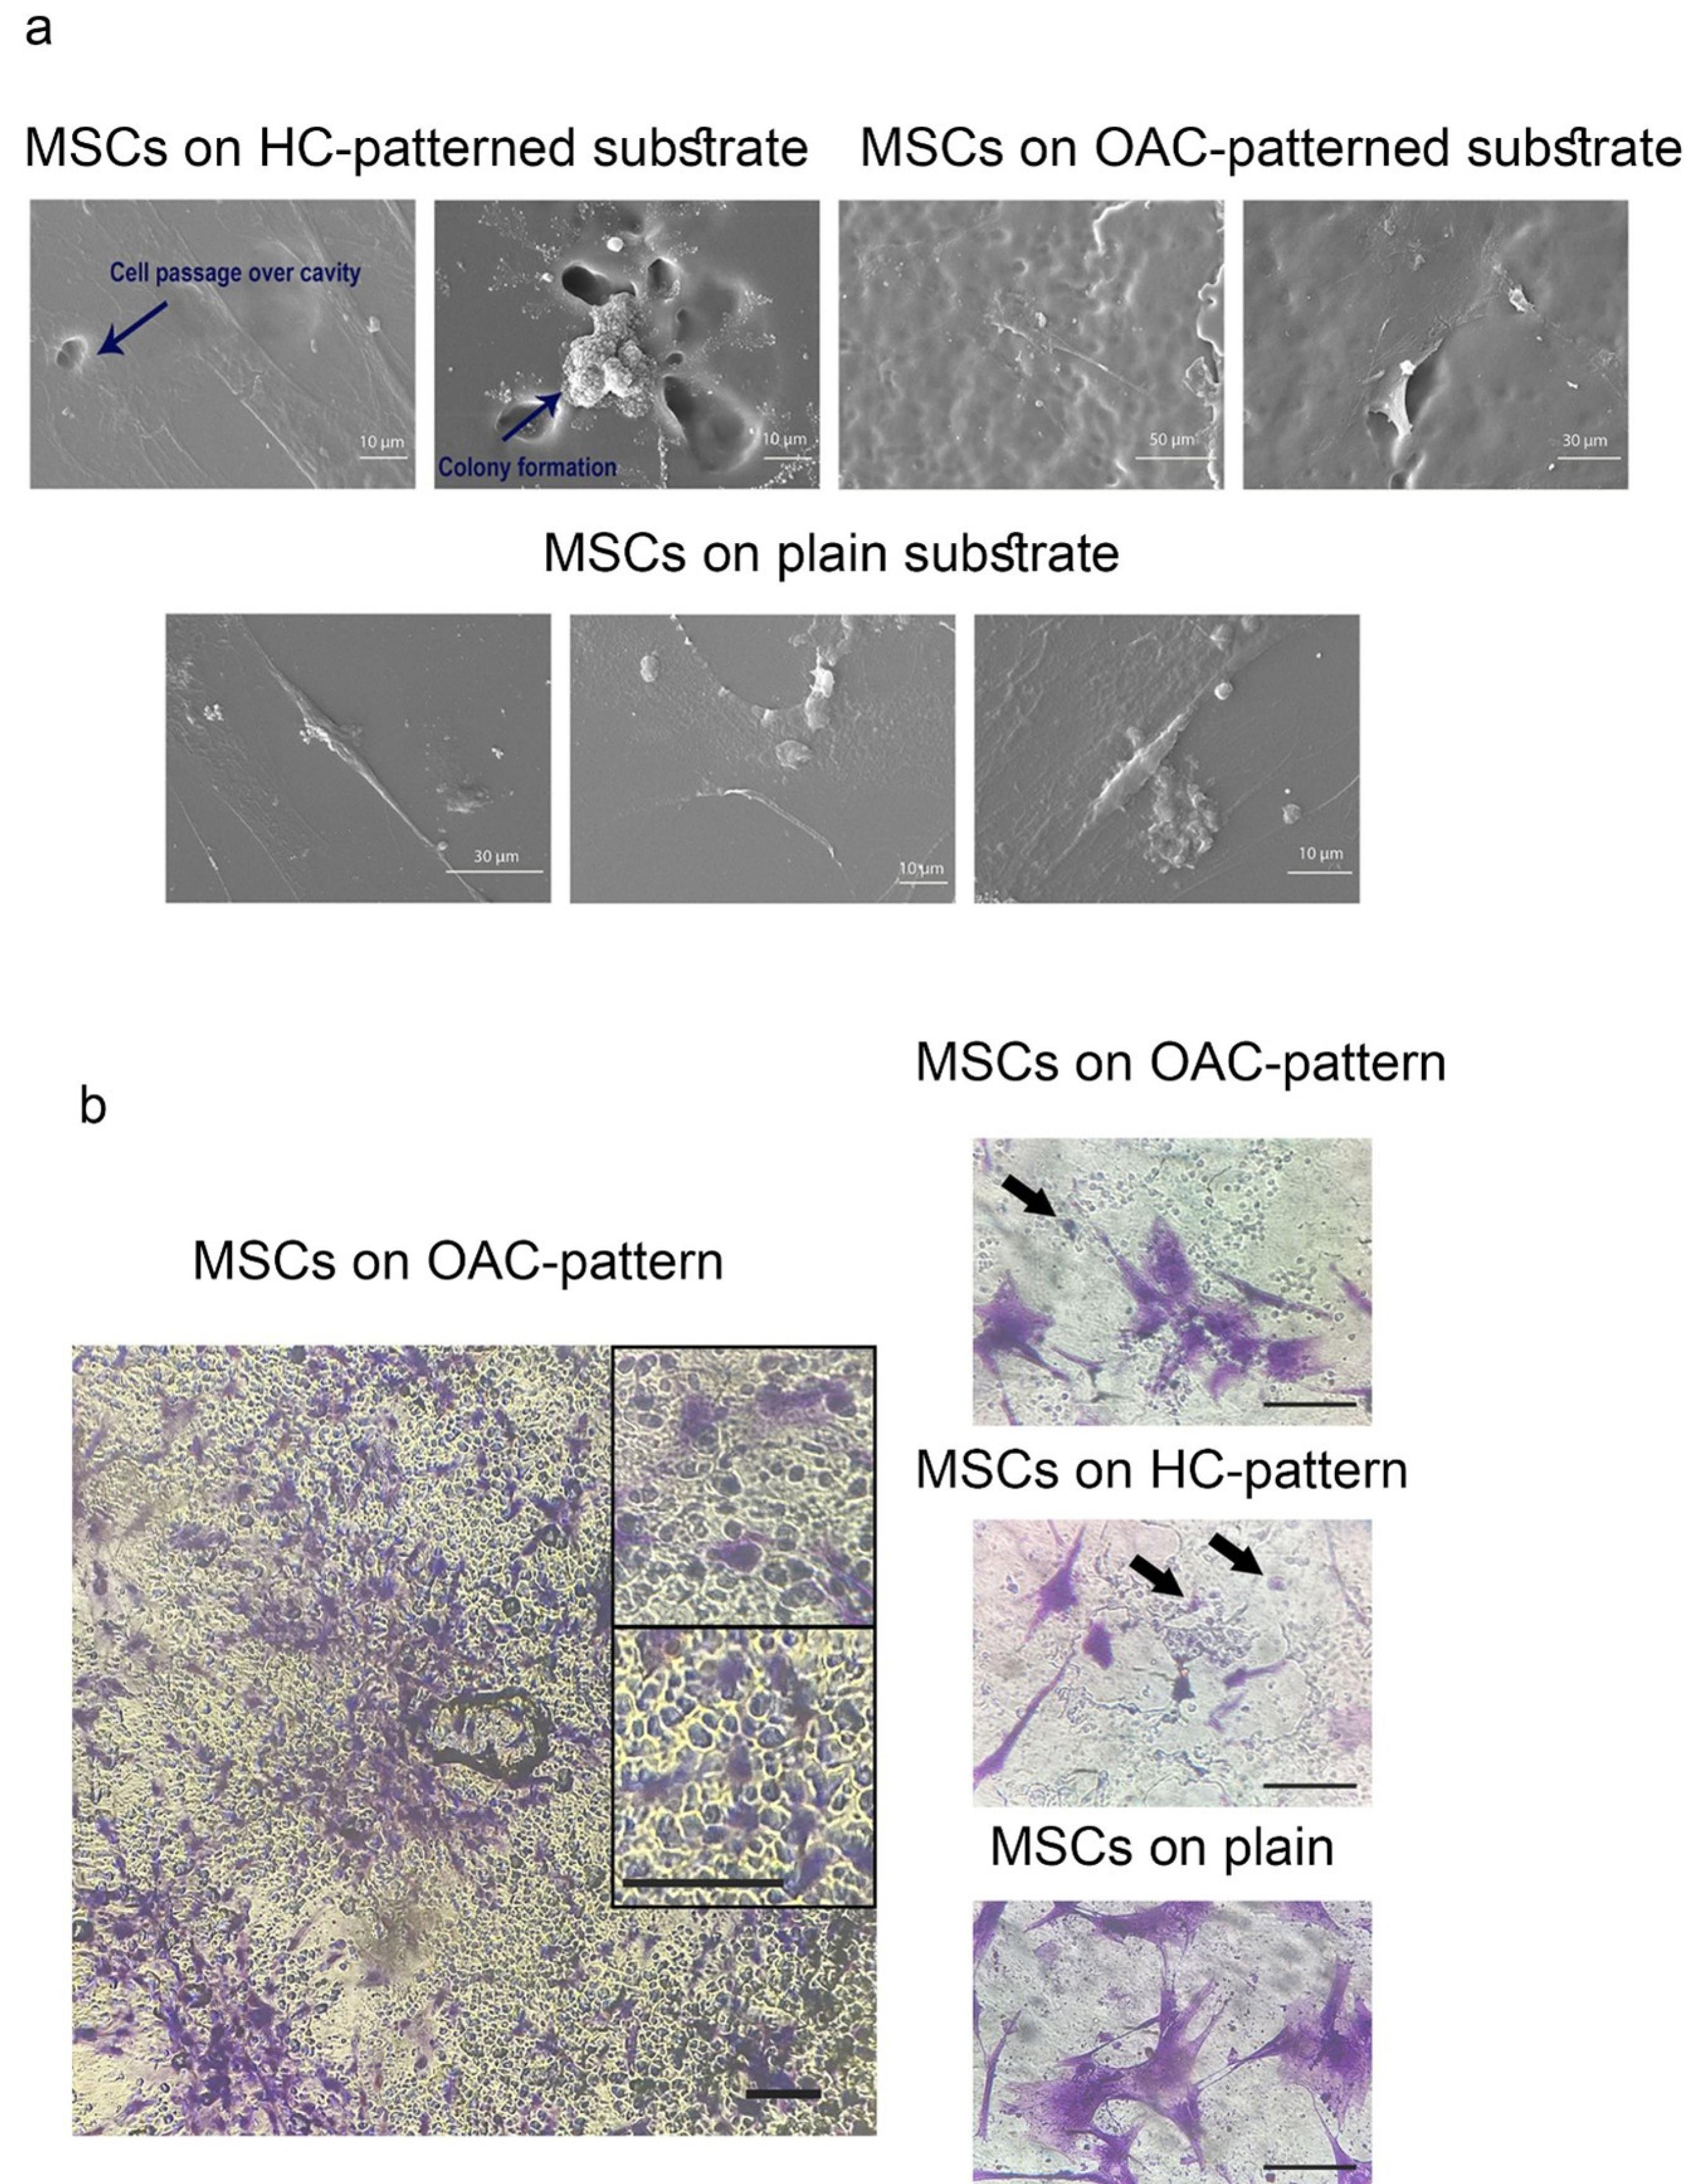
Fig. 3.
Morphological evaluation of MSCs cultured on patterned/plain substrates.(a) SEM analysis of MSC morphology on: Healthy chondrocyte (HC)-patterned substrates; Osteoarthritic chondrocyte (OAC)-patterned substrates; Non-patterned (plain) PDMS controls displaying random orientation. (b) Crystal violet staining reveals: MSCs attachment within OAC-imprinted cavities; MSC distribution on HC-imprinted surfaces; Uniform MSCs spreading on non-patterned controls—scale bars: 125 μm (b)
.
Morphological evaluation of MSCs cultured on patterned/plain substrates.(a) SEM analysis of MSC morphology on: Healthy chondrocyte (HC)-patterned substrates; Osteoarthritic chondrocyte (OAC)-patterned substrates; Non-patterned (plain) PDMS controls displaying random orientation. (b) Crystal violet staining reveals: MSCs attachment within OAC-imprinted cavities; MSC distribution on HC-imprinted surfaces; Uniform MSCs spreading on non-patterned controls—scale bars: 125 μm (b)
MSCs cultured on PDMS
Electron micrographs of MSCs cultured on HC-imprinted patterns (MSCs-H) and OAC-imprinted patterns (MSCs-OA) revealed two distinct responses to chondrocyte-shaped depressions. Some cells migrated across the cavities (Fig. 3a), while others became confined within them, resulting in colony formation. In contrast, cells cultured on flat surfaces exhibited more uniform distribution with reduced three-dimensional colony formation (Fig. 3a). Optical micrographs, however, demonstrated cells fully engaged within cavities, adopting chondrocyte-like morphologies not visible in SEM imaging (Fig. 3b).
Gene expression analysis
To assess whether morphological adaptation translated into molecular changes, we analyzed the expression of cartilage-, hypertrophy-, and fibrosis-related genes across all groups. The fold change was determined by normalizing all quantitative PCR (qPCR) data using the ΔCt values of MSCs cultured on plain substrates (MSCs-PS). The expression data for each gene across the four experimental groups (HC, OAC, MSCs-H, and MSCs-OA) were analyzed and subsequently visualized in a graph (Fig. 4).
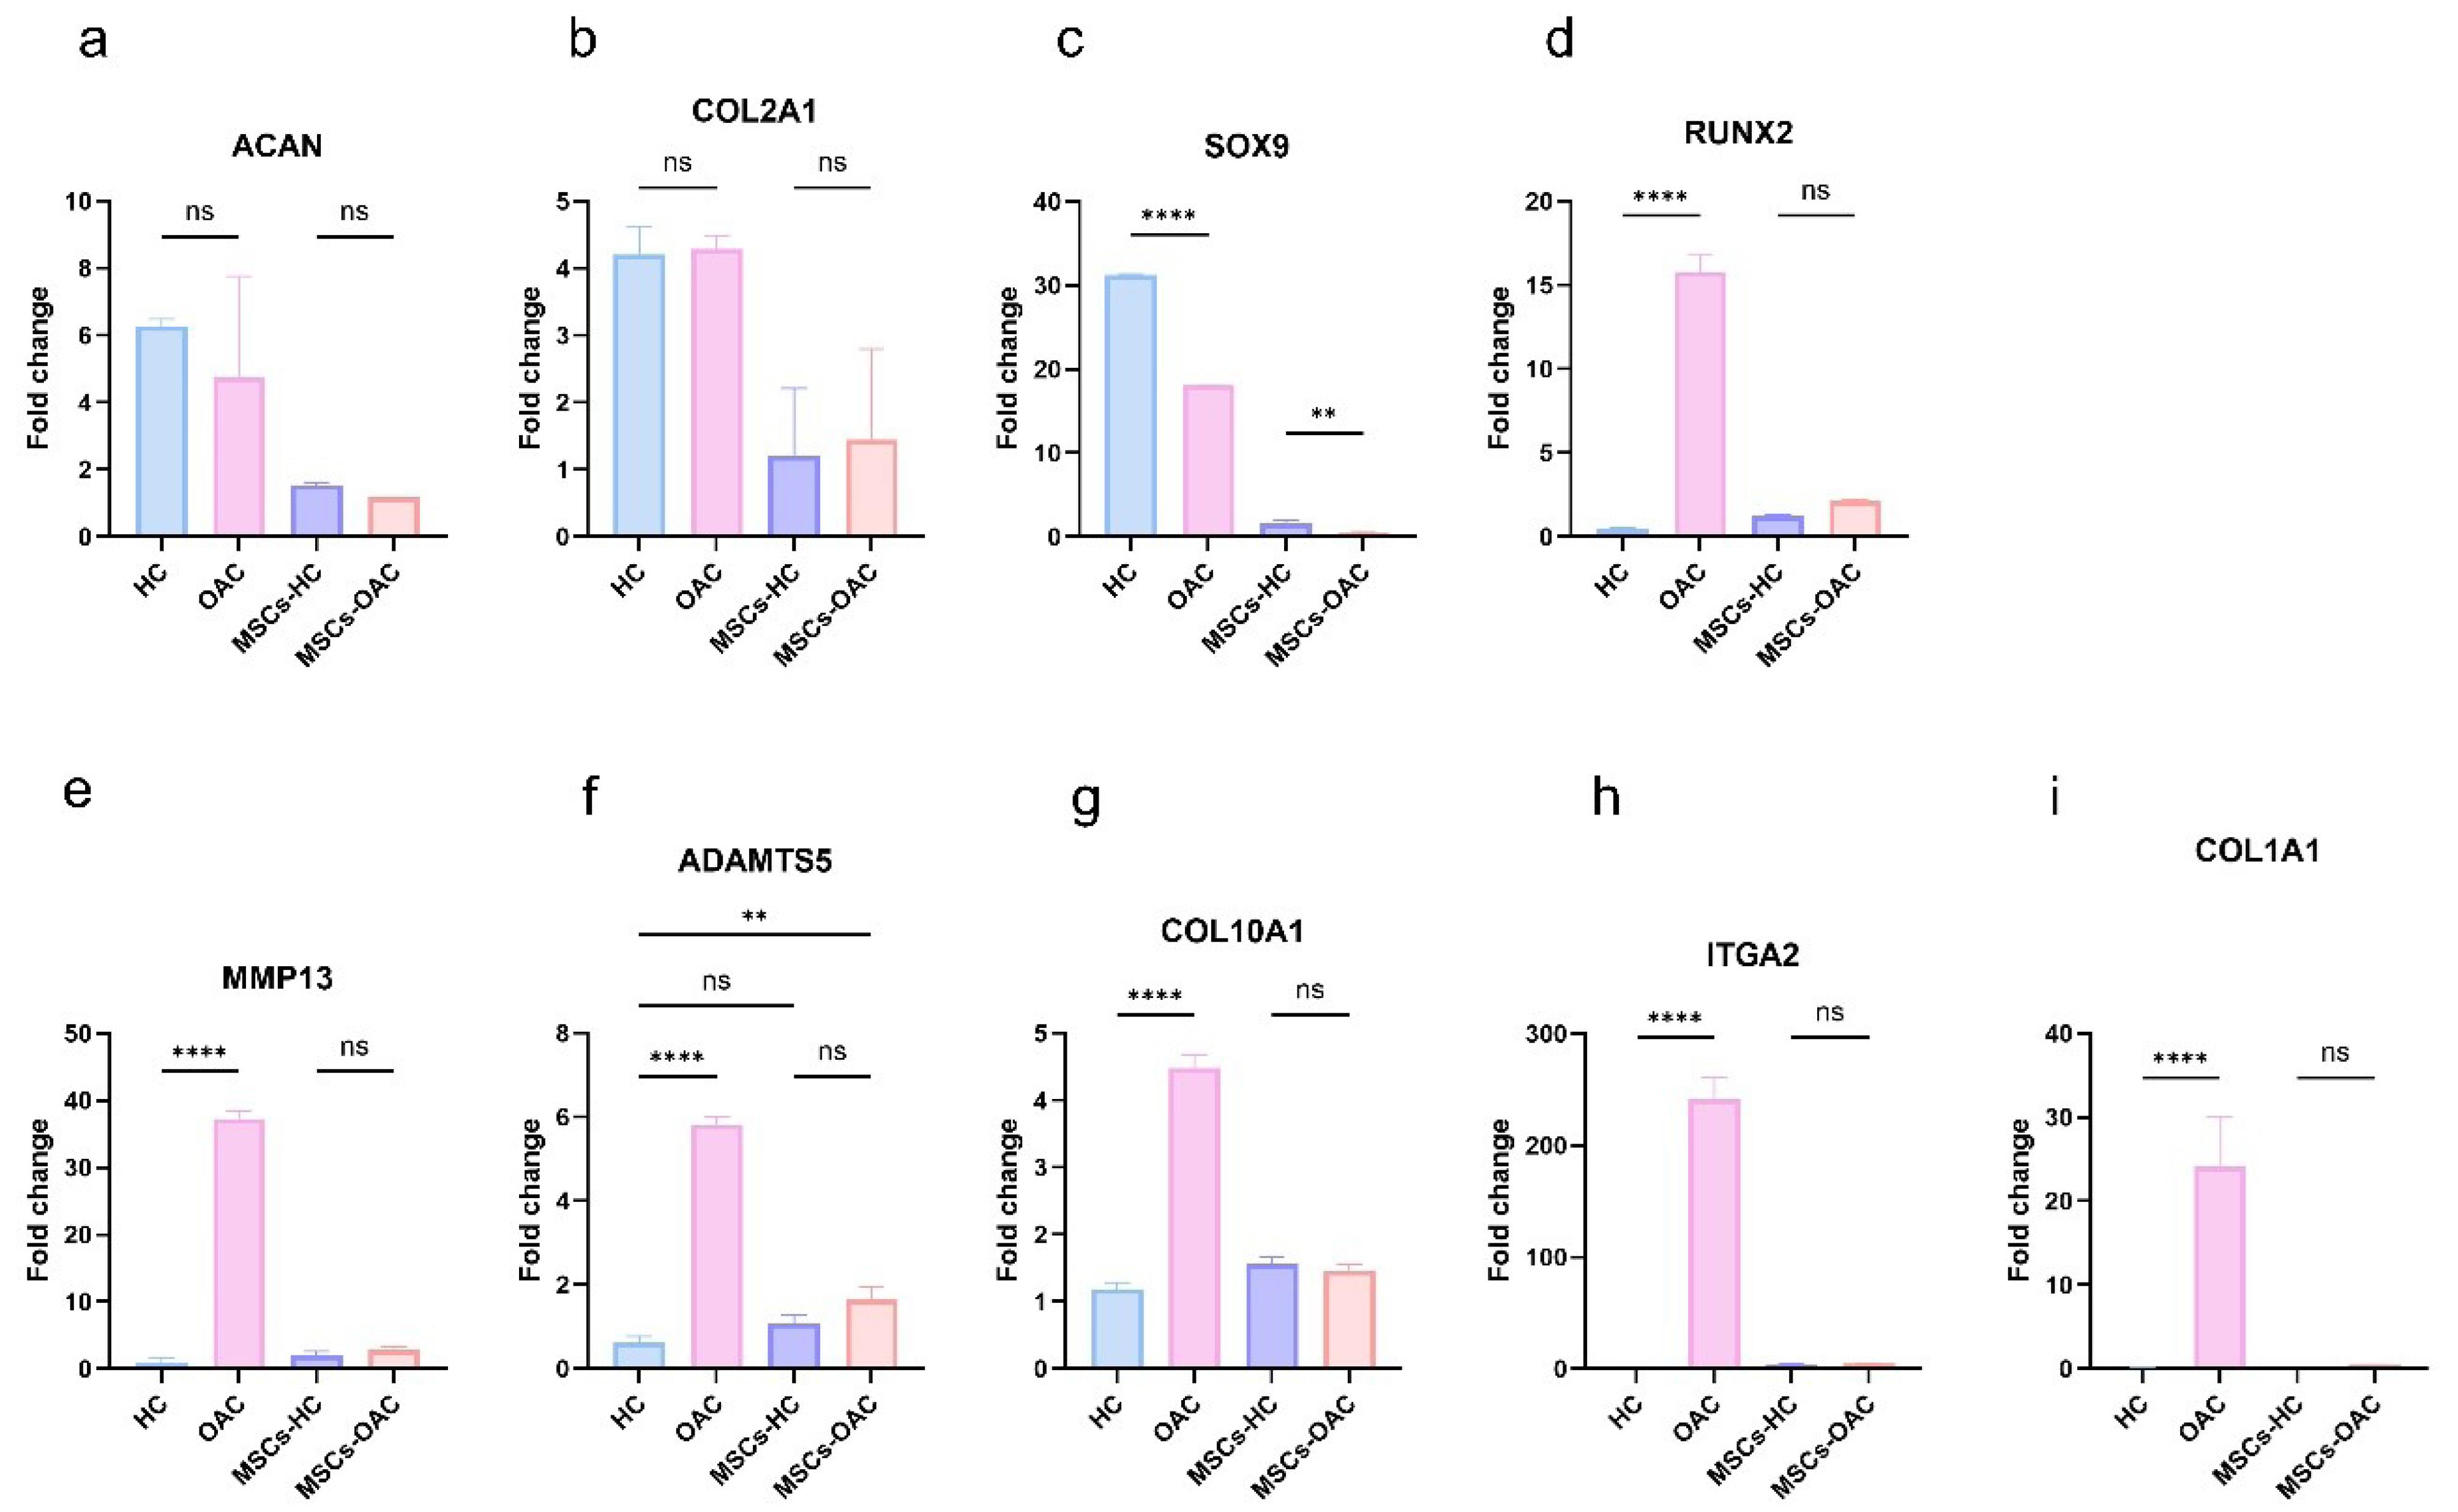
Fig. 4.
Graphs showing the fold change of chondrocyte and osteoarthritis (OA)-related genes in healthy chondrocytes (HC), OA chondrocytes (OAC), and mesenchymal stem cells (MSCs) cultured on patterned substrates. MSCs cultured on plain substrate were used for normalization.
.
Graphs showing the fold change of chondrocyte and osteoarthritis (OA)-related genes in healthy chondrocytes (HC), OA chondrocytes (OAC), and mesenchymal stem cells (MSCs) cultured on patterned substrates. MSCs cultured on plain substrate were used for normalization.
The expression of SOX9 was significantly reduced in OACs compared to HCs. Furthermore, MSCs-H showed pronounced upregulation of SOX9 relative to MSCs-OA. In contrast, COL2A1 expression showed no significant differences between: (1) healthy and OA tissues (P = 0.99), and (2) cells cultured on healthy versus OA substrates (P = 0.98). Additionally, ACAN displayed a non-significant reduction in expression in both OACs (P = 0.67) and MSCs-OA (P = 0.99) compared to their healthy counterparts. These findings demonstrate that culturing MSCs on healthy and OA substrates results in expression patterns that mirror those of their template chondrocytes for cartilage markers.
The hypertrophy-associated genes (RUNX2, COL10A1, MMP13, and ADAMTS5) exhibited significantly higher expression levels in OACs compared to HCs. RUNX2, MMP13, and ADAMTS5 exhibited increased expression in MSCs-OA relative to MSCs-H, though these differences were not statistically significant (P = 0.24, P = 0.77, and P = 0.44, respectively). Notably, ADAMTS5 expression in HCs was less pronounced when compared to MSCs-H (P = 0.30) than MSCs-OA (P = 0.02). ITGA2 and COL1A1 expression were nearly undetectable in healthy cartilage but substantially elevated in OA cartilage. However, neither gene showed significant expression differences between the MSC groups (both P = 0.99). These results suggest that although this effect does not reach statistical significance, inducing OA hypertrophic chondrocyte morphology in MSCs promotes a slight tendency toward OA-associated gene expression patterns.
Extracellular matrix synthesis
We evaluated extracellular matrix production by assessing collagen deposition and proteoglycan accumulation to determine whether morphological imprinting influenced functional outcomes.
Immunofluorescent staining
HCs and OACs expressed type II collagen, with HCs demonstrating stronger immunoreactivity (Fig. 5a). However, no significant difference in type I collagen expression was observed between healthy and OA-affected chondrocytes (Fig. 5b).
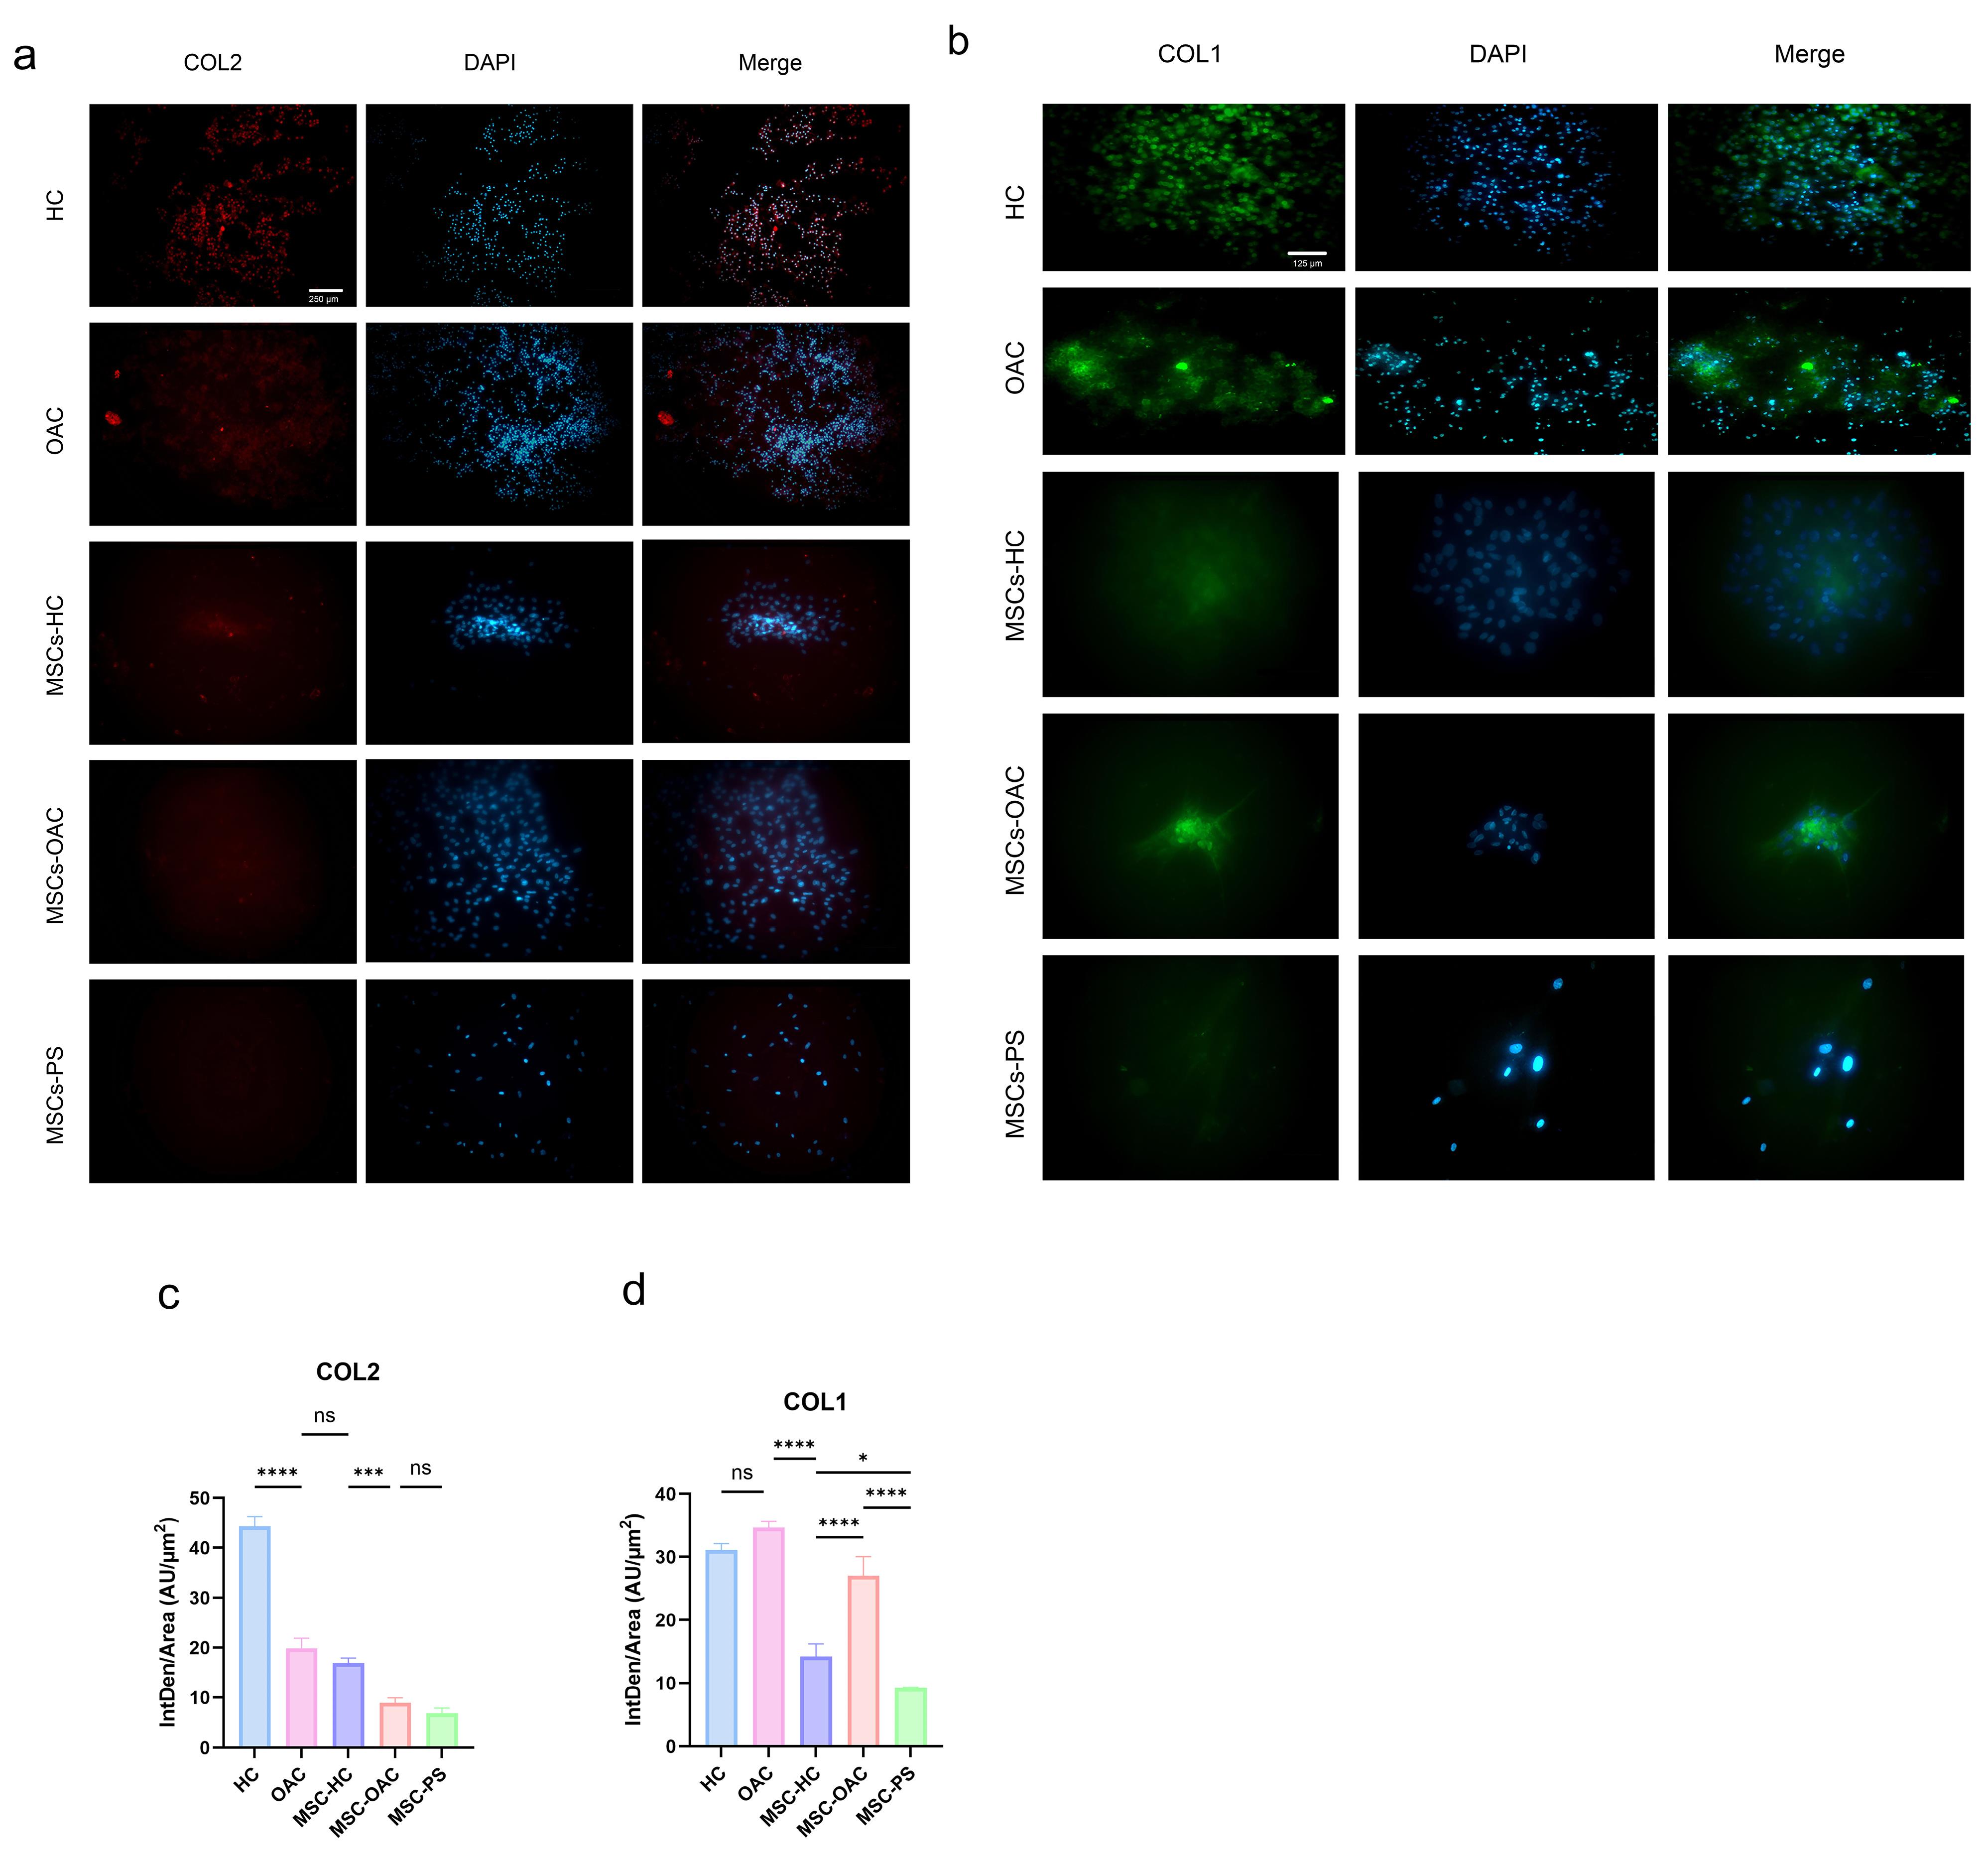
Fig. 5.
Immunofluorescence analysis of collagen expression in chondrocytes and mesenchymal stem cells (MSCs). Representative images show type II collagen (COL2) and type I collagen (COL1) distribution in healthy chondrocytes (HCs), osteoarthritis chondrocytes (OACs), MSCs cultured on HCs-imprinted substrates (MSCs-H), OACs-imprinted substrates (MSCs-OA), and plain substrates (MSCs-PS). Graphs (c) and (d) illustrate the integrity density per area for COL2 and COL1, respectively
.
Immunofluorescence analysis of collagen expression in chondrocytes and mesenchymal stem cells (MSCs). Representative images show type II collagen (COL2) and type I collagen (COL1) distribution in healthy chondrocytes (HCs), osteoarthritis chondrocytes (OACs), MSCs cultured on HCs-imprinted substrates (MSCs-H), OACs-imprinted substrates (MSCs-OA), and plain substrates (MSCs-PS). Graphs (c) and (d) illustrate the integrity density per area for COL2 and COL1, respectively
Type II collagen expression was highest in MSCs-H, followed by MSCs-OA, with the lowest expression detected in MSCs-PS (Fig. 5c). Regarding type I collagen, its expression was markedly elevated in MSCs-OA compared to MSCs-H. At the same time, both showed higher expression than MSCs-PS (Fig. 5d). The imprinted substrates appear to enhance collagen types I and II expression in cultured cells, however this effect may stem from cellular accumulation, as cells demonstrate increased propensity for colony formation on patterned substrates.
PG staining
Microscopic evaluation demonstrated significantly greater staining intensity with both dyes in HCs compared to OACs (Fig. 6), suggesting an enhanced proteoglycan synthesis capacity in HCs.
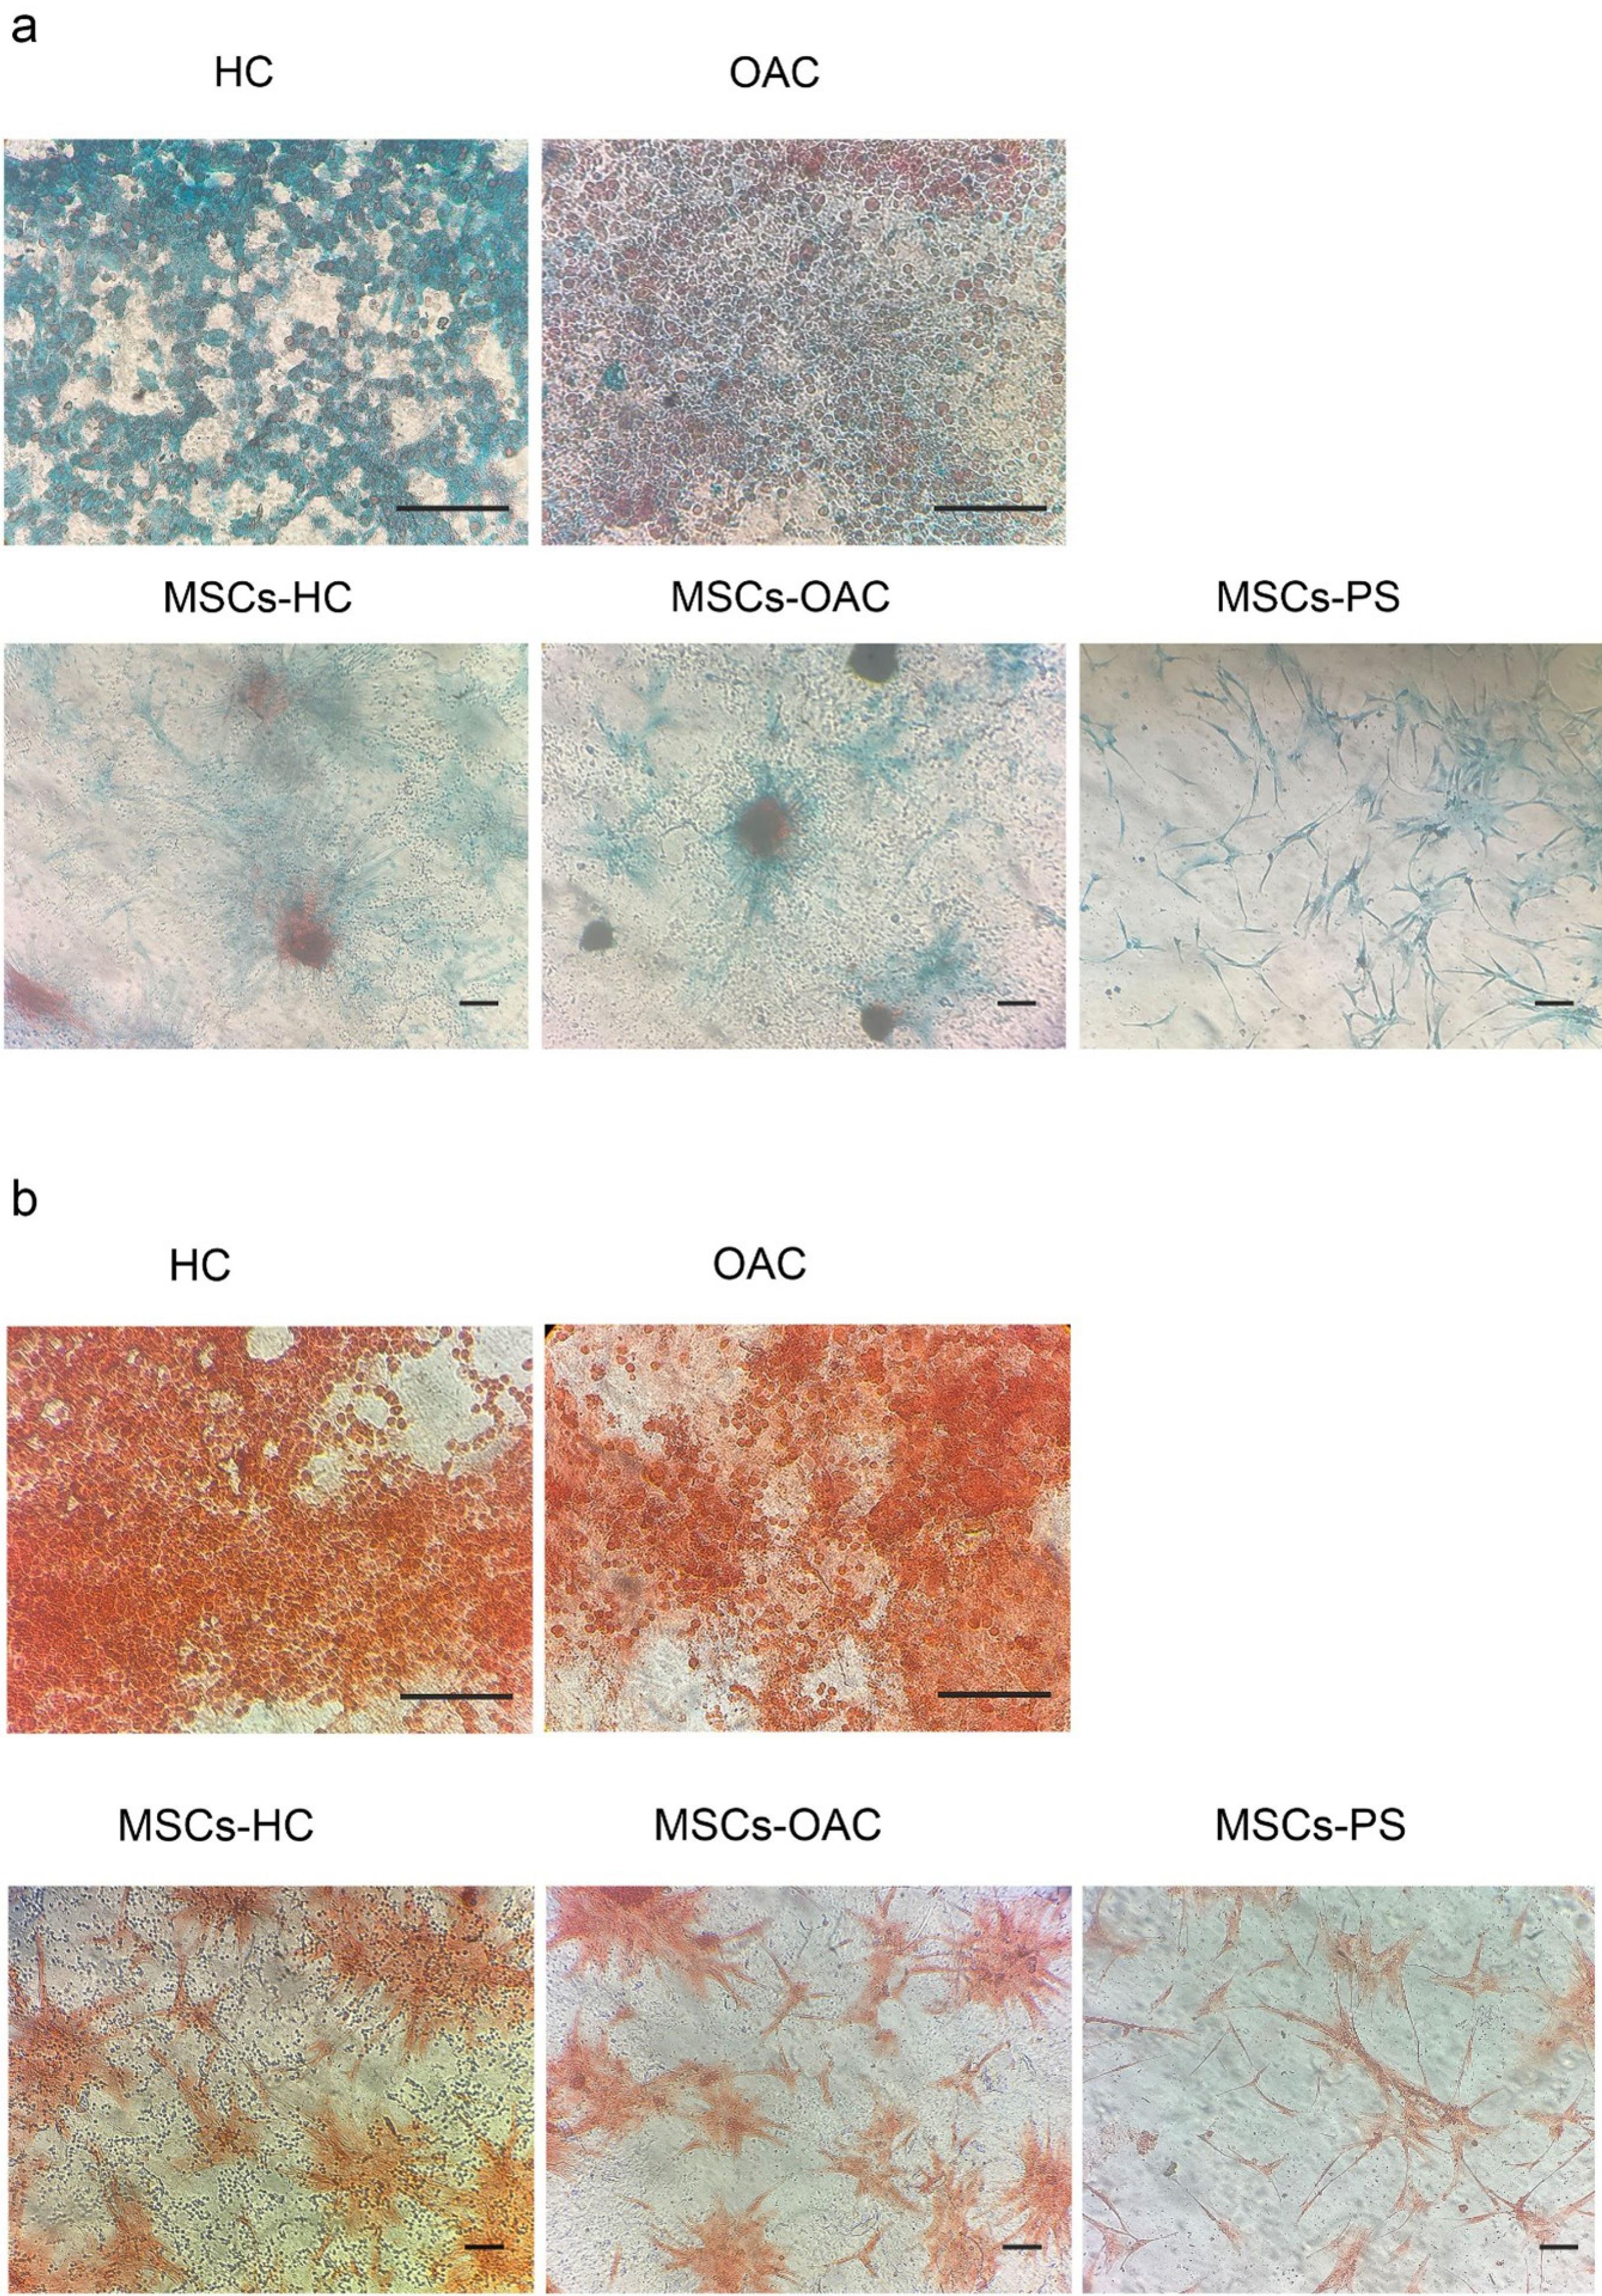
Fig. 6.
Study of proteoglycan levels. (a) Alcian blue staining of healthy chondrocytes (HCs), osteoarthritis chondrocytes (OACs), and mesenchymal stem cells (MSCs) cultured on HCs-imprinted substrates (MSCs-H), OACs-imprinted substrates (MSCs-OA), and plain substrates (MSCs-PS). (b) Safranin O staining of HCs, OACs, MSCs-H, MSCs-OA, and MSCs-PS. Scale bars: 125 μm.
.
Study of proteoglycan levels. (a) Alcian blue staining of healthy chondrocytes (HCs), osteoarthritis chondrocytes (OACs), and mesenchymal stem cells (MSCs) cultured on HCs-imprinted substrates (MSCs-H), OACs-imprinted substrates (MSCs-OA), and plain substrates (MSCs-PS). (b) Safranin O staining of HCs, OACs, MSCs-H, MSCs-OA, and MSCs-PS. Scale bars: 125 μm.
Furthermore, Alcian Blue and Safranin O staining showed no significant differences in proteoglycan production and secretion among the three MSC groups (Fig. 6).
Celecoxib treatment
To explore the potential application of this platform for drug testing, we investigated the response of MSCs on imprinted substrates to celecoxib, a common OA treatment. Gene expression changes were evaluated by calculating fold changes, normalizing ΔCt values of treated samples against their untreated counterparts (Fig. 7).
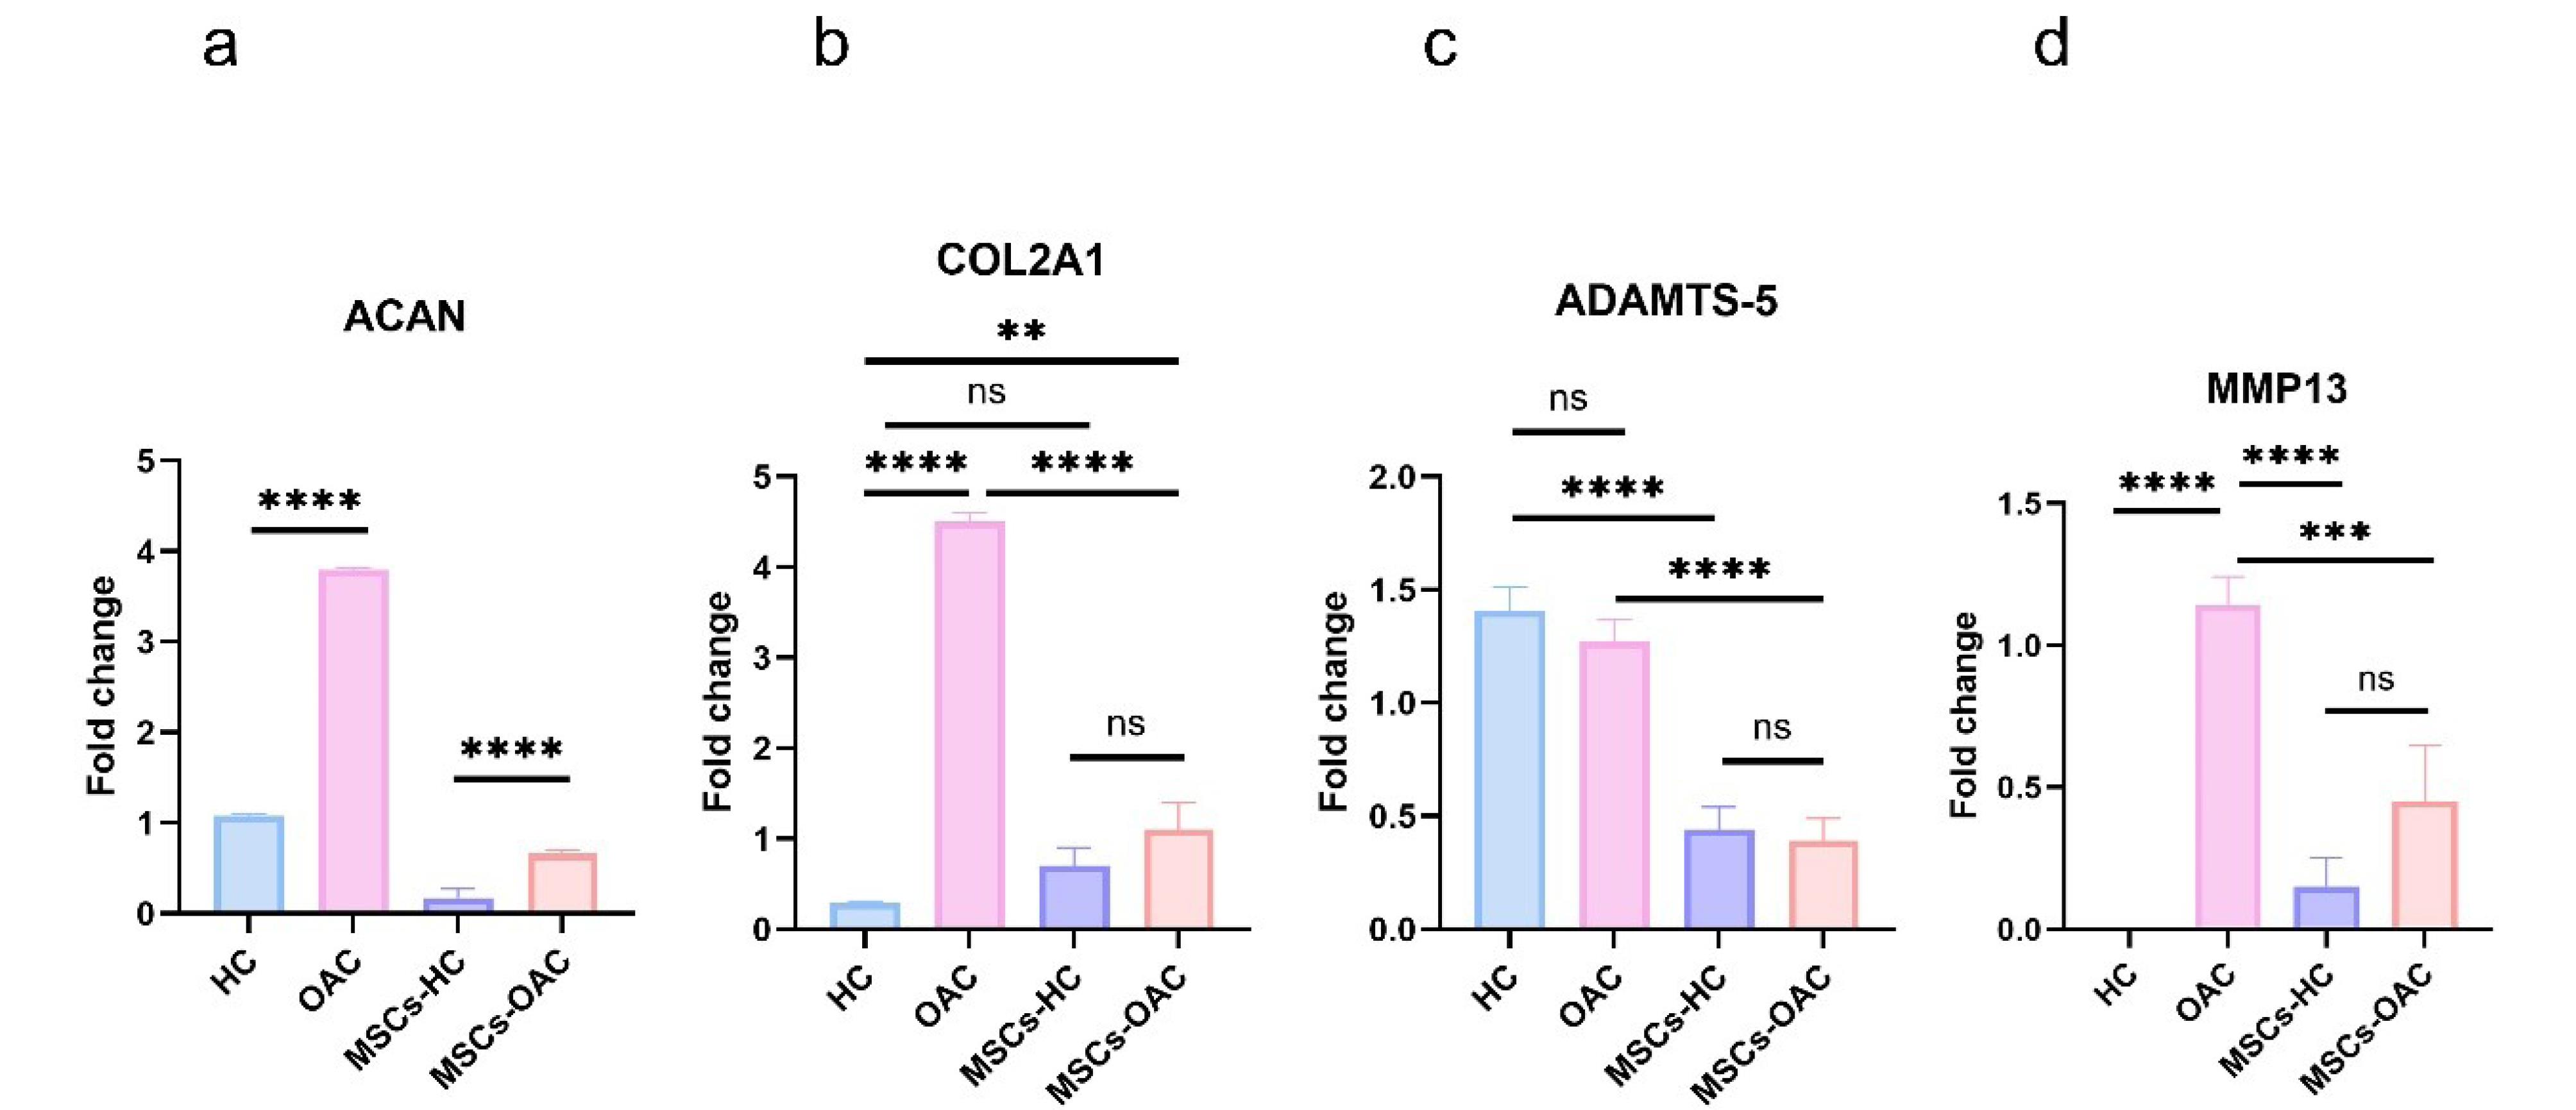
Fig. 7.
Graphs showing the fold change of chondrocyte and osteoarthritis (OA)-related genes in healthy chondrocytes (HC), OA chondrocytes (OAC), and mesenchymal stem cells (MSCs) cultured on patterned substrates in response to celecoxib treatment. Untreated cells were used for normalization.
.
Graphs showing the fold change of chondrocyte and osteoarthritis (OA)-related genes in healthy chondrocytes (HC), OA chondrocytes (OAC), and mesenchymal stem cells (MSCs) cultured on patterned substrates in response to celecoxib treatment. Untreated cells were used for normalization.
Celecoxib treatment reduced COL2A1 expression in HCs while increasing it in OACs. Though not significantly, these expression trends were mirrored in MSCs cultured on healthy and OA patterns. Notably, celecoxib enhanced ACAN expression in OACs but not in HCs, while reducing aggrecan levels in MSCs, particularly those on healthy patterns. The treatment decreased MMP13 expression in HCs but slightly increased it in OACs, with both MSC groups showing reduced expression (more pronounced in MSCs-H). ADAMTS5 expression increased in both chondrocyte types (more markedly in HCs) but decreased in MSCs (more substantially in MSCs-OA). Generally, it seems that the cultivation of stem cells on healthy or OA cell-imprinted substrates produces a gene expression profile that is more aligned with HCs and OACs, respectively, as opposed to the effects of drug treatment.
Discussion
Although osteoarthritis is prevalent, its precise etiology remains unclear, and no definitive treatment has been established. In OA cartilage, the calcified zone containing hypertrophic chondrocytes extends toward the surface layers. The resulting increase in chondrocyte size has been associated with altered matrix metabolism and upregulation of hypertrophy-related markers such as type X collagen, MMP13, and ADAMTS.6,14,29
Cells can perceive micro- and nanoscale topographical cues in their environment and convert these mechanical inputs into biochemical responses. Cell-imprinting technology leverages this principle by using target cells as templates to mimic their native morphology and topography on biomaterial substrates such as PDMS,30 which can reproduce nanoscale features with resolutions down to 30 nm.31 Based on this principle, we hypothesized that imposing OA chondrocyte morphology on stem cells could modulate chondrogenic marker expression and OA-associated genes. To test this hypothesis, we first investigated morphological alterations in OA chondrocytes.
Our electron and light microscopy measurements revealed a 46.6% and 174.77% increase in cell area, respectively, while the aspect ratio remained consistent in both methods. These results align closely with previous in vivo reports showing that chondrocyte volume increases by approximately 23% in grade 1, 58% in grade 2, and up to 92% in grade 3 OA cartilage relative to grade 0 samples.8 Furthermore, histological analyses of human and rabbit articular cartilage confirmed that OACs were consistently larger than HCs, with cell size correlating directly with the severity of cartilage degradation.9 Such enlargement likely reflects the transition of chondrocytes toward a hypertrophic phenotype that disrupts tissue homeostasis.
At the molecular level, our qPCR results demonstrated a marked reduction in SOX9 expression in OACs relative to HCs, consistent with its central role as a master regulator of chondrogenesis and its known downregulation in OA cartilage.32 Interestingly, despite decreased SOX9, COL2A1 and ACAN expression did not significantly decline, which agrees with previous transcriptomic data showing that matrix genes can remain abundantly expressed even during the onset of cartilage catabolism.33 These results collectively suggest that OACs maintain their capacity to synthesize major cartilage matrix components, as further supported by the positivity for type II collagen in our immunofluorescence assays. In contrast, type I collagen—a fibrocartilage and tissue remodeling marker—was strongly upregulated in OACs, consistent with its association with advanced OA severity.34 However, immunofluorescence analysis revealed detectable collagen I staining even in HCs, aligning with earlier observations that a small proportion (≈9%) of normal cartilage cells express type I collagen.35
RUNX2, MMP13, COL10A1, and ADAMTS5 were also significantly elevated in OACs compared to HCs, confirming the hypertrophic and degradative phenotype characteristic of OA cartilage. ITGA2 was specifically included due to its absence in HCs and its reactivation in OA cartilage, where it facilitates cell–matrix adhesion and mechanotransduction via collagen-binding.36 In our data, ITGA2 expression was markedly upregulated in OACs compared with HCs, reinforcing its value as an OA-associated adhesion marker.
When MSCs were cultured on chondrocyte-imprinted substrates, their transcriptional profiles partially mirrored those of their template cells: SOX9 and ACAN were higher on healthy patterns, while COL1A1 was elevated on OA patterns, reflecting fibrocartilaginous remodeling. Likewise, while RUNX2, MMP13, ADAMTS5, and ITGA2 showed upward trends in MSCs-OA compared to MSCs-H, the changes were not statistically significant. Collectively, these findings indicate that morphological imprinting reproduces only certain aspects of the OA-like hypertrophic and degradative program. This outcome suggests that imprinting can confer a degree of “disease memory” to MSCs, enabling them to retain a transcriptional bias that reflects the molecular behavior of their osteoarthritic templates—even in the absence of additional biochemical stimulation.
Treatment with celecoxib, a selective COX-2 inhibitor, provided further insight into the disease-specific responses of chondrocytes. The effects of celecoxib were strongly dependent on the cellular context. In HCs, celecoxib induced a catabolic profile, as reflected by decreased expression of COL2A1, together with increased levels of ADAMTS5. In contrast, OACs exhibited a distinct and more anabolic transcriptional response. Celecoxib markedly enhanced COL2A1 and ACAN expression, in line with previous reports showing its potential to restore cartilage matrix synthesis in OA cells.37,38 However, the same treatment also upregulated MMP13 and ADAMTS5, indicating a residual catabolic activity that was even more pronounced than in HCs. This partially divergent behavior suggests that while celecoxib can stimulate anabolic matrix synthesis in OA cells, it simultaneously activates catabolic signaling pathways, leading to a mixed or context-dependent effect that does not fully align with prior literature.37-40
When MSCs were cultured on OA-imprinted substrates and subsequently treated with celecoxib, their gene expression changes followed similar relative trends to those observed in their template OACs, albeit with lower magnitudes. This pattern suggests that the morphological imprinting of OA topography may predispose MSCs to exhibit OA-like pharmacological responses, reflecting a retained transcriptional sensitivity aligned with their “imprinted” disease phenotype. Thus, the cell-imprinted substrates not only recapitulate morphological and genetic hallmarks of OA but also extend their influence to drug responsiveness—a feature that highlights their utility as a simplified in vitro platform for pharmacological screening.
Together, these findings indicate that cell imprinting can modulate not only cell morphology and gene expression but also the functional characteristics of extracellular matrix production. Although the differences in proteoglycan deposition between MSC groups were not statistically significant, modulation of collagen type I and II synthesis reflects the ability of imprinted surfaces to direct matrix composition in a disease-relevant manner. From a translational standpoint, this system provides a reproducible and controllable microenvironment for mechanistic studies of osteoarthritis and for evaluating drug effects, as illustrated by the celecoxib experiment.
This study, however, has several limitations. The number of healthy cartilage donors was small (n = 2), which may reduce statistical power when comparing healthy and OA groups. Furthermore, the distribution of the imprinted morphology on PDMS substrates was not entirely uniform, potentially causing heterogeneous cell–substrate interactions. Most importantly, while morphological imprinting induced partial replication of OA-like features, the absence of significant differences in several assays suggests that topographical cues alone are insufficient to fully model OA in vitro. Future work should therefore aim to integrate morphological imprinting with additional OA-inducing stimuli with biochemical (e.g., pro-inflammatory cytokines) and mechanical stimuli to establish more comprehensive and physiologically relevant in vitro models of OA.
Conclusion
In conclusion, this research demonstrates that OA chondrocytes exhibit an enlarged surface area compared to healthy chondrocytes, correlating with alterations in cartilage and OA-related gene expression. Culturing MSCs on imprinted substrates that replicate these morphologies partially reproduced the template-specific expression profiles and matrix production. Although MSCs did not fully adopt the phenotype of their template chondrocytes, their relative expression patterns reflected OA- and HC-associated trends, including in response to celecoxib treatment. These results suggest that cell-imprinting provides a controllable and repeatable method to capture key aspects of OA pathology, and that integrating this approach with additional modeling strategies may enhance its potential for studying disease mechanisms and therapeutic interventions.
Research Highlights
What is the current knowledge?
What is new here?
Competing Interests
The authors declare that they have no conflict of interest.
Ethical Approval
This study was approved by the Research Ethics Committee of Tabriz University of Medical Sciences (Approval Code: IR.TBZMED.REC.1400.698).
Acknowledgements
We extend our deepest gratitude to the dedicated staff at Mardom Hospital in Tehran for their exceptional clinical support. We also extend our appreciation to Dr. Mayeli, Ms. Maleki, and Ms. Rashidi for their outstanding care and support. We are equally indebted to the expert team at Pasteur Institute's Cell Bank department, particularly Dr. Amanzadeh and Ms. Sanjari, for their invaluable technical assistance and expertise throughout this study.
References
- Martel-Pelletier J, Barr AJ, Cicuttini FM, Conaghan PG, Cooper C, Goldring MB. Osteoarthritis. Nat Rev Dis Primers 2016; 2:16072. doi: 10.1038/nrdp.2016.72 [Crossref] [ Google Scholar]
- Courties A, Kouki I, Soliman N, Mathieu S, Sellam J. Osteoarthritis year in review 2024: epidemiology and therapy. Osteoarthritis Cartilage 2024; 32:1397-404. doi: 10.1016/j.joca.2024.07.014 [Crossref] [ Google Scholar]
- Guilak F. Biomechanical factors in osteoarthritis. Best Pract Res Clin Rheumatol 2011; 25:815-23. doi: 10.1016/j.berh.2011.11.013 [Crossref] [ Google Scholar]
- Pitsillides AA, Beier F. Cartilage biology in osteoarthritis--lessons from developmental biology. Nat Rev Rheumatol 2011; 7:654-63. doi: 10.1038/nrrheum.2011.129 [Crossref] [ Google Scholar]
- Rim YA, Nam Y, Ju JH. The role of chondrocyte hypertrophy and senescence in osteoarthritis initiation and progression. Int J Mol Sci 2020; 21:2358. doi: 10.3390/ijms21072358 [Crossref] [ Google Scholar]
- Akkiraju H, Nohe A. Role of chondrocytes in cartilage formation, progression of osteoarthritis and cartilage regeneration. J Dev Biol 2015; 3:177-92. doi: 10.3390/jdb3040177 [Crossref] [ Google Scholar]
- Charlier E, Deroyer C, Ciregia F, Malaise O, Neuville S, Plener Z. Chondrocyte dedifferentiation and osteoarthritis (OA). BiochemPharmacol 2019; 165:49-65. doi: 10.1016/j.bcp.2019.02.036 [Crossref] [ Google Scholar]
- Bush PG, Hall AC. The volume and morphology of chondrocytes within non-degenerate and degenerate human articular cartilage. Osteoarthritis Cartilage 2003; 11:242-51. doi: 10.1016/s1063-4584(02)00369-2 [Crossref] [ Google Scholar]
- Gratal P, Mediero A, Sánchez-Pernaute O, Prieto-Potin I, Lamuedra A, Herrero-Beaumont G. Chondrocyte enlargement is a marker of osteoarthritis severity. Osteoarthritis Cartilage 2019; 27:1229-34. doi: 10.1016/j.joca.2019.04.013 [Crossref] [ Google Scholar]
- Selig M, Azizi S, Walz K, Lauer JC, Rolauffs B, Hart ML. Cell morphology as a biological fingerprint of chondrocyte phenotype in control and inflammatory conditions. Front Immunol 2023; 14:1102912. doi: 10.3389/fimmu.2023.1102912 [Crossref] [ Google Scholar]
- Phan MN, Leddy HA, Votta BJ, Kumar S, Levy DS, Lipshutz DB. Functional characterization of TRPV4 as an osmotically sensitive ion channel in porcine articular chondrocytes. Arthritis Rheum 2009; 60:3028-37. doi: 10.1002/art.24799 [Crossref] [ Google Scholar]
- Nurminsky D, Magee C, Faverman L, Nurminskaya M. Regulation of chondrocyte differentiation by actin-severing protein adseverin. Dev Biol 2007; 302:427-37. doi: 10.1016/j.ydbio.2006.09.052 [Crossref] [ Google Scholar]
- Lee HP, Gu L, Mooney DJ, Levenston ME, Chaudhuri O. Mechanical confinement regulates cartilage matrix formation by chondrocytes. Nat Mater 2017; 16:1243-51. doi: 10.1038/nmat4993 [Crossref] [ Google Scholar]
- Hall AC. The role of chondrocyte morphology and volume in controlling phenotype-implications for osteoarthritis, cartilage repair, and cartilage engineering. CurrRheumatol Rep 2019; 21:38. doi: 10.1007/s11926-019-0837-6 [Crossref] [ Google Scholar]
- Capín-Gutiérrez N, Talamás-Rohana P, González-Robles A, Lavalle-Montalvo C, Kourí JB. Cytoskeleton disruption in chondrocytes from a rat osteoarthrosic (OA)-induced model: its potential role in OA pathogenesis. HistolHistopathol 2004; 19:1125-32. doi: 10.14670/hh-19.1125 [Crossref] [ Google Scholar]
- Blain EJ, Gilbert SJ, Hayes AJ, Duance VC. Disassembly of the vimentin cytoskeleton disrupts articular cartilage chondrocyte homeostasis. Matrix Biol 2006; 25:398-408. doi: 10.1016/j.matbio.2006.06.002 [Crossref] [ Google Scholar]
- Li J, Jiang H, Lv Z, Sun Z, Cheng C, Tan G. Articular fibrocartilage-targeted therapy by microtubule stabilization. Sci Adv 2022; 8:eabn8420. doi: 10.1126/sciadv.abn8420 [Crossref] [ Google Scholar]
- Woods A, Wang G, Beier F. RhoA/ROCK signaling regulates Sox9 expression and actin organization during chondrogenesis. J Biol Chem 2005; 280:11626-34. doi: 10.1074/jbc.M409158200 [Crossref] [ Google Scholar]
- Parreno J, Wu PH, Kandel R. Chondrocyte phenotype is regulated by actin through MRTF/SRF signaling. Osteoarthritis Cartilage 2015; 23:A151. doi: 10.1016/j.joca.2015.02.899 [Crossref] [ Google Scholar]
- Calizo RC, Bell MK, Ron A, Hu M, Bhattacharya S, Wong NJ. Cell shape regulates subcellular organelle location to control early Ca2 + signal dynamics in vascular smooth muscle cells. Sci Rep 2020; 10:17866. doi: 10.1038/s41598-020-74700-x [Crossref] [ Google Scholar]
- Govindaraj K, Meteling M, van Rooij J, Becker M, van Wijnen AJ, van den Beucken J. Osmolarity-induced altered intracellular molecular crowding drives osteoarthritis pathology. Adv Sci (Weinh) 2024; 11:e2306722. doi: 10.1002/advs.202306722 [Crossref] [ Google Scholar]
- Rangamani P, Lipshtat A, Azeloglu EU, Calizo RC, Hu M, Ghassemi S. Decoding information in cell shape. Cell 2013; 154:1356-69. doi: 10.1016/j.cell.2013.08.026 [Crossref] [ Google Scholar]
- Howard M. Cell signalling: changing shape changes the signal. Curr Biol 2006; 16:R673-5. doi: 10.1016/j.cub.2006.08.014 [Crossref] [ Google Scholar]
- Kamguyan K, Katbab AA, Mahmoudi M, Thormann E, Zajforoushan Moghaddam S, Moradi L. An engineered cell-imprinted substrate directs osteogenic differentiation in stem cells. Biomater Sci 2017; 6:189-99. doi: 10.1039/c7bm00733g [Crossref] [ Google Scholar]
- Mashinchian O, Bonakdar S, Taghinejad H, Satarifard V, Heidari M, Majidi M. Cell-imprinted substrates act as an artificial niche for skin regeneration. ACS Appl Mater Interfaces 2014; 6:13280-92. doi: 10.1021/am503045b [Crossref] [ Google Scholar]
- Moosazadeh Moghaddam M, Bonakdar S, Shokrgozar MA, Zaminy A, Vali H, Faghihi S. Engineered substrates with imprinted cell-like topographies induce direct differentiation of adipose-derived mesenchymal stem cells into Schwann cells. Artif Cells NanomedBiotechnol2019. 47: 1022-35. doi: 10.1080/21691401.2019.1586718.
- Haramshahi SM, Bonakdar S, Moghtadaei M, Kamguyan K, Thormann E, Tanbakooei S. Tenocyte-imprinted substrate: a topography-based inducer for tenogenic differentiation in adipose tissue-derived mesenchymal stem cells. Biomed Mater 2020; 15:035014. doi: 10.1088/1748-605X/ab6709 [Crossref] [ Google Scholar]
- Schneider S, Unger M, van Griensven M, Balmayor ER. Adipose-derived mesenchymal stem cells from liposuction and resected fat are feasible sources for regenerative medicine. Eur J Med Res 2017; 22:17. doi: 10.1186/s40001-017-0258-9 [Crossref] [ Google Scholar]
- Hunter DJ, Bierma-Zeinstra S. Osteoarthritis. Lancet 2019; 393:1745-59. doi: 10.1016/s0140-6736(19)30417-9 [Crossref] [ Google Scholar]
- Kamguyan K, Zajforoushan Moghaddam S, Nazbar A, Haramshahi SM, Taheri S, Bonakdar S. Cell-imprinted substrates: in search of nanotopographical fingerprints that guide stem cell differentiation. Nanoscale Adv 2021; 3:333-8. doi: 10.1039/d0na00692k [Crossref] [ Google Scholar]
- Odom TW, Thalladi VR, Love JC, Whitesides GM. Generation of 30-50 nm structures using easily fabricated, composite PDMS masks. J Am Chem Soc 2002; 124:12112-3. doi: 10.1021/ja0209464 [Crossref] [ Google Scholar]
- Neefjes M, van Caam AP, van der Kraan PM. Transcription factors in cartilage homeostasis and osteoarthritis. Biology (Basel) 2020; 9:290. doi: 10.3390/biology9090290 [Crossref] [ Google Scholar]
- Sieker JT, Proffen BL, Waller KA, Chin KE, Karamchedu NP, Akelman MR. Transcriptional profiling of articular cartilage in a porcine model of early post-traumatic osteoarthritis. J Orthop Res 2018; 36:318-29. doi: 10.1002/jor.23644 [Crossref] [ Google Scholar]
- Miosge N, Hartmann M, Maelicke C, Herken R. Expression of collagen type I and type II in consecutive stages of human osteoarthritis. Histochem Cell Biol 2004; 122:229-36. doi: 10.1007/s00418-004-0697-6 [Crossref] [ Google Scholar]
- Styczynska-Soczka K, Amin AK, Hall AC. Cell-associated type I collagen in nondegenerate and degenerate human articular cartilage. J Cell Physiol 2021; 236:7672-81. doi: 10.1002/jcp.30418 [Crossref] [ Google Scholar]
- Loeser RF. Integrins and chondrocyte-matrix interactions in articular cartilage. Matrix Biol 2014; 39:11-6. doi: 10.1016/j.matbio.2014.08.007 [Crossref] [ Google Scholar]
- Cho H, Walker A, Williams J, Hasty KA. Study of osteoarthritis treatment with anti-inflammatory drugs: cyclooxygenase-2 inhibitor and steroids. Biomed Res Int 2015; 2015:595273. doi: 10.1155/2015/595273 [Crossref] [ Google Scholar]
- Haartmans MJ, Timur UT, Emanuel KS, Caron MM, Jeuken RM, Welting TJ. Evaluation of the anti-inflammatory and chondroprotective effect of celecoxib on cartilage ex vivo and in a rat osteoarthritis model. Cartilage 2022; 13:19476035221115541. doi: 10.1177/19476035221115541 [Crossref] [ Google Scholar]
- Cheleschi S, Tenti S, Giannotti S, Veronese N, Reginster JY, Fioravanti A. A combination of celecoxib and glucosamine sulfate has anti-inflammatory and chondroprotective effects: results from an in vitro study on human osteoarthritic chondrocytes. Int J Mol Sci 2021; 22:8980. doi: 10.3390/ijms22168980 [Crossref] [ Google Scholar]
- Su SC, Tanimoto K, Tanne Y, Kunimatsu R, Hirose N, Mitsuyoshi T. Celecoxib exerts protective effects on extracellular matrix metabolism of mandibular condylar chondrocytes under excessive mechanical stress. Osteoarthritis Cartilage 2014; 22:845-51. doi: 10.1016/j.joca.2014.03.011 [Crossref] [ Google Scholar]