Bioimpacts. 15:32645.
doi: 10.34172/bi.32645
Original Article
Enantioselective analysis of metoprolol in plasma of hypertensive patients undergoing long-term therapy: Insights for personalized medicine
Behrouz Seyfinejad Conceptualization, Data curation, Formal analysis, Investigation, Methodology, Writing – original draft, 1, 2 
Kimiya Jouyban Investigation, Writing – original draft, 3
Jalil Houshyar Resources, 4
Amirreza Jabbaripour Sarmadian Investigation, 5
Abolghasem Jouyban Conceptualization, Funding acquisition, Investigation, Project administration, Supervision, Writing – review & editing, 2, 6, *
Author information:
1Cellular and Molecular Research Center, Cellular and Molecular Medicine Research Institute, Urmia University of Medical Sciences, Urmia, Iran
2Pharmaceutical Analysis Research Center, Pharmaceutical Sciences Institute, Tabriz University of Medical Sciences, Tabriz, Iran
3Experimental Medicine Research Center, Tehran University of Medical Sciences, Tehran, Iran
4Endocrine Research Center, Tabriz University of Medical Sciences, Tabriz, Iran
5Kidney Research Center, Tabriz University of Medical Sciences, Tabriz, Iran
6Faculty of Pharmacy, Tabriz University of Medical Sciences, Tabriz, Iran
Abstract
Introduction:
Metoprolol is therapeutically formulated as a racemate with stereoselective pharmacokinetics influenced by CYP2D6 polymorphism. Understanding enantioselective disposition is critical for optimizing therapy in hypertensive patients, particularly during long-term treatment, where metabolic and excretory pathways may interact unpredictably.
Methods:
This study analyzed plasma samples from 18 hypertensive patients on long-term metoprolol therapy using a validated chiral capillary electrophoresis method. Enantiomer concentrations were quantified, and S/R ratios were evaluated alongside patient demographics, dosing regimens, and co-administered drugs. The study design focused on identifying deviations from expected enantiomeric patterns observed in single-dose or short-term multi-dose administration in healthy individuals studies.
Results:
While most patients (70%) exhibited the anticipated S/R ratio≥1, 30% demonstrated inverted plasma S/R ratios (<1), suggesting altered renal excretion or CYP2D6 saturation.
Conclusion:
Long-term metoprolol therapy reveals complex enantioselective disposition influenced by metabolic phenotype, renal excretion and drug interactions. The unexpected S/R inversion underscores the need for personalized dosing, particularly in patients with renal impairment or polypharmacy. Enantiomer monitoring may complement pharmacogenomic strategies to optimize therapeutic outcomes.
Keywords: Metoprolol, Enantiomers, CYP2D6, Enantioselective excretion, Personalized medicine, Hypertension
Copyright and License Information
© 2025 The Author(s).
This work is published by BioImpacts as an open access article distributed under the terms of the Creative Commons Attribution Non-Commercial License (
http://creativecommons.org/licenses/by-nc/4.0/). Non-commercial uses of the work are permitted, provided the original work is properly cited.
Funding Statement
This work was supported by Elite Researcher Grant Committee under grant number 4021656 from the National Institute for Medical Research Development (NIMAD), Tehran, Iran.
Introduction
Metoprolol (MTL) is commonly used to manage some cardiovascular diseases.1 It is absorbed via passive diffusion and binds to plasma proteins, primarily albumin and α1-acid glycoprotein. Wide variations in its concentrations have been reported in plasma,2 urine,3,4 exhaled breath condensate5 and aqueous humor6 following oral intake of a specified MTL dose. A possible reason for these wide variations in its concentrations is the polymorphism of the metabolizing enzyme, from which four phenotypes can be identified: ultrarapid (UM), extensive (EM), intermediate (IM), and poor (PM) metabolizers.7 The stereoselective metabolism of MTL generates distinct parent drug-to-metabolite ratios that correlate with CYP2D6 activity. These measurable pharmacokinetic differences provide a practical phenotypic biomarker for clinical CYP2D6 classification, offering advantages over genetic testing through immediate functional assessment at reduced cost and complexity.8
As a chiral molecule, MTL is prescribed as a racemic blend of its (R)- and (S)-enantiomeric forms. These stereoisomers demonstrate significant variations in their therapeutic effects (pharmacodynamics) and drug metabolism characteristics (pharmacokinetics), with (S)-MTL being more potent in β-adrenoceptor blockade.9,10 The (R)-enantiomer undergoes more rapid metabolism by CYP2D6 compared to its (S)-counterpart, leading to comparatively elevated plasma levels of (S)-MTL.11-13 The plasma S/R enantiomeric ratio consistently exceeds unity, demonstrating preferential accumulation of the pharmacologically active (S)-enantiomer over its (R)-counterpart.14 This ratio becomes more pronounced in UMs, resulting in a significantly higher value. However, in PMs, where the enzymatic activity of CYP2D6 is minimal or absent, the concentrations of both enantiomers are nearly equal, leading to a ratio close to one.
CYP2D6 preferentially metabolizes the (R)-enantiomer consequently, the (S)-enantiomer exhibits a greater area under the plasma concentration-time curve in UMs and EMs relative to PMs.14,15 The S/R plasma concentration ratio consistently maintains a value of 1 or greater, regardless of CYP2D6 metabolic phenotype. In PMs, this ratio is close to 1, while in UMs, it reaches its highest level, around 1.5.14 MTL binds enantioselectively to β-receptors in the heart with an S/R ratio of 33, whereas it blocks the β2-receptors in the ciliary process with an R/S ratio of 10.16 MTL is mainly eliminated by hepatic metabolism using: 1) α-hydroxylation (~10% of the dose), 2) N-dealkylation (~10% of the dose) and 3) O-demethylation and further oxidation (~65% of the dose). The first pathway, which produces an active metabolite, is stereoselective for (S)-MTL, whereas the second pathway is stereoselective for (R)-MTL. Renal clearance demonstrates minor stereoselectivity (ratio = 0.90) favoring (R)-MTL, likely mediated by active tubular secretion/reabsorption processes. However, this has a negligible impact on plasma stereoselectivity, given the minimal contribution of renal elimination to total clearance.16 MTL undergoes predominant metabolism via the CYP2D6 enzyme, which contributes significantly to the biotransformation of 15-25% of clinically prescribed medications.17 Activity of CYP2D6 is affected by pregnancy,18 liver diseases,19 gender of the patient,20 and nutritional habits.21 There is a possibility of the saturation of CYP2D6 during chronic exposure to the substrates.22 As noticed above, CYP2D6 activity exhibits significant genetic variability, and this variability influences MTL plasma concentrations, with rapid metabolism in UMs leading to lower plasma levels and slower metabolism in PMs causing drug accumulation.23,24 Sohn et al25 used the ratio of MTL and its metabolite, i.e., α–hydroxymetoprolol, in plasma samples of Korean and Japanese individuals 3 hours after taking a unit dose (100 mg) of tartrate salt of MTL for phenotyping of CYP2D6 isozyme.
Previous studies have predominantly focused on single-dose11-13,26,27 or short-term multi-dose administration in healthy individuals.28-31 These studies consistently report S/R plasma concentration ratios ≥ 1, with a similar trend observed in urinary excretion.32-35 However, enantioselective renal excretion, favoring the (R)-enantiomer, has been documented,13,26 particularly in PMs, where renal clearance compensates for reduced CYP2D6 activity, resulting in an S/R ratio < 1 in urine and ≥ 1 in plasma. In summary, the CYP2D6's enantioselective activity is expected to result in an S/R ratio ≥ 1 in both urine and plasma. However, due to enantioselective renal excretion, the ratio is anticipated to exceed 1 in plasma but fall below 1 in urine. Our previous study3 on MTL enantiomers in hypertensive patients receiving chronic MTL therapy, urinary analysis revealed enantioselective renal excretion and highlighted the possible effects of prolonged drug use on renal elimination patterns. However, data on the enantioselective disposition of MTL in the plasma of patients undergoing long-term therapy is remarkably sparse. This is a critical gap, as real-world patients often have comorbidities, polypharmacy, and potential enzyme saturation or adaptation that are not captured in single-dose studies of healthy volunteers. Our study aims to fill this gap by characterizing plasma enantiomer profiles in a cohort of hypertensive patients on chronic MTL therapy.
Our study investigates the plasma enantiomer profiles of MTL in hypertensive patients undergoing long-term therapy. Notably, we observed unexpected variability in the S/R ratios, with plasma ratios < 1 in 30% of patients. This discrepancy suggests additional factors, such as enantioselective renal excretion affected by drug-drug interactions, may influence enantiomeric distribution. For instance, metformin, a renal-excreted drug, may compete with MTL for transporters like human organic cation transporter 2 (hOCT2), potentially altering enantiomer excretion. This study highlights the need to further explore the interplay between metabolic and renal pathways in MTL's disposition. Understanding these mechanisms is essential to optimizing therapeutic outcomes, particularly in populations with altered CYP2D6 activity or concurrent medication use.
Patients and Methods
Reagents
MTL tartrate was procured from CTX Life Sciences (Surat, India). Carboxymethyl-β-cyclodextrin sodium salt (CM-β-CD), heptakis (2,3,6-tri-O-methyl)-β-CD and sulphated β-CD were acquired from Sigma-Aldrich (Darmstadt, Germany). Ethyl acetate, acetonitrile, ethanol and methanol were obtained from Scharlau (Barcelona, Spain). Citric acid monohydrate, boric acid and sodium hydroxide were sourced from Merck (Darmstadt, Germany). Ghazi Pharmaceutical Company (Tabriz, Iran) provided the deionized water used in this study.
Standard solutions and real plasma samples
A methanolic stock solution of MTL (1 mg mL-1, free base equivalent) was prepared, stored protected from light and stored at -20 °C. Working standard and quality control samples were subsequently generated by diluting the stock solution with analyte-free plasma. Hypertensive patients were enrolled if they had been on a stable, prescribed regimen of racemic MTL for a minimum of three months prior to sample collection. This duration was selected to ensure that steady-state pharmacokinetic conditions had been unequivocally achieved. 38 patients, comprising 29 females and 9 males, were enrolled. The participants had a mean ( ± standard deviation) age of 59.08 ± 9.31 years (range: 36–76 years), a mean weight of 74.67 ± 14.05 kg (range: 50–110 kg), and a mean height of 157.00 ± 11.13 cm (range: 140–189 cm) at the time of admission. The average daily MTL dosage administered was 82.7 ± 29.9 mg, with doses ranging from 47.5 to 190 mg. The research protocol received ethical approval from the Research Ethics Committee of Tabriz University of Medical Sciences (Ethics Code: IR.TBZMED.REC.1402.857). All participants provided written informed consent prior to study enrollment. Plasma samples were collected from patients at varying time intervals following the last MTL dose, spanning 4 to 20 hours. Blank plasma samples were generously provided by the Iranian Blood Transfusion Organization (Tabriz, Iran).
Sample preparation
Sample preparation involved liquid-liquid extraction with ethyl acetate. Validation samples were created by spiking blank plasma (100 µL in 1.5-mL microtubes) with known MTL concentrations prior to extraction under established optimal conditions. The pH was adjusted by adding 10 µL of 1 M sodium hydroxide, followed by brief vortexing (10 s). Following aliquot preparation, 200 µL of ethyl acetate was added to each sample, followed by vigorous vortex mixing for 60 seconds to ensure complete extraction. Phase separation was achieved by centrifugation at 5000 rpm for 5 minutes. Following phase separation, 150 µL of the organic (upper) phase was carefully aspirated, evaporated to dryness under vacuum at room temperature, and reconstituted in 100 µL of deionized water. Finally, the obtained sample was centrifuged at 5000 rpm for 5 minutes to precipitate any suspended particles. The recovery of MTL enantiomers from plasma was evaluated by comparing the peak areas obtained after extraction with those obtained by direct injection of standard solutions, yielding a recovery rate of 78%. Without the last centrifugation step, spikes in the electropherograms were found. Sample analysis was performed using capillary electrophoresis (CE) under optimized separation conditions.
CE determination
CE separations were conducted using an Agilent 1100 CE system (Agilent Technologies, Waldbronn, Germany) equipped with a diode array detection system. Electropherogram processing and peak integration were conducted with Agilent's ChemStation software (Agilent Technologies, Waldbronn, Germany). To achieve symmetrical peak shapes, optimal resolution and the highest sensitivity, various factors were meticulously examined, including the concentration, type and pH of the background electrolyte (BGE), the addition of organic solvents, separation voltage, column temperature and injection type and duration. Separations were performed using a bare fused-silica capillary (Agilent Technologies, Germany) with the following dimensions: 50 μm internal diameter, 63.5 cm total length, and 55 cm effective length to the detector. The BGE was composed of 50 mM phosphate buffer with a pH of 2.5, mixed with methanol in an 80:20 (v/v) ratio, and contained 0.8% w/v CM-β-CD as the chiral selector. Electrophoretic separations were conducted at + 25 kV applied voltage with precise capillary temperature control maintained at 25 °C. A water plug was injected hydrodynamically for 3 seconds at 50 mbar, followed by the electrokinetic sample injection at + 10 kV for 60 seconds. On-line detection was performed at an optimal wavelength of 225 nm. Between runs, the capillary was washed sequentially with 0.1 M sodium hydroxide, deionized water, and the BGE, each for 4 minutes, to ensure reproducibility and prevent carryover.
Results and Discussion
CE optimization
The final conditions were determined by systematic optimization process, which involved the sequential investigation of critical parameters. This process included screening the type, concentration (25-100 mM), and pH (2.5-3.5) of the BGE, leading to the selection of a 50 mM phosphate buffer at pH 2.5 for optimal peak shape. We then evaluated the type (acetonitrile, ethanol, and methanol) and percentage (10-40% v/v) of organic modifier, finding that 20% (v/v) methanol provided the best compromise between resolution and analysis time. The type and concentration of the chiral selector were paramount, with a thorough evaluation of heptakis (2,3,6-tri-O-methyl)-β-CD, sulphated β-CD, and CM-β-CD revealing that only in the presence of CM-β-CD the MTL enantiomers were resolved. Concentrations of 0.2%, 0.4%, and 0.8% were investigated, and the results demonstrated that sufficient resolution and optimal analysis time were achievable at 0.8% (w/v) CM-β-CD (Fig. 1). Furthermore, to overcome sensitivity limitations, we compared injection techniques and optimized the injection time (5-80 seconds), ultimately implementing field-amplified sample injection with a 60-second electrokinetic injection at + 10 kV for significant signal enhancement. Finally, the separation voltage was optimized across a range of 10-30 kV, with + 25 kV providing the ideal balance of speed, resolution, and minimal Joule heating, resulting in the robust and sensitive method validated herein.
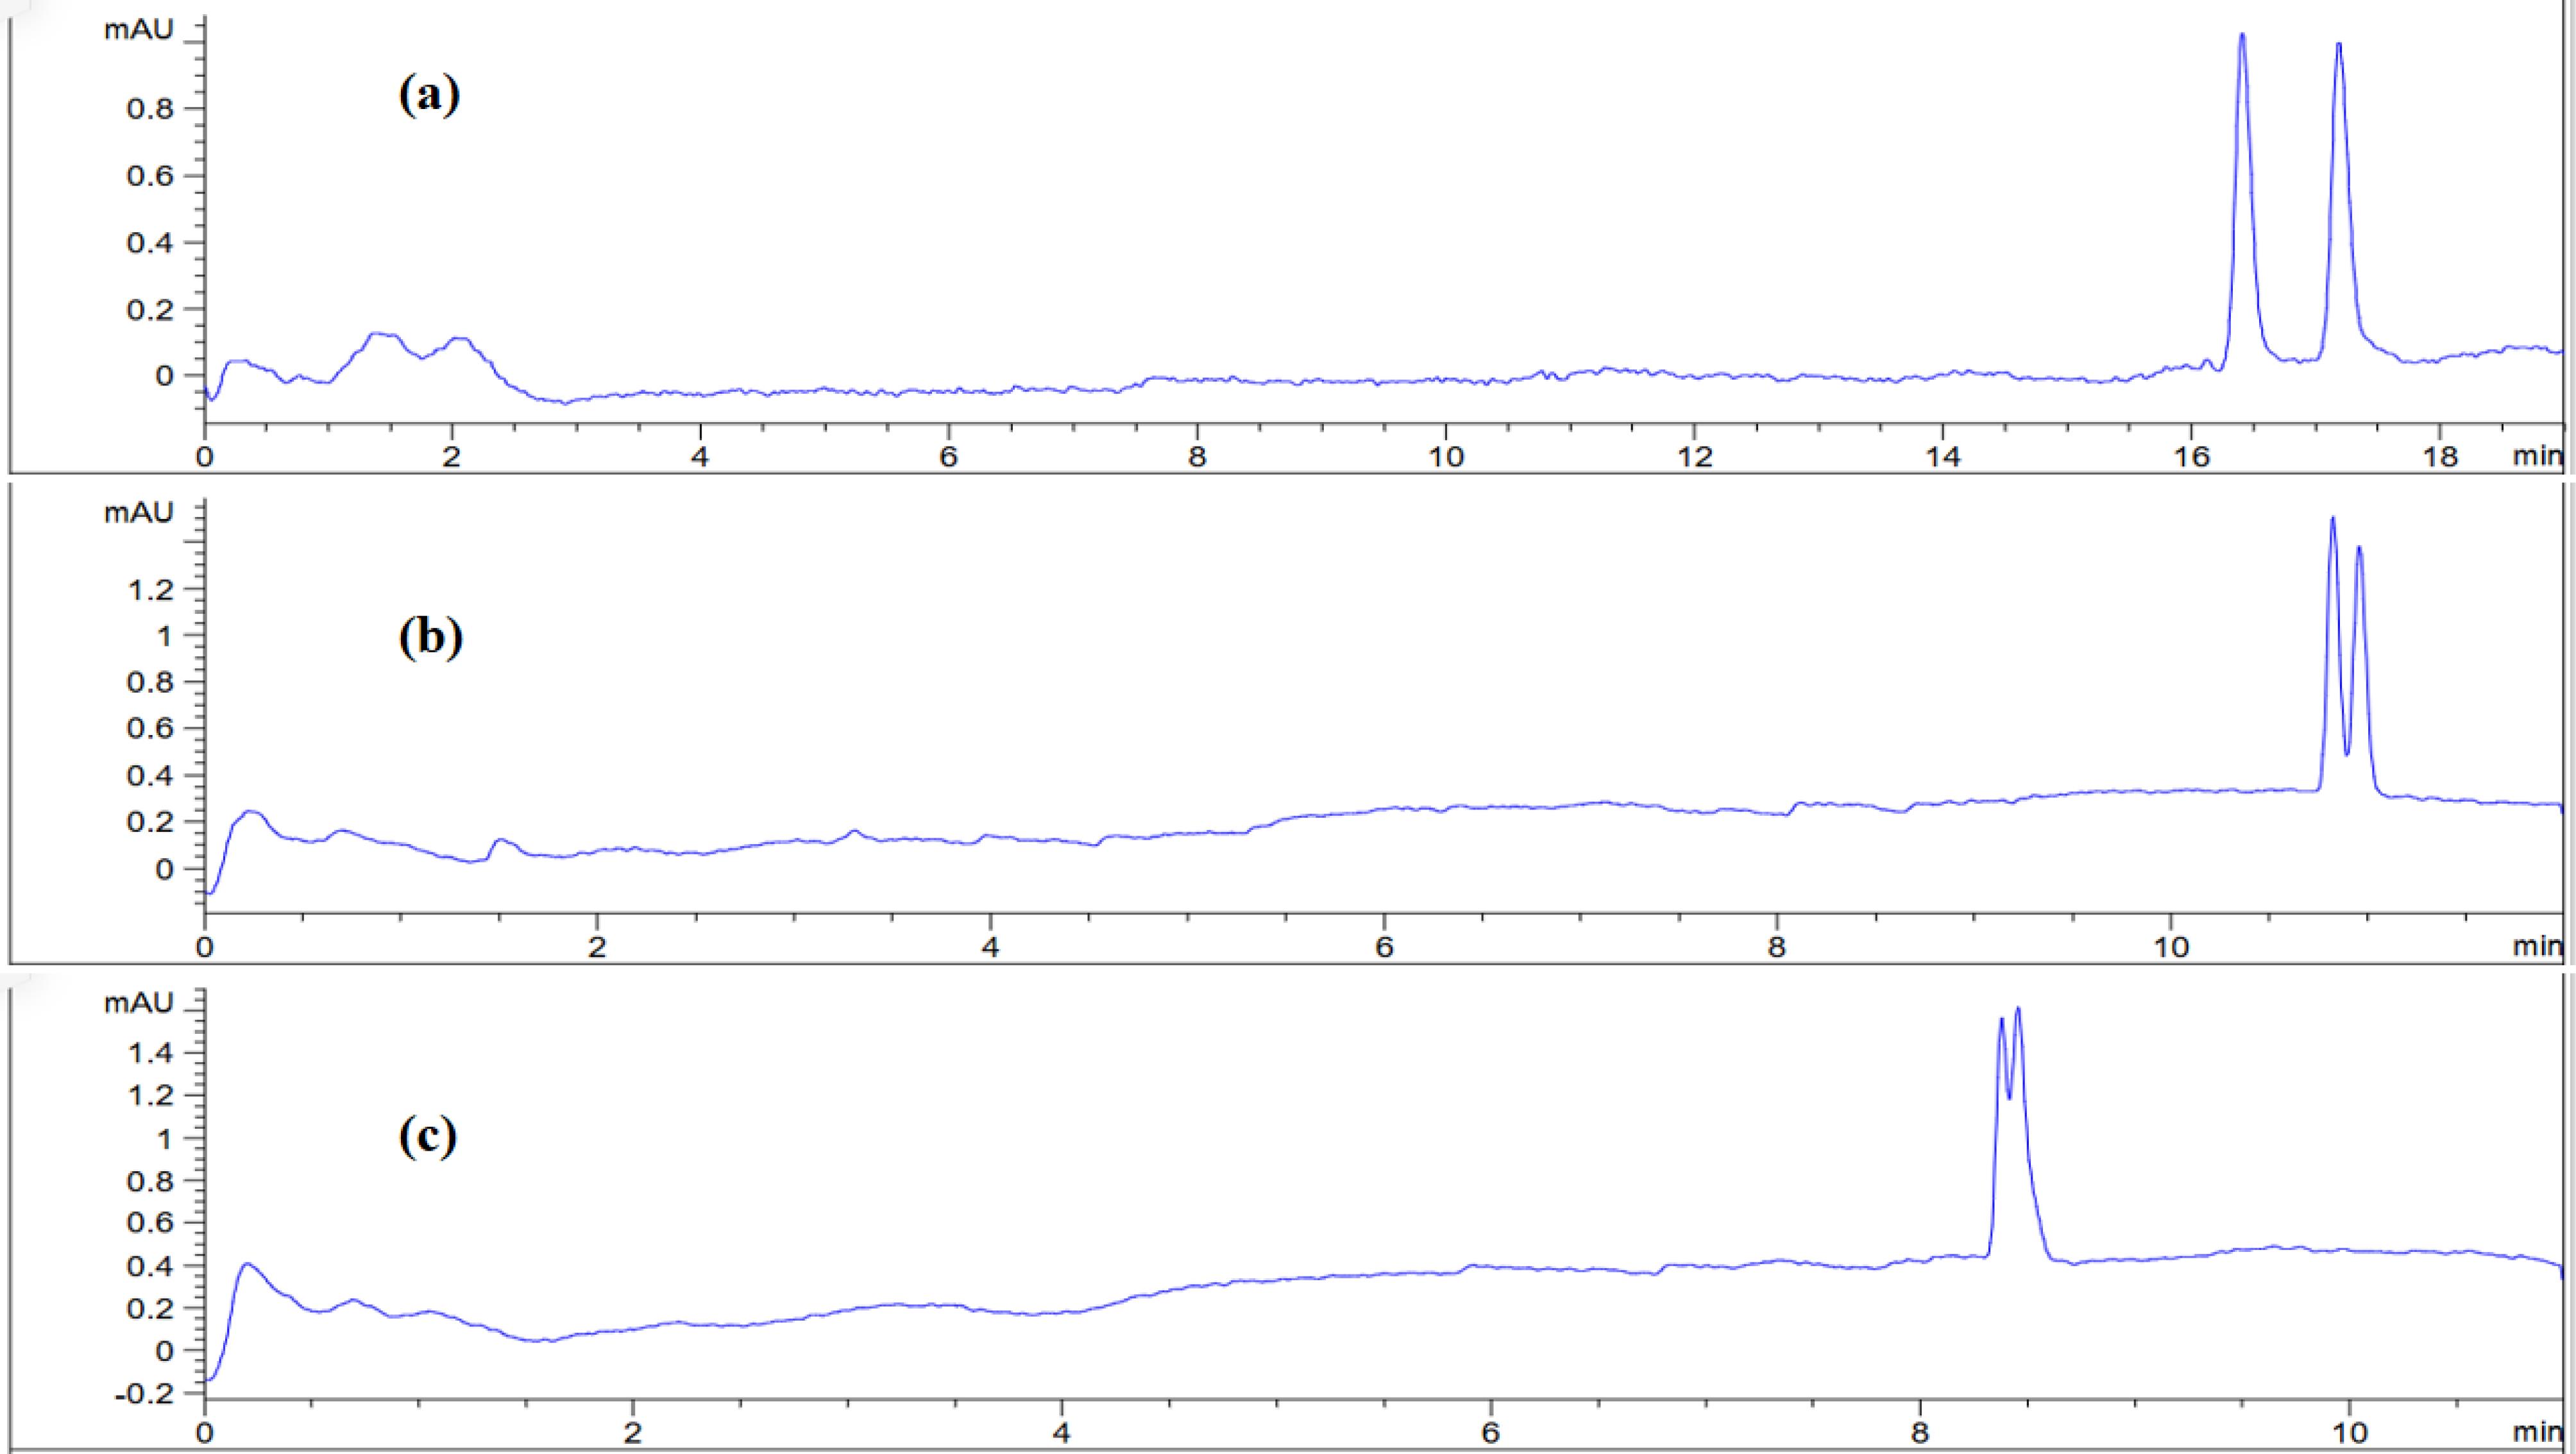
Fig. 1.
Effect of CM-β-CD concentration on the enantiomeric separation of MTL enantiomers. Electropherograms demonstrating resolution at concentrations of (a) 0.8%, (b) 0.4%, and (c) 0.2% (w/v) CM-β-CD. CE conditions: 50 mM phosphate buffer (pH 2.5) with 20% methanol, using field-amplified sample injection ( + 10 kV, 60 s) and a separation voltage of + 20 kV, detection at 225 nm, capillary temperature of 25°C and 55 cm effective capillary length to the detector.
.
Effect of CM-β-CD concentration on the enantiomeric separation of MTL enantiomers. Electropherograms demonstrating resolution at concentrations of (a) 0.8%, (b) 0.4%, and (c) 0.2% (w/v) CM-β-CD. CE conditions: 50 mM phosphate buffer (pH 2.5) with 20% methanol, using field-amplified sample injection ( + 10 kV, 60 s) and a separation voltage of + 20 kV, detection at 225 nm, capillary temperature of 25°C and 55 cm effective capillary length to the detector.
Method validation
The optimized liquid-phase extraction and CE separation protocol was subjected to comprehensive validation according to FDA guidelines. The validation study systematically evaluated all critical method performance characteristics, including detection sensitivity, quantitative range, accuracy, precision, specificity, selectivity and stability. Calibration standards were prepared by spiking blank human plasma with racemic MTL stock solution to create a five-point concentration series spanning 0.02-0.40 µg mL-1 of racemic drug (0.01-0.20 µg mL-1 per enantiomer). These calibration samples underwent identical processing to actual test specimens as described in the sample preparation protocol (see Sample preparation section). Linear regression analysis of peak area versus concentration demonstrated excellent linear response across the 0.01-0.20 µg mL-1 range for both enantiomers, with determination coefficients (r2) of 0.9993 and 0.9991 for the (S)- and (R)- enantiomers, respectively. Method sensitivity was established through signal-to-noise ratio determinations, yielding detection limits (LOD) of 0.003 µg mL-1 and quantification limits (LOQ) of 0.01 µg mL-1 for both isomers. Precision and accuracy assessments conducted over three consecutive days at LOQ, medium (0.05 µg mL-1), and high (0.1 µg mL-1) concentration levels showed acceptable performance, with all intra-day and inter-day coefficient of variation values below 14.9% and relative errors not exceeding 12.3%. Selectivity was confirmed by analyzing processed blank plasma samples, which showed no endogenous interference at the expected migration times of the target analytes (Fig. 2). Fig. 2a demonstrates the baseline resolution of MTL enantiomers in an aqueous standard solution, confirming the efficacy of the selected BGE and chiral selector. Fig. 2b, representing blank plasma, shows no endogenous interference at the migration times corresponding to the target analytes, thereby establishing method selectivity. Fig. 2c, obtained from blank plasma spiked with MTL, confirms the absence of significant matrix effects. Finally, Fig. 2d depicts a representative clinical plasma sample from a hypertensive patient under long-term MTL therapy. Notably, additional peaks marked with question marks (? and ??) were observed in the patient sample. These unidentified peaks may be attributed to enantiomers of MTL metabolites, such as α-hydroxymetoprolol or O-demethylmetoprolol, as previously reported in the literature using similar analytical conditions.32 It is important to emphasize that the MTL acidic metabolite is not extractable under the employed liquid-liquid extraction protocol with ethyl acetate, thus excluding its contribution to the observed chromatographic profile.32 The consistent migration times and resolution across all sample types underscore the robustness and applicability of the developed method for clinical monitoring of metoprolol enantiomers. Specificity was further verified by testing six commonly co-administered cardiovascular drugs (diltiazem, atenolol, propranolol, verapamil, carvedilol and esmolol), none of which exhibited migration time overlap with the MTL enantiomers. Stability studies under typical handling conditions demonstrated that MTL enantiomers remained stable in plasma for at least six hours at ambient temperature (relative error < 8.0%) and through three complete freeze-thaw cycles (relative error ≤ 12.0%). These comprehensive validation results confirm the method's suitability for reliable quantification of MTL enantiomers in clinical plasma samples.
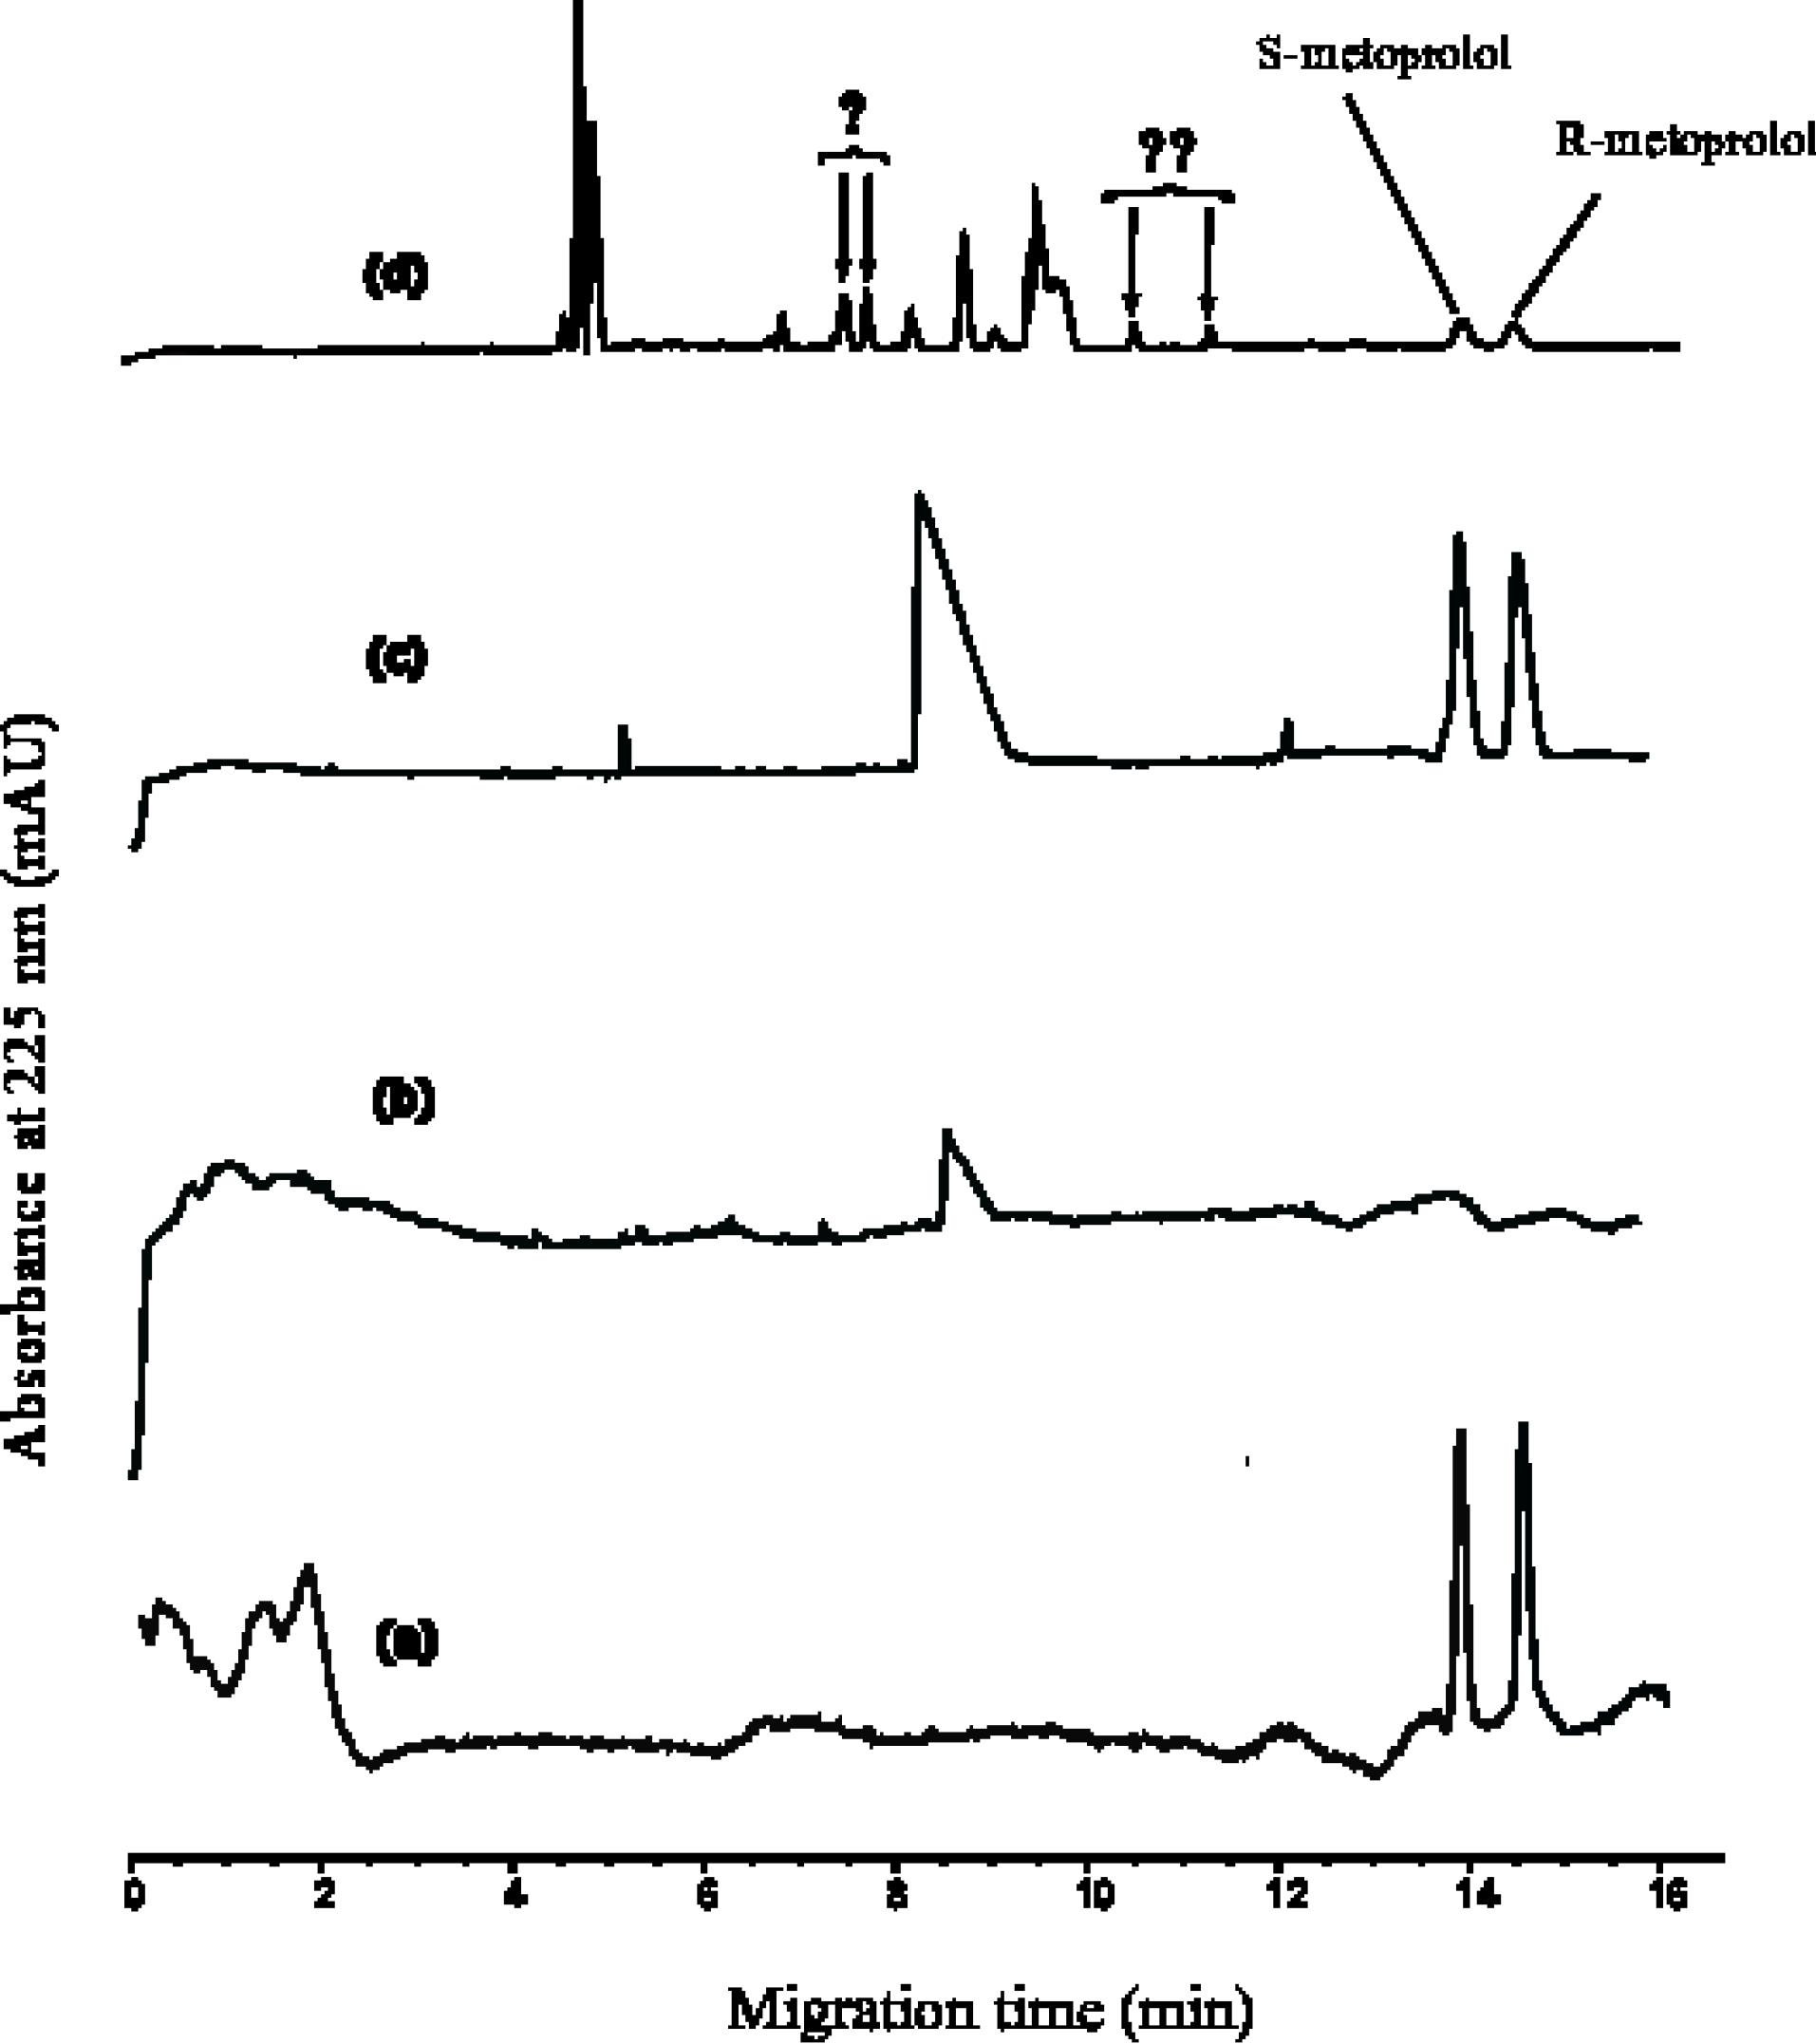
Fig. 2.
Chiral separation of MTL enantiomers under optimized conditions. Representative electropherograms showing: (a) standard enantiomers in water, (b) blank plasma, (c) blank plasma spiked with MTL enantiomers, and (d) a real patient plasma sample. Optimum separation conditions: 50 mM phosphate buffer (pH 2.5) containing 20% methanol and 0.8% (w/v) CM-β-CD, + 25 kV separation voltage, 225 nm detection, 25 °C capillary temperature, and 55 cm effective capillary length to the detector. It should be noted that the scales of the electropherograms are not identical.
.
Chiral separation of MTL enantiomers under optimized conditions. Representative electropherograms showing: (a) standard enantiomers in water, (b) blank plasma, (c) blank plasma spiked with MTL enantiomers, and (d) a real patient plasma sample. Optimum separation conditions: 50 mM phosphate buffer (pH 2.5) containing 20% methanol and 0.8% (w/v) CM-β-CD, + 25 kV separation voltage, 225 nm detection, 25 °C capillary temperature, and 55 cm effective capillary length to the detector. It should be noted that the scales of the electropherograms are not identical.
Clinical results
We analyzed plasma concentrations of MTL enantiomers in 38 patients receiving chronic racemic MTL therapy (either tartrate or succinate formulations) under real-world clinical conditions. The study specifically focused on quantifying enantiomeric ratios without applying restrictive inclusion criteria. Blood samples were obtained from each participant within a 24-hour window following drug administration, with complete demographic and clinical characteristics detailed in Table 1. This approach allowed for evaluation of steady-state enantiomer distribution patterns in routine clinical practice.
Table 1.
Patient characteristics
|
Patient code
|
Gender
|
Age
|
Main drug
|
Dose (mg)
|
Last used (hr)
|
Co-administrated drugs
|
| 1 |
F |
48 |
MTLT |
50 (1 per day) |
19 |
Metformin 1000 |
| 2 |
F |
63 |
MTLT |
50 (2 per day) |
6 |
Metformin 1000 - Gliclazide 80 - Losartan 50 - Atorvastatin 40 -Hydrochlorothiazide 12.5 - Empagliflozin 10 - Linagliptin 5 - ASA 80 |
| 3 |
M |
64 |
MTLT |
50 (2 per day) |
8 |
Atorvastatin 40 - Metformin 500 - Pioglitazone 45 - Gliclazide 60 - Losartan 50 - ASA 80 - Hydrochlorothiazide 12.5 |
| 4 |
F |
58 |
MTLS |
95 (1 per day) |
8 |
Amlodipine 5 - Metformin 500 - ASA 80 - Pioglitazone 45 - Spironolactone 25 - Losartan 50 -Atorvastatin 20 - Hydrochlorothiazide 12.5 |
| 5 |
F |
74 |
MTLS |
95 (1 per day) |
19 |
Gliclazide 60 - Insulin Glargine 20 – FeFol - Metformin 1000 - Lorazepam 1 - Empagliflozin 10 - Linagliptin 5 -ASA 80 - Losartan 50 - Hydrochlorothiazide 12.5 - Fluoxetine 20 - |
| 6 |
F |
60 |
MTLT |
50 (2 per day) |
7 |
Atorvastatin 20 - Metformin 500 - Fluoxetine 20 - Gliclazide 30 - Linagliptin 5 - Empagliflozin 10 |
| 7 |
F |
62 |
MTLS |
47.5 (1 per day) |
20 |
Levothyroxine 50 - Metformin 500 - Atorvastatin 20 - Hydrochlorothiazide 12.5 - Losartan 50 |
| 9 |
F |
64 |
MTLS |
47.5 (1 per day) |
8.5 |
Insulin Glargine - Hydrochlorothiazide 12.5 - Insulin Aspart - Metformin 1000 - Empagliflozin 10 - Linagliptin 5 - Atorvastatin 20 - Losartan 50 |
| 10 |
M |
71 |
MTLT |
50 (2 per day) |
9 |
Metformin 500 – Prostatan - Levothyroxine 50 - Atorvastatin 20 - Finasteride 5 -ASA 80 - Tamsulosin 0.4 |
| 11 |
F |
62 |
MTLT |
50 (2 per day) |
6.5 |
Metformin 1000 -Atorvastatin 20 - Sitagliptin 50 |
| 12 |
F |
36 |
MTLS |
47.5 (1 per day) |
19 |
Metformin 1000 - Sitagliptin 50 |
| 13 |
F |
54 |
MTLT |
50 (2 per day) |
7 |
Metformin 500 - - Atorvastatin 10 - Gliclazide 30 - ASA 80 - Losartan 50 - Amlodipine 5 - Hydrochlorothiazide 12.5 |
| 14 |
F |
76 |
MTLS |
95 (1 per day) |
6.5 |
Metformin 500 - ASA 80 - Sitagliptin 50 - Amlodipine 5 - Losartan 50 - Hydrochlorothiazide 12.5 - Rosuvastatin 5 - |
| 15 |
F |
40 |
MTLT |
50 (2 per day) |
5 |
Losartan 50 – Calcium - Hydrochlorothiazide 12.5 - Levothyroxine 50 - Amlodipine 5 |
| 16 |
F |
44 |
MTLT |
50 (2 per day) |
7 |
Metformin 500 - Amlodipine 5 - Losartan 50 - Atorvastatin 10 - Hydrochlorothiazide 12.5 |
| 17 |
M |
49 |
MTLS |
47.5 (1 per day) |
10.5 |
Insulin Aspart - Insulin Glargine - Rosuvastatin 10 |
| 18 |
F |
54 |
MTLT |
25 (2 per day) |
19 |
Insulin Glargine - Metformin 1000 - Insulin Aspart - Atorvastatin 20 - Empagliflozin 5 - Amlodipine 5 - Valsartan 160 - |
| 19 |
F |
52 |
MTLS |
95 (1 per day) |
8.5 |
Insulin Isophane Biphasic 70/30 - Amlodipine 5 - Metformin 500 -Furosemide 40 - Losartan 50 - Atorvastatin 20 - Hydrochlorothiazide 12.5 - Citalopram 20 |
| 20 |
F |
42 |
MTLS |
95 (1 per day) |
7.5 |
Metformin 1000 - Hydrochlorothiazide 12.5 - Empagliflozin 10 -ASA 80 - Losartan 50 - Linagliptin 5 - Atorvastatin 20 |
| 21 |
M |
63 |
MTLT |
50 (2 per day) |
10.5 |
Metformin 1000 - Hydrochlorothiazide 12.5 - Gliclazide 60 -Losartan 50 - Empagliflozin 10 - Linagliptin 5 - Atorvastatin 20 |
| 23 |
F |
58 |
MTLT |
50 (2 per day) |
7 |
Insulin - Rosuvastatin 20 - Metformin 500 - - ASA 80 - Sitagliptin 50 - Levothyroxine 0.1 |
| 24 |
F |
65 |
MTLT |
25 (2 per day) |
8 |
Metformin 500 - Losartan 25 - Acarbose 50 - Amlodipine 5 - ASA 80 - Rosuvastatin 40 |
| 25 |
M |
52 |
MTLS |
95 (1 per day) |
9 |
Insulin Glargine 30 - Empagliflozin 10 - Metformin 1000 - Hydrochlorothiazide 12.5 - Linagliptin 5 - Losartan 50 - Amlodipine 5 |
| 26 |
F |
55 |
MTLT |
50 (2 per day) |
9 |
Metformin 500 - Gliclazide 30 - Sitagliptin 50 - Losartan 50 - Atorvastatin 10 - Hydrochlorothiazide 12.5 – Exemestane - Amlodipine 5 |
| 27 |
F |
60 |
MTLT |
12.5 (2 per day) |
5.5 |
Metformin 500 - ASA 80 - Linagliptin 5 - Levothyroxine 50 - Losartan 25 - Atorvastatin 20 |
| 28 |
F |
59 |
MTLS |
95 (2 per day) |
8 |
Metformin 500 - Escitalopram 10 - Empagliflozin 10 - Hydrochlorothiazide 12.5 - Linagliptin 5 - Losartan 50 - Atorvastatin 20 - Amlodipine 5 |
| 29 |
F |
63 |
MTLS |
47.5 (1 per day) |
20 |
Clonazepam - Metformin 500 - Linagliptin 5 - Empagliflozin 10 - Levothyroxine 50 - Carbamazepine 200 - ASA 80 - Sertraline 50 |
| 30 |
F |
76 |
MTLT |
50 (1 per day) |
7 |
Insulin Aspart - Hydrochlorothiazide 12.5 - Losartan 50 - ASA 80 |
| 31 |
M |
51 |
MTLS |
47.5 (2 per day) |
7.5 |
Insulin - - Amlodipine 5 - Metformin 1000 - Hydrochlorothiazide 12.5 - Losartan 50 |
| 32 |
M |
69 |
MTLS |
47.5 (1 per day) |
8 |
ASA 80 - Metformin 500 - Losartan 50 - Gliclazide 30 - Hydrochlorothiazide 12.5 – Clonazepam - Rosuvastatin 10 |
| 33 |
F |
64 |
MTLT |
50 (2 per day) |
6 |
Metformin 500 - Empagliflozin 10 - Gliclazide 30 - Linagliptin 5 - Phenazopyridine -- Atorvastatin 20 - Gabapentin 300 |
| 35 |
F |
68 |
MTLT |
50 (1 per day) |
4 |
Metformin 1000 – Acarbose - Glibenclamide - Losartan 50 - Atorvastatin 20 - Hydrochlorothiazide 12.5 - ASA 80 |
| 36 |
F |
62 |
MTLS |
47.5 (1 per day) |
5.5 |
Metformin 500 - Linagliptin 5 - Empagliflozin 10 - Losartan 50 - Atorvastatin 10 - Hydrochlorothiazide 12.5 - ASA 80 |
| 37 |
M |
62 |
MTLT |
50 (2 per day) |
9 |
Insulin - Linagliptin 5 - Empagliflozin 10 - Valsartan - Atorvastatin 20 - Amlodipine 5 – Nephrovit - ASA 80 - |
| 38 |
F |
66 |
MTLT |
50 (2 per day) |
8.5 |
Metformin 500 - Gliclazide 30 - Sitagliptin 50 - Losartan 50 - Atorvastatin 20 - Hydrochlorothiazide 12.5 - ASA 80 |
| 39 |
F |
59 |
MTLT |
50 (2 per day) |
10 |
Metformin 1000 - Linagliptin 5 - Empagliflozin 10 - Pioglitazone 15 - Hydrochlorothiazide 12.5 - Losartan 50 - Amlodipine 5 - ASA 80 - Ropixon 20 |
| 40 |
M |
52 |
MTLS |
47.5 (1 per day) |
9 |
Metformin 1000 - Linagliptin 5 - Empagliflozin 10 - Losartan 50 - Amlodipine 5 - Hydrochlorothiazide 12.5 - ASA 80 - Atorvastatin 20 |
| 41 |
F |
69 |
MTLS |
95 (1 per day) |
7 |
Metformin 500 - Gliclazide 60 - Sitagliptin 50 - Valsartan - Amlodipine 5 - Hydrochlorothiazide 25 |
MTLT: MTL tartrate; MTLS: MTL succinate.
Quantifiable concentrations of MTL enantiomers in plasma were obtained for 18 of the 38 enrolled patients, yielding a detection rate of 47%. Among these 18 patients, the enantiomeric ratio (S/R) demonstrated significant inter-individual variability. The majority of patients (12 out of 18, 67%) exhibited the expected S/R ratio greater than 1, with a mean ratio of 1.18 ± 0.13. However, a substantial subset (6 out of 18, 33%) showed an inverted pattern with S/R ratio of less than 1, and a mean ratio of 0.86 ± 0.06. The overall mean S/R ratio for all patients with quantifiable data was 1.07 ± 0.19. The total MTL concentrations in these samples ranged from 15.5 to 188.9 μg mL-1, reflecting the wide inter-patient variability in drug exposure. The complete dataset, including individual concentrations and corresponding urine data, is presented in Table 2. Pure enantiomeric standards were not available for direct confirmation, the elution order was assigned as peak 1 = (S)-MTL and peak 2 = (R)-MTL based on consistent reports in the literature using identical chiral CE systems with CM-β-CD.32,36 This assignment forms the basis for all subsequent S/R ratio calculations and interpretations. The plasma concentration ratios of enantiomers (S/R) were calculated across all 18 patients (Table 2). The observed ratios significantly deviated from unity in the majority of cases, demonstrating stereoselective metabolism of MTL enantiomers. The relatively small number of patients with quantifiable plasma concentrations limits the statistical power and generalizability of our findings; however, the clear observation of an atypical enantiomeric ratio in a substantial minority of this real-world cohort warrants further investigation. This differential metabolic clearance arises primarily through CYP2D6-mediated biotransformation, which accounts for 70-80% of MTL's total metabolism. The consistent directional bias in enantiomer ratios reflects CYP2D6's preferential metabolism of the R-enantiomer, resulting in disproportionate plasma accumulation of the S-form.37,38
Table 2.
Concentration of MTL enantiomers in urine
3 and plasma of hypertensive patients and their ratios
|
Patient code
|
Con. (µg L-1)a |
Con. (µg L-1) |
Ratio S/R
|
Con. (µg L-1) |
Con. (µg L-1) |
Ratio S/R
|
|
(S)-enantiomer
|
(R)-enantiomer
|
Total
|
(S)-enantiomer
|
(R)-enantiomer
|
Total
|
|
Plasma |
Urine
3
|
| 1 |
NDb |
ND |
- |
- |
ND |
ND |
- |
- |
| 2 |
ND |
ND |
- |
- |
138 |
188 |
326 |
0.73 |
| 3 |
ND |
ND |
- |
- |
2533 |
2796 |
5329 |
0.91 |
| 4 |
14.2 |
12.2 |
26.4 |
1.17 |
4761 |
4549 |
9310 |
1.05 |
| 5 |
38.5 |
33.4 |
72.0 |
1.15 |
533 |
645 |
1178 |
0.83 |
| 6 |
14.7 |
15.6 |
30.3 |
0.94 |
NSc |
NS |
- |
- |
| 7 |
ND |
ND |
- |
- |
147 |
147 |
294 |
1.00 |
| 9 |
ND |
ND |
- |
- |
< LOQd |
< LOQ |
- |
- |
| 10 |
17.8 |
20.8 |
38.6 |
0.86 |
3589 |
3031 |
6620 |
1.18 |
| 11 |
54.6 |
65.8 |
120.4 |
0.83 |
13331 |
11416 |
24747 |
1.17 |
| 12 |
ND |
ND |
- |
- |
1540 |
1853 |
3393 |
0.83 |
| 13 |
26.1 |
18.2 |
44.3 |
1.43 |
718 |
946 |
1664 |
0.76 |
| 14 |
29.7 |
27.3 |
57.0 |
1.09 |
1054 |
952 |
2006 |
1.11 |
| 15 |
ND |
ND |
- |
- |
170 |
135 |
305 |
1.26 |
| 16 |
45.3 |
58.0 |
103.3 |
0.78 |
4923 |
3990 |
8913 |
1.23 |
| 17 |
ND |
ND |
- |
- |
1506 |
2365 |
3871 |
0.64 |
| 18 |
ND |
ND |
- |
- |
352 |
298 |
650 |
1.18 |
| 19 |
< LOQ |
< LOQ |
- |
- |
NS |
NS |
- |
- |
| 20 |
10.7 |
8.7e |
19.5 |
1.23 |
709 |
918 |
1627 |
0.77 |
| 21 |
ND |
ND |
- |
- |
1046 |
1421 |
2467 |
0.74 |
| 23 |
15.8 |
15.8 |
31.6 |
1.00 |
651 |
597 |
1248 |
1.09 |
| 24 |
ND |
ND |
- |
- |
69 |
77 |
146 |
0.91 |
| 25 |
19.6 |
15.6 |
35.2 |
1.26 |
95 |
121 |
216 |
0.79 |
| 26 |
12.2 |
11.1 |
23.2 |
1.10 |
3941 |
3916 |
7857 |
1.01 |
| 27 |
< LOQ |
< LOQ |
- |
- |
820 |
975 |
1795 |
0.84 |
| 28 |
58.4 |
53.9 |
112.4 |
1.08 |
10940 |
10149 |
21089 |
1.08 |
| 29 |
ND |
ND |
- |
- |
146 |
183 |
329 |
0.80 |
| 30 |
ND |
ND |
- |
- |
NS |
NS |
- |
- |
| 31 |
< LOQ |
< LOQ |
- |
- |
3078 |
3481 |
6558 |
0.88 |
| 32 |
ND |
ND |
- |
- |
102 |
96 |
198 |
1.07 |
| 33 |
ND |
ND |
- |
- |
172 |
234 |
406 |
0.74 |
| 35 |
< LOQ |
< LOQ |
- |
- |
239 |
163 |
402 |
1.47 |
| 36 |
20.3 |
17.2 |
37.6 |
1.18 |
531 |
687 |
1218 |
0.77 |
| 37 |
22.9 |
16.8 |
39.6 |
1.36 |
841 |
1201 |
2041 |
0.70 |
| 38 |
8.0e |
7.5e |
15.5 |
1.06 |
NS |
NS |
- |
- |
| 39 |
91.8 |
97.1 |
188.9 |
0.94 |
NS |
NS |
- |
- |
| 40 |
ND |
ND |
- |
- |
126 |
133 |
260 |
0.95 |
| 41 |
60.6 |
73.9 |
134.5 |
0.82 |
NS |
NS |
- |
- |
aPlease note that to avoid writing small decimal numbers, concentrations have been converted from µg mL-1 to µg L-1
bNot detected.
cNo sample.
dDetected but the concentration is below LOQ.
eAlthough the concentration of the enantiomer(s) (one or both) is slightly below the LOQ, we have included them in the table with leniency.
Note: Patients with codes 8, 22, and 34 were excluded from the study due to insufficient plasma sample volume and were not included in the table.
Regarding the enantiomeric analysis of MTL, it has been observed that CYP2D6 preferentially metabolizes the (R)-enantiomer, causing it to be metabolized faster than the (S)-enantiomer and resulting in a lower plasma concentration of the (R)-enantiomer compared to the (S)-enantiomer.13,15,26,39-41 This phenomenon is observed across all four phenotypes. Still, the difference in the concentrations of the enantiomers decreases progressively from UM to PM, likely due to a reduction in the disparity of metabolic rates among different phenotypes. However, a single-dose study in PMs has documented instances where (R)-MTL plasma concentrations surpass those of the (S)-enantiomer.13
These findings confirm the enantioselective metabolism of MTL by CYP2D6. Based on these studies, the S/R ratio of enantiomers in all phenotypes is expected to always be ≥ 1, which has been supported by most studies.13,15,26,39-41 However, the majority of these studies were conducted as single-dose experiments on healthy individuals11-14,27 or as short-term multi-dose studies (up to one week) on patients26 or healthy individuals,28 all confirming the same results.
However, in our study on plasma samples from hypertensive patients undergoing long-term MTL therapy, we observed that the S/R ratio was less than one in about 30% of the patients (Table 2), contrary to most previous studies except one.34 As previously mentioned, if metabolism were the sole factor influencing enantioselectivity, this ratio should eventually approach 1 in PMs. Renal excretion has also been observed to be enantioselective, preferentially eliminating the (R)-enantiomer in greater amounts. Consequently, this would lead to an accumulation of the (S)-enantiomer in plasma, resulting in an expected S/R ratio greater than 1. In other words, both enantioselective metabolism and enantioselective renal excretion promote the accumulation of the (S)-enantiomer in plasma, resulting in S/R ratios greater than 1 in both plasma and urine. However, our findings reveal that this ratio (S/R) is less than 1 in 30% of the studied subjects, a result inconsistent with previous studies.
As shown in Table 2, in subjects with a plasma S/R ratio less than 1, the corresponding urine S/R ratio is greater than 1 (e.g., patients 10, 11, and 16). This observation suggests that renal excretion plays a dominant role in these cases, particularly when metabolic elimination of enantiomers is minimal, an expectation typically associated with PM. The only plausible explanation for these findings is that, contrary to previous studies and our urine sample data,3 renal excretion of the (S)-enantiomer exceeds that of the (R)-enantiomer. Such a reversal could occur due to drug interactions, as seen with pindolol enantiomers in the presence of cimetidine.42 Table 2 highlights that atorvastatin and metformin are common among the patients in question. While atorvastatin is primarily metabolized in the liver via the CYP3A4 enzyme and minimally excreted by the kidneys, it is unlikely to interfere with MTL's metabolism or renal excretion.43 On the other hand, metformin, which is not metabolized and is excreted predominantly through the kidneys,44 is more likely to interact with MTL. This is especially significant when MTL plasma concentrations are high, making renal excretion the primary elimination pathway. Metformin undergoes renal elimination through glomerular filtration and tubular secretion, facilitated by the hOCT2.45 hOCT2, the predominant cationic drug transporter in renal proximal tubule basolateral membranes, which mediates the critical first step in systemic elimination of positively charged molecules through active tubular uptake. Research shows that MTL and metformin compete for excretion via these transporters, with MTL inhibiting metformin uptake.46-48 While studies have demonstrated the inhibitory effect of MTL on metformin excretion, the reverse metformin's inhibitory effect on MTL excretion remains unstudied.
A renal clearance of 109 mL/min has been reported for unchanged MTL.49 Since this clearance is lower than the creatinine clearance, it suggests that MTL excretion is primarily determined by glomerular filtration. However, the potential contributions of tubular secretion and reabsorption, which appear to occur with roughly equal efficiency, cannot be ruled out.49 Given that the renal excretion of MTL enantiomers is considered enantioselective, explaining the unequal ratios of enantiomers in urine, then tubular absorption and excretion are likely the primary mechanisms involved. However, to the best of our knowledge, no prior evidence has investigated this phenomenon for MTL. On the other hand, drug interactions can influence the excretion of enantiomers when this process is enantioselective. Hsyu and Giacomini50 and Somogyi et al42 demonstrated that the enantiomers of pindolol exhibit different renal excretion rates. Moreover, when co-administered with cimetidine, their excretion significantly decreases, with a reduction of 26% for the (S)-enantiomer and 34% for the (R)-enantiomer. The authors concluded that cimetidine exerts a stereoselective inhibitory effect on the renal tubular secretion of pindolol, likely through a mechanism indicating the presence of subsystems within the renal organic cation transporter in the kidney.42 MTL, being positively charged at physiological pH, is known to be a substrate for the hOCT2 transporter. This strongly suggests that its renal excretion may be influenced by the presence of metformin. However, the specific impact on MTL's enantiomers remains unclear. Based on existing evidence, it is anticipated that in the presence of metformin, the renal excretion of the (S)-enantiomer will exceed that of the (R)-enantiomer. This would result in a relative decrease in the plasma concentration of the (S)-enantiomer compared to the (R)-enantiomer.
Despite the very small number of the cases, statistical tests were performed to investigate the potential association between metformin co-administration and an inverted plasma S/R enantiomer ratio ( < 1). From the 38 enrolled patients, the 18 with quantifiable plasma concentrations of MTL enantiomers were included in this analysis. Patients were categorized into two groups based on their plasma S/R ratio: "normal ratio" (S/R ≥ 1) and "inverted ratio" (S/R < 1) (Table 3). The prevalence of metformin co-administration was then compared between these two groups using a two-tailed Fisher's exact test, which is the appropriate statistical test for small sample sizes. Statistical significance was set at P < 0.05. Analysis was performed using Excel software. The extremely high prevalence of metformin use in this specific patient cohort (mostly hypertensive patients with type 2 diabetes) confounds the ability to statistically link metformin to the inverted S/R ratio. The lack of a significant P value (0.53) does not rule out a potential biological interaction, as suggested by the mechanistic hypothesis. It rather indicates that in this small, real-world dataset, where metformin use is almost universal, its specific effect cannot be isolated statistically. This analysis underscores the necessity for a future, controlled study designed specifically to compare MTL enantiomer kinetics in patients with and without metformin co-administration.
Table 3.
Fisher's exact test for metformin association with the observed enantiomers ratio
|
Patient group
|
On metformin
|
Not on metformin
|
Total
|
Mean S/R ratio ± SD
|
| S/R < 1 (Inverted) |
6 |
0 |
6 |
0.86 ± 0.06 |
| S/R ≥ 1 (Normal) |
10 |
2 |
12 |
1.18 ± 0.13 |
| Total |
16 |
2 |
18 |
1.07 ± 0.19 |
Fisher's exact test P value = 0.53
Due to the dose variation among patients (47.5-190 mg/day), we conducted an additional statistical test to determine whether the different observed results were attributable to the dosage variation. To formally investigate if the daily dose was a confounding factor, we performed a statistical comparison. An unpaired t-test revealed no statistically significant difference (P = 0.76) in the mean daily dose between the group with a normal S/R ratio (108.96 ± 40.56 mg) and the group with an inverted S/R ratio (115 ± 36.74 mg). This result indicates that the observed inversion of the enantiomeric ratio is not driven by the absolute dosage but is likely due to patient-specific factors such as metabolic phenotype or drug-drug interactions, which is the main focus of the present work.
Such effects are especially likely with long-term co-administration. Consequently, concomitant medications taken by patients can influence the concentrations of MTL enantiomers. While renal excretion of MTL is often attributed to glomerular filtration, in PM individuals or during long-term use, active tubular excretion may play a significant role due to elevated plasma concentrations. This can alter the ratio of enantiomers in both plasma and urine through enantioselective excretion mechanisms via drug-drug interactions. Fig. 3 illustrates a lever mechanism that represents the balance and plasma concentrations of MTL enantiomers. It demonstrates how key factors influence the concentrations of these enantiomers in distinct ways. For instance, the hepatic enzyme CYP2D6 is positioned farthest from the fulcrum, highlighting its significant impact on enantiomer concentrations. The figure indicates that the activity of this enzyme exerts a stronger "weight" on the (S)-enantiomer side, leading to an increased plasma concentration of the (S)-enantiomer. As factors are positioned closer to the fulcrum, their influence on the enantiomeric balance diminishes. This schematic underscores the dynamic interplay between metabolic and excretory pathways in determining MTL’s enantiomeric profile, emphasizing the need for personalized dosing in hypertension management.
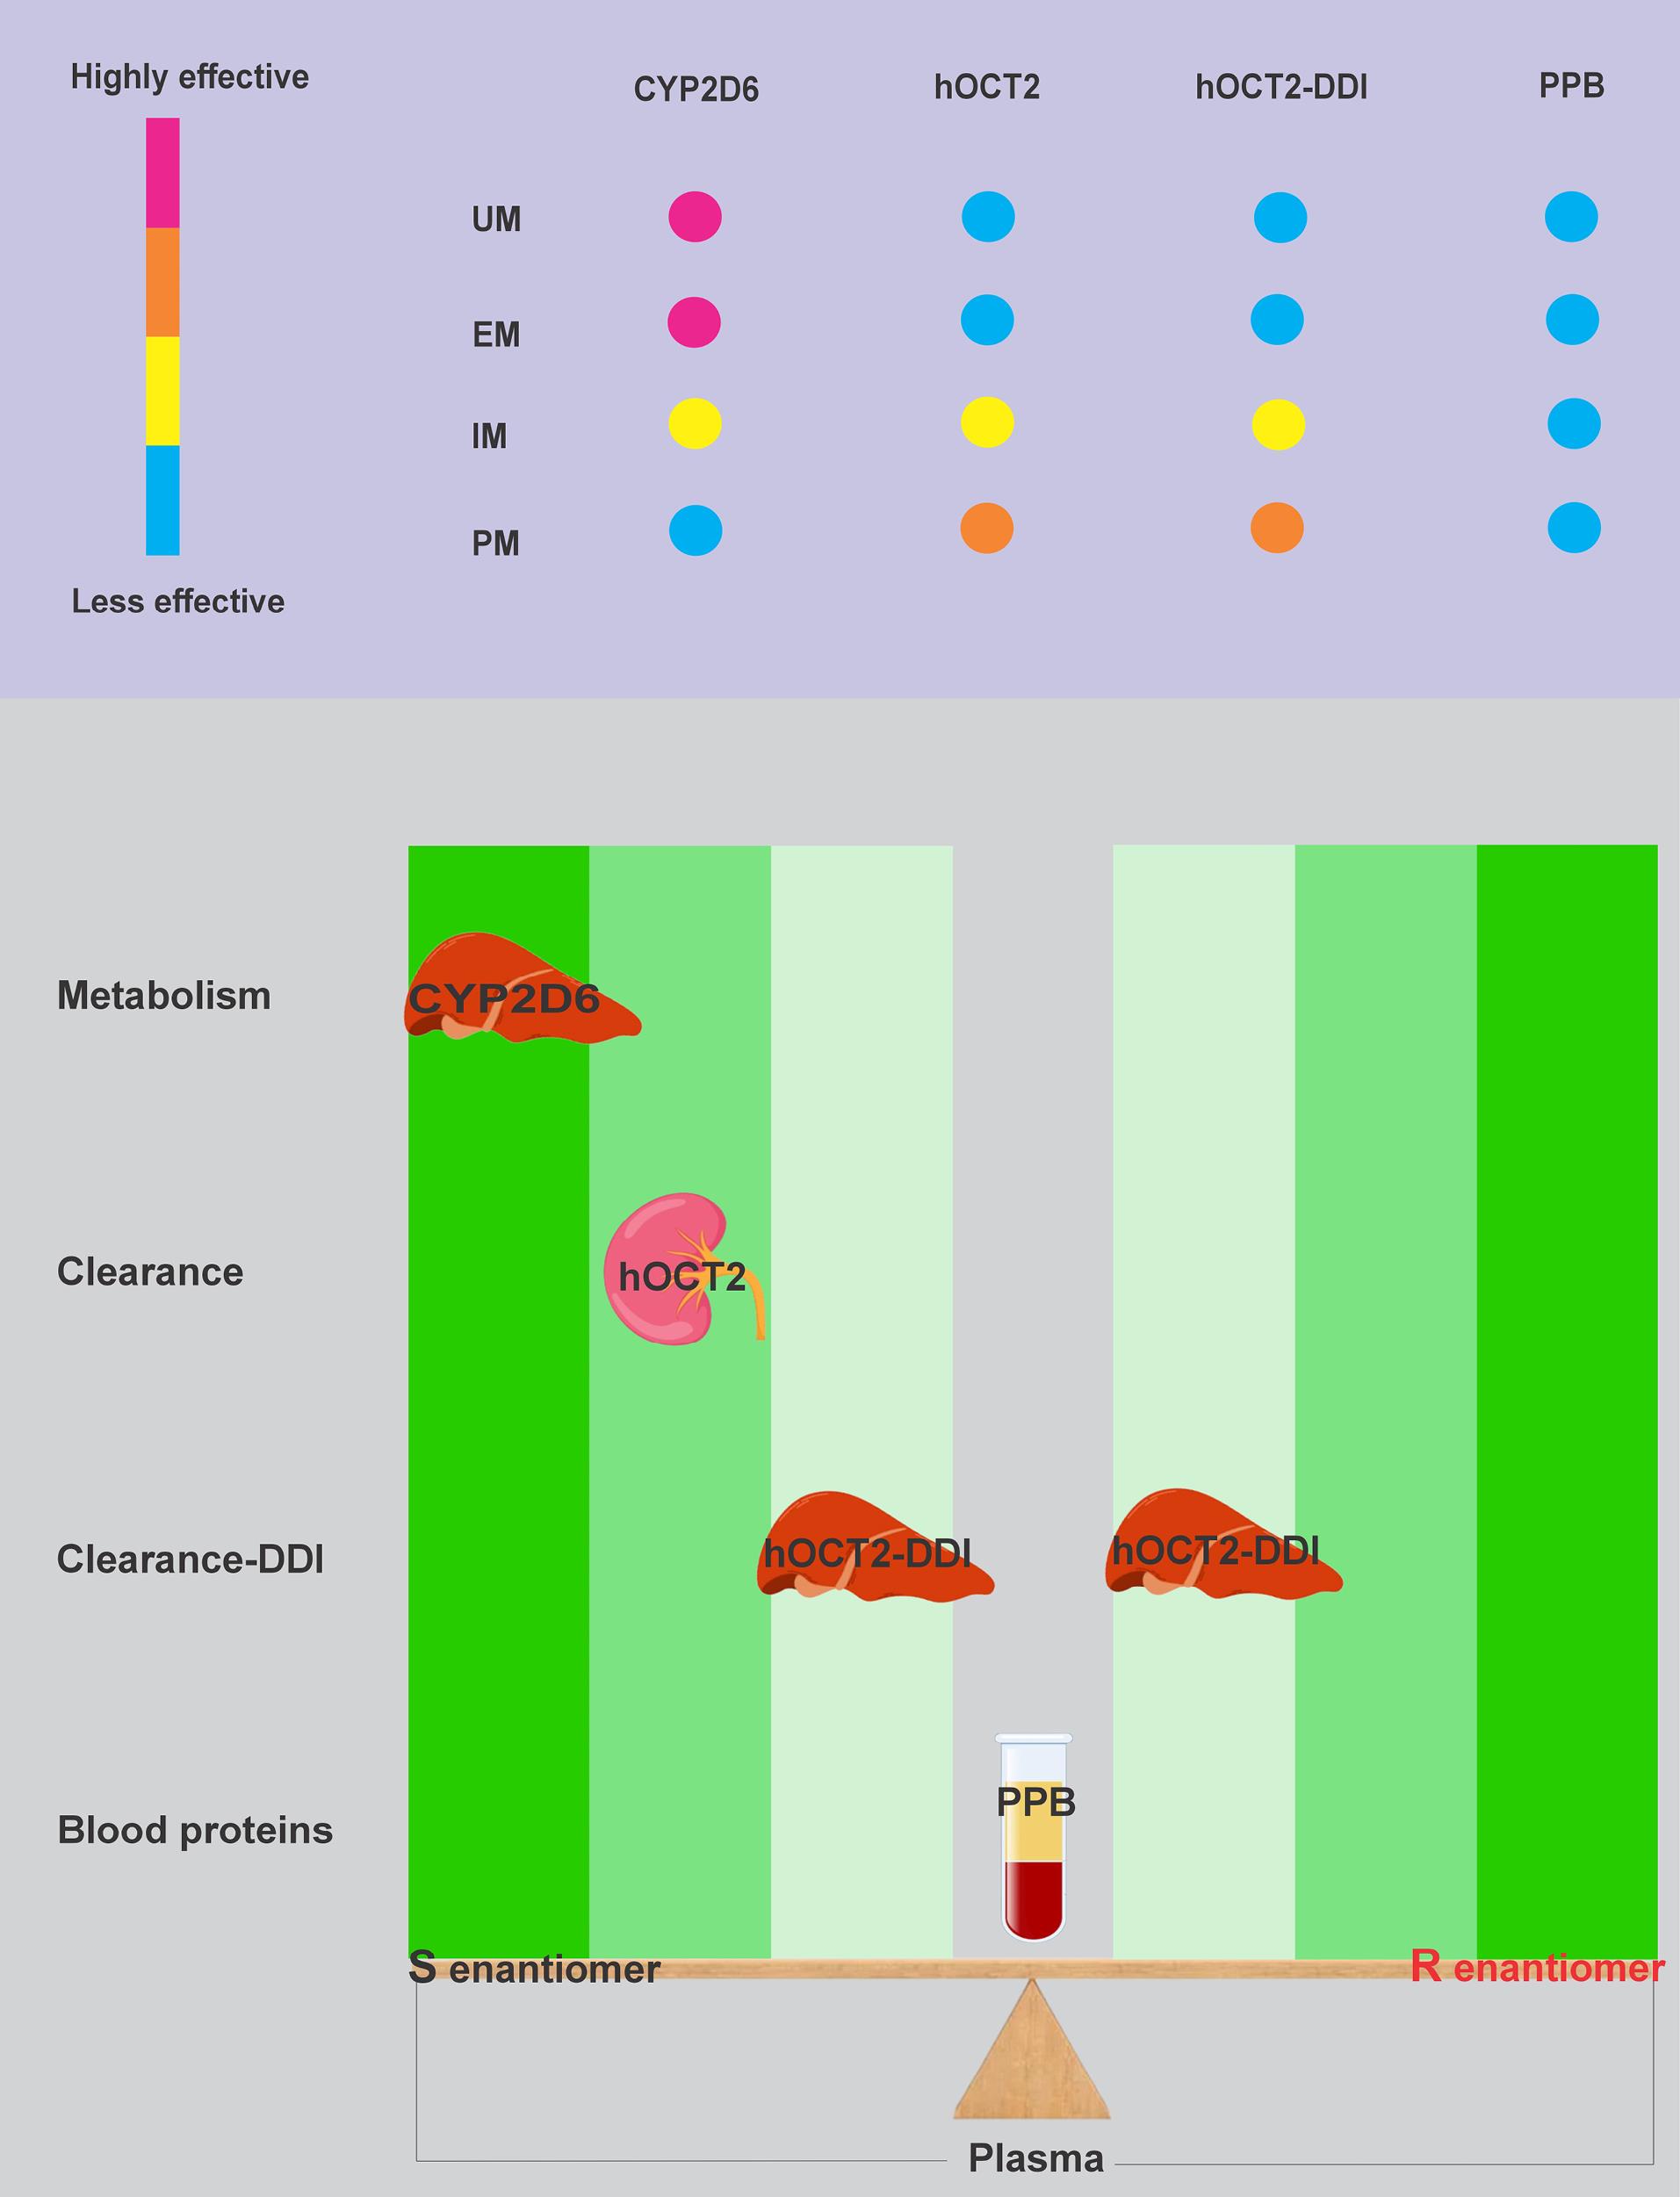
Fig. 3.
Schematic representation of factors influencing MTL enantiomer ratios in plasma.
.
Schematic representation of factors influencing MTL enantiomer ratios in plasma.
We observed reduced enantiomeric ratios in some patients (30%). These inverted S/R ratios ( < 1) may reflect saturation of CYP2D6-mediated metabolism during long-term therapy, shifting elimination toward renal pathways.51 Besides, drug-drug interactions may alter drug clearance. This variability highlights the complexity of MTL enantiomers' disposition and the need for personalized approaches.52 Future research should explore the mechanisms behind this variability, particularly renal excretion, drug-drug interactions and investigate longitudinal changes to optimize MTL therapy in hypertension.53
Limitations of the study
This study has several limitations that should be considered when interpreting the results. First, the identification of the MTL enantiomers was based on the well-documented elution order from chiral CE methods using CM-β-CD, as pure enantiomeric standards were not available for direct confirmation. While this assignment is supported by robust literature precedent, it remains an inferential step. Second, the variable sampling times (4-20 hours post-dose) relative to MTL's elimination half-life mean that the measured absolute concentrations represent different points on the concentration-time curve and are therefore not directly comparable between patients. This variability reflects the real-world, clinical nature of our study design, where blood draws were aligned with routine patient visits rather than a strict pharmacokinetic protocol. Consequently, the absolute concentrations should be interpreted with caution. However, the primary objective of our study was to investigate the enantiomeric ratio (S/R), not the absolute drug exposure. A key pharmacokinetic principle is that for enantiomers with very similar elimination half-lives, as is the case for MTL, the enantiomeric ratio remains relatively constant over the dosing interval at steady-state. Therefore, while the sampling variability confounds the analysis of total drug exposure, it is less critical for the interpretation of the S/R ratio, which is our central metric. Nonetheless, future studies would benefit from standardized trough-level sampling to concurrently allow for robust analysis of both concentration and ratio data. Third, the low sensitivity of the UV-based CE method resulted in a high non-detection rate (53%), limiting the number of patients (n = 18) with quantifiable plasma concentrations. This small effective sample size reduces the statistical power for robust subgroup analyses and generalizability, a constraint reflected in the lack of statistical significance in our association tests, despite strong numerical trends. Fourth, small sample size restricted further classification of the patients according to the co-administered drugs, gender etc. Finally, the absence of CYP2D6 genotyping or formal phenotyping means we cannot definitively correlate the observed enantiomeric ratios with the patients' metabolic phenotypes. While the S/R ratio itself has been proposed as a phenotypic marker, independent genetic or metabolic data would have been valuable to confirm the relative contributions of metabolism and excretion in the patients with inverted ratios. Despite these limitations, this study provides crucial, real-world evidence of unexpected variability in MTL enantiomer disposition during long-term therapy, highlighting the complexity of its pharmacokinetics in clinically complex patients and underscoring the need for personalized therapeutic approaches.
Conclusion
This small size study extends the understanding of MTL enantioselectivity in hypertensive patients undergoing long-term therapy. It confirms that CYP2D6-mediated metabolism predominantly governs the stereoselective disposition of MTL enantiomers. However, renal enantioselective excretion and potential drug-drug interactions, particularly with metformin, significantly influence the S/R ratio of enantiomers. The unexpected finding of S/R ratios below 1 in a subset of patients highlights the complex interplay between metabolic and renal pathways in the pharmacokinetics of MTL. These results emphasize the importance of personalized medicine in optimizing MTL therapy, where enantioselective analysis could serve as a practical alternative to CYP2D6 genotyping for identifying metabolic phenotypes. Such approaches are crucial for tailoring treatment regimens to individual metabolic profiles, minimizing adverse effects, and maximizing therapeutic outcomes. Future studies should focus on elucidating the mechanisms driving the observed variabilities and their clinical implications to refine guidelines for the effective and safe use of MTL in diverse patient populations.
Research Highlights
What is the current knowledge?
-
Metoprolol is administered as a racemic mixture with stereoselective pharmacokinetics influenced by CYP2D6 polymorphism.
-
CYP2D6 preferentially metabolizes the (R)-enantiomer, leading to higher plasma concentrations of the (S)-enantiomer (S/R ratio ≥ 1).
-
Renal excretion of metoprolol is enantioselective, favoring the (R)-enantiomer.
-
Most studies on metoprolol enantioselectivity focus on single-dose or short-term administration in healthy individuals.
What is new here?
-
Long-term metoprolol therapy in hypertensive patients reveals unexpected S/R plasma ratios < 1 in 30% of cases, contrary to prior findings.
-
Renal excretion and drug interactions (e.g., metformin) may override CYP2D6-driven enantioselectivity during chronic treatment.
-
Enantiomer monitoring could complement pharmacogenomics for personalized dosing in hypertension management.
-
Highlights the need to reassess enantioselective disposition in polypharmacy and renal impairment scenarios.
Competing Interests
The authors report there are no competing interests to declare.
Ethical Approval
The study protocol was approved by the Research Ethics Committee of Tabriz University of Medical Sciences (code of ethics committee: IR.TBZMED.REC.1402.857). In addition, informed consent was obtained from all individual participants (or legal guardians) included in this study.
References
- Koch-Weser J. Drug therapy: metoprolol. N Engl J Med 1979; 301:698-703. doi: 10.1056/nejm197909273011306 [Crossref] [ Google Scholar]
- Rigby JW, Scott AK, Hawksworth GM, Petrie JC. A comparison of the pharmacokinetics of atenolol, metoprolol, oxprenolol and propranolol in elderly hypertensive and young healthy subjects. Br J Clin Pharmacol 1985; 20:327-31. doi: 10.1111/j.1365-2125.1985.tb05072.x [Crossref] [ Google Scholar]
- Seyfinejad B, Jouyban K, Houshyar J, Jabbaripour Sarmadian A, Jouyban A. Profiling metoprolol enantiomers in urine of hypertensive patients. Daru 2025; 33:19. doi: 10.1007/s40199-025-00563-0 [Crossref] [ Google Scholar]
- Quarterman CP, Kendall MJ, Jack DB. The effect of age on the pharmacokinetics of metoprolol and its metabolites. Br J Clin Pharmacol 1981; 11:287-94. doi: 10.1111/j.1365-2125.1981.tb00536.x [Crossref] [ Google Scholar]
- Houshyar J, Hashemzadeh N, Khoubnasabjafari M, Jabbaripour Sarmadian A, Jouyban-Gharamaleki V, Afshar Mogaddam MR. A cross-sectional study on metoprolol concentrations in various biological samples and their inter-correlations. BMC Pharmacol Toxicol 2024; 25:45. doi: 10.1186/s40360-024-00773-3 [Crossref] [ Google Scholar]
- Calissendorff B, Savvaides I. Aqueous humor concentration of metoprolol after oral administration. J Ocul Pharmacol 1989; 5:27-31. doi: 10.1089/jop.1989.5.27 [Crossref] [ Google Scholar]
- Nagele P, Liggett SB. Genetic variation, β-blockers, and perioperative myocardial infarction. Anesthesiology 2011; 115:1316-27. doi: 10.1097/ALN.0b013e3182315eb2 [Crossref] [ Google Scholar]
- Jouyban K, Dehpour AR, Seyfinejad B, Jouyban A. Metoprolol metabolites' ratios and/or enantiomeric profiles: a simple and low-cost tool for personalized medicine through CYP2D6 phenotyping. Pharm Sci 2025; 31:1-2. doi: 10.34172/ps.024.40525 [Crossref] [ Google Scholar]
- Dayer P, Leemann T, Marmy A, Rosenthaler J. Interindividual variation of beta-adrenoceptor blocking drugs, plasma concentration and effect: influence of genetic status on behaviour of atenolol, bopindolol and metoprolol. Eur J Clin Pharmacol 1985; 28:149-53. doi: 10.1007/bf00609683 [Crossref] [ Google Scholar]
- Walle T, Webb JG, Bagwell EE, Walle UK, Daniell HB, Gaffney TE. Stereoselective delivery and actions of beta receptor antagonists. Biochem Pharmacol 1988; 37:115-24. doi: 10.1016/0006-2952(88)90763-0 [Crossref] [ Google Scholar]
- Johnson JA, Burlew BS. Metoprolol metabolism via cytochrome P4502D6 in ethnic populations. Drug Metab Dispos 1996; 24:350-5. [ Google Scholar]
- Jonkers RE, Koopmans RP, Portier EJ, van Boxtel CJ. Debrisoquine phenotype and the pharmacokinetics and beta-2 receptor pharmacodynamics of metoprolol and its enantiomers. J Pharmacol Exp Ther 1991; 256:959-66. [ Google Scholar]
- Lennard MS, Tucker GT, Silas JH, Freestone S, Ramsay LE, Woods HF. Differential stereoselective metabolism of metoprolol in extensive and poor debrisoquin metabolizers. Clin Pharmacol Ther 1983; 34:732-7. doi: 10.1038/clpt.1983.242 [Crossref] [ Google Scholar]
- Blake CM, Kharasch ED, Schwab M, Nagele P. A meta-analysis of CYP2D6 metabolizer phenotype and metoprolol pharmacokinetics. Clin Pharmacol Ther 2013; 94:394-9. doi: 10.1038/clpt.2013.96 [Crossref] [ Google Scholar]
- Seeringer A, Brockmöller J, Bauer S, Kirchheiner J. Enantiospecific pharmacokinetics of metoprolol in CYP2D6 ultra-rapid metabolizers and correlation with exercise-induced heart rate. Eur J Clin Pharmacol 2008; 64:883-8. doi: 10.1007/s00228-008-0504-8 [Crossref] [ Google Scholar]
- Reddy IK, Mehvar R. Chirality in Drug Design and Development. CRC Press; 2004.
- Zanger UM, Schwab M. Cytochrome P450 enzymes in drug metabolism: regulation of gene expression, enzyme activities, and impact of genetic variation. Pharmacol Ther 2013; 138:103-41. doi: 10.1016/j.pharmthera.2012.12.007 [Crossref] [ Google Scholar]
- Wadelius M, Darj E, Frenne G, Rane A. Induction of CYP2D6 in pregnancy. Clin Pharmacol Ther 1997; 62:400-7. doi: 10.1016/s0009-9236(97)90118-1 [Crossref] [ Google Scholar]
- Villeneuve JP, Pichette V. Cytochrome P450 and liver diseases. Curr Drug Metab 2004; 5:273-82. doi: 10.2174/1389200043335531 [Crossref] [ Google Scholar]
- Thürmann PA, Haack S, Werner U, Szymanski J, Haase G, Drewelow B. Tolerability of beta-blockers metabolized via cytochrome P450 2D6 is sex-dependent. Clin Pharmacol Ther 2006; 80:551-3. doi: 10.1016/j.clpt.2006.08.004 [Crossref] [ Google Scholar]
- Nekvindová J, Anzenbacher P. Interactions of food and dietary supplements with drug metabolising cytochrome P450 enzymes. Ceska Slov Farm 2007; 56:165-73. [ Google Scholar]
- Brøsen K, Gram LF. Clinical significance of the sparteine/debrisoquine oxidation polymorphism. Eur J Clin Pharmacol 1989; 36:537-47. doi: 10.1007/bf00637732 [Crossref] [ Google Scholar]
- Rau T, Wuttke H, Michels LM, Werner U, Bergmann K, Kreft M. Impact of the CYP2D6 genotype on the clinical effects of metoprolol: a prospective longitudinal study. Clin Pharmacol Ther 2009; 85:269-72. doi: 10.1038/clpt.2008.218 [Crossref] [ Google Scholar]
- Kirchheiner J, Heesch C, Bauer S, Meisel C, Seringer A, Goldammer M. Impact of the ultrarapid metabolizer genotype of cytochrome P450 2D6 on metoprolol pharmacokinetics and pharmacodynamics. Clin Pharmacol Ther 2004; 76:302-12. doi: 10.1016/j.clpt.2004.07.002 [Crossref] [ Google Scholar]
- Sohn DR, Kusaka M, Shin SG, Jang IJ, Chiba K, Ishizaki T. Utility of a one-point (3-hour postdose) plasma metabolic ratio as a phenotyping test using metoprolol in two east Asian populations. Ther Drug Monit 1992; 14:184-9. doi: 10.1097/00007691-199206000-00002 [Crossref] [ Google Scholar]
- Cerqueira PM, Cesarino EJ, Mateus FH, Mere Y Jr, Santos SR, Lanchote VL. Enantioselectivity in the steady-state pharmacokinetics of metoprolol in hypertensive patients. Chirality 1999; 11:591-7. doi: 10.1002/(sici)1520-636x(1999)11:7<591::Aidchir12>3.0.Co;2-t [Crossref] [ Google Scholar]
- Leemann T, Dayer P, Meyer UA. Single-dose quinidine treatment inhibits metoprolol oxidation in extensive metabolizers. Eur J Clin Pharmacol 1986; 29:739-41. doi: 10.1007/bf00615971 [Crossref] [ Google Scholar]
- Laurent-Kenesi MA, Funck-Brentano C, Poirier JM, Decolin D, Jaillon P. Influence of CYP2D6-dependent metabolism on the steady-state pharmacokinetics and pharmacodynamics of metoprolol and nicardipine, alone and in combination. Br J Clin Pharmacol 1993; 36:531-8. doi: 10.1111/j.1365-2125.1993.tb00411.x [Crossref] [ Google Scholar]
- Andersson T, Lundborg P, Regårdh CG. Lack of effect of omeprazole treatment on steady-state plasma levels of metoprolol. Eur J Clin Pharmacol 1991. 40: 61-5. doi: 10.1007/bf00315140.
- Mautz DS, Nelson WL, Shen DD. Regioselective and stereoselective oxidation of metoprolol and bufuralol catalyzed by microsomes containing cDNA-expressed human P4502D6. Drug Metab Dispos 1995. 23: 513-7.
- Otton SV, Crewe HK, Lennard MS, Tucker GT, Woods HF. Use of quinidine inhibition to define the role of the sparteine/debrisoquine cytochrome P450 in metoprolol oxidation by human liver microsomes. J Pharmacol Exp Ther 1988. 247: 242-7.
- Lim HK, Linh PT, Hong CH, Kim KH, Kang JS. Enantioselective determination of metoprolol and major metabolites in human urine by capillary electrophoresis. J Chromatogr B Biomed Sci Appl 2001; 755:259-64. doi: 10.1016/s0378-4347(01)00118-9 [Crossref] [ Google Scholar]
- Pflugmann G, Spahn H, Mutschler E. Rapid determination of the enantiomers of metoprolol, oxprenolol and propranolol in urine. J Chromatogr 1987; 416:331-9. doi: 10.1016/0378-4347(87)80516-9 [Crossref] [ Google Scholar]
- Baranowska I, Adolf W, Magiera S. Enantioselective determination of metoprolol and its metabolites in human urine high-performance liquid chromatography with fluorescence detection (HPLC-FLD) and tandem mass spectrometry (MS/MS). J Chromatogr B Analyt Technol Biomed Life Sci 2015; 1004:79-84. doi: 10.1016/j.jchromb.2015.09.019 [Crossref] [ Google Scholar]
- Kim KH, Lee JH, Ko MY, Shin KS, Kang JS, Mar WC. Determination of metoprolol enantiomers in human urine by GC-MS using (−)-α-methoxy-α-(trifluoromethyl)phenylacetyl chloride as a chiral derivatizing agent. Chromatographia 2002; 55:81-5. doi: 10.1007/bf02492319 [Crossref] [ Google Scholar]
- Li X, Xia Z. [Deep eutectic solvents synergistic with carboxymethyl -β-cyclodextrin on the improvement of chiral separation of metoprolol by capillary electrophoresis]. Se Pu 2024; 42:327-32. doi: 10.3724/sp.J.1123.2024.01024 [Crossref] [ Google Scholar]
- Lennard MS, Silas JH, Freestone S, Ramsay LE, Tucker GT, Woods HF. Oxidation phenotype--a major determinant of metoprolol metabolism and response. N Engl J Med 1982; 307:1558-60. doi: 10.1056/nejm198212163072505 [Crossref] [ Google Scholar]
- Gardiner SJ, Begg EJ. Pharmacogenetics, drug-metabolizing enzymes, and clinical practice. Pharmacol Rev 2006; 58:521-90. doi: 10.1124/pr.58.3.6 [Crossref] [ Google Scholar]
- Huang J, Chuang SK, Cheng CL, Lai ML. Pharmacokinetics of metoprolol enantiomers in Chinese subjects of major CYP2D6 genotypes. Clin Pharmacol Ther 1999; 65:402-7. doi: 10.1016/s0009-9236(99)70134-7 [Crossref] [ Google Scholar]
- Cerqueira PM, Coelho EB, Geleilete TJ, Goldman GH, Lanchote VL. Influence of chronic renal failure on stereoselective metoprolol metabolism in hypertensive patients. J Clin Pharmacol 2005; 45:1422-33. doi: 10.1177/0091270005281816 [Crossref] [ Google Scholar]
- Murthy SS, Shetty HU, Nelson WL, Jackson PR, Lennard MS. Enantioselective and diastereoselective aspects of the oxidative metabolism of metoprolol. Biochem Pharmacol 1990; 40:1637-44. doi: 10.1016/0006-2952(90)90466-x [Crossref] [ Google Scholar]
- Somogyi AA, Bochner F, Sallustio BC. Stereoselective inhibition of pindolol renal clearance by cimetidine in humans. Clin Pharmacol Ther 1992; 51:379-87. doi: 10.1038/clpt.1992.37 [Crossref] [ Google Scholar]
- Lennernäs H. Clinical pharmacokinetics of atorvastatin. Clin Pharmacokinet 2003; 42:1141-60. doi: 10.2165/00003088-200342130-00005 [Crossref] [ Google Scholar]
- Graham GG, Punt J, Arora M, Day RO, Doogue MP, Duong JK. Clinical pharmacokinetics of metformin. Clin Pharmacokinet 2011; 50:81-98. doi: 10.2165/11534750-000000000-00000 [Crossref] [ Google Scholar]
- Kimura N, Okuda M, Inui K. Metformin transport by renal basolateral organic cation transporter hOCT2. Pharm Res 2005; 22:255-9. doi: 10.1007/s11095-004-1193-3 [Crossref] [ Google Scholar]
- Umehara KI, Iwatsubo T, Noguchi K, Usui T, Kamimura H. Effect of cationic drugs on the transporting activity of human and rat OCT/Oct 1-3 in vitro and implications for drug-drug interactions. Xenobiotica 2008; 38:1203-18. doi: 10.1080/00498250802334409 [Crossref] [ Google Scholar]
- Bachmakov I, Glaeser H, Endress B, Mörl F, König J, Fromm MF. Interaction of beta-blockers with the renal uptake transporter OCT2. Diabetes Obes Metab 2009; 11:1080-3. doi: 10.1111/j.1463-1326.2009.01076.x [Crossref] [ Google Scholar]
- Ma YR, Shi AX, Qin HY, Zhang T, Wu YF, Zhang GQ. Metoprolol decreases the plasma exposure of metformin via the induction of liver, kidney and muscle uptake in rats. Biopharm Drug Dispos 2016; 37:511-21. doi: 10.1002/bdd.2041 [Crossref] [ Google Scholar]
- Regårdh CG, Borg KO, Johansson R, Johnsson G, Palmer L. Pharmacokinetic studies on the selective beta1-receptor antagonist metoprolol in man. J Pharmacokinet Biopharm 1974; 2:347-64. doi: 10.1007/bf01061407 [Crossref] [ Google Scholar]
- Hsyu PH, Giacomini KM. Stereoselective renal clearance of pindolol in humans. J Clin Invest 1985; 76:1720-6. doi: 10.1172/jci112161 [Crossref] [ Google Scholar]
- Ďuricová J, Peřinová I, Kacířová I, Grundmann M. Comparison of metoprolol/α-hydroxy-metoprolol metabolic ratio after a single dose and in steady state. Ceska Slov Farm 2010; 59:222-6. [ Google Scholar]
- Kacirova I, Lazarova M, Urinovska R, Dodulik J, Vaclavik J. Analysis of serum concentrations of metoprolol and its metabolite α-hydroxymetoprolol in patients with heart failure with reduced ejection fraction: a pilot study in routine health care. Expert Rev Clin Pharmacol 2025; 18:89-99. doi: 10.1080/17512433.2025.2450257 [Crossref] [ Google Scholar]
- Cascorbi I. Safe and effective medicines for all: is personalized medicine the answer?. Expert Rev Clin Pharmacol 2010; 3:627-37. doi: 10.1586/ecp.10.36 [Crossref] [ Google Scholar]