Bioimpacts. 16:32796.
doi: 10.34172/bi.32796
Original Article
Comprehensive pan-cancer analysis and experimental validation of mitotic arrest defective 2-like 1 (MAD2L1) in colorectal cancer
Qingqing Wu Data curation, Funding acquisition, Methodology, Writing – original draft, 1 
Zhuangzhuang Tian Validation, 1
Liyu Cao Conceptualization, Project administration, Supervision, Writing – review & editing, 2, *
Author information:
1Department of Pathology, the Fuyang Affiliated Hospital of Anhui Medical University, Fuyang, Anhui, 236000, China
2Department of Pathology, Anhui Medical University, Hefei, Anhui, 230032, China
Abstract
Introduction:
This study investigates the function of MAD2L1 through comprehensive bioinformatics analysis of pan-cancer data and molecular functional validation experiments, with a particular focus on colorectal cancer.
Methods:
We analyzed MAD2L1 expression, prognosis, genetic and epigenetic alterations, immune infiltration, and copper apoptosis-related genes across multiple cancers. A lncRNA–miRNA–MAD2L1 regulatory network was constructed for CRC. Drug sensitivity related to MAD2L1 was assessed via GSCALite. Functional assays included GO/KEGG enrichment, RT-PCR, Western blot, CCK-8, cell cycle, and apoptosis analysis.
Results:
A comprehensive pan-cancer analysis revealed that MAD2L1 has diagnostic and prognostic value. Its expression correlated with methylation, immune cell infiltration, and immune checkpoint genes. In CRC, a lncRNA–miRNA–MAD2L1 network appears to regulate tumor progression. Enrichment analysis linked MAD2L1 to DNA replication and chromosome segregation. Functional experiments showed that MAD2L1 promotes proliferation and inhibits apoptosis, likely via cell cycle regulation.
Conclusion:
MAD2L1 is a potential biomarker for diagnosis, prognosis, immune response, and drug sensitivity in pan-cancer, including CRC. It facilitates tumor progression through a lncRNA-miRNA–miRNA network and regulates proliferation and apoptosis via DNA replication and cell cycle pathways.
Graphical Abstract
Keywords: Colorectal cancer, Integrative analysis, MAD2L1, Pan-cancer analysis
Copyright and License Information
© 2026 The Author(s).
This work is published by BioImpacts as an open access article distributed under the terms of the Creative Commons Attribution Non-Commercial License (
http://creativecommons.org/licenses/by-nc/4.0/). Non-commercial uses of the work are permitted, provided the original work is properly cited.
Funding Statement
The present study was supported by the AnHui Medical University Scientific Research Project Foundation (2021xkj075).
Introduction
Colorectal cancer (CRC) ranks as the third most frequently diagnosed cancer globally, yet it stands as the second leading cause of death among cancer patients. Advances in understanding the molecular pathogenesis of CRC have broadened the spectrum of available treatments, which include endoscopic and surgical resection, radiotherapy, immunotherapy, targeted therapies, palliative chemotherapy, extensive surgical interventions, and local ablative approaches for metastatic disease.1,2 Despite improvements in therapeutic avenues, the rising incidence and unfavorable outcomes observed in younger age groups present considerable economic and public health burdens.3-5 This pressing situation highlights the need to identify innovative prognostic biomarkers and molecular targets to enhance treatment personalization and outcome prediction for individuals with colorectal cancer.
MAD2L1, a crucial component of the MAD family, is located on human chromosome 4 and plays a pivotal role in the mitotic checkpoint complex.6 Disruptions in MAD2L1 function can adversely affect the mitotic checkpoint's integrity. Research has indicated that MAD2L1 mutations foster tumor growth through chromosomal instability and aneuploidy, noted in various human cancers, including lung adenocarcinoma (LUAD), CRC, cervical cancer, liver cancer, breast cancer (BRCA), and gastric cancer.7-12 These findings underscore MAD2L1's significant role in oncogenesis.
There is a well-documented correlation between MAD2L1 overexpression and its prognostic significance in tumors.13 It has been observed that MAD2L1 enhances proliferation and inhibits apoptosis in LUAD cells, and is linked to malignant progression and poor disease-free survival in BRCA patients.14 Nonetheless, the association between MAD2L1 and tumors remains poorly defined, particularly in CRC.
This gene is associated with immune infiltration in hepatocellular carcinoma, has clinical relevance and prognostic significance, and is higher in colon adenocarcinoma tissues compared to nearby non-tumor tissues, according to bioinformatics analysis.15 Inhibiting proliferation and preventing apoptosis, prior research established MAD2L1's oncogenic function.16 There is a lack of extensive research on the various aspects of MAD2L1 and its role in tumor immune cell infiltration, drug sensitivity, ceRNA, ICP gene expression, MAD2L1 pan-cancer processes, and CRC in particular.17 Therefore, an in-depth investigation into MAD2L1's diverse oncological roles is imperative.
We examined MAD2L1's expression patterns to evaluate its diagnostic and prognostic utility across different cancers, alongside its genetic and epigenetic modifications. We also investigated the correlations between MAD2L1 expression, immune cell infiltration in various cancers, and responses to MAD2L1-targeted antitumor drugs. Moreover, we explored the interactions between lncRNA, miRNA, and MAD2L1 in CRC, validating the co-expression gene enrichment analysis of MAD2L1. Our study introduces, for the first time, the potential of MAD2L1 as a predictive biomarker for diagnosis, prognosis, and treatment in CRC, highlighting its role in promoting cell proliferation and inhibiting apoptosis in CRC.
Materials and Methods
Expression and subcellular localization analysis of MAD2L1
Using the Human Protein Atlas (HPA, https://www.proteinatlas.org/) to investigate cross-genotype-tissue expression in normal tissues supplied by Genotype Tissue Expression (GTEx, https://gtexportal.org/), this study examined the expression and subcellular localization of MAD2L1.18 Wilcoxon rank sum test was used for GTEx data analysis. We determined the subcellular location of MAD2L1 by analyzing levels of MAD2L1 mRNA and by utilizing immunofluorescence labeling pictures obtained from two human cancer cell lines, U2OS and A-431. Additionally, antigen localization was assessed using immunohistochemistry images from a range of malignancies. To statistically evaluate the expression of MAD2L1 mRNA in normal and malignant tissues, as well as in matched samples, the following packages were used: ggplot2 [3.3.6], stats [4.2.1], and car [3.1-0] in R 4.2.1.
Analysis of the prognostic and diagnostic value of MAD2L1
We analyzed RNA sequencing data from TCGA (https://portal.gdc.cancer.gov/) to evaluate the changes in MAD2L1 expression pertinent to cancer diagnosis and prognosis. Cox regression analysis was executed with the survival [3.3.1] and rms [6.3-0] packages in R (4.2.1), yielding risk ratios (HR), 95% confidence intervals (CI), and P-values. Data visualization was performed via a forest plot using ggplot2 [3.3.6]. The KM survival curve uses the statistical method of Cox regression, the survival package is used to test the proportional risk hypothesis and fit the survival regression, and the results are visualized by the survminer package and ggplot2 package. Additionally, the diagnostic accuracy of MAD2L1 was quantified through ROC curve analysis, employing the pROC package, time-dependent ROC curves, IPCW estimation and the software/packages employed (e.g., timeROC, survivalROC), with results again visualized using ggplot2.19,20 The area under the curve (AUC) was considered the critical metric for predictive performance, with values ranging from 0.5 to 1.
Genetic change analysis
The cBioPortal (http://www.cbioportal.org/) was employed as a resource for analyzing and interpreting cancer genetic data, offering insights into genetics, epigenetics, gene expression, and molecular information from cancer tissues and cells, including proteomics.21 The platform's 'TCGA PanCancer Atlas Studies' module was used to investigate MAD2L1 mutations, providing access to data on mutation types and their frequencies.
DNA methylation and mRNA modification
MAD2L1 promoter DNA methylation levels in normal and pan-cancer tissues were evaluated using UALCAN (http://ualcan.path.uab.edu/analysis.html).22 The levels of DNA methylation were determined by analyzing beta values; values ranging from 0.3 to 0.25 indicated hypomethylation, while values ranging from 0.7 to 0.5 indicated hypermethylation.23 The CRC MAD2L1 methylation pattern was obtained from the 'Gene Visualization' module of the MethSurv database. The analysis of 45 methylation regulators was further enhanced by incorporating data on 1-methyladenosine (m1A), 5-methylcytosine(m5C), and 6-methyladenosine(m6A) alterations using the 'Pan-cancer analysis-mRNA modification' module of SangerBox 3.0 (http://sangerbox.com/), the correlation is assessed based on Pearson's rho value and its statistical significance, with a threshold of (*P < 0.05).
MAD2L1 expression and immune correlation
Through the utilization of the TIMER2.0 platform, the correlation between MAD2L1 expression and immunological response was examined. Using the R package ggplot2 [3.3.6], we were able to visualize the EPIC (https://gfellerlab.shinyapps.io/EPIC_1-1/) algorithm results and analyze immune cell infiltration.24 Using the TCGA information, we created a correlation heatmap that shows the percentage of stromal, immunological, estimated, and other cell types that infiltrate. To calculate tumor purity scores, the 'estimate' R tool was used to examine the CRC dataset. TIMER2.0 (http://timer.comp-genomics.org/) was also used to examine the relationship of MAD2L1 expression with eight ICPs via the 'Gene_Corr' module, with P-values and r-values visualized in a heatmap [3.3.6].25
Network construction of LncRNA-miRNA-MAD2L1
This study utilized four online miRNA prediction databases—DIANA-microT (http://diana.imis.athena-innovation.gr/DianaTools/index.php?r=microT_CDS/index), miRcode (http://www.mircode.org/index.php), miRWalk (http://mirwalk.umm.uni-heidelberg.de/), and miRDB (http://mirdb.org/miRDB/)— to identify potential target miRNAs for MAD2L1.26-29 We classified miRNAs that were found in three or more of these databases as target miRNAs. To examine the lncRNA-miRNA interactome and its relationship with MAD2L1, we used StarBase 2.0 (https://starbase.sysu.edu.cn/). A stringent criterion ( ≥ 5) was applied, encompassing mammalian, human, hg19, and CLIP data, with options to include or exclude degradome data. The interactions between miRNA and lncRNA were visualized using R (4.2.1) software and Cytoscape.
Drugs response analysis
In order to examine the CTRP (http://portals.broadinstitute.org/ctrp/) and GDSC's (https://www.cancerrxgene.org/) mRNA expression, mutations, immune infiltration, methylation, and treatment resistance within the TCGA dataset, we Employed GSCALite (http://bioinfo.life.hust.edu.cn/web/GSCALite/).30 We investigated the MAD family's sensitivity to medications (MAD2L1, MAD2L2, MAD1L1) and found in the Drug Bank (https://go.drugbank.com/drugs) that there are FDA-approved chemotherapeutic treatments that are related to MAD2L1 expression. We used ggplot2 [3.3.6] to display the results.
Genes co-expressed with MAD2L1 and functional analysis
Utilizing the Xiantao tool (https://www.xiantao.love/), we visualized the heatmap and identified the top 30 upregulated and downregulated genes associated with MAD2L1 from TCGA. Using the publicly available PPI data from STRING (https://cn.string-db.org/), the top 100 genes showing positive co-expression with MAD2L1 were used to form the protein-protein interaction (PPI) network. To examine hub genes, Cytoscape's 'CytoHubba' plugin (version 3.7.2) was utilized. Furthermore, in order to facilitate clustering information analysis, the Xiantao tool was utilized to conduct enrichment analysis utilizing GO and KEGG for the top 500 genes that were positively co-expressed with MAD2L1.
Cell lines, culture, and transfection
In an incubator with 5% CO2, human CC cells RKO and HCT-116 were grown in full MEM and DMEM media, respectively. The cells were obtained from Subcom and kept at 37°C. The MAD2L1 siRNA-308, MAD2L1 siRNA-406 and MAD2L1 siRNA-573 sequences were designed (Table 1), and the interfering agent sequence was constructed based on the human MAD2L1 sequence (NM_002358.4, Gene ID: 4085) provided in GenBank. All sequences were submitted to Anhui General Biosynthesis. The cells were cultured and passaged, and when the cell density reached 70%, they were prepared for transfection. 48 hours later, WB was performed to assess the efficiency of MAD2L1 knockdown.
Table 1.
The sequences of MAD2L1 siRNA-308, siRNA-406 and siRNA-573
|
Interfering Agent Name
|
Interfering Agent Sequence (5’-3’)
|
| MAD2L1 siRNA-308 |
F: UAAAUAAUGUGGUGGAACATT |
|
R: UGUUCCACCACAUUAUUUATT |
| MAD2L1 siRNA-406 |
F: GAAAGAUGGCAGUUUGAUATT
R: UAUCAAACUGCCAUCUUUCTT |
| MAD2L1 siRNA-573 |
F: GCUGAUUUAUACAGACAAATT |
|
R: UUUGUCUGUAUAAAUCAGCTT |
| NC |
F: UUCUCCGAACGUGUCACGUTT |
|
R: ACGUGACACGUUCGGAGAATT |
RT-PCR
RT-PCR was conducted to evaluate MAD2L1 mRNA levels in CRC cells. Complementary DNA (cDNA) was synthesized from mRNA following the manufacturer's protocol using a fluorescence-based quantitative PCR instrument to detect the resultant PCR products. β-actin was employed as the internal control. Below is a list of the oligonucleotide primers that were utilized for the amplification process (Table 2). A 45-cycle PCR was carried out, beginning with a 15-second pre-denaturation at 95°C, followed by 5 seconds of denaturation, and finally 30 seconds of annealing and extension at 60°C. Using the 2-ΔΔCt technique, the levels of gene expression were measured.
Table 2.
List of the oligonucleotide primers that were utilized for the amplification process
|
Primers
|
Primer sequence (5’-3’)
|
Product length (bp)
|
Annealing temperature (℃).
|
| β-actin -F |
TGGCACCCAGCACAATGAA |
186 |
58.0 |
| β-actin - R |
CTAAGTCATAGTCCGCCTAGAAGCA |
| MAD2L1- F |
CGAGTTCTTCTCATTCGGCATC |
163 |
58.0 |
| MAD2L1- R |
CCAATCTTTCAGTTGTTCCACCA |
Western blotting
To validate the efficacy of three different MAD2L1-interfering sequences, WB was performed. The sequence demonstrating the highest knockdown efficiency was selected for detailed analysis. We used a lysis buffer to extract the proteins, then a BCA assay to quantify them, and finally a 10% SDS-PAGE to separate them. The proteins that had been isolated were subsequently transferred to a polyvinylidene fluoride (PVDF) membrane and then blocked with 5% non-fat milk. Primordial antibodies were utilized to detect MAD2L1 (HC201, Trans, catalog number: 1:2000 dilution) and β-actin (Proteintech, catalog number: 10337-1-AP, 1:1000 dilution). Using an enhanced chemiluminescence system and a Tanon-5200 chemiluminescence system, the blots were prepared and observed. HRP-conjugated secondary antibodies (Servicebio, Cat. No. GB23303 and GB23301, both 1:2000 dilution) were used for probing.
Cell viability assay
We used the CCK8 test to measure cell viability. For the overnight incubation, 96-well plates were seeded with around 2 × 10³ cells per well. In each well, 90 µL of growth media and 10 µL of CCK8 reagent were added after the cells were washed twice with PBS following incubation. A spectrophotometric microplate reader was used to measure the optical density (OD) at 450 nm after incubating the plates at 37°C for 2 hours.
Cell cycle assay
The cells were pelleted by centrifugation at 3500 rpm for 3 minutes; the supernatant was discarded, and 1 mL of PBS was used to resuspend the pellet. After a second round of centrifugation, the cells were mixed with 5 µL of permeabilization solution and 0.5 mL of DNA staining solution, mixed thoroughly by vortexing, and left to incubate in the dark at room temperature for 30 minutes. The stained cells were then analyzed using the NovoCyteTM flow cytometer (NovoCyte 2060R, Aisen Biotech (Hangzhou Co., Ltd.).
Cell apoptosis
Centrifugation at 1500 rpm for 3 minutes and two washes with PBS were used to prepare around 1 × 10⁶ cells. In 300 µL of cooled 1X Binding Buffer, the cells were resuspended. Annexin V-FITC (5 µL) and PI (10 µL) were added to every sample. Next, 200 µL of cooled Binding Buffer was added after a 10-minute dark incubation period at room temperature. The prepared samples were subsequently analyzed on the NovoCyteTM flow cytometer (NovoCyte 2060R, Aisen Biotech (Hangzhou) Co., Ltd.).
Statistical analysis
R (4.2.1) and GraphPad Prism 9.0 were used for statistical assessments and data analysis, respectively. The significance of differences between the experimental groups was determined using Student's t-test, and the results were presented as mean ± SD. For continuous variables, one-way ANOVA was first applied to assess overall differences across groups. When the overall ANOVA was significant, post-hoc pairwise comparisons were performed using Tukey’s HSD test to correct for multiple comparisons· Categorical variables were compared using the chi-square test, with Bonferroni adjustment for post-hoc pairwise comparisons where applicable. Statistical significance thresholds were denoted as *P < 0.05,**P < 0.01, ***P < 0.001, and ****P < 0.0001.
Results
MAD2L1 expression level and subcellular localization
According to the HPA database, the tissues that exhibit the highest amounts of MAD2L1 expression are the thymus, testis, and tongue (Fig. 1A). Fig. 2B shows that MAD2L1 is significantly upregulated across 33 different cancer types, including ACC, BRCA, CHOL, COAD, and READ (*P < 0.05). Additionally, PAAD and SKCM tumor stages are strongly correlated with MAD2L1 expression in the GEPIA2 dataset (*P < 0.05, Table S1). Almost all cancers demonstrate consistent expression of MAD2L1 in tumor and corresponding normal tissues (Fig. 1C, Table S2). Additionally, subcellular localization investigations have detected MAD2L1 in the actin nucleoplasm (Figs. 1D and 1F). These observations collectively indicate a prevalent upregulation of MAD2L1 in tumors, with significantly elevated levels in CRC when compared to both matched and unmatched normal tissues (Figs. 1G and 1K).
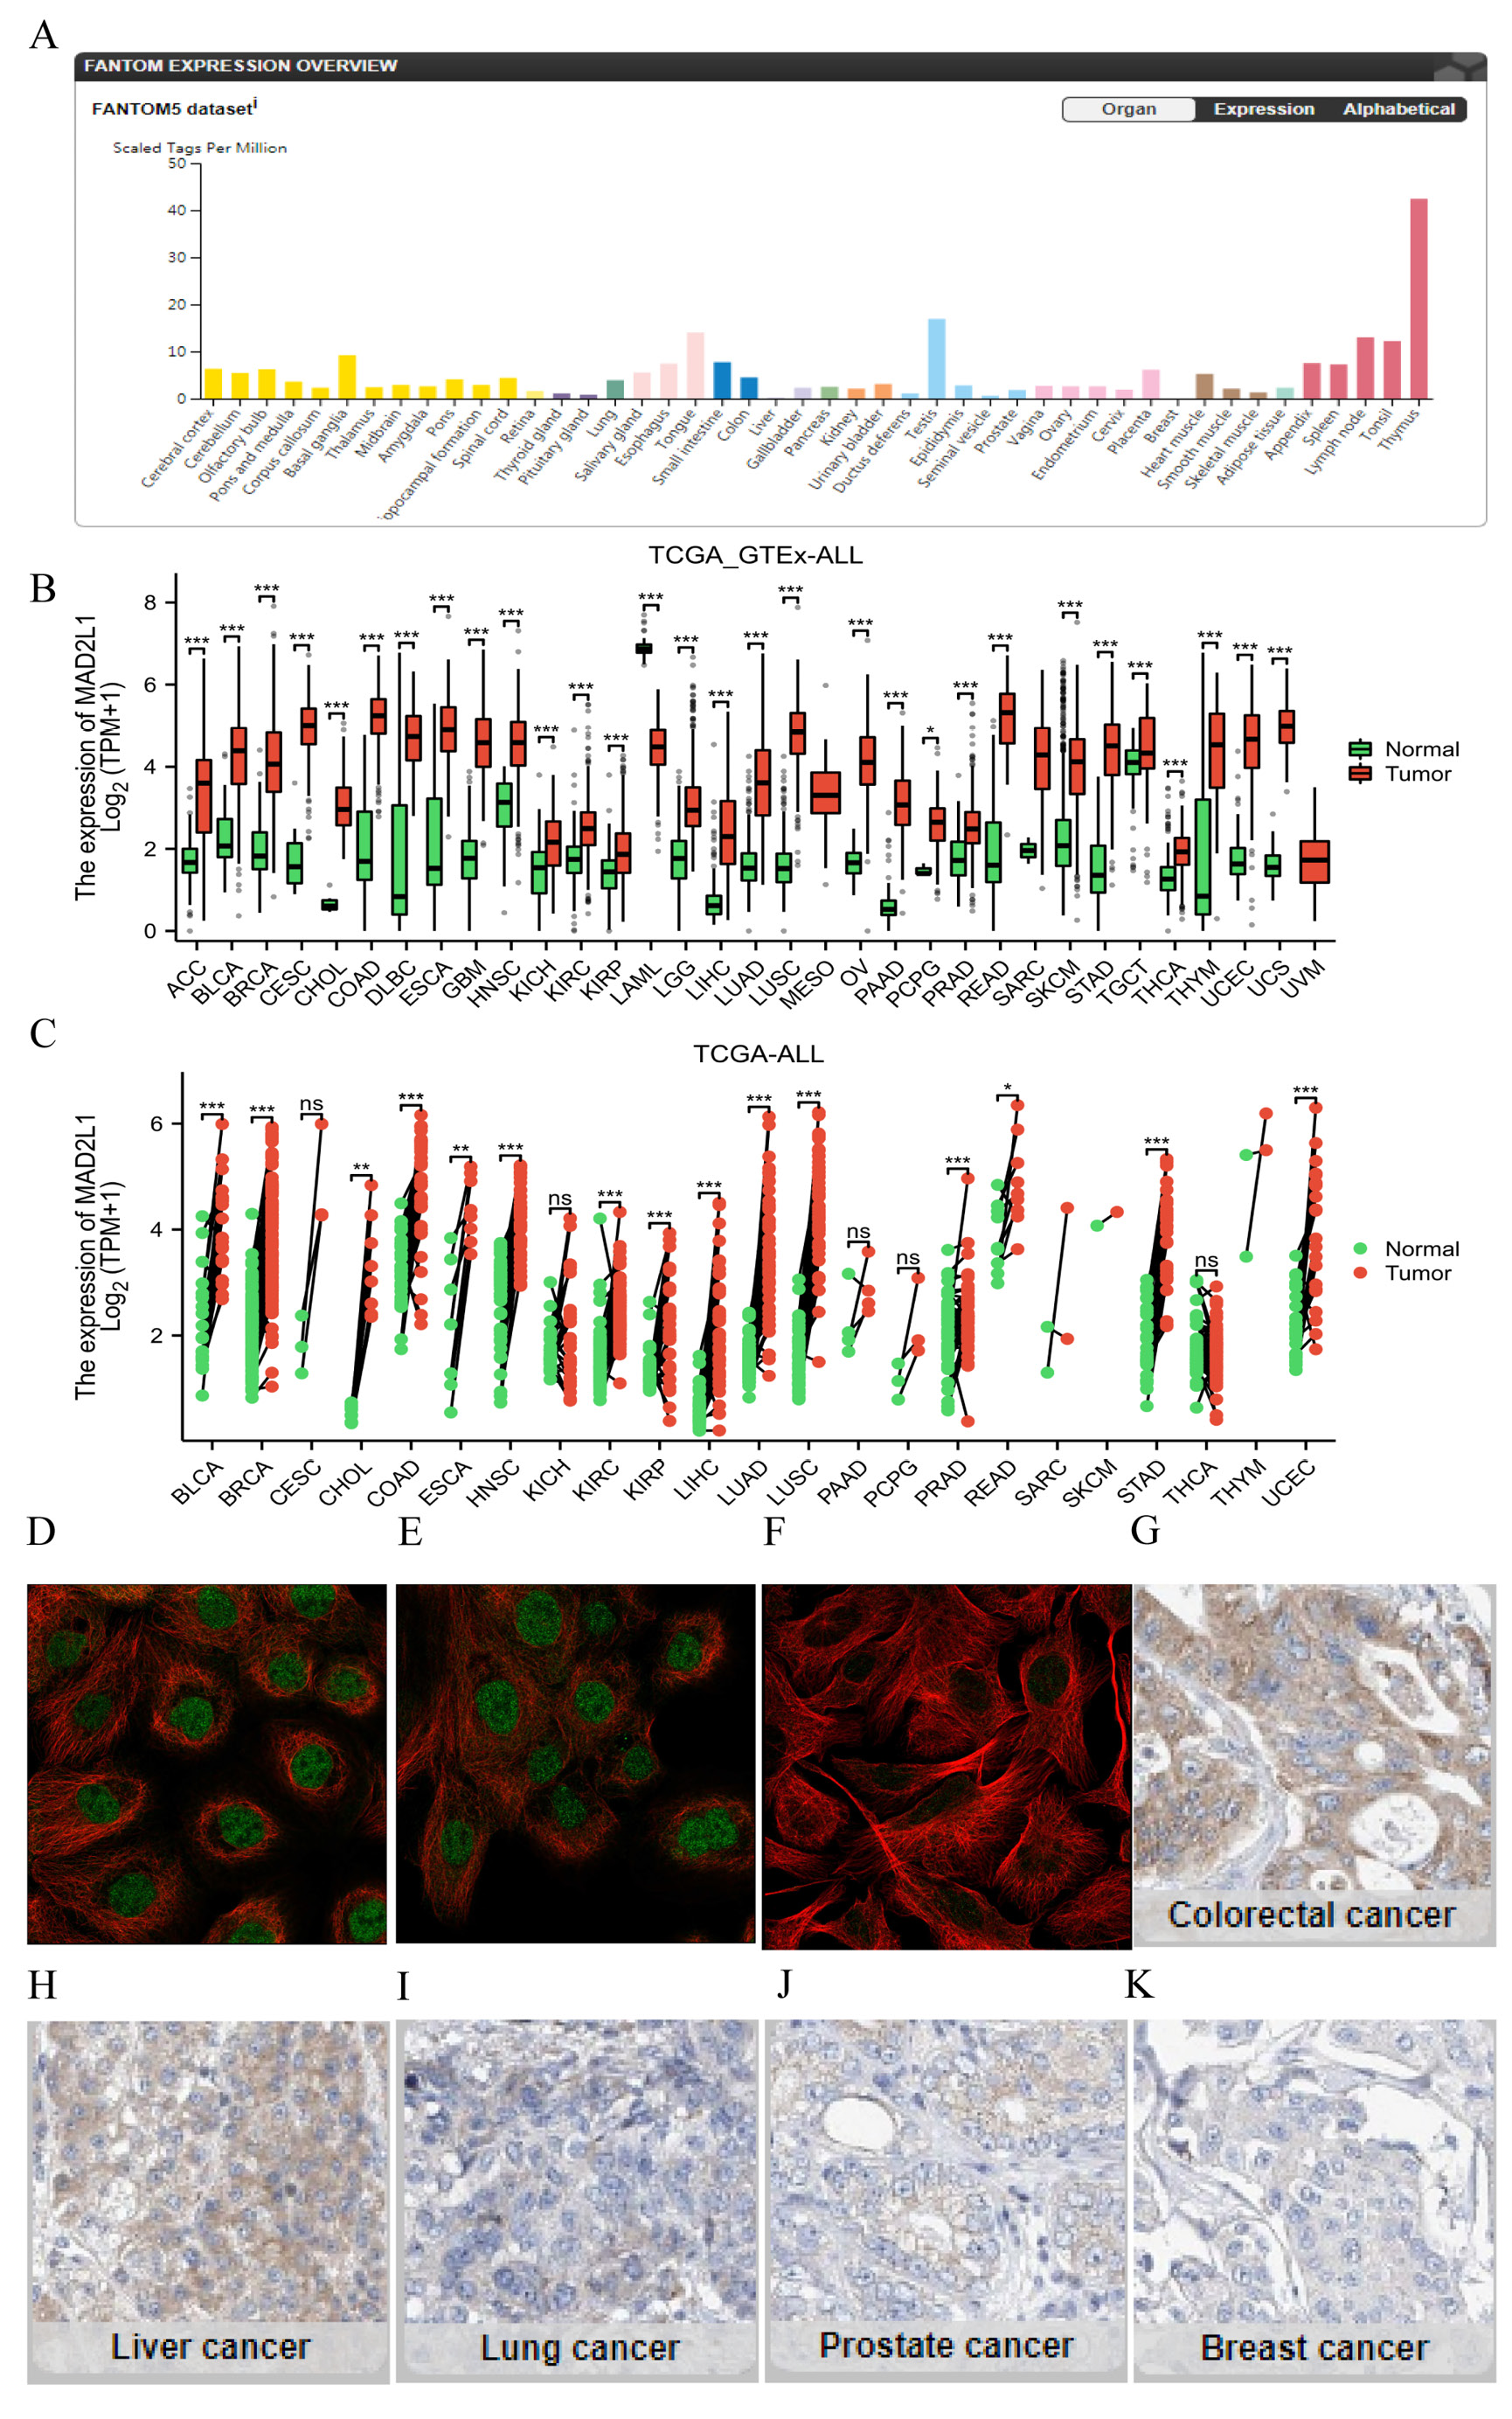
Fig. 1.
The expression levels and localization of MAD2L1. (A) Expression levels of MAD2L1 in normal tissues, as reported by HPA. (B) Comparison of MAD2L1 mRNA expression between tumors and normal tissues from the TCGA and GTE databases. (C) Analysis of MAD2L1 expression in tumors versus paired adjacent normal tissues in the TCGA dataset. (D-F) Subcellular localization of MAD2L1, as derived from the HPA database, highlighting findings in the A-431 cell line: D and E show two independent fields of view from two separate staining experiments of A-431 and F show the U2OS cell line. (G-K) Immunohistochemical images of various cancers sourced from the HPA database.
.
The expression levels and localization of MAD2L1. (A) Expression levels of MAD2L1 in normal tissues, as reported by HPA. (B) Comparison of MAD2L1 mRNA expression between tumors and normal tissues from the TCGA and GTE databases. (C) Analysis of MAD2L1 expression in tumors versus paired adjacent normal tissues in the TCGA dataset. (D-F) Subcellular localization of MAD2L1, as derived from the HPA database, highlighting findings in the A-431 cell line: D and E show two independent fields of view from two separate staining experiments of A-431 and F show the U2OS cell line. (G-K) Immunohistochemical images of various cancers sourced from the HPA database.
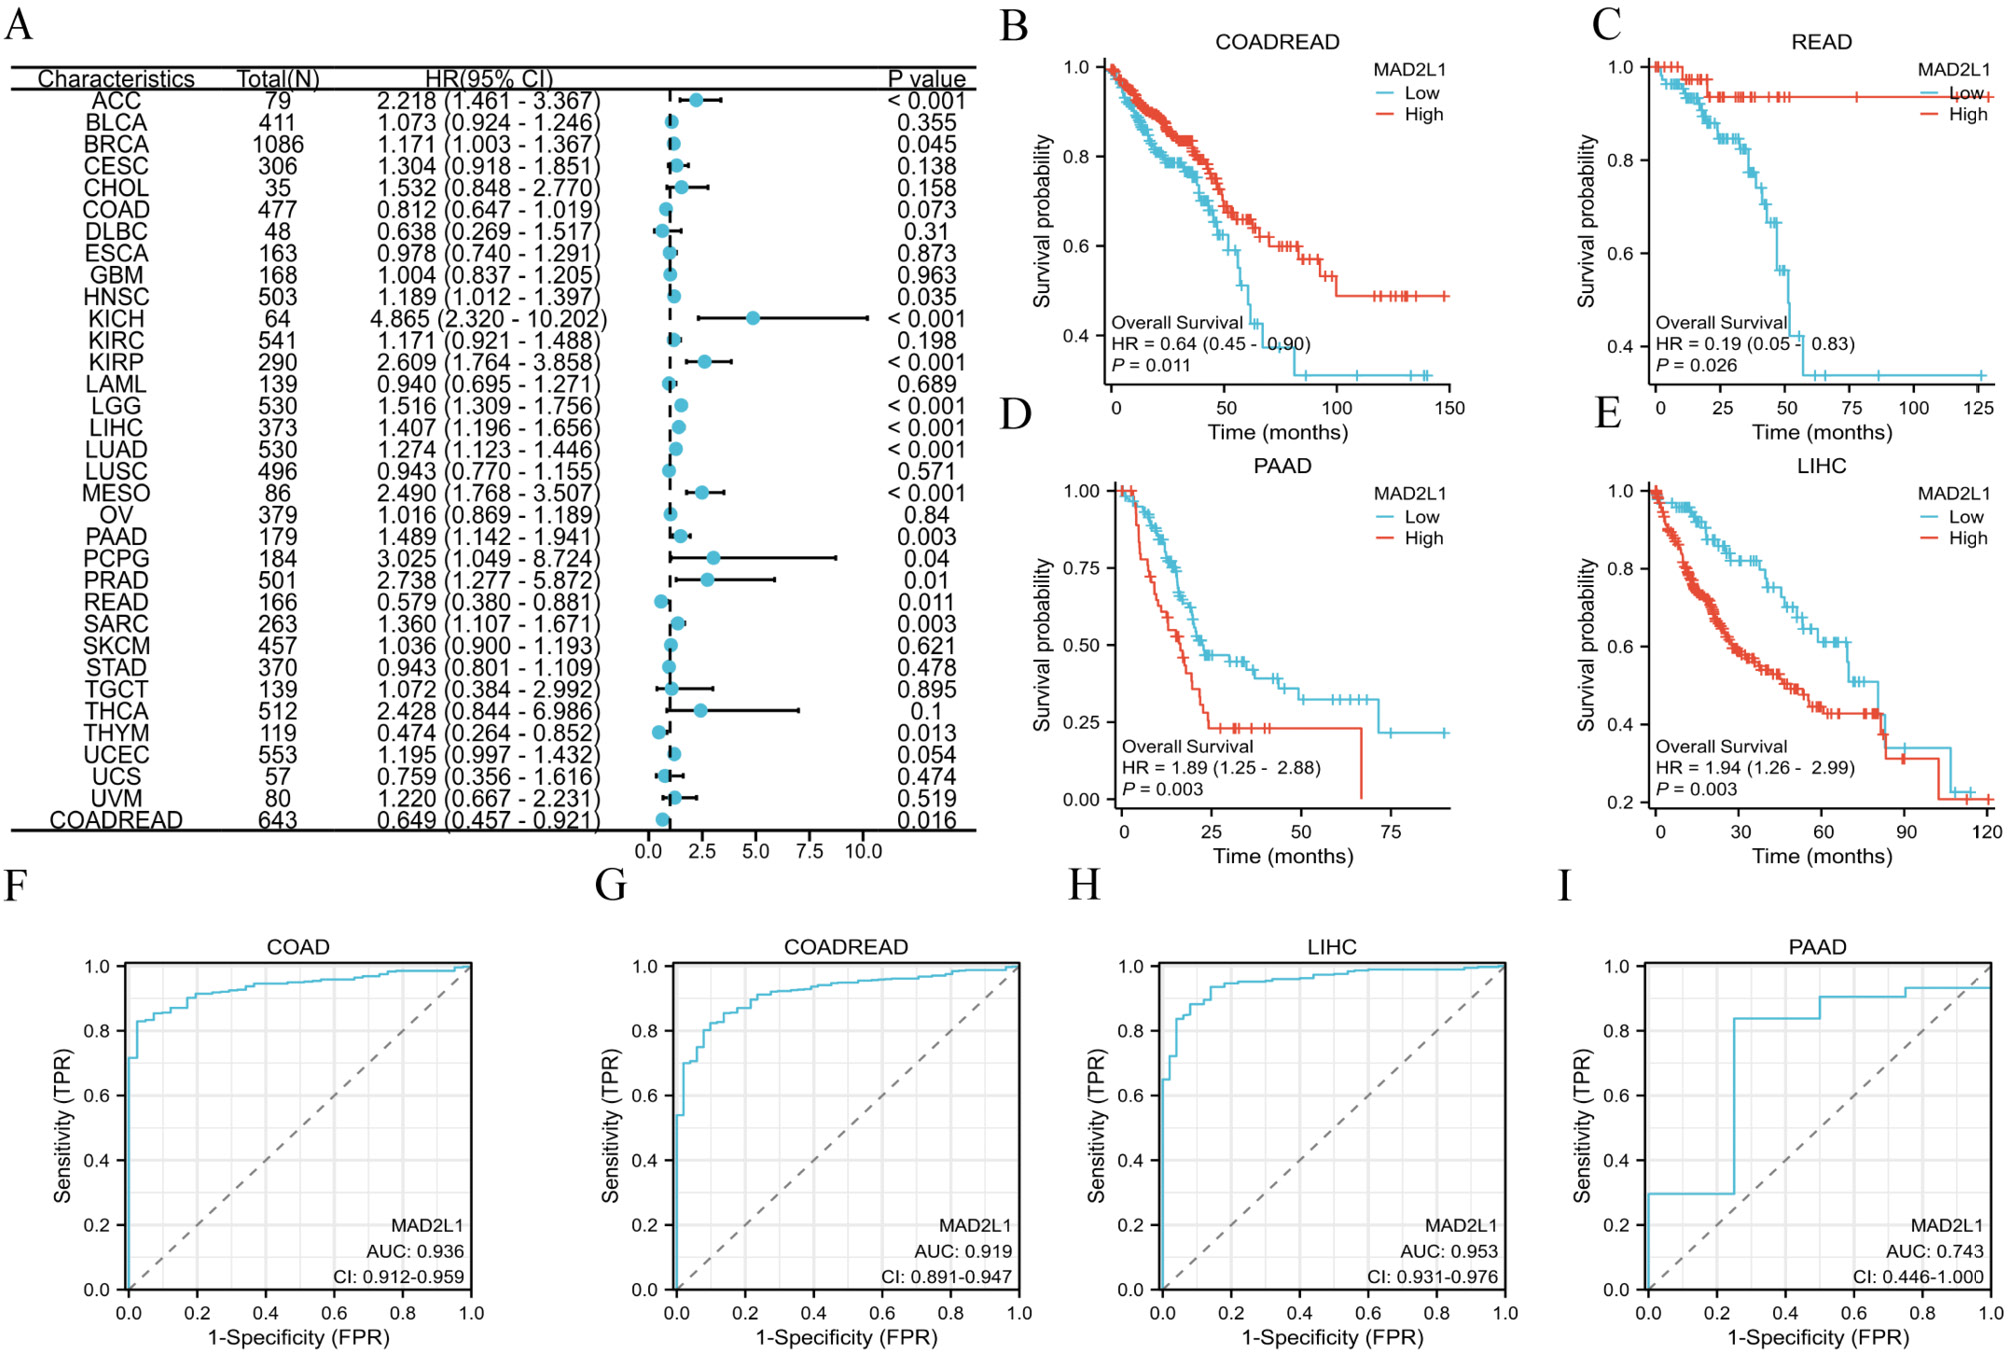
Fig. 2.
Differential Diagnostic and Prognostic Impact of MAD2L1 in COAD and READ. (A) Forest plot of univariate Cox analysis of MAD2L1 in colorectal cancer. (B and C) KM survival curve of MAD2L1 high and low expression groups in CRC. (D and E) The diagnostic value of MAD2L1 is assessed through ROC curve analysis in CRC.
.
Differential Diagnostic and Prognostic Impact of MAD2L1 in COAD and READ. (A) Forest plot of univariate Cox analysis of MAD2L1 in colorectal cancer. (B and C) KM survival curve of MAD2L1 high and low expression groups in CRC. (D and E) The diagnostic value of MAD2L1 is assessed through ROC curve analysis in CRC.
Correlation of MAD2L1 expression with CRC prognosis and diagnosis
Forest plot and Cox regression analyses (Table S3) identify MAD2L1 as a detrimental prognostic indicator for overall survival (OS) in multiple cancers, such as ACC, HNSC, among others (*P < 0.05, HR > 1, Fig. 2A). In contrast, MAD2L1 may act as a favorable prognostic factor in READ, THYM, and COADREAD (*P < 0.05, HR < 1). The research also underscores a significant link between elevated MAD2L1 expression and poor outcomes in gastrointestinal cancers, notably in COADREAD (Fig. 2B, P = 0.011), READ (Fig. 2C, P = 0.028), PAAD (Fig. 2D, P = 0.003), and LIHC (Fig. 2E, P = 0.003). Particularly in READ and COADREAD, lower expression levels of MAD2L1 are associated with worse prognoses. Diagnostic assessments using ROC curves demonstrate MAD2L1's high diagnostic precision for COAD (AUC = 0.935) (Fig. 2F), COADREAD (AUC = 0.919) (Fig. 2G), and LIHC (AUC = 0.963) (Fig. 2H), with moderate accuracy for PAAD (AUC = 0.743) (Fig. 2I). Thus, MAD2L1 serves as a crucial biomarker for both prognosis and diagnosis in COAD, READ, and COADREAD.
Investigation into pan-cancer genetic alterations in MAD2L1 via cBioPortal shows that mutations in MAD2L1 occur in less than 1% of the analyzed samples (Fig. 3A). Fig. 3B demonstrates significant amplification of MAD2L1 in SARC, prevalent mutations in UCEC, and the highest frequency of "deep deletions" in PRAD. Furthermore, Fig. 3C reveals that missense and truncation mutations predominate in MAD2L1 across the main cancer types.
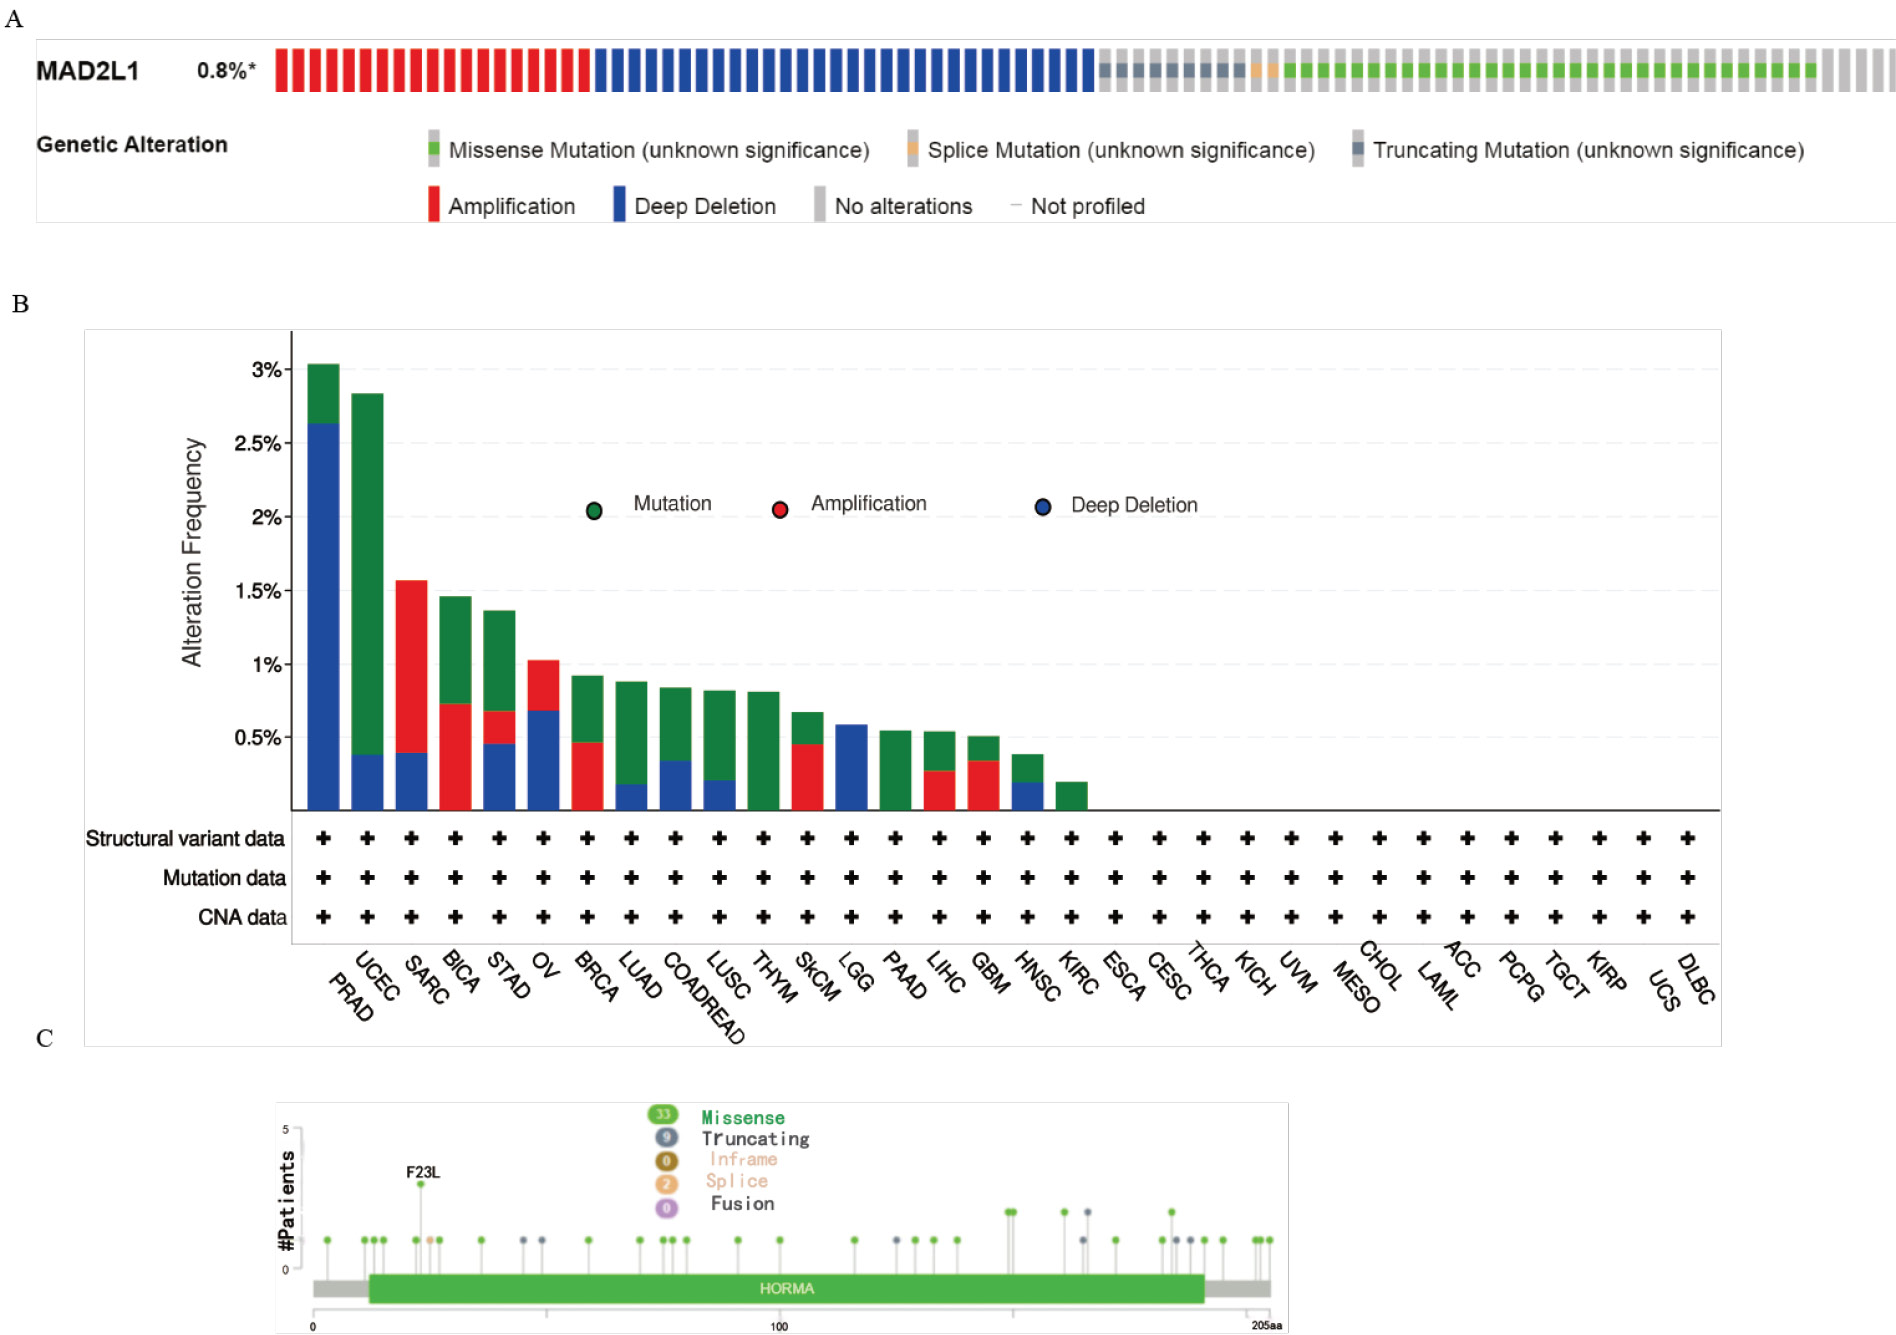
Fig. 3.
Analysis of genetic changes. (A) Genetic alterations of MAD2L1 in pan-cancer tissues (B) Frequency of MAD2L1 mutation types in different cancers. (C) The mutation site of MAD2L1 in pan-cancer.
.
Analysis of genetic changes. (A) Genetic alterations of MAD2L1 in pan-cancer tissues (B) Frequency of MAD2L1 mutation types in different cancers. (C) The mutation site of MAD2L1 in pan-cancer.
Analysis of epigenetic changes
We compared the levels of MAD2L1 promoter DNA methylation in 22 different cancer types with those in normal tissues (Fig. S1, Table S4). Notably, MAD2L1 exhibited hypermethylation in several cancers, including BRCA, CESC, among others (Fig. S1A). In contrast, it was hypomethylated in BLCA, HNSC, KIRP, LUAD, PCPG, PRAD, READ, STAD, THCA, and UCEC. Utilizing the MethSurv database, we pinpointed 10 CpG sites specific to MAD2L1 in COAD (Fig. S1B). In recent years, the role of RNA methylation modifications in biological functions and disease progression, particularly in oncology, has received heightened attention.
These modifications play crucial roles in various cellular activities. Common mRNA modifications include m1A, m5C, and m6A are regulated by three classes of proteins: writers, erasers, and readers (Fig. S2, Table S5). Our findings, demonstrate a positive correlation between MAD2L1 expression and the predominant m1A (Fig. S2A), m5C (Fig. S2B), and m6A (Fig. S2C) modifications across pan-cancer samples. This data suggests a significant link between MAD2L1 expression and both DNA methylation and mRNA modifications in a variety of cancers, including CRC.
MAD2L1 expression and immune infiltration
The dynamics within the tumor microenvironment (TME) are integral to tumor development, metastasis, and prognosis. Employing the EPIC online tool, we investigated MAD2L1's association with immune cell infiltration within the TME (Table S6). In malignancies including BRCA, kidney renal papillary cell carcinoma (KIRP), LUAD, and thymoma (THYM), our results demonstrated a connection between MAD2L1 expression and 6 immune cell types (Fig. 4A). Furthermore, we assessed the significance of ICP genes in relation to immune infiltration and the efficacy of immunotherapy. We found that genes linked to bladder cancer (BLCA), BRCA, COAD, kidney renal clear cell carcinoma (KIRC), lower grade glioma (LGG), LUAD, testicular germ cell tumors (TGCT), and uterine corpus endometrial carcinoma (UCEC) are connected to ICP genes, demonstrating substantial differences (Fig. 4B, Table S7). The ESTIMATE score, a measure of tumor purity and immune cell presence, exhibited an inverse relationship with MAD2L1 expression in COAD (Fig. 4C). Extensive analysis uncovered notable differences in the enrichment scores of B cells, eosinophils, regulatory T cells (TReg), natural killer (NK) cells, and Th2 cells between groups with varying MAD2L1 expression levels in COAD (Fig. 4D). These findings suggest that MAD2L1 may play a critical role in modulating tumor immunity by influencing both immune cell infiltration and ICP gene activity across various types of cancer.
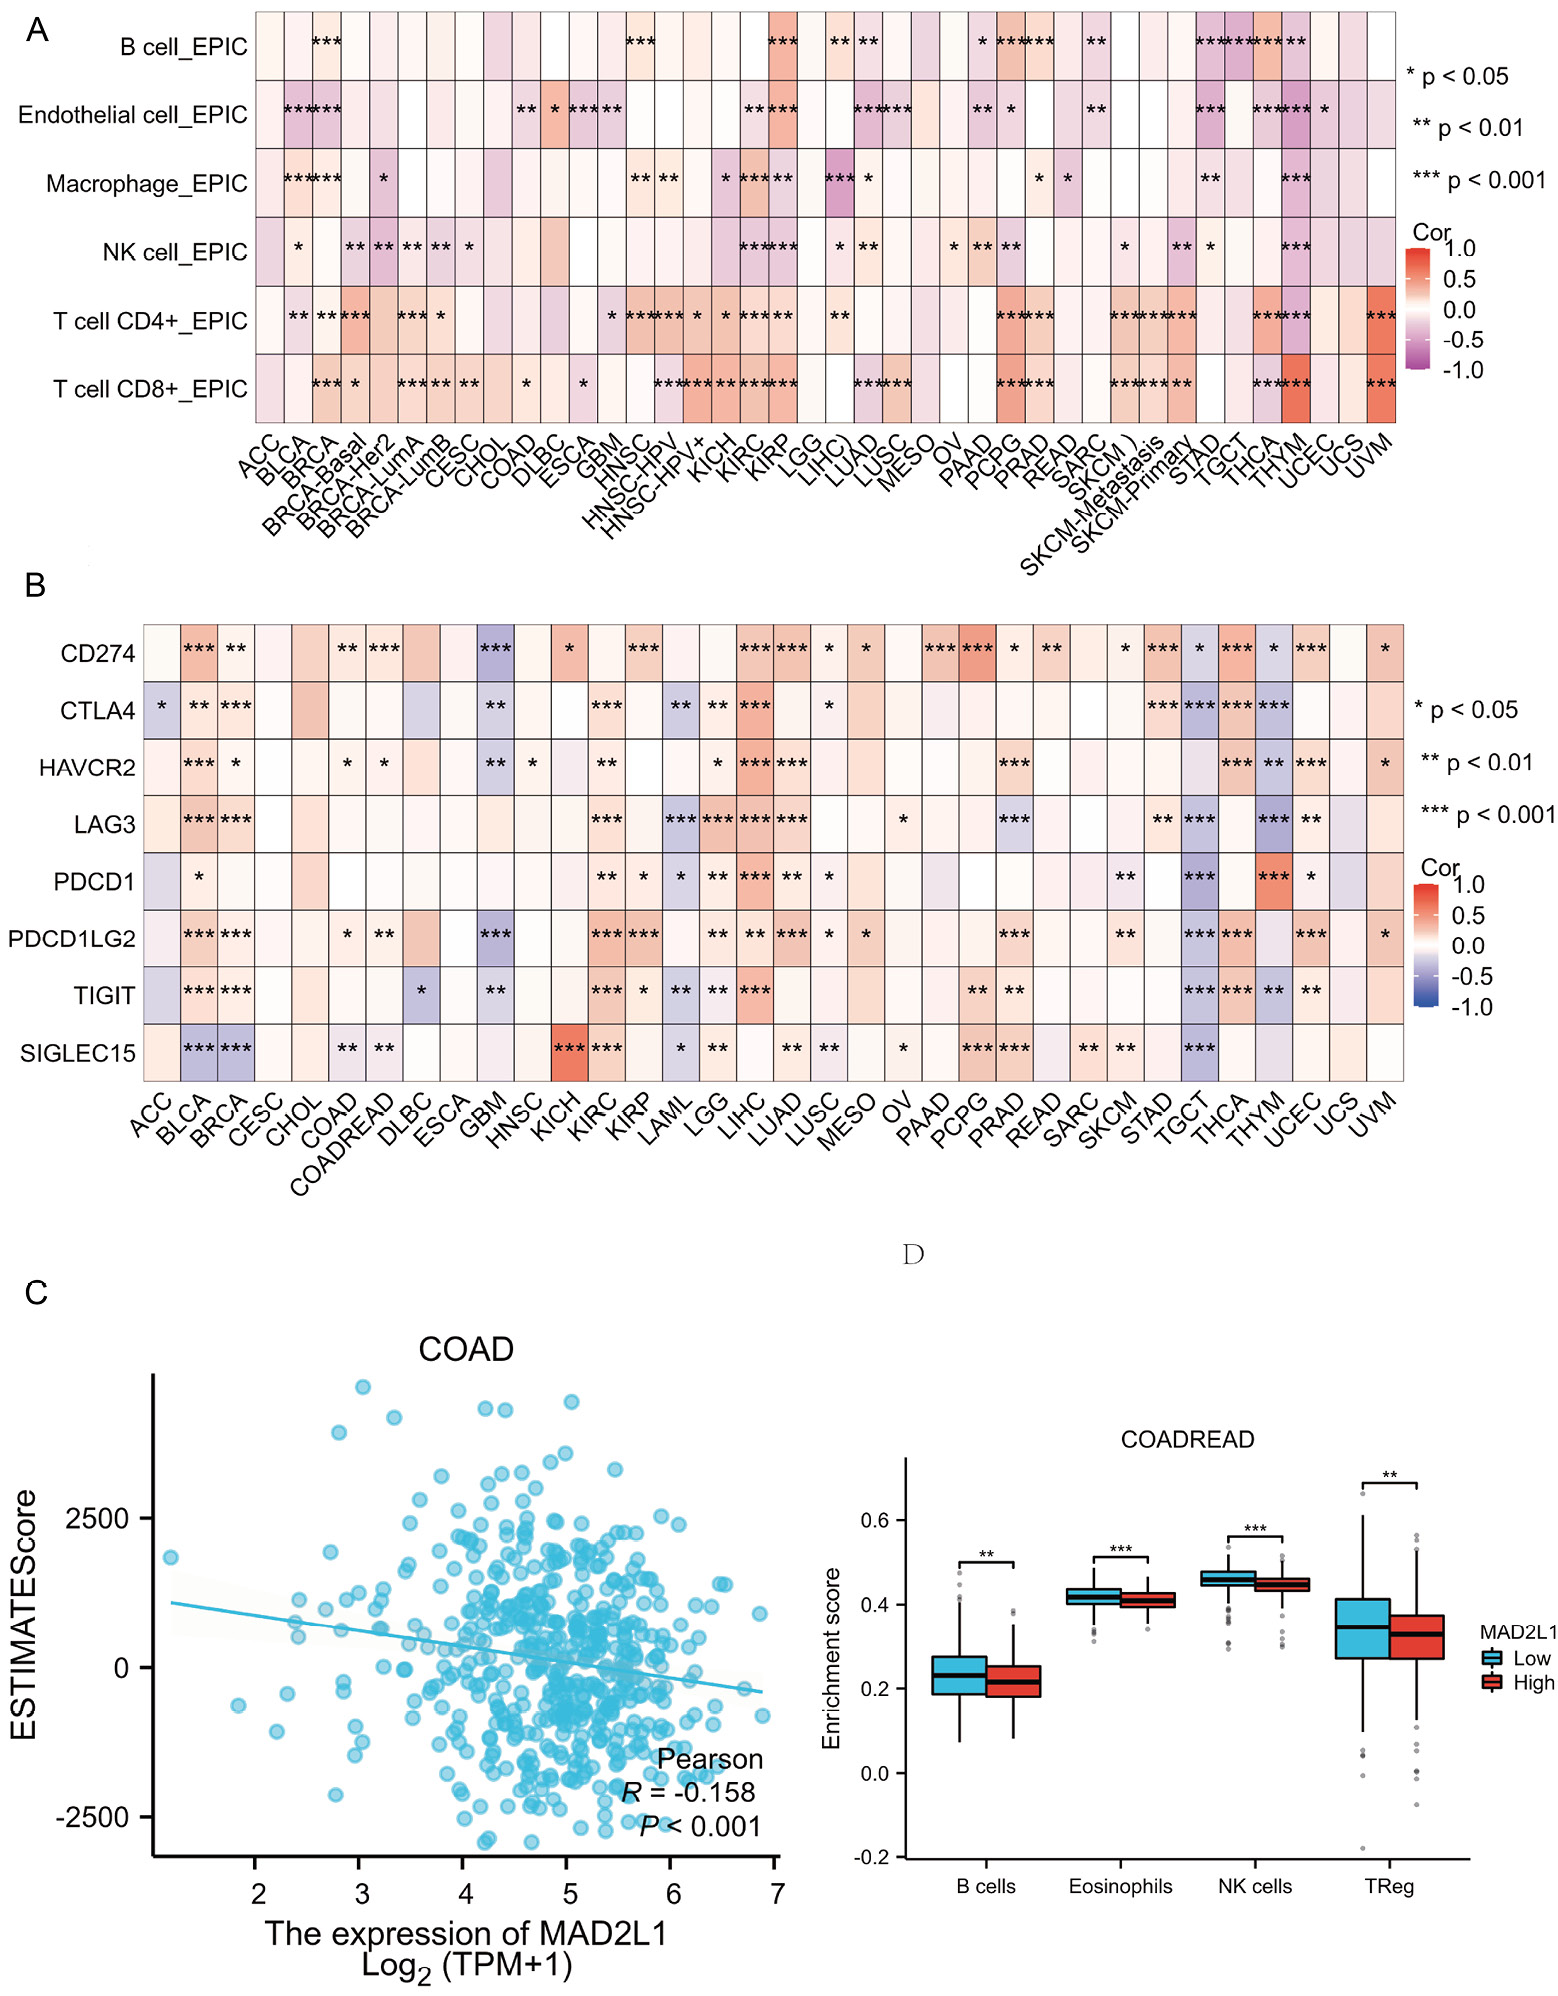
Fig. 4.
Correlation analysis of MAD2L1 expression and immune infiltration. (A) The relationship between MAD2L1 expression and immune cell infiltration is illustrated. (B) A correlation analysis of MAD2L1 expression and immune checkpoints in pan-cancer tissues is provided. (C) The association between MAD2L1 mRNA expression and the estimated score in COAD is depicted. (D) Enrichment fractions for the MAD2L1 high-expression group and low-expression group across various immune cells in COAD are shown.
.
Correlation analysis of MAD2L1 expression and immune infiltration. (A) The relationship between MAD2L1 expression and immune cell infiltration is illustrated. (B) A correlation analysis of MAD2L1 expression and immune checkpoints in pan-cancer tissues is provided. (C) The association between MAD2L1 mRNA expression and the estimated score in COAD is depicted. (D) Enrichment fractions for the MAD2L1 high-expression group and low-expression group across various immune cells in COAD are shown.
Copper apoptosis-related genes in pan-cancer and their relationship with MAD2L1 expression
In our investigation into the correlation between MAD2L1 expression and genes linked to copper-induced apoptosis in various cancers, a gene co-expression network analysis was conducted (Fig. S3, Table S8). According to these results, MAD2L1 expression is positively correlated with most genes linked to copper-induced cell death. Specifically, three copper-associated genes—MTF1, DLAT, and DLD—were significantly correlated with MAD2L1 expression across multiple cancer categories, suggesting an influential role for MAD2L1 in the regulation of genes implicated in copper-induced apoptosis.
Construction of lncRNAs-miRNA-MAD2L1 network in CRC
By employing the miRwalk, DIANA-microT, miRcode, and miRDIP databases, we identified target miRNAs of MAD2L1 specific to CRC, detailed in shown in Fig. 5A (Table S9). Analysis across these platforms predicted a set of 115 common miRNAs. Further investigation using Starbase 2.0 enabled us to identify target long non-coding RNAs (lncRNAs) associated with 23 of these miRNAs. Typically, miRNA expression inversely impacts mRNA expression.31 Notably, MAD2L1 expression was inversely correlated with 14 target lncRNAs, including hsa-miR-23a-3p, hsa-miR-139-5p, and hsa-miR-212-5p (Fig. 5B). LncRNAs often function as competitive endogenous RNAs, modulating mRNA levels.32 This led to the establishment of a regulatory network involving lncRNAs, miRNAs, and MAD2L1 in colorectal cancer (Figs. 5C and 5D, Table S10 and Table S11).
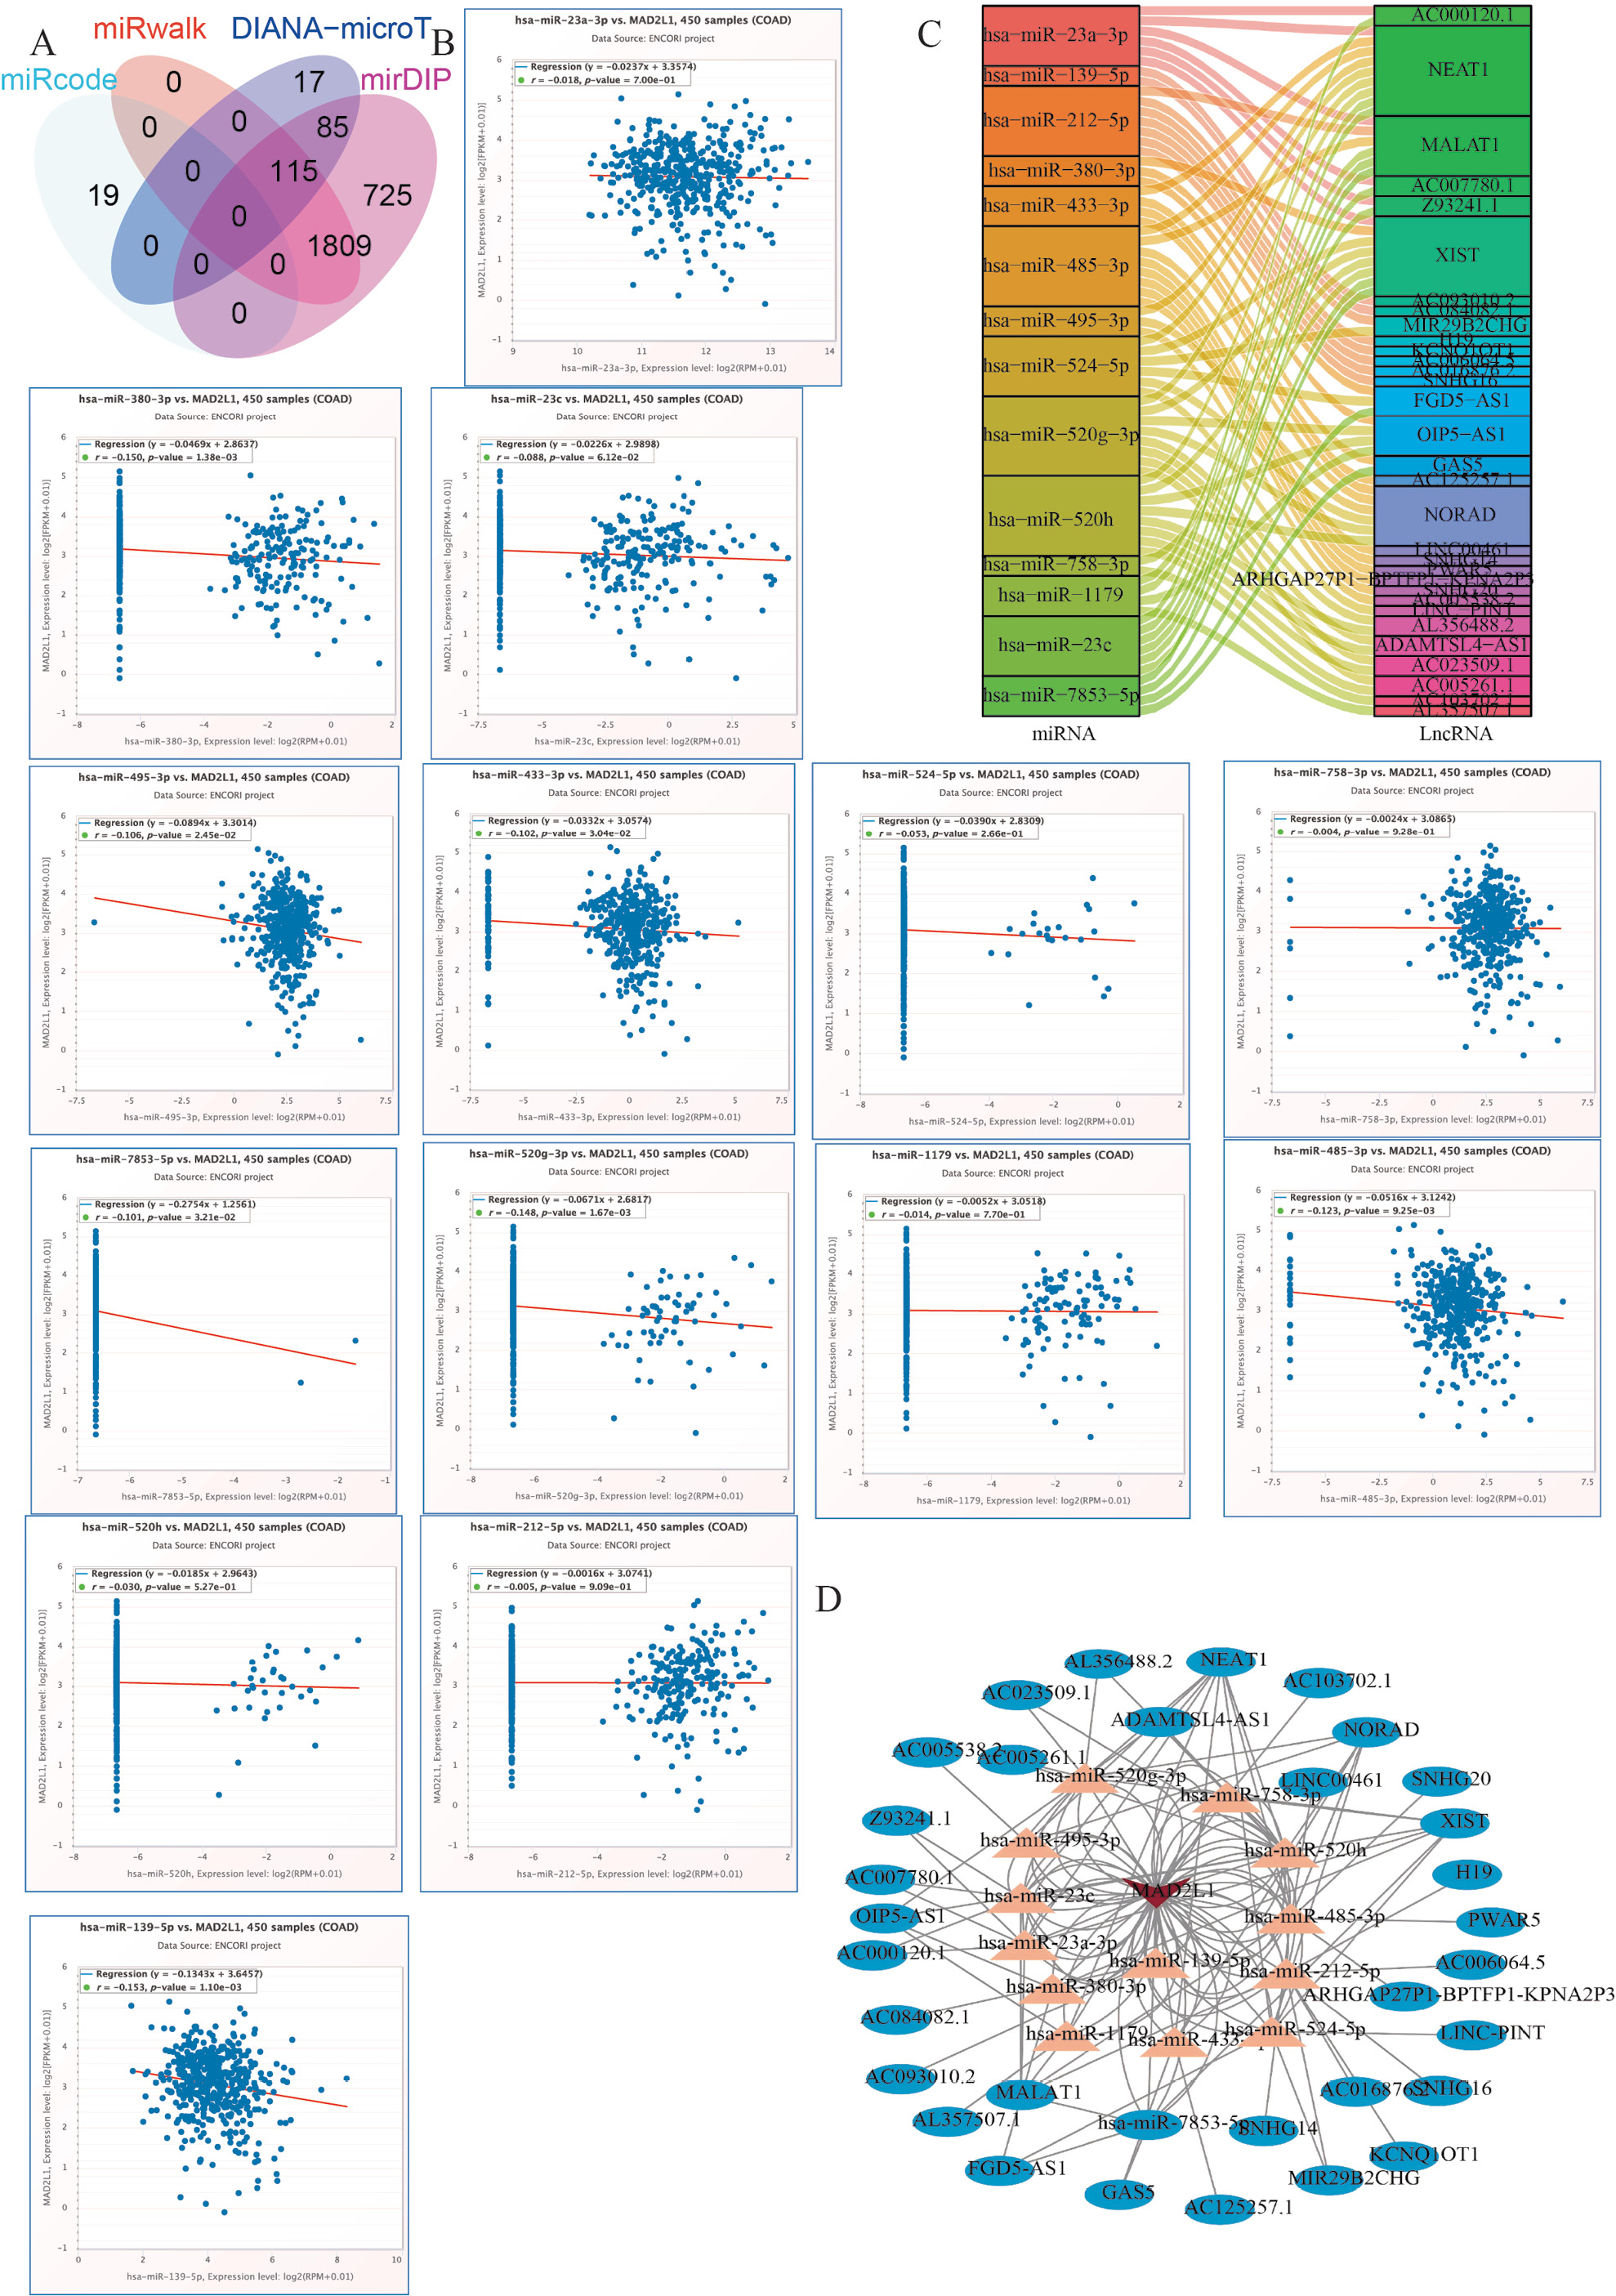
Fig. 5.
MAD2L1-related pivotal ceRNA network construction in CRC. (A) A Venn diagram displays the predicted target miRNAs for MAD2L1 identified through DIANA-microT, miRwalk, miRcode, and miRDIP. (B) A scatter plot presents the correlation analysis between MAD2L1 and its target miRNAs. (C) A Sankey diagram depicts the relationship between target miRNAs and their corresponding lncRNAs. (D) Cytoscape was utilized to construct a regulatory network diagram encompassing lncRNA, miRNA, and MAD2L1.
.
MAD2L1-related pivotal ceRNA network construction in CRC. (A) A Venn diagram displays the predicted target miRNAs for MAD2L1 identified through DIANA-microT, miRwalk, miRcode, and miRDIP. (B) A scatter plot presents the correlation analysis between MAD2L1 and its target miRNAs. (C) A Sankey diagram depicts the relationship between target miRNAs and their corresponding lncRNAs. (D) Cytoscape was utilized to construct a regulatory network diagram encompassing lncRNA, miRNA, and MAD2L1.
Pan-cancer sensitivity of MAD2L1-related drugs
The CTPR dataset reveals a correlation between the mRNA expression levels of MAD family members (MAD1L1, MAD2L1, MAD2L2) and drug sensitivity. The three drugs most closely associated with elevated MAD2L1 expression include BRD-K99006945, PD318088, and BRD-K99006945 (Fig. 6A, Table S12; *P < 0.05). According to the GDSC drug sensitivity analysis, trametinib, selumetinib, and RDEA119 are the top drugs positively correlated with MAD2L1 expression (Fig. 6C, Table S14; ****P < 0.0001). Several drugs identified through both the CTRP and GDSC analyses have been used in scientific studies, resulting in the documentation of 87 (Fig. 6B, Table S13) and 25 (Fig. 6D, Table S15) FDA-approved MAD2L1-related anti-tumor drugs.
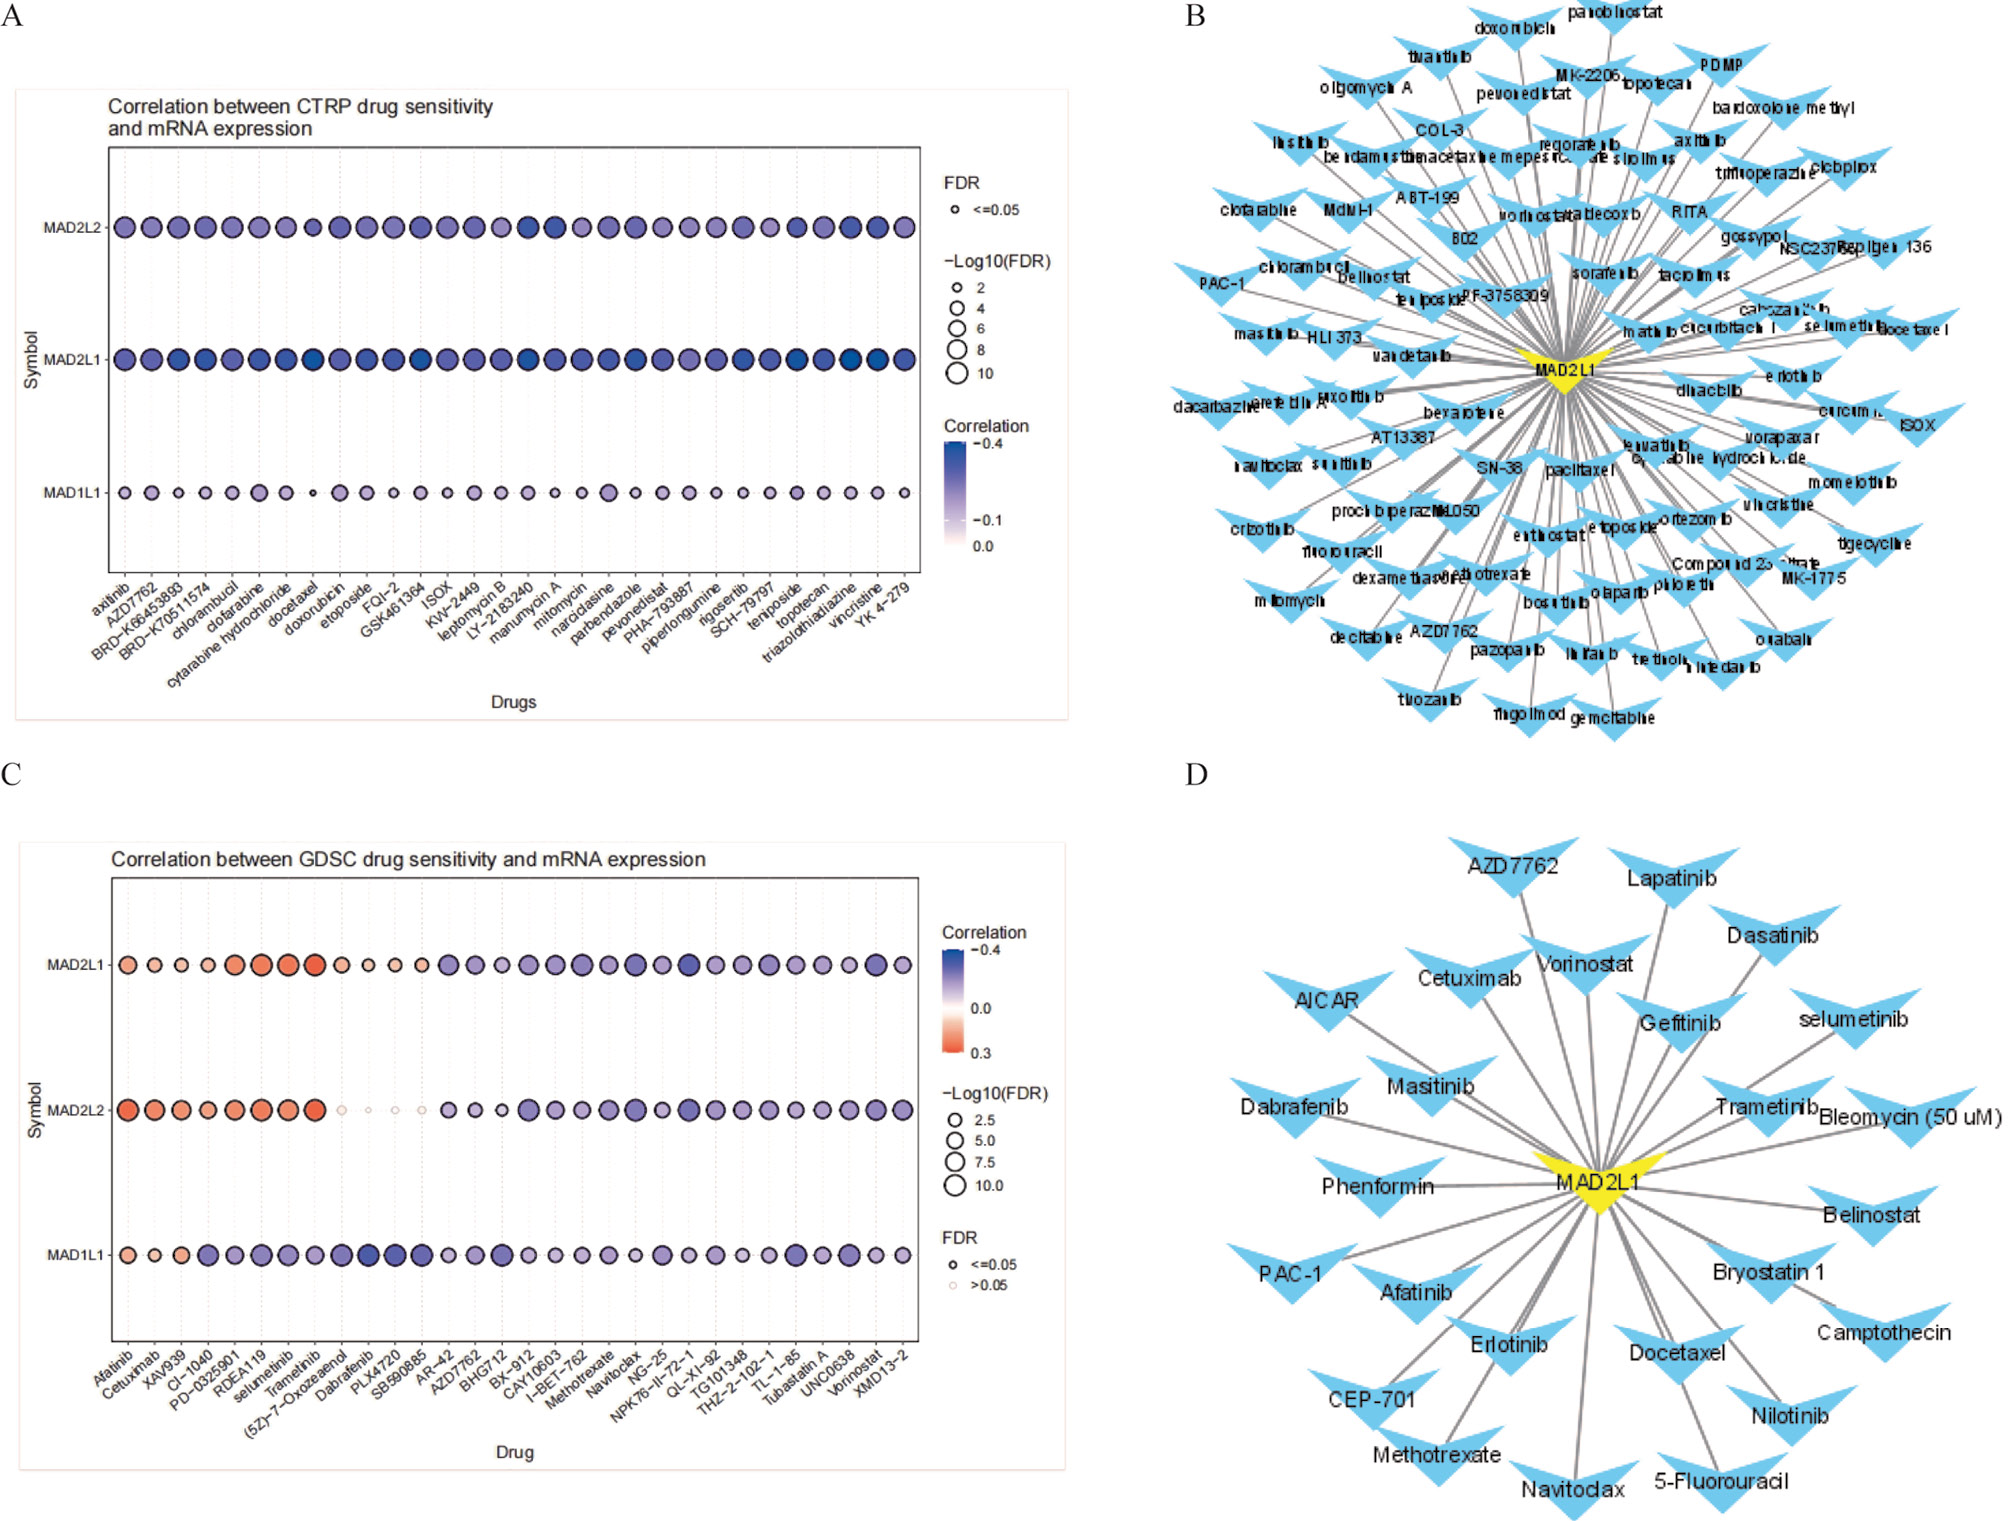
Fig. 6.
Drug sensitivity of MAD2L1-related drugs in pan-cancer tissues. (A) It depicts the relationship between CTRP drug sensitivity and the mRNA expression levels of MAD2L1, MAD2L2, and MAD1L1. (B) This panel lists FDA-approved chemotherapy drugs related to MAD2L1, identified through CTRP drug sensitivity analysis. (C) It shows the correlation between GDSC drug sensitivity and the mRNA expression levels of MAD2L1, MAD2L2, and MAD1L1. (D) Finally, this panel presents FDA-approved anticancer drugs related to MAD2L1, derived from GDSC drug sensitivity assessments.
.
Drug sensitivity of MAD2L1-related drugs in pan-cancer tissues. (A) It depicts the relationship between CTRP drug sensitivity and the mRNA expression levels of MAD2L1, MAD2L2, and MAD1L1. (B) This panel lists FDA-approved chemotherapy drugs related to MAD2L1, identified through CTRP drug sensitivity analysis. (C) It shows the correlation between GDSC drug sensitivity and the mRNA expression levels of MAD2L1, MAD2L2, and MAD1L1. (D) Finally, this panel presents FDA-approved anticancer drugs related to MAD2L1, derived from GDSC drug sensitivity assessments.
Co-expression genes and functional analysis of MAD2L1 in CRC
Initially, the TCGA database was used to identify genes that were co-expressed (Table S16). The top 30 genes that were up-regulated and down-regulated were displayed in heat maps (Figs. 7A and B).
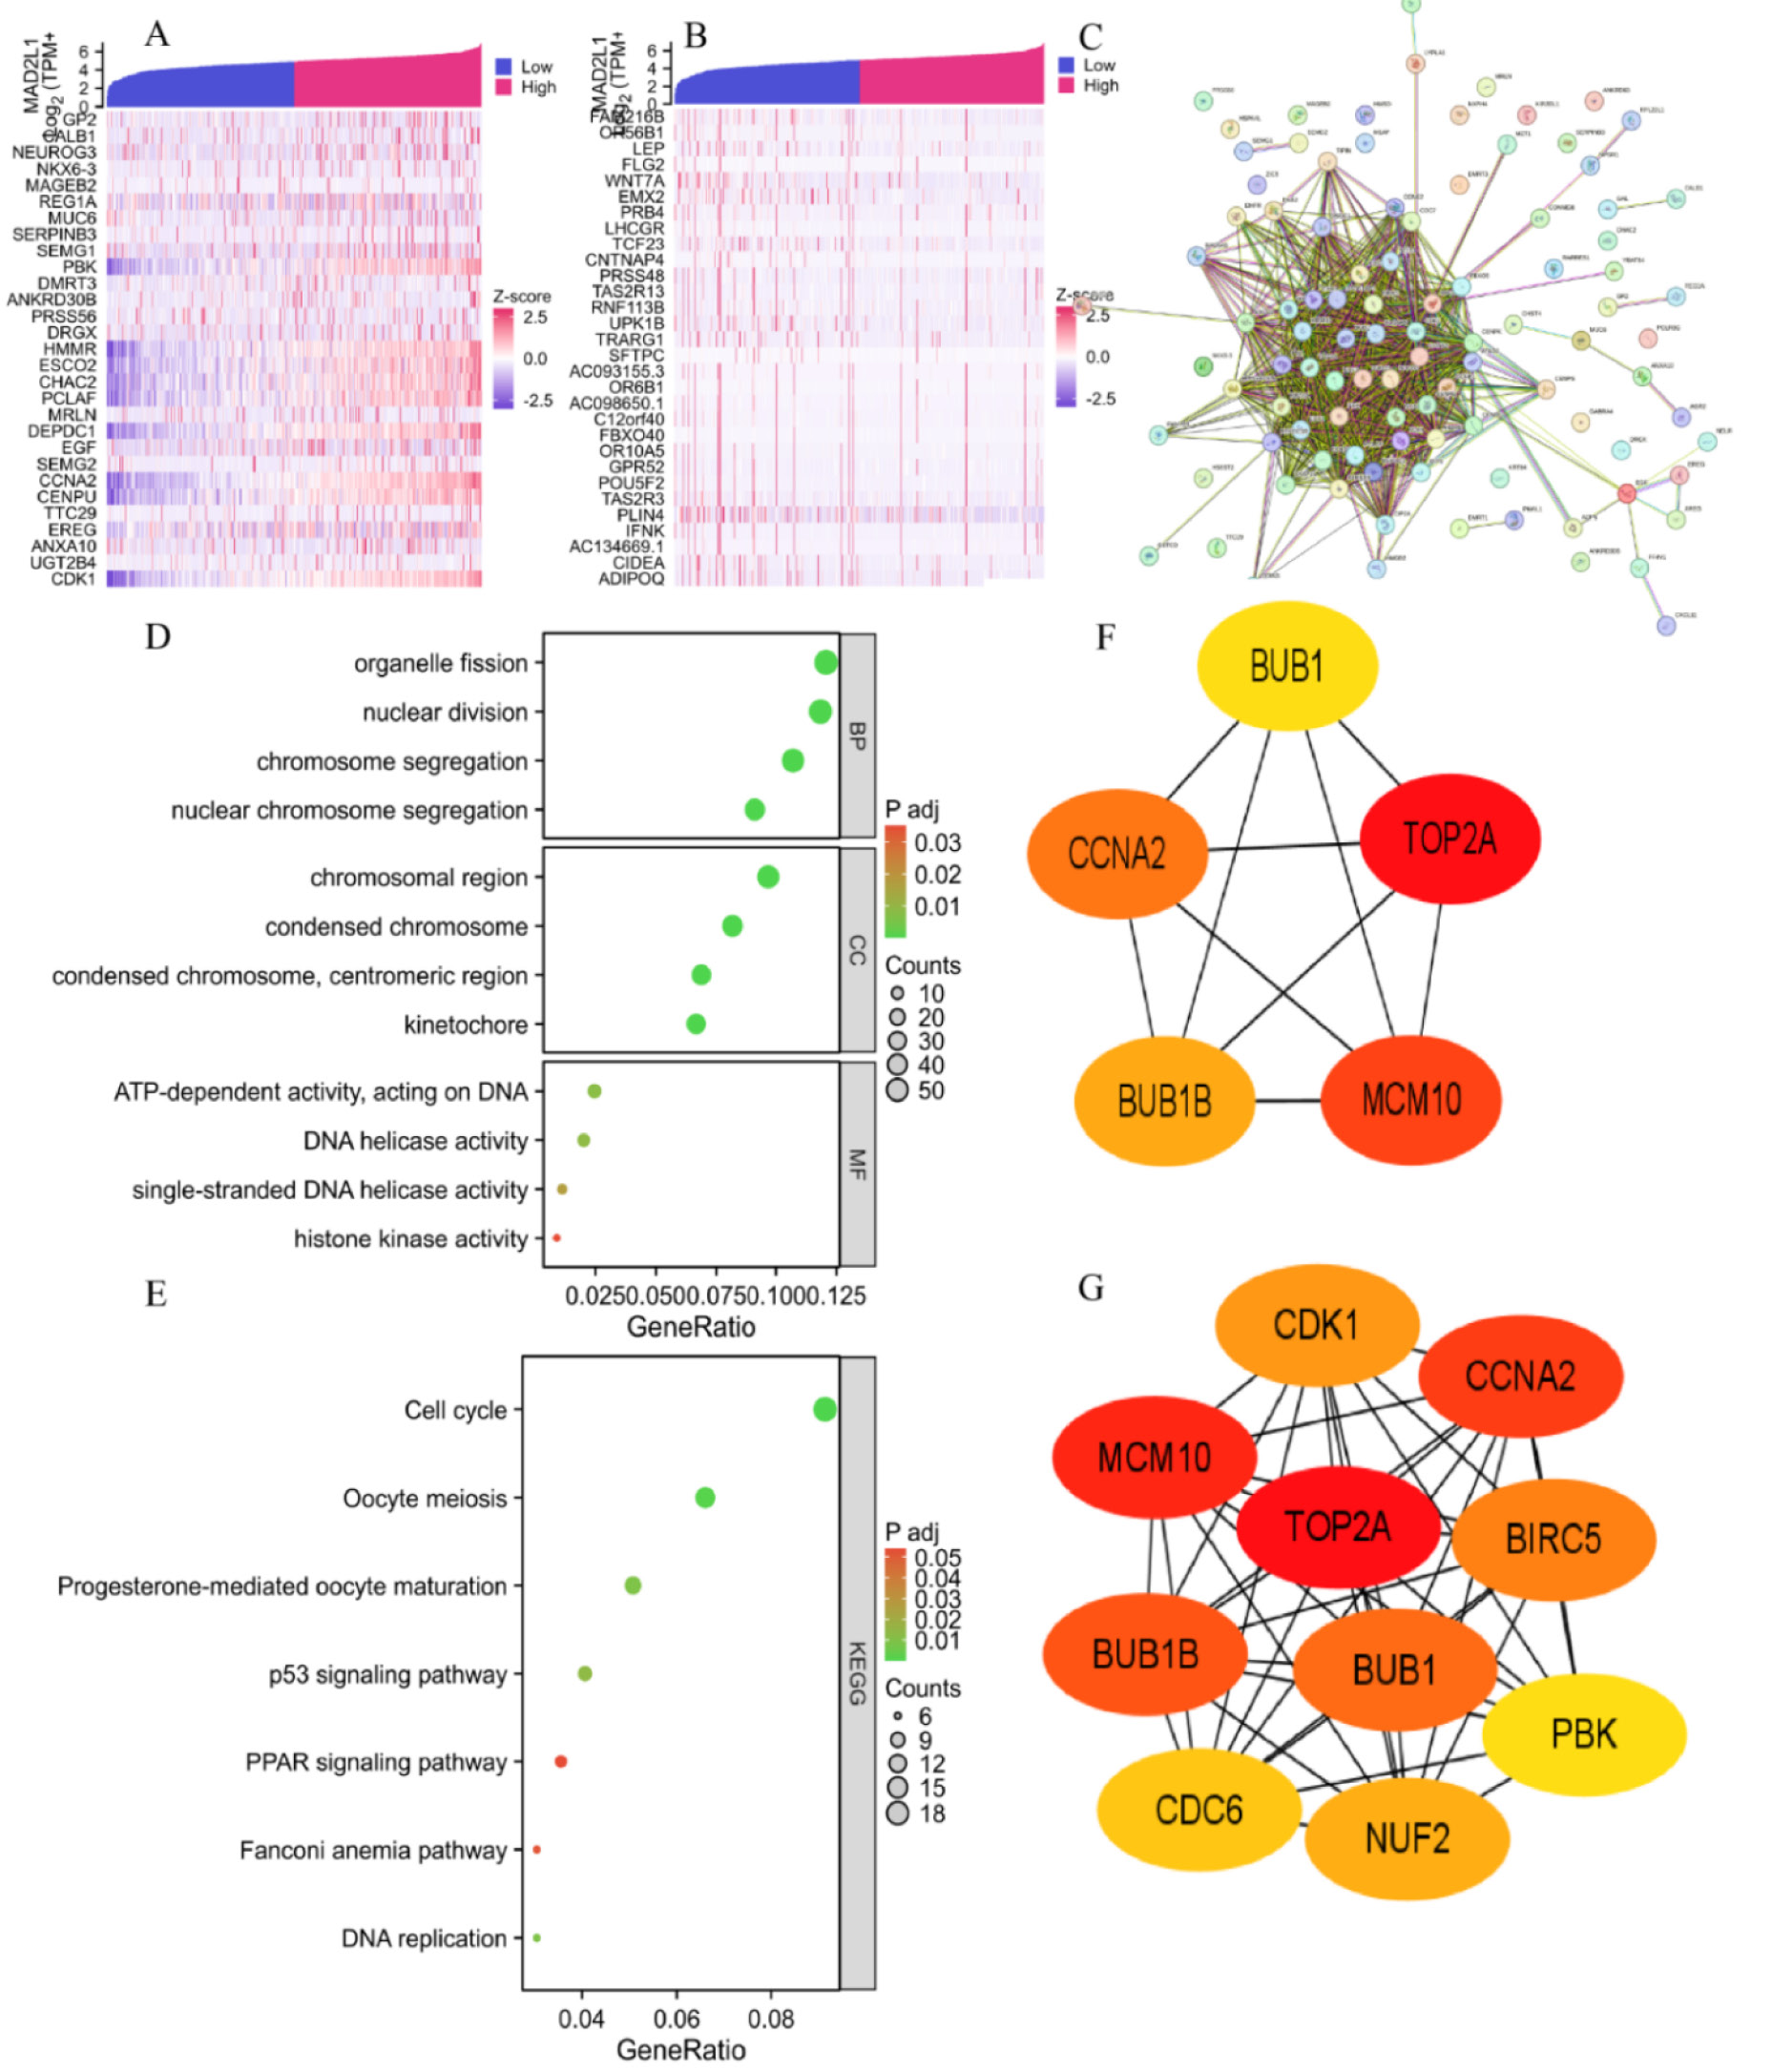
Fig. 7.
The functional analysis of co-expressed related genes and MAD2L1 expression in COAD is presented. (A and B) A heat map illustrates the top 30 upregulated and downregulated co-expressed genes associated with MAD2L1. (C) A protein-protein interaction (PPI) network is depicted, highlighting the top 100 genes positively correlated with MAD2L1 expression. (D and E) Gene Ontology (GO) analysis and Kyoto Encyclopedia of Genes and Genomes (KEGG) pathways are provided for MAD2L1 and 500 co-expressed genes. (F and G) The analysis identifies the top 5 and top 10 central genes within the network.
.
The functional analysis of co-expressed related genes and MAD2L1 expression in COAD is presented. (A and B) A heat map illustrates the top 30 upregulated and downregulated co-expressed genes associated with MAD2L1. (C) A protein-protein interaction (PPI) network is depicted, highlighting the top 100 genes positively correlated with MAD2L1 expression. (D and E) Gene Ontology (GO) analysis and Kyoto Encyclopedia of Genes and Genomes (KEGG) pathways are provided for MAD2L1 and 500 co-expressed genes. (F and G) The analysis identifies the top 5 and top 10 central genes within the network.
The top 100 co-expressed genes that show a positive connection with MAD2L1 expression are highlighted in the PPI network (Fig. 7C). Utilizing the Cytohubba plugin and the EPC algorithm, we identified the five principal hub genes as CCNA2, BUB1B, TOP2A, BUB1, and MCM10 (Fig. 7F), and the top 10 hub genes included CDK1, CCNA2, BIRC5, PBK, NUF2, CDC6, BUB1B, BUB1, TOP2A, and MCM10 (Fig. 7G). Following this, we analyzed the top 500 co-expressed genes using GO and KEGG to identify biological processes, cellular components, and molecular functions (Figs. 7D and 7E, Table S17). These analyses emphasize the role of MAD2L1 in CRC regulation through its influence on DNA replication, chromosome segregation, and related cellular mechanisms.
Verification of interference efficiency
PCR background detection was employed to assess interference efficiency (Fig. S4), results indicated that in HCT116 cells, MAD2L1 and β-actin were amplified at approximately 22 ct and 18 ct, respectively (Figs. S4A and S4B). In RKO cells, amplification for MAD2L1 occurred around 21 ct, and for β-actin at 16 ct (Figs. S4C and S4D). The amplification process was considered standard, and the dissolution curve exhibited a single peak, confirming a normal background. Collectively, these results validate that the interference construct was effective. WB analysis confirmed that in both HCT116 and RKO cell lines, MAD2L1 expression was effectively reduced in the si-406 and si-573 groups compared to both the blank and empty vector control groups, the si-308 is excluded (Figs. S4E and S4F, Table S18). Importantly, the si-406 group demonstrated the most substantial reduction in MAD2L1 expression and was selected for subsequent studies (Figs. S4G and S4H).
Interference with MAD2L1 promotes tumor cell proliferation and inhibits cell apoptosis
Researchers looked at how MAD2L1 expression affected CRC cell growth in the HCT116 and RKO lines. Results from the CCK8 assay revealed that MAD2L1 knockdown markedly increased proliferation in these cells (Figs. 8A and 8B, Table S19). Regarding apoptosis (Table S20), the rates in the negative control (NC) group were 6.89% in HCT116 cells (Figs. 8E and 8G) and 17.15% in RKO cells (Figs. 8F and 8I), whereas the si-406 group exhibited higher apoptosis rates of 9.45% (Fig. 8H) in HCT116 and 22.64% in RKO (Fig. 8J). These findings imply that MAD2L1 serves as an inhibitor of cell apoptosis. Furthermore, cell cycle analysis showed that si-406 induced an extension of the S phase in both cell types (Figs. 8C and 8D). In summary, the modulation of MAD2L1 expression influences the progression of CRC by fostering cell proliferation, reducing apoptosis, and extending the cell cycle duration.
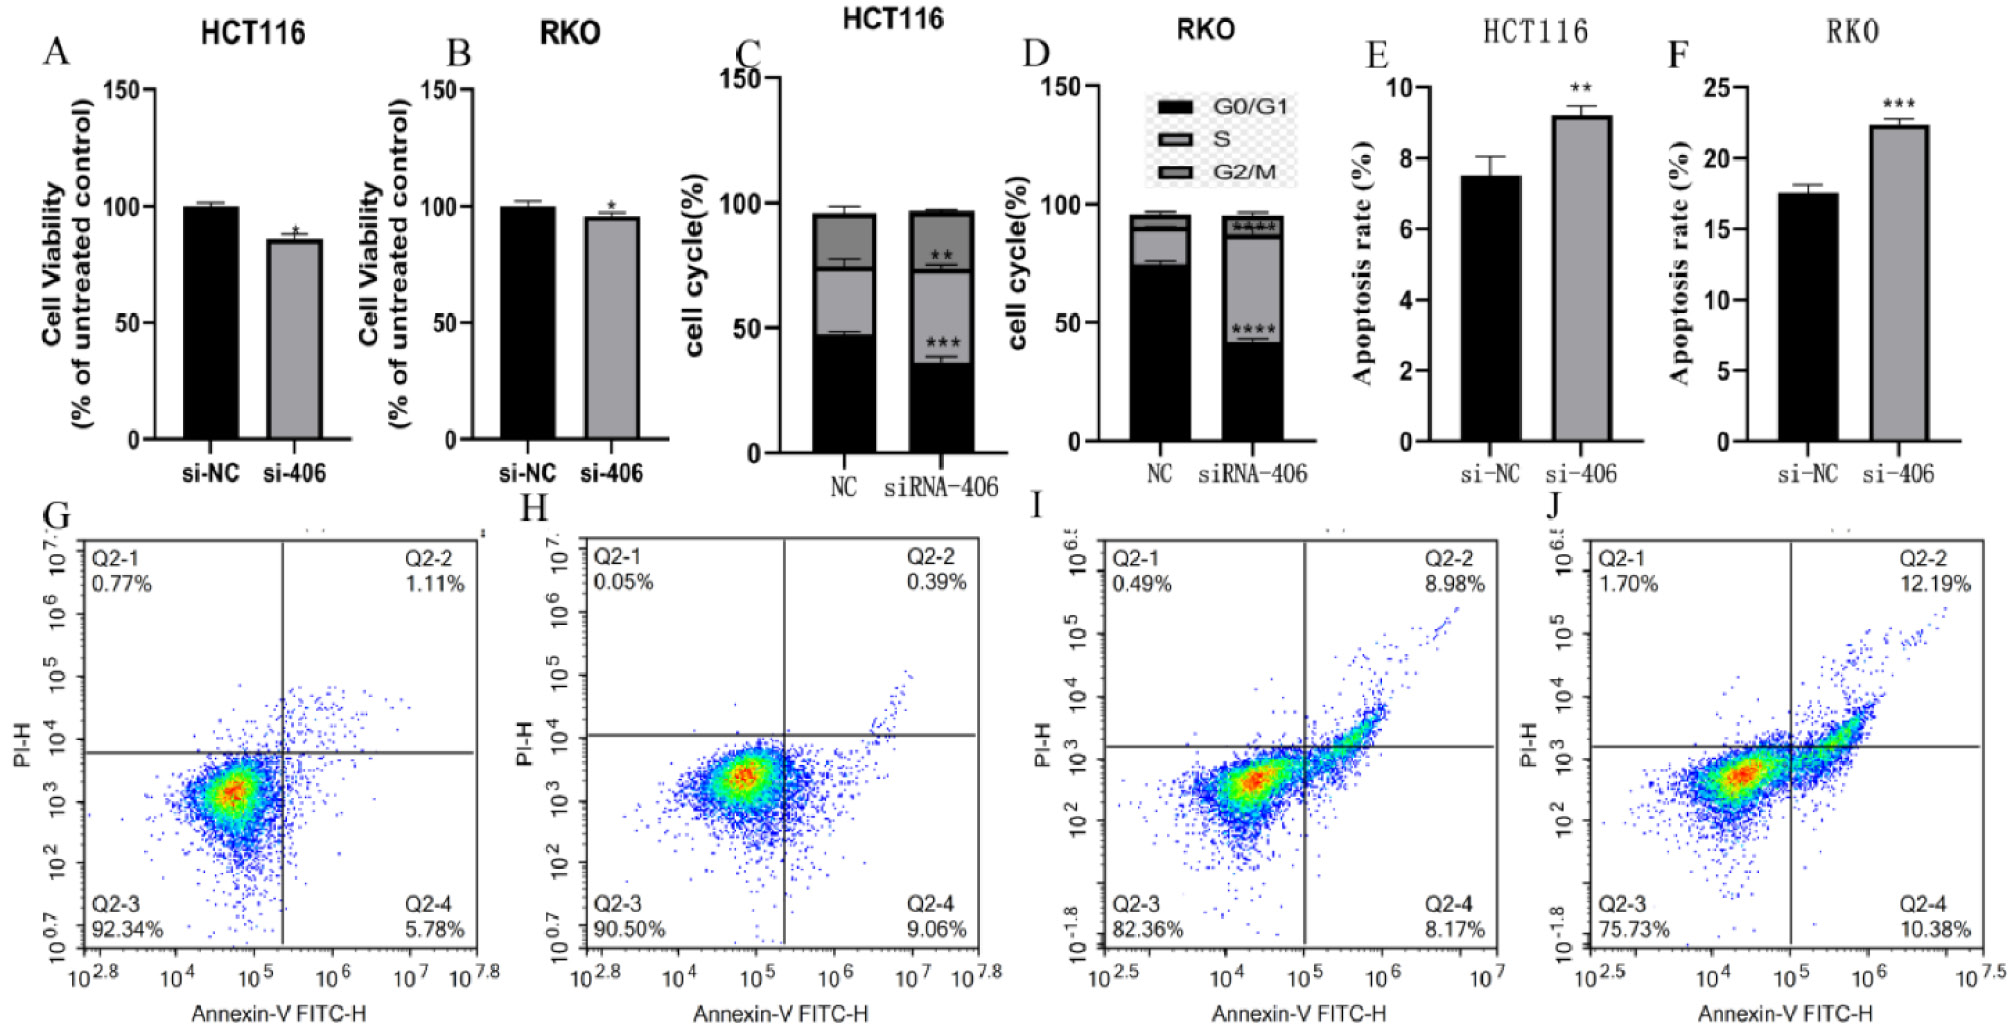
Fig. 8.
Cell function verification experiment. (A and B) Proliferation results of HCT116 and RKO. (C and D) Cell cycle outcomes of HCT116 and RKO. (E, G and H) Apoptosis results of HCT116. (F, I, and J) Apoptosis results of RKO.
.
Cell function verification experiment. (A and B) Proliferation results of HCT116 and RKO. (C and D) Cell cycle outcomes of HCT116 and RKO. (E, G and H) Apoptosis results of HCT116. (F, I, and J) Apoptosis results of RKO.
Discussion
CRC represents one of the most common gastrointestinal malignancies, with over one million new cases diagnosed globally each year and approximately 700,000 associated deaths.1 Although improvements in early detection and therapeutic approaches have been implemented to lower disease burden and mortality, patient outcomes remain generally unfavorable. In the present study, we investigated the role of MAD2L1 across multiple cancer types, focusing on its expression profile, diagnostic and prognostic significance, and association with immune cell infiltration. Furthermore, we delineated the ceRNA-mediated regulatory network, assessed drug sensitivity, and explored relevant molecular mechanisms in CRC. Experimental validation using functional assays in cellular models supported our findings. This research enhances the current understanding of CRC pathogenesis and suggests promising directions for future clinical intervention.
MAD2L1, a core component of the mitotic checkpoint complex, has been implicated in the pathogenesis of various malignancies, including LUAD, CRC, cervical cancer, and hepatocellular carcinoma. To date, a systematic pan-cancer bioinformatics investigation of MAD2L1 across multiple databases has been lacking. Our study reveals a marked upregulation of MAD2L1 in tumor tissues compared with matched normal samples. By examining its fundamental expression profile and clinical associations, we identified CRC as the cancer type in which MAD2L1 demonstrates the highest diagnostic power. Furthermore, increased MAD2L1 expression in liver hepatocellular carcinoma (LIHC) was associated with adverse patient outcomes, aligning with previous research.10 These results collectively underscore the potential utility of MAD2L1 as a diagnostic and prognostic biomarker in a range of human cancers, particularly CRC.
Epigenetics involves the study of gene function alterations resulting from changes in mitosis or meiosis, rather than alterations in the DNA sequence, a mutation is any alteration in the DNA nucleotide sequence.33 These processes can induce abnormal gene expression. Using the cBioPortal, our analysis identified that missense mutations and truncations represent the primary mutation types in MAD2L1, which is notably mutated in uterine corpus endometrial carcinoma (UCEC). DNA methylation is a crucial epigenetic modification that involves the addition of a methyl group to the 5′-carbon of cytosine within CpG dinucleotides.34 Interestingly, hypermethylation in promoter regions tends to suppress specific tumor suppressor genes, whereas hypomethylation during cancer's early stages is linked with increased genomic instability and cellular transformation. In this study, we evaluated MAD2L1's role across various cancers. Our results demonstrate that MAD2L1 is hypermethylated in numerous cancers, including CRC, where 10 CpG sites were identified. Additionally, MAD2L1 mRNA expression in nearly all examined cancer types, including CRC, positively correlates with methylation regulators m1A, m5C, and m6A. In conclusion, MAD2L1 shows promise as a diagnostic tool for detecting genetic mutations and widespread epigenetic changes across various types of cancer.
Immunotherapy has transformed the landscape of oncology, enhanced our comprehension of tumor biology and underscored the necessity of addressing not only the cancer cells but the entire TME.35 Our study indicates that MAD2L1 is linked to a variety of cancers, such as BRCA, KIRP, LUAD, and THYM, pointing to potential responsiveness of MAD2L1 to immunotherapeutic approaches. the expression of MAD2L1 is closely linked to the expression of several ICP genes in different types of cancers. Understanding the relationship between MAD2L1 expression and immune cell infiltration through the ESTIMATE score emphasizes the significant role of immunotherapy in cancer treatment. It highlights the importance of targeting not only the cancer cells but also the entire TME. This study revealed that features related to the microenvironment is related to MAD2L1 expression in the various cancers. The immune cell enrichment scores (including B cells, eosinophils, regulatory TReg, NK cells, and Th2 cells) differ significantly between the groups with high and low MAD2L1 expression in CRC. Hence, we deduce that MAD2L1 may be a useful biomarker for anticipating cancer patients' reactions to immunotherapy.
Past research has demonstrated that miRNAs, which are around 22 nucleotides long, and lncRNAs, which are more than 200 nucleotides long, both regulate each other's expression levels and work together to control the expression of messenger RNAs (mRNAs). Conversely, mRNA also specifically affects the expression of non-coding RNAs. The lncRNA-miRNA-mRNA regulatory network clearly operates in CRC.
MicroRNAs (miRNAs) control gene expression via specific complementary binding to target messenger RNA (mRNA).36,37 LncRNAs serve as miRNA sponges, thereby mitigating the impact of miRNAs on target mRNAs.38 In this study, we established the lncRNA-miRNA-mRNA regulatory framework of MAD2L1 in CRC, identifying hsa-miR-495-3p as a specific prognostic marker for CRC.39 The downregulation of NEAT1 triggers apoptosis in CRC cells, markedly inhibiting cell cycle progression. NEAT1 facilitates the development of CRC in vivo by regulating miR-495-3p and CDK6. Furthermore, NEAT1 overexpression significantly boosts the migration and invasion of CRC cells.Additionally, MALAT1 elevates β-catenin protein levels in HCT116 and LOVO cells, fostering CRC growth by preventing β-catenin degradation.40 The expression of these factors directs the proliferation, migration, and invasion of CRC cells. Numerous studies have demonstrated that NORAD acts as a competitive endogenous RNA (ceRNA), modulating the downstream mechanisms of various cancers by sponging miRNAs (miRNAs).41 This study builds upon the lncRNA-miRNA-MAD2L1 network, encompassing 14 miRNAs such as miR-23a-3p, miR-139-5p, and miR-380-3p, along with 32 lncRNAs, including NEAT1, MALAT1, and NORAD, thus potentially elucidating the developmental mechanisms of CRC.
Copper, a vital element in numerous physiological processes, is crucially required by cancer cells, especially during tumor expansion and metastasis. A newly identified form of non-apoptotic cell death, driven by elevated Cu2+ levels and termed copper-mediated apoptosis, correlates significantly with MAD2L1 expression, unveiling novel associations.42,43 It is intriguing that MAD2L1 expression aligns with genes linked to apoptosis across diverse cancers, suggesting its role in enhancing tumor growth and proliferation through apoptosis modulation. This underscores the imperative for additional research to elucidate the robust linkage between genes implicated in copper-dependent apoptosis and MAD2L1 expression. Moreover, new opportunities for the development of detection and treatment technologies are opened up by the prospect of copper toxicity's participation in tumor start and progression, which provides a new conceptual framework for comprehending particular diseases.
Concurrently, our examination of drug sensitivities linked to MAD2L1 revealed 87 chemotherapeutic agents identified through the Cancer Therapeutics Response Portal (CTRP) and another 26 via the Genomics of Drug Sensitivity in Cancer (GDSC), pointing to the necessity for deeper investigation into the associated molecular mechanisms.
GO and KEGG analyses on the top 500 genes co-expressed with MAD2L1 in CC indicated primary involvement in DNA replication, chromosome segregation, and cell cycle-related processes. The KEGG pathways analysis highlighted significant enhancements in cell cycle, oocyte meiosis, and the p53 signaling pathway, demonstrating MAD2L1's pivotal role in CRC regulation through DNA replication and chromosome management. We pinpointed five principal genes co-expressed with MAD2L1: CCNA2 (Cell Cyclin A2), BUB1B (BUB1 mitotic checkpoint serine/threonine kinase B), TOP2A (Topoisomerase IIα), BUB1 (budding uninhibited by benzimidazole 1), and MCM10 (Minichromosome maintenance 10 replication initiation factor). Notably, TOP2A is linked to tumor progression and adverse survival rates via its regulatory effects on cell proliferation and the cell cycle in CRC.44 The suppression of CCNA2 significantly curtails CRC cell growth by disrupting the cell cycle and inducing apoptosis. Similarly, reducing BUB1B levels effectively curtails the malignant advancement of CRC cells, enhancing apoptosis and promoting cell cycle arrest.45 Additionally, MCM10's critical involvement in DNA replication and essential role in replication complex assembly highlight its importance. An imbalance in MCM10, alongside other factors contributing to DNA damage, could precipitate cancer development.46 These identified roles, previously validated in other studies, align with our GO and KEGG findings, suggesting that our identified signature genes may impact CRC progression by managing the cell cycle and cellular proliferation.
This study presents several limitations. While MAD2L1 influences immune infiltration and serves as a potential biomarker for predicting drug sensitivity in CRC, the findings from clinical trials are pending implementation. We have pinpointed a competing endogenous RNA (ceRNA) network linked to MAD2L1 in CRC, which demands additional experimental substantiation. Additionally, we observed that MAD2L1 enhances cell proliferation and suppresses apoptosis in vitro in CRC. However, the mechanisms by which MAD2L1 modulates CRC invasion and metastasis through cell cycle regulation need to be confirmed through both in vitro and in vivo experiments.
Conclusion
MAD2L1 has emerged as a promising biomarker for prognosis, diagnosis, and immunotherapy in various cancers, including colorectal cancer. Furthermore, MAD2L1 participates in the molecular mechanisms driving CRC progression via a regulatory axis involving lncRNA-miRNA-MAD2L1 network. Although current evidence supports an oncogenic role for MAD2L1, particularly in promoting invasion and migration of CRC cells, further investigation is required to fully elucidate its functional contributions.
Research Highlights
What is the current knowledge?
What is new here?
-
MAD2L1 is a diagnostic, prognostic, and immune-related biomarker across multiple cancers.
-
A novel lncRNA–miRNA–MAD2L1 network promotes CRC progression via cell cycle regulation.
-
MAD2L1 drives tumor growth by enhancing proliferation and inhibiting apoptosis in CRC.
Competing Interests
The authors declare that the research was conducted in the absence of any commercial or financial relationships that could be construed as a potential conflict of interest.
Declaration of AI-assisted Tools in the Writing Procedure
No AI-assisted tools were used in the writing,editing,or preparation of this manuscript.
Data Availability Statement
All data are in the manuscript and/or supporting information files.
Ethical Approval
This study was approved by the Ethics Committee of the Fuyang Affiliated Hospital of Anhui Medical University (Approval No. KY2025097). We confirm that our research was conducted in full compliance with all applicable ethical guidelines.
Supplementary files
Supplementary file 1 contains Tables S1-S20 and Figures S1-S4.
(pdf)
Acknowledgements
We acknowledge the use of the Oncomine, TCGA, GTEx, TIMER, UCLCAN, HPA, GEPIA, STRING databases, XianTao and SangerBox 3.0 free of cost.
References
- Biller LH, Schrag D. Diagnosis and treatment of metastatic colorectal cancer: a review. JAMA 2021; 325:669-85. doi: 10.1001/jama.2021.0106 [Crossref] [ Google Scholar]
- Tong G, Peng T, Chen Y, Sha L, Dai H, Xiang Y. Effects of GLP-1 receptor agonists on biological behavior of colorectal cancer cells by regulating PI3K/AKT/mTOR signaling pathway. Front Pharmacol 2022; 13:901559. doi: 10.3389/fphar.2022.901559 [Crossref] [ Google Scholar]
- Li J, Ma X, Chakravarti D, Shalapour S, DePinho RA. Genetic and biological hallmarks of colorectal cancer. Genes Dev 2021; 35:787-820. doi: 10.1101/gad.348226.120 [Crossref] [ Google Scholar]
- Baidoun F, Elshiwy K, Elkeraie Y, Merjaneh Z, Khoudari G, Sarmini MT. Colorectal cancer epidemiology: recent trends and impact on outcomes. Curr Drug Targets 2021; 22:998-1009. doi: 10.2174/1389450121999201117115717 [Crossref] [ Google Scholar]
- Patel SG, Karlitz JJ, Yen T, Lieu CH, Boland CR. The rising tide of early-onset colorectal cancer: a comprehensive review of epidemiology, clinical features, biology, risk factors, prevention, and early detection. Lancet Gastroenterol Hepatol 2022; 7:262-74. doi: 10.1016/s2468-1253(21)00426-x [Crossref] [ Google Scholar]
- Marima R, Hull R, Penny C, Dlamini Z. Mitotic syndicates Aurora Kinase B (AURKB) and mitotic arrest deficient 2 like 2 (MAD2L2) in cohorts of DNA damage response (DDR) and tumorigenesis. Mutat Res Rev Mutat Res 2021; 787:108376. doi: 10.1016/j.mrrev.2021.108376 [Crossref] [ Google Scholar]
- Liu Z, Guo Z, Long L, Zhang Y, Lu Y, Wu D. [Spindle assembly checkpoint complex-related genes TTK and MAD2L1 are over-expressed in lung adenocarcinoma: a big data and bioinformatics analysis]. Nan Fang Yi Ke Da Xue Xue Bao 2020; 40:1422-31. doi: 10.12122/j.issn.1673-4254.2020.10.07 [Crossref] [ Google Scholar]
- Yu C, Chen F, Jiang J, Zhang H, Zhou M. Screening key genes and signaling pathways in colorectal cancer by integrated bioinformatics analysis. Mol Med Rep 2019; 20:1259-69. doi: 10.3892/mmr.2019.10336 [Crossref] [ Google Scholar]
- Wu X, Peng L, Zhang Y, Chen S, Lei Q, Li G. Identification of key genes and pathways in cervical cancer by bioinformatics analysis. Int J Med Sci 2019; 16:800-12. doi: 10.7150/ijms.34172 [Crossref] [ Google Scholar]
- Chen Q, Yang S, Zhang Y, Li B, Xu H, Zuo S. Identification of MAD2L1 as a potential biomarker in hepatocellular carcinoma via comprehensive bioinformatics analysis. Biomed Res Int 2022; 2022:9868022. doi: 10.1155/2022/9868022 [Crossref] [ Google Scholar]
- Liu N, Zhang GD, Bai P, Su L, Tian H, He M. Eight hub genes as potential biomarkers for breast cancer diagnosis and prognosis: a TCGA-based study. World J Clin Oncol 2022; 13:675-88. doi: 10.5306/wjco.v13.i8.675 [Crossref] [ Google Scholar]
- Makinoya M, Miyatani K, Matsumi Y, Sakano Y, Shimizu S, Shishido Y. Exosomal miR-493 suppresses MAD2L1 and induces chemoresistance to intraperitoneal paclitaxel therapy in gastric cancer patients with peritoneal metastasis. Sci Rep 2024; 14:10075. doi: 10.1038/s41598-024-60967-x [Crossref] [ Google Scholar]
- Li Q, Tong D, Jing X, Ma P, Li F, Jiang Q. MAD2L1 is transcriptionally regulated by TEAD4 and promotes cell proliferation and migration in colorectal cancer. Cancer Gene Ther 2023; 30:727-37. doi: 10.1038/s41417-022-00586-8 [Crossref] [ Google Scholar]
- Wang Z, Katsaros D, Shen Y, Fu Y, Canuto EM, Benedetto C. Biological and clinical significance of MAD2L1 and BUB1, genes frequently appearing in expression signatures for breast cancer prognosis. PLoS One 2015; 10:e0136246. doi: 10.1371/journal.pone.0136246 [Crossref] [ Google Scholar]
- Liu S, Miao M, Kang L. Upregulation of MAD2L1 mediated by ncRNA axis is associated with poor prognosis and tumor immune infiltration in hepatocellular carcinoma: a review. Medicine (Baltimore) 2023; 102:e32625. doi: 10.1097/md.0000000000032625 [Crossref] [ Google Scholar]
- Ding X, Duan H, Luo H. Identification of core gene expression signature and key pathways in colorectal cancer. Front Genet 2020; 11:45. doi: 10.3389/fgene.2020.00045 [Crossref] [ Google Scholar]
-
Zhu J, Wang Y, Huang Q, Liu Z. Pan-cancer analysis identifies adhesion G protein-coupled receptor G6 as a potential prognostic and immunotherapeutic biomarker with its functional validation. Int J Biol Macromol 2025. 334: 149128. doi: 10.1016/j.ijbiomac.2025.149128.
- GTEx Consortium. The GTEx Consortium atlas of genetic regulatory effects across human tissues. Science 2020; 369:1318-30. doi: 10.1126/science.aaz1776 [Crossref] [ Google Scholar]
- Klinglmüller F, Fellinger T, König F, Friede T, Hooker AC, Heinzl H. A comparison of statistical methods for time-to-event analyses in randomized controlled trials under non-proportional hazards. Stat Med 2025; 44:e70019. doi: 10.1002/sim.70019 [Crossref] [ Google Scholar]
- Pfaffenlehner M, Behrens M, Zöller D, Ungethüm K, Günther K, Rücker V. Methodological challenges using routine clinical care data for real-world evidence: a rapid review utilizing a systematic literature search and focus group discussion. BMC Med Res Methodol 2025; 25:8. doi: 10.1186/s12874-024-02440-x [Crossref] [ Google Scholar]
- Gao J, Aksoy BA, Dogrusoz U, Dresdner G, Gross B, Sumer SO. Integrative analysis of complex cancer genomics and clinical profiles using the cBioPortal. Sci Signal 2013; 6:pl1. doi: 10.1126/scisignal.2004088 [Crossref] [ Google Scholar]
-
Chakravarty D, Gao J, Phillips SM, Kundra R, Zhang H, Wang J, et al. OncoKB: a precision oncology knowledge base. JCO Precis Oncol 2017; 2017. doi: 10.1200/po.17.00011.
- Zhang Z, Hernandez K, Savage J, Li S, Miller D, Agrawal S. Uniform genomic data analysis in the NCI Genomic Data Commons. Nat Commun 2021; 12:1226. doi: 10.1038/s41467-021-21254-9 [Crossref] [ Google Scholar]
- Yeo JG, Wasser M, Kumar P, Pan L, Poh SL, Ally F. The Extended Polydimensional Immunome Characterization (EPIC) web-based reference and discovery tool for cytometry data. Nat Biotechnol 2020; 38:679-84. doi: 10.1038/s41587-020-0532-1 [Crossref] [ Google Scholar]
- Li T, Fu J, Zeng Z, Cohen D, Li J, Chen Q. TIMER20 for analysis of tumor-infiltrating immune cells. Nucleic Acids Res 2020; 48:W509-14. doi: 10.1093/nar/gkaa407 [Crossref] [ Google Scholar]
- Cheng L, Wang P, Tian R, Wang S, Guo Q, Luo M. LncRNA2Target v20: a comprehensive database for target genes of lncRNAs in human and mouse. Nucleic Acids Res 2019; 47:D140-4. doi: 10.1093/nar/gky1051 [Crossref] [ Google Scholar]
- Karagkouni D, Paraskevopoulou MD, Tastsoglou S, Skoufos G, Karavangeli A, Pierros V. DIANA-LncBase v3: indexing experimentally supported miRNA targets on non-coding transcripts. Nucleic Acids Res 2020; 48:D101-10. doi: 10.1093/nar/gkz1036 [Crossref] [ Google Scholar]
- Dweep H, Sticht C, Pandey P, Gretz N. miRWalk--database: prediction of possible miRNA binding sites by "walking" the genes of three genomes. J Biomed Inform 2011; 44:839-47. doi: 10.1016/j.jbi.2011.05.002 [Crossref] [ Google Scholar]
- Chen Y, Wang X. miRDB: an online database for prediction of functional microRNA targets. Nucleic Acids Res 2020; 48:D127-31. doi: 10.1093/nar/gkz757 [Crossref] [ Google Scholar]
- Liu CJ, Hu FF, Xia MX, Han L, Zhang Q, Guo AY. GSCALite: a web server for gene set cancer analysis. Bioinformatics 2018; 34:3771-2. doi: 10.1093/bioinformatics/bty411 [Crossref] [ Google Scholar]
- Seida M, Ogami K, Yoshino S, Suzuki HI. Fine regulation of microRNAs in gene regulatory networks and pathophysiology. Int J Mol Sci 2025; 26:2861. doi: 10.3390/ijms26072861 [Crossref] [ Google Scholar]
- Zhang S, Li Y, Xin S, Yang L, Jiang M, Xin Y. Insight into lncRNA- and circRNA-mediated ceRNAs: regulatory network and implications in nasopharyngeal carcinoma-a narrative literature review. Cancers (Basel) 2022; 14:4564. doi: 10.3390/cancers14194564 [Crossref] [ Google Scholar]
- Biswas S, Rao CM. Epigenetics in cancer: fundamentals and Beyond. Pharmacol Ther 2017; 173:118-34. doi: 10.1016/j.pharmthera.2017.02.011 [Crossref] [ Google Scholar]
- Martisova A, Holcakova J, Izadi N, Sebuyoya R, Hrstka R, Bartosik M. DNA methylation in solid tumors: functions and methods of detection. Int J Mol Sci 2021; 22:4247. doi: 10.3390/ijms22084247 [Crossref] [ Google Scholar]
- Rui R, Zhou L, He S. Cancer immunotherapies: advances and bottlenecks. Front Immunol 2023; 14:1212476. doi: 10.3389/fimmu.2023.1212476 [Crossref] [ Google Scholar]
- Gebert LFR, MacRae IJ. Regulation of microRNA function in animals. Nat Rev Mol Cell Biol 2019; 20:21-37. doi: 10.1038/s41580-018-0045-7 [Crossref] [ Google Scholar]
- Xiao Y, Hu F, Li M, Mo L, Xu C, Wang X. Interaction between linc01615 and miR-491-5p regulates the survival and metastasis of colorectal cancer cells. Transl Cancer Res 2020; 9:2638-47. doi: 10.21037/tcr.2020.03.03 [Crossref] [ Google Scholar]
- Militello G, Weirick T, John D, Döring C, Dimmeler S, Uchida S. Screening and validation of lncRNAs and circRNAs as miRNA sponges. Brief Bioinform 2017; 18:780-8. doi: 10.1093/bib/bbw053 [Crossref] [ Google Scholar]
- Vieira LM, Jorge NAN, de Sousa JB, Setubal JC, Stadler PF, Walter M. Competing endogenous RNA in colorectal cancer: an analysis for colon, rectum, and rectosigmoid junction. Front Oncol 2021; 11:681579. doi: 10.3389/fonc.2021.681579 [Crossref] [ Google Scholar]
- Zheng X, Ren J, Peng B, Ye J, Wu X, Zhao W. MALAT1 overexpression promotes the growth of colon cancer by repressing β-catenin degradation. Cell Signal 2020; 73:109676. doi: 10.1016/j.cellsig.2020.109676 [Crossref] [ Google Scholar]
- Mohapatra S, Winkle M, Ton AN, Nguyen D, Calin GA. The role of non-coding RNAs in chromosomal instability in cancer. J Pharmacol Exp Ther 2023; 384:10-9. doi: 10.1124/jpet.122.001357 [Crossref] [ Google Scholar]
- Chen L, Min J, Wang F. Copper homeostasis and cuproptosis in health and disease. Signal Transduct Target Ther 2022; 7:378. doi: 10.1038/s41392-022-01229-y [Crossref] [ Google Scholar]
- Tong X, Tang R, Xiao M, Xu J, Wang W, Zhang B. Targeting cell death pathways for cancer therapy: recent developments in necroptosis, pyroptosis, ferroptosis, and cuproptosis research. J Hematol Oncol 2022; 15:174. doi: 10.1186/s13045-022-01392-3 [Crossref] [ Google Scholar]
- Liu G, Lin W, Zhang K, Chen K, Niu G, Zhu Y. Elucidating the prognostic and therapeutic significance of TOP2A in various malignancies. Cancer Genet 2024; 288-289:68-81. doi: 10.1016/j.cancergen.2024.10.005 [Crossref] [ Google Scholar]
- Zeng Q, Zhang S, He L, Fu Q, Liao L, Chen L. Knockdown of BUB1B inhibits the proliferation, migration, and invasion of colorectal cancer by regulating the JNK/c-Jun signaling pathway. Cancer Biother Radiopharm 2024; 39:236-46. doi: 10.1089/cbr.2023.0070 [Crossref] [ Google Scholar]
- Ahmed SM, Sasikumar J, Laha S, Das SP. Multifaceted role of the DNA replication protein MCM10 in maintaining genome stability and its implication in human diseases. Cancer Metastasis Rev 2024; 43:1353-71. doi: 10.1007/s10555-024-10209-3 [Crossref] [ Google Scholar]