Bioimpacts. 16:32900.
doi: 10.34172/bi.32900
Original Article
An integrative computational strategy for antidiabetic drug discovery: From QSAR modeling to retrosynthesis
Lhoucine Naanaai Conceptualization, Methodology, Visualization, Writing – original draft, 1, * 
Marwa Alaqarbeh Conceptualization, Software, 2
Abdellah El Aissouq Visualization, Writing – original draft, 1
Hicham Zaitan Supervision, Validation, 1
Mohammed Bouachrine Supervision, Validation, Writing – review & editing, 3
Fouad Khalil Methodology, Supervision, Validation, Writing – review & editing, 1
Author information:
1Laboratory of Processes, Materials, and Environment (LPME), Faculty of Science and Technology, Sidi Mohamed Ben Abdellah University, Fez, Morocco
2Applied Science Research Center, Applied Science Private University, Amman, Jordan
3Molecular Chemistry and Natural Substances Laboratory, Faculty of Sciences, Moulay Ismail University, Meknes, Morocco
Abstract
Introduction:
The α-amylase enzyme plays a critical role in the digestion of complex carbohydrates. Inhibiting this enzyme offers a promising strategy for improving glucose regulation in diabetic patients.
Methods:
In this study, a comprehensive computational approach, combining 3D-QSAR modeling, ADMET profiling, molecular docking, molecular dynamics, ligand transport analysis, and retrosynthesis, was used to identify novel ligands with potent inhibitory activity against various indenoquinoxaline-phenylacrylohydrazide hybrids.
Results:
The optimal 3D-QSAR model, developed using partial least squares (PLS) and Comparative Molecular Similarity Indices Analysis (CoMSIA), demonstrated strong correlation and predictive power (Q2=0.541, R2=0.973, SEE=0.076). ADMET analysis showed that the designed ligands possess acceptable pharmacokinetic and toxicological profiles, supporting their potential for further drug development. Molecular docking revealed that the designed ligands effectively interacted with the active site of α-amylase (PDB ID: 7TAA). Furthermore, molecular dynamics simulations (100 ns) and MM-PBSA free energy calculations confirmed the stability of ligand-enzyme complexes. Ligand transport was further examined using the CaverDock program, tracking the movement of molecules from the enzyme’s active site to its surface. Finally, retrosynthetic analysis was performed to propose feasible synthesis routes for the most active compound.
Conclusion:
Overall, the findings highlight a promising lead compound for further in vitro and in vivo investigations targeting α-amylase inhibition.
Graphical Abstract
Keywords: 3D-QSAR, Docking, Molecular dynamics, α-Amylase, Biological efficacy, Retrosynthesis
Copyright and License Information
© 2026 The Author(s).
This work is published by BioImpacts as an open access article distributed under the terms of the Creative Commons Attribution Non-Commercial License (
http://creativecommons.org/licenses/by-nc/4.0/). Non-commercial uses of the work are permitted, provided the original work is properly cited.
Funding Statement
Not applicable.
Introduction
Diabetes mellitus refers to a group of disorders characterized by persistently high blood sugar levels. Type 1 diabetes is an autoimmune condition in which the immune system mistakenly attacks and destroys the insulin-producing cells in the pancreas. This leads to a deficiency of insulin, a hormone essential for regulating blood glucose levels.1 In contrast, type 2 diabetes, the most common form of the disease is primarily caused by insulin resistance. In this condition, the body's cells no longer respond effectively to insulin, resulting in elevated blood glucose levels.2 Obesity, a sedentary lifestyle, and a genetic predisposition are tightly linked to type 2 diabetes. Although it typically manifests in adulthood, the rising prevalence of obesity is leading to an increasing number of diagnoses in children and adolescents. Unmanaged diabetes, whether type 1 or type 2, can result in a number of complications. Numerous complications are frequently encountered, such as peripheral arterial disease (which results in decreased blood flow to limbs), stroke, nephropathy (kidney disease), retinopathy (eye damage), neuropathy (damage to the nerves), and cardiovascular disease.3 The International Diabetes Federation (IDF) estimates that 425 million people worldwide were diagnosed with diabetes in 2017, and by 2045, that figure is expected to rise to 629 million.4
One treatment strategy for postprandial hyperglycemia is to prevent the body from breaking down dietary carbohydrates. Thus, it is crucial to inhibit the α-glucosidase and α-amylase enzymes when treating type 2 diabetes. In the digestive system, dietary carbohydrates are broken down by pancreatic α-amylase. After that, they are broken down into glucose molecules by the enzyme α-glucosidase, which are absorbed and enter the bloodstream. Thus, inhibiting the enzymes α-glucosidase and α-amylase can restrict the digestion of carbohydrates, delay the absorption of glucose, and consequently lower blood glucose levels without influencing insulin secretion. Commonly prescribed medications like voglibose, acarbose, and miglitol inhibit the actions of α-amylase and α-glucosidase, but they also cause unfavorable side effects like diarrhea, flatulence, and bloating.5,6
Quinoxalines are a notable class of heterocyclic compounds because they can substitute N for one or more of the carbon atoms in the naphthalene ring.7 The quinoxaline ring system's α-positions are identified as 2 and 3.8 In addition, many drug molecules and acceptors, including clofazimine, echinomycin, actinomycin, talviraline, varenicline, caroverine, carbadox, and olaquindox, rely on the quinoxaline ring as a fundamental building block.9,10 According to published research, the majority of quinoxaline-related molecules have antitubercular, anticancer, anti-inflammatory, antitubercular, antimalarial, anti-HIV, and acetylcholinesterase and butyrylcholinesterase inhibitory properties.11-16
New drug development is a multi-phase, expensive process that includes preliminary research, clinical trials, and regulatory approval. These phases may take a number of years and necessitate significant financial outlays, sometimes amounting to billions. Amidst these obstacles, in silico molecular modeling has become a crucial instrument in drug discovery, providing crucial insights and enhancing development efficiency.17-21 Therefore, by combining structure-based drug design (SBDD) and ligand-based drug design (LBDD), computer-aided drug design (CADD) can prove to be a powerful methodology for accelerating the development of effective new drugs, particularly for diabetes mellitus.22-24 To achieve this, we used the 3D-QSAR method to design new inhibitors from a set of indenoquinoxaline-phenylacrylohydrazide hybrids. We then used ADMET analysis to help predict how a molecule behaves in the body and its potential impact on health. In addition, molecular docking and molecular dynamics were applied to verify the stability of the designed ligands toward the α-amylase enzyme. On the other hand, the CaverDock tool was used to rapidly analyze ligand transport processes through the alpha amylase receptor and predict the biological efficacy of the designed molecules. finally, the retrosynthesis of the new compounds enabled us to plan the synthesis of the designed molecules. In conclusion, in silico techniques have been used for virtual screening, selection of drug candidates for in vitro and vivo trials, and subsequent experimental synthesis, thus reducing research time and costs.
Materials and Methods
Biological activity and databases
The 3D-QSAR model was created by randomly dividing 30 molecules of indenoquinoxaline-phenylacrylohydrazide hybrids from the literature25 into two sets: a training set (24 molecules) for model building and a test set (6 molecules) for model validation. The IC50 and pIC50 values for 30 different compounds' biological activities are displayed in Table S1.
Molecular alignment and 3D-QSAR model generation
SYBYL-x 2.0 Tripos molecular modeling program was used for both database alignment and molecular modeling.26 Utilizing chem 3D software, all molecules' three-dimensional structures were constructed. Using the Gasteiger-Hückel charges and the Tripos force field of the SYBYL energy minimizer, each molecule's energy was optimized.27 We have limited the number of interactions to 2000 for the minimization. The minimization process was completed when the energy gradient convergence criterion of 0.05 kcal/mol-was met. Significant physicochemical descriptors, such as hydrophobic fields, hydrogen bond acceptors, steric fields, and electrostatic fields, were used to generate the CoMSIA model employing the probe atom. The column's filter and attenuation factors were first adjusted to 2.0 kcal/mol and 0.3, respectively.
Partial least squares (PLS) regression was employed to explore the relationship between biological activity values and CoMSIA descriptors.26-28 Without the use of cross-validation techniques, the overall relevance of the models was assessed using the following statistical metrics: standard error of estimate (SEE), F-value (Fischer test), and coefficient of determination (R2). This assessment was based on the number of components (N) that had the highest cross-validation correlation coefficient (Q2).
Model validation
The following coefficients were used to internally validate the model produced by the partial least squares method: Q2, R2, ONC, and SEE. These coefficients serve as a gauge for the model's internal quality. The coefficients Q2 and R2 are defined by the following expressions (Eq. (1), Eq. (2)).
Eq. (1)
Eq. (2)
In this work, the accuracy and prediction of the 3D-QSAR models were assessed using a test set consisting of six molecules. The established model is externally validated by the coefficients defined by Golbraikh–Tropsha and Roy (Eq. (3)-Eq. (13)).29
Golbraikh–Tropsha's method
Eq. (3)
Eq. (4)
Eq. (5)
Eq. (6)
Eq. (7)
Roy's method
Eq. (9)
Eq. (12)
Eq. (13)
Where yi experimental activity,
calculated activity,
average of experimental activity,
average of calculated activity, Training = training set, and Test = set of external prediction are all included.
The proposed model was validated for its applicability domain using William's diagram, which is available in Minitab. The applicability domain is essential for assessing the uncertainty of a prediction for a specific compound, as it indicates the degree of similarity between that compound and the molecules used to construct the QSAR model. One of the most common methods for defining the applicability domain involves calculating the leverage value (hi) of each molecule. This method is based on the following equations (Eq. (14), Eq. (15)).30,31
Eq. (14)
Evaluation of pharmacokinetic properties
To improve the chances of finding new drugs or scientific instruments, it is critical to consider the pharmacological activity of the compounds and optimize their ADMET (Absorption, Distribution, Metabolism, Excretion, and Toxicity) properties. ADMET criteria like absorption in the human gut, penetration of the central nervous system (CNS), and penetration of the blood-brain barrier (BBB) could be approached by in-silico analysis. Using easily accessible web servers like pkCSM32 and ADMETlab 2.0 website (https://admetmesh.scbdd.com/), candidate drug ADMET and similarity characteristics were assessed. Hazardous amounts of compounds, biotransformation, and clearance all have an impact on the metabolism of pharmaceuticals.
Molecular docking
Molecular docking analysis has become one of the most essential and fundamental drug discovery tools as a result of its applications in medicine. This method forecasts a required ligand's contacts and affinity with the receptor's binding site. In this study, Auto-Dock Vina33 was used to perform molecular assembly simulations in order to grasp the basic structural and geometrical requirements, analyze the interaction modalities, and comprehend the mechanism of interactions. In order to achieve this, we extracted the most active molecule (H18) and a number of ligands that were designed on the α-amylase enzyme's active site (Protein Data Bank [PDB ID: 7TAA]) at a resolution of 1.98 Å from the RCSB protein information database.34 Using the Discovery Studio program, we started by removing all ligands and water molecules from protamine. The α-amylase enzyme's active site served as the center of a coordinate grid (X = 38.839, Y = 39.756, and Z = 30.354) that was used to calculate the anchor area utilizing AutoDock tools. Lastly, we examined the conformations and prior interactions between the ligands and proteins using Discovery Studio software.35
MD simulation protocol
Molecular dynamic simulation of protein-ligand complex
The protein-ligand complex was subjected to an all-atom MD simulation. The protein-ligand complex was prepared for MD simulation using CHARMM-GUI Server,36 utilizing the solution builder protocol. The protein was protonated at physiological pH, 7.4. The ligand was parametrized using CGenFF tools, followed by protein parametrization using CHARMM36m force field. The system was solvated TIP3P water model in a periodic cubic box expanded by 10 Å from the protein. 0.15 M counter ions were added to neutralize the system. For the simulation of electrostatic and van der Waals interactions, the Verlet cutoff technique was used. The bond lengths in the system were constrained using the LINCS algorithm. The particle mesh Ewald (PME) technique was employed to calculate accurate long-range electrostatic forces. The system underwent energy minimization using the steepest descent (SD) algorithm to relax unfavourable contacts and reduce potential energy ( < 1000 kJ mol-1 nm-1), followed by a two-standard equilibration phase, NVT ensemble with a constant temperature, achieved using a thermostat, and NPT ensemble for the second equilibration phase. Both temperature and pressure were maintained at constant values using a thermostat and barostat, respectively. This allowed the system to exchange energy and particles, ensuring constant temperature (300 K) and pressure (1 bar) throughout the simulation and reaching a stable state with consistent thermodynamic properties. The MD simulation was then run for 100 ns using GROMACS software (Version 2024.5).37 Table S2 details the specific settings and conditions used for each complex, including simulation type, forcefield, solvation, neutralization, energy minimization, equilibration, simulation time, temperature, and software version.
Trajectory analysis and binding free energy calculation
Following a 100 ns molecular dynamics (MD) simulation, trajectory analysis was conducted utilizing the gmx_energy, gmx_rms, gmx_rmsf, gmx_gyrate and gmx_sasa modules to compute total energy, temperature, root-mean-square deviation (RMSD), root-mean-square fluctuation (RMSF), and radius of gyration (Rg) calculation for the protein. The calculation of MMPBSA of the protein-molecule complex was calculated using gmx_MMPBSA Ver 1.6.4 developed by Valdés-Tresanco et al.38 It should be noted that the reported MM/PBSA binding free energy values were calculated without explicit inclusion of configurational entropy contributions (-TΔS). Therefore, these values should be interpreted as approximate relative indicators of ligand binding affinity rather than rigorous absolute free energies. Despite this limitation, the MM/PBSA results remain useful for comparative ranking of the studied compounds within the same simulation protocol.39
Ligand transport and biological efficacy
Ligand transport
In this section of the work, the energy needed to move the antidiabetic chemotherapy drug Acarbose and its candidate drugs L1, L2, L3, and L4 from the surface to the active site via the various pathways found in the proteins (PDB ID: 7TAA) will be computationally analyzed. Furthermore, because it shows how ligands move through the protein channels and tunnels that connect the internal and external environments, the ligand transport method is essential.40,41 It is challenging and sometimes impossible to conduct experimental research on such processes.42 Consequently, a computational method that has been validated is needed. The method is based on using the CaverDock software to analyze a molecule's movement through transport tunnels. The CaverDock computation consists of three crucial stages: lower- and upper-bound trajectory computation, constraint definition, and tunnel discretization.43 These calculations were performed with default settings, including a minimum probe radius of 0.9 Å, a shell depth of 4, a shell radius of 3, a clustering threshold of 3.5, a maximum distance of 3, and a desired radius of 5, as well as standard discretization and force field parameters. A receiver or ID PDB and a MOL2 or other extension file are required in order to run the CaverDock simulation, establish the transport tunnels, and examine the molecules.
Biological efficacy
Biological efficacy (BE) is the degree to which an antagonist or inhibitor binds to its target and elicits a response.44 BE is calculated as the ratio of the drug's affinity for its target (Ki) to the IC50, or the concentration needed to block half of the functional response (Eq. (16), Eq. (17)).
Where T is the temperature in Kelvin, Ea is the activation energy, A is the Arrhenius factor, and R is the ideal gas constant (R = 8.314 J.mol−1.K−1).
Retrosynthesis of designed ligands
Retrosynthesis is a strategy used in synthetic chemistry to design or redesign reaction pathways for creating molecules, often with the help of computational tools. The RXN for Chemistry platform (https://rxn.app.accelerate.science/rxn/home) is one of the prominent databases and tools designed to assist in this process.45,46 It allows users to analyze and predict synthetic routes, helping us to find the optimum pathways for the synthesis of new α-amylase enzyme inhibitors.
Results and Discussion
Molecules alignment
In order to synchronize data gathering and display contour maps in the CoMSIA studies and generate a dependable 3D-QSAR model, compound H18, which exhibited the highest degree of biological activity, was employed as a template material. Thirty molecules aligned and compound H18's three-dimensional structure are shown in Fig. 1.
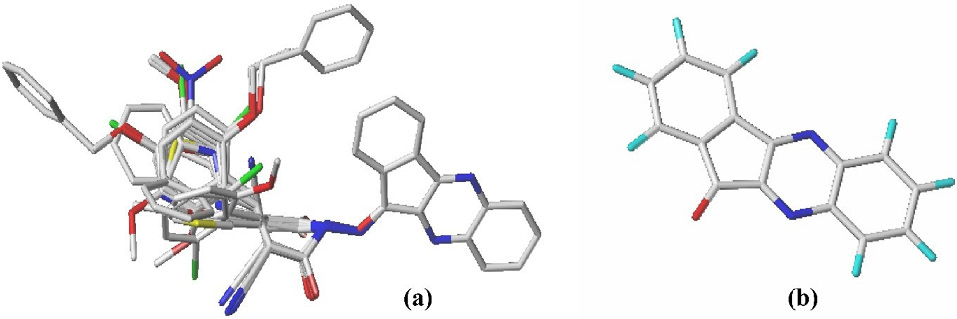
Fig. 1.
30 molecules alignment (a) and common core (b)
.
30 molecules alignment (a) and common core (b)
CoMSIA investigation and model validation
The CoMSIA model was generated in this study using a total of various field combinations. The best model CoMSIA_SDHA selected has the following statistical parameters: Q2 = 0.541 and R2 = 0.973, a lower value for SEE = 0.076 and the number of primary components (N = 4). This means that the selected model is valid internally. Table S3 shows the external validation of the CoMSIA-SDHA model. Consequently, the CoMSIA/SDHA model has a high degree of independently verified predictive quality and a high stability estimate. Using the best CoMSIA model, Table 1 and Fig. 2 displays the predicted pIC50 values and residuals (differences between experimental and predicted values) for the whole data set.
Table 1.
Observed and estimated activities and residual values obtained by CoMSIA-SDHA model
|
Compound
|
pIC50 (Obs)
|
pIC50 (Pred)
|
Residue
|
| H1* |
4.475 |
4.497 |
-0.022 |
| H2 |
4.383 |
4.393 |
-0.010 |
| H3 |
4.287 |
4.282 |
0.005 |
| H4 |
4.348 |
4.273 |
0.075 |
| H5 |
4.308 |
4.348 |
-0.040 |
| H6* |
4.719 |
4.665 |
0.054 |
| H7 |
4.822 |
4.788 |
0.034 |
| H8 |
4.777 |
4.786 |
-0.009 |
| H9* |
4.333 |
4.222 |
0.111 |
| H10 |
5.121 |
5.154 |
-0.033 |
| H11 |
4.710 |
4.717 |
-0.007 |
| H12 |
4.716 |
4.588 |
0.128 |
| H13 |
4.727 |
4.747 |
-0.020 |
| H14* |
4.669 |
4.757 |
-0.088 |
| H15 |
4.365 |
4.498 |
-0.133 |
| H16 |
5.282 |
5.285 |
-0.003 |
| H17 |
5.415 |
5.33 |
0.085 |
| H18 |
5.631 |
5.646 |
-0.015 |
| H19 |
4.256 |
4.221 |
0.035 |
| H20 |
4.266 |
4.215 |
0.051 |
| H21 |
4.375 |
4.341 |
0.034 |
| H22 |
4.248 |
4.332 |
-0.084 |
| H23 |
4.299 |
4.42 |
-0.121 |
| H24 |
4.907 |
4.849 |
0.058 |
| H25 |
4.981 |
5.018 |
-0.037 |
| H26 |
4.689 |
4.617 |
0.072 |
| H27* |
4.453 |
4.387 |
0.066 |
| H28 |
4.670 |
4.768 |
-0.098 |
| H29 |
4.242 |
4.211 |
0.031 |
| H30* |
4.615 |
4.628 |
-0.013 |
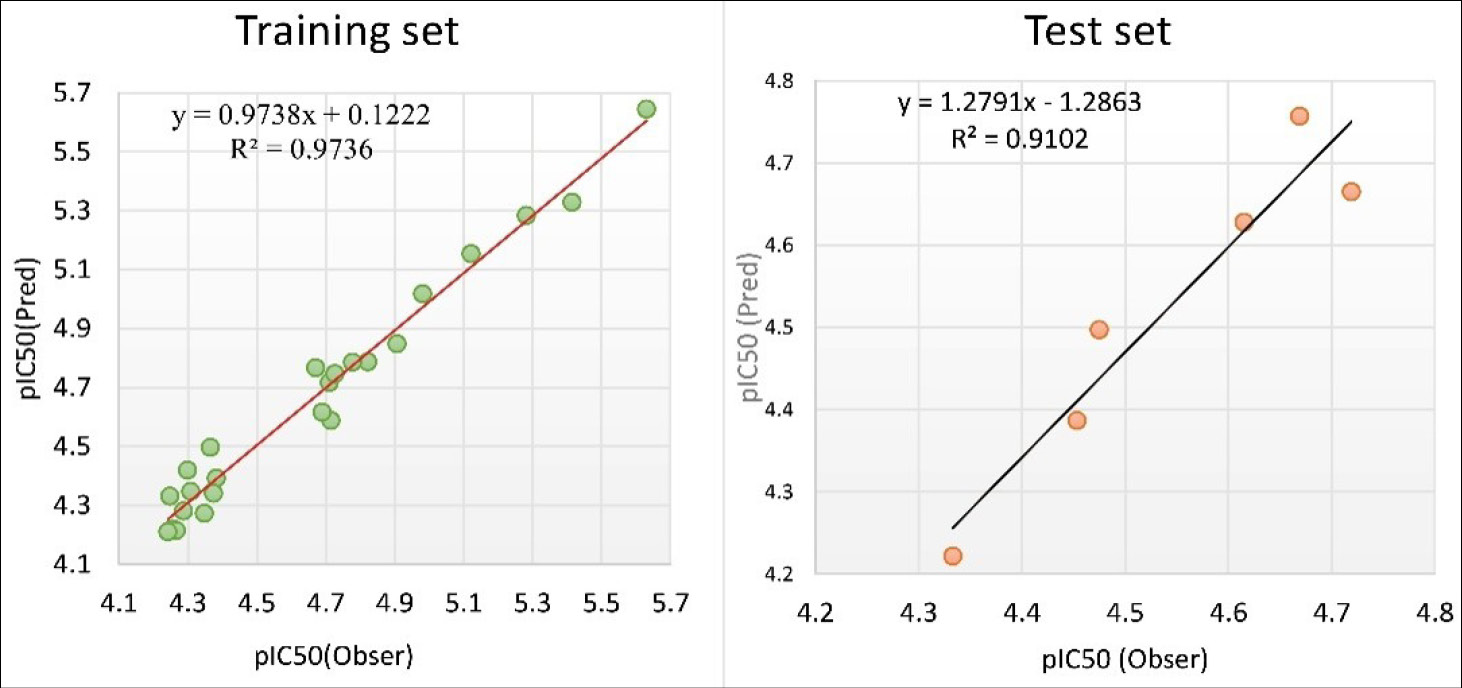
Fig. 2.
A scatter plot showing the actual and anticipated pIC50 values using the CoMSIA model
.
A scatter plot showing the actual and anticipated pIC50 values using the CoMSIA model
The applicability domain of the resulting 3D-QSAR model was defined using the Williams diagram in the Minitab program (Fig. S1). In this diagram, the compounds from the training set are represented by blue dots, the compounds from the test set are shown as green dots, and the predicted molecules are indicated by red dots. A molecule is considered to be within the model's chemical space, or applicability domain, if its leverage score is below the threshold (h < h* = 0.5) and its standardized residual score falls within ± 3.0 standard deviation units. Therefore, all compounds are included within the range of application except H1, which belongs to the test set.
Visualization of the CoMSIA-SDHA model
To present the best 3D-QSAR model, we used a CoMSIA/SDHA contour map with the most active molecule (H18) as a reference. Fig. 3 shows the donor and acceptor fields for hydrogen bonds, hydrophobic compounds, and steric compounds. The yellow contours surrounding the para position of the R substituent in the CoMSIA steric field suggest that grafting bulky groups there will reduce activity. Analogs with a -Cl group at different positions on the aryl ring had a negative effect on enzyme inhibition, according to further investigation of their structures and IC50 values. More precisely, it was found that analog H3, which has a para -Cl substitution on the aryl ring, is a moderate inhibitor of the enzyme α-amylase.
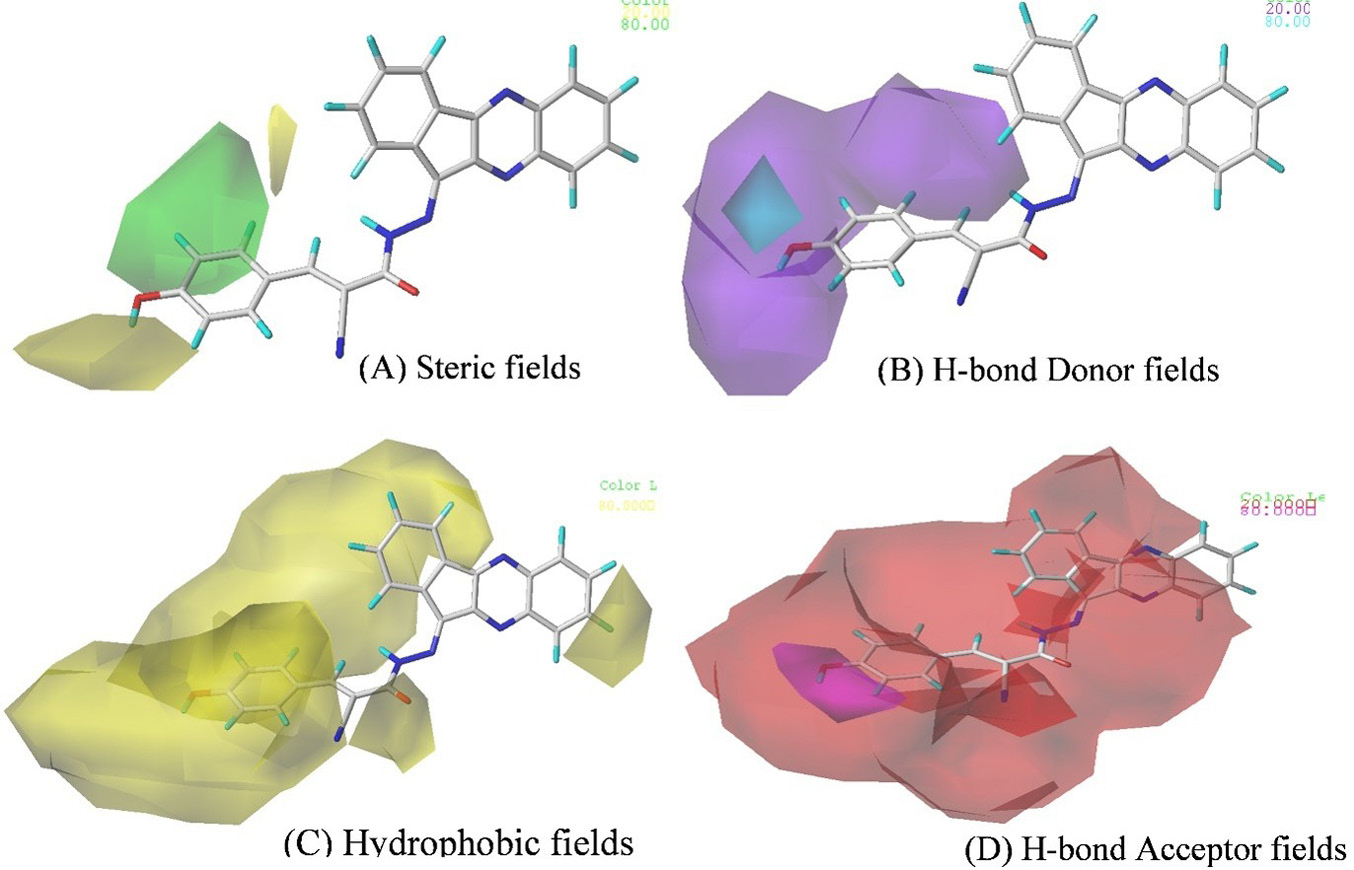
Fig. 3.
The best CoMSIA model's contour map utilizing compound H18 as a reference molecule.
.
The best CoMSIA model's contour map utilizing compound H18 as a reference molecule.
Among all the compounds in the series, compounds H17 and H18 demonstrated the highest activity. These compounds are notable for having 3- and 4-hydroxyl substituents on the pendant phenyl ring. Against α-amylase enzymes, this compound exhibited the highest potency as evidenced by its IC50 values of 3.35 μM, and 2.34 μM respectively. The activity profile demonstrated that higher activity was produced by different substituents at different locations on the phenyl ring, including groups that donate electrons. The inhibitory activity of a compound can be greatly influenced by the location and electronic characteristics of substituents. The interaction between a compound and its target receptor or enzyme can be influenced by the position and electronic characteristics of its substituents, which can ultimately determine the compound's activity.
In the hydrophobic field of CoMSIA, a yellow contour is visible around the R position, indicating that hydrophilic character groups in this region could be beneficial to increase the activity. In addition, Large red contours surrounding the R position in the hydrogen bond acceptor field of CoMSIA indicate that molecules with hydrogen bond acceptor characteristics can reduce inhibitory activity. CoMSIA's hydrogen bond donor field shows a large purple outline around the phenyl group R, demonstrating that inhibitory activity can be diminished by molecules with hydrogen bond acceptor properties.
Design of novel α-amylase inhibitors
The main objective of this study is to create novel α-amylase inhibitors by utilizing the CoMSIA model's suggestions for the structural properties of compound h18 as a model. For this purpose, the active molecule H18 was used as a reference for the model compounds (ligands L1, L2, and L3) by rationally replacing R on the basis of the fragments in the Zinc database. As a result, four new Indenoquinoxaline-phenylacrylohydrazide hybrid molecules with significant activity compared with compound H18 as reference were designed. The same technique used for the training and test sets was applied to minimize these ligands and align them to the database. A 3D-QSAR model was then used to calculate the theoretical activity values of these ligands. The anticipated pIC50 values, chemical structures, and hi values of the newly developed molecules are shown in Table 2. Leverage values (hi) were selected as possible drug candidates based on the requirement that they be less than h* (where h* = 0.50). Additionally, these compounds were more active against the α-amylase enzyme than the H18 molecule, as the most active in the series studied, and the standard drug, acarbose.
Table 2.
Structures of developed compounds, their calculated activity, and their leverage (hi)
|
Compound
|
Structure
|
pIC50
|
h*
|
hi
|
Comment
|
| L1 |
|
7.062 |
0.5 |
0.211 |
Inside |
| L2 |
|
5.755 |
0.5 |
0.285 |
Inside |
| L3 |
|
6.409 |
0.5 |
0.289 |
Inside |
| L4 |
|
6.900 |
0.5 |
0.358 |
Inside |
| Acarbose |
Standard Drug |
4.834 |
- |
- |
- |
Evaluation of pharmacokinetic properties
To more accurately assess drug similarity, it is essential to utilize the online tools pkCSM and ADMETlab 2.0, which incorporate Lipinski's rule of five and synthesis accessibility (SA). Table S4 summarizes the physicochemical properties and synthetic accessibility of the inhibitors designed against the α-amylase enzyme. Consequently, most of the suggested ligands satisfy Lipinski's rule; however, ligand L3 does not since its molecular weight is greater than 500 Da (507.462), which may have an adverse effect on its oral bioavailability. Acarbose, on the other hand, exhibits poor adherence to Lipinski's rule due to its much higher molecular weight (645.608), elevated Log P (-8.721), excessive rotatable bonds (13), and a large number of hydrogen bond donors (14) and acceptors (19). Furthermore, these molecules are relatively easy to synthesize (SA scores ranging from 2.871 to 3.113), which is much better than acarbose (SA = 5.756), indicating that the designed ligands would be more feasible to produce.
Toxicological and pharmacokinetic characteristics were assessed applying ADMET investigation. In Table 3, the findings are summarized. The absorption capacity of a drug determines the extent of its bioavailability and biological effects. Based on human intestinal absorption (HIA) values (HIA > 30%), the designed products are extensively absorbed (ranging from 56.265% for L3 to 78.354% for L2), although less than H18 (96.482%). In stark contrast, acarbose shows 1% intestinal absorption, highlighting a major advantage of the newly designed ligands over this standard drug.
Table 3.
ADMET identification of new inhibitors in the data set along with the template (H18) and acarbose
|
ADME properties
|
Ligands
|
|
H18
|
L1
|
L2
|
L3
|
L4
|
Acarbose
|
| Intestinal absorption (% Absorbed) |
96.482 |
77.783 |
78.354 |
56.265 |
65.224 |
1.000 |
| VDss (Log L/kg) |
-0.522 |
-0.944 |
-0.892 |
-1.171 |
-0.882 |
-0.833 |
| BBB (Log BB) |
-0.198 |
-1.512 |
-1.385 |
-1.479 |
-1.523 |
-1.841 |
| CNS (Log PS) |
-1.946 |
-3.226 |
-3.096 |
-3.351 |
-3.502 |
-6.183 |
| 2D6 Substrate |
No |
No |
No |
No |
No |
No |
| 3A4 Substrate |
Yes |
Yes |
Yes |
No |
Yes |
No |
| 1A2 Inhibitor |
Yes |
No |
No |
No |
No |
No |
| 2C19 Inhibitor |
Yes |
No |
Yes |
No |
No |
No |
| 2C9 Inhibitor |
Yes |
No |
Yes |
No |
No |
No |
| 2D6 Inhibitor |
No |
No |
No |
No |
Yes |
No |
| 3A4 Inhibitor |
Yes |
Yes |
Yes |
No |
No |
No |
| Total clearance (Log (ml/min/kg)) |
0.710 |
0.405 |
0.641 |
0.311 |
0.407 |
0.619 |
| AMES toxicity |
No |
No |
No |
No |
No |
No |
Additionally, the inhibitory or substrate activity of cytochrome P450 enzymes provided further insight into the metabolic behavior of the compounds studied. These enzymes play a crucial role in the oxidation of xenobiotics, including drugs, and are vital for their subsequent elimination from the body. With the exception of ligand L3, all other ligands were found to be 3A4 substrates, but none was found to be a 2D6 substrate. Acarbose is neither a 2D6 nor a 3A4 substrate. Furthermore, the results of inhibition studies indicate that ligand H18 inhibits 1A2, 2C19, 2C9, and 3A4; ligands L1 and L2 inhibit 3A4; and ligand L4 inhibits only 2D6. In contrast, acarbose does not inhibit any of these cytochrome P450 enzymes, suggesting a cleaner metabolic profile with potentially fewer drug-drug interactions.
When Log BB < -1, compounds are poorly distributed in the brain; when Log BB > 0.3, they can cross the blood-brain barrier (BBB). As a result, the blood-brain barrier cannot be crossed by the developed ligands (L1-L4), as all exhibit Log BB values below -1 (ranging from -1.385 to -1.523). Similarly, acarbose also shows poor BBB penetration (Log BB = -1.841). Additionally, chemicals with Log PS > - 2 are expected to infiltrate the CNS, while compounds with Log PS < - 3 have difficulty moving into the CNS, meaning that designed compounds cannot penetrate the CNS.47,48 Acarbose also shows minimal CNS penetration (Log PS = -6.183), which is even lower than the designed ligands.
Drug clearance refers to the rate at which a compound is eliminated from the body relative to its concentration in the system. As shown in Table 3, none of the newly designed ligands exhibit issues related to drug persistence. Furthermore, toxicity assessments, including AMES toxicity tests, indicate that the predicted compounds are non-toxic.
Molecular docking
Molecular docking was used to investigate potential binding mechanisms between the proposed ligands and the receptor in order to comprehend the 3D-QSAR analysis supplied by the CoMSIA models. The first step was to use the Discovery Studio software to visualize the active site in order to clarify the interactions between the original ligand (Acarbose) and the enzyme that is targets, as illustrated in Fig. 4. It was discovered that the target protein's predicted active site (PDB ID: 7TAA) contains a number of crucial amino acids, including Gln 35, Trp 83, His 122, Asp 206, Asp 297, Asp 340, and Arg 344, which are crucial for the molecular docking assessment.49 In addition, the precision of the docking method was confirmed by the RMSD of the two ligands' superimposed structures, which was 0.509 Å that is less than 2 Å.
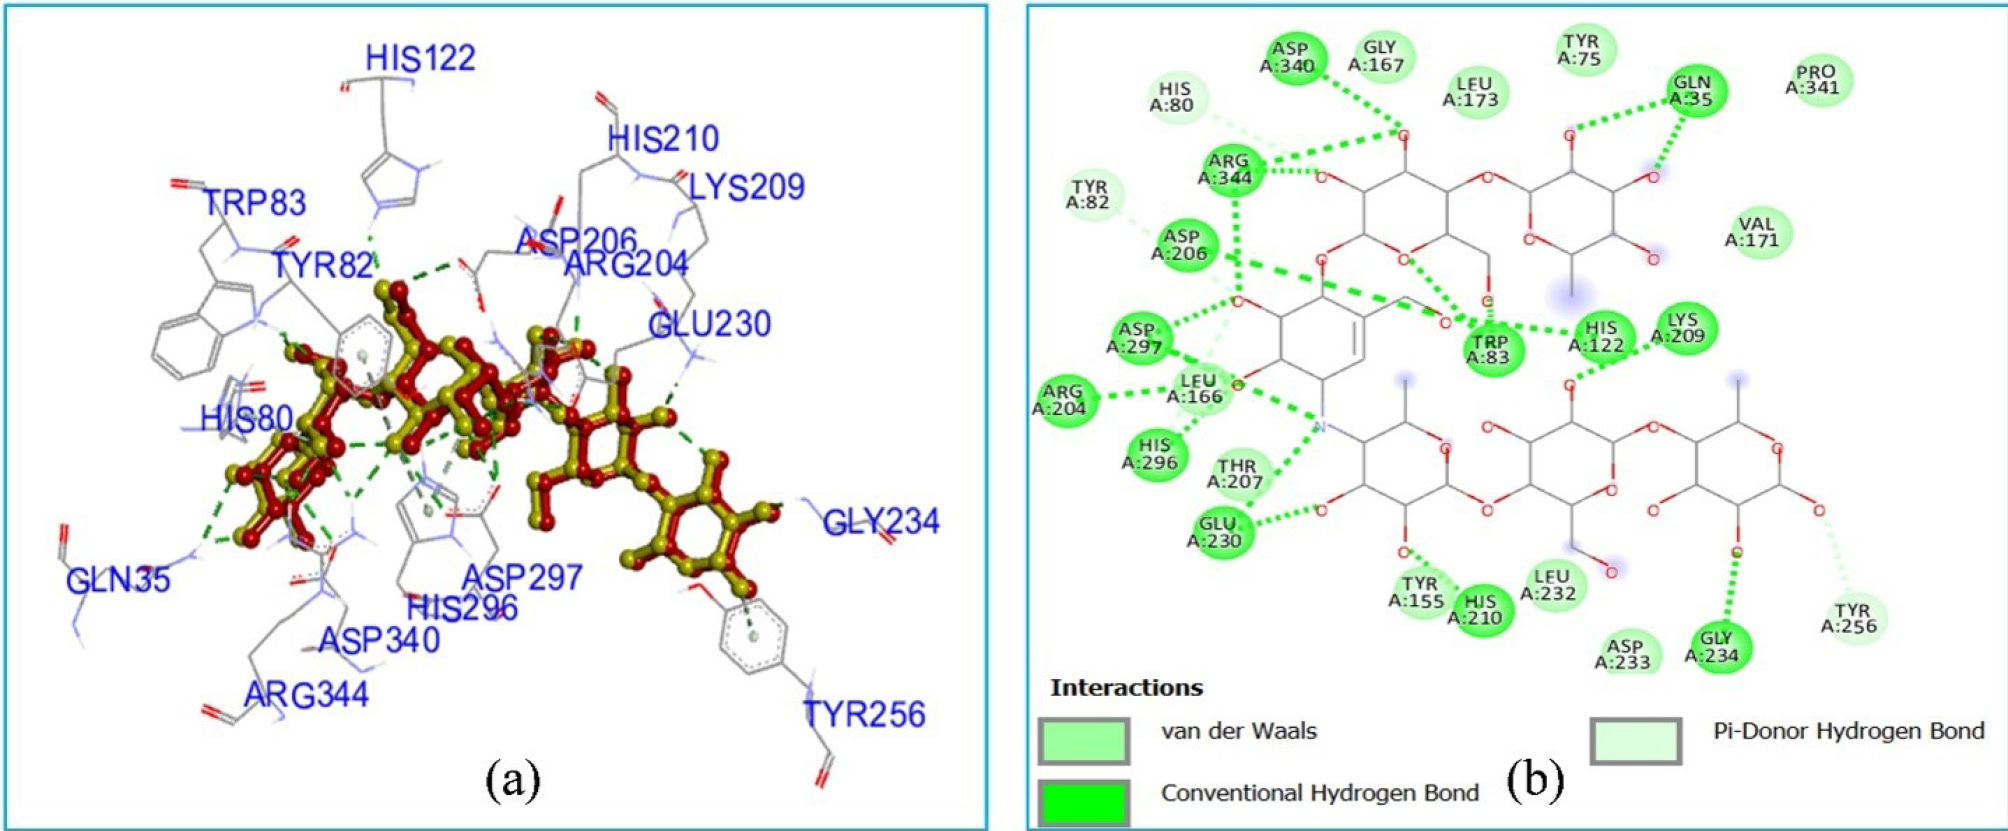
Fig. 4.
2D and 3D interactions between Acarbose-7TAA and the superposition of the redocked ligand (yellow) and the original ligand (red)
.
2D and 3D interactions between Acarbose-7TAA and the superposition of the redocked ligand (yellow) and the original ligand (red)
With regard to stability, the newly identified molecules (L1, L2, L3, and L4) had binding energies of -13.2, -10.2, 14.5, and -14.0 kcal/mol, respectively, which were lower than molecule H 18's (-9.4 kcal/mol). This finding implies that the stability increases in pIC50 values shown by these molecules in comparison to the H18 molecule may be due in part to the stability of the ligand-amylase complex with low energy. Table S5 provides an overview of the residual interactions and binding affinity of the four designed ligands, using compound H18 as the template for comparison.
Fig. 5 and Fig. S2 illustrate the different interactions (2D and 3D) between the target protein α-amylase (7TAA) and the model molecule H18, as well as the ligands designed (L1-L4). The most active molecule (H18) in the studied database has a binding affinity (-9.4 kcal/mol). This molecule interacts with the active site of the α-amylase protein with several interactions: two conventional hydrogen bonds (His 210, and Arg 344), five hydrophobic bonds (Trp 83, Val 171, Leu 173, and Leu 232), and three electrostatic interactions withs the amino acids: Glu 230, Asp 297, and Asp 340.
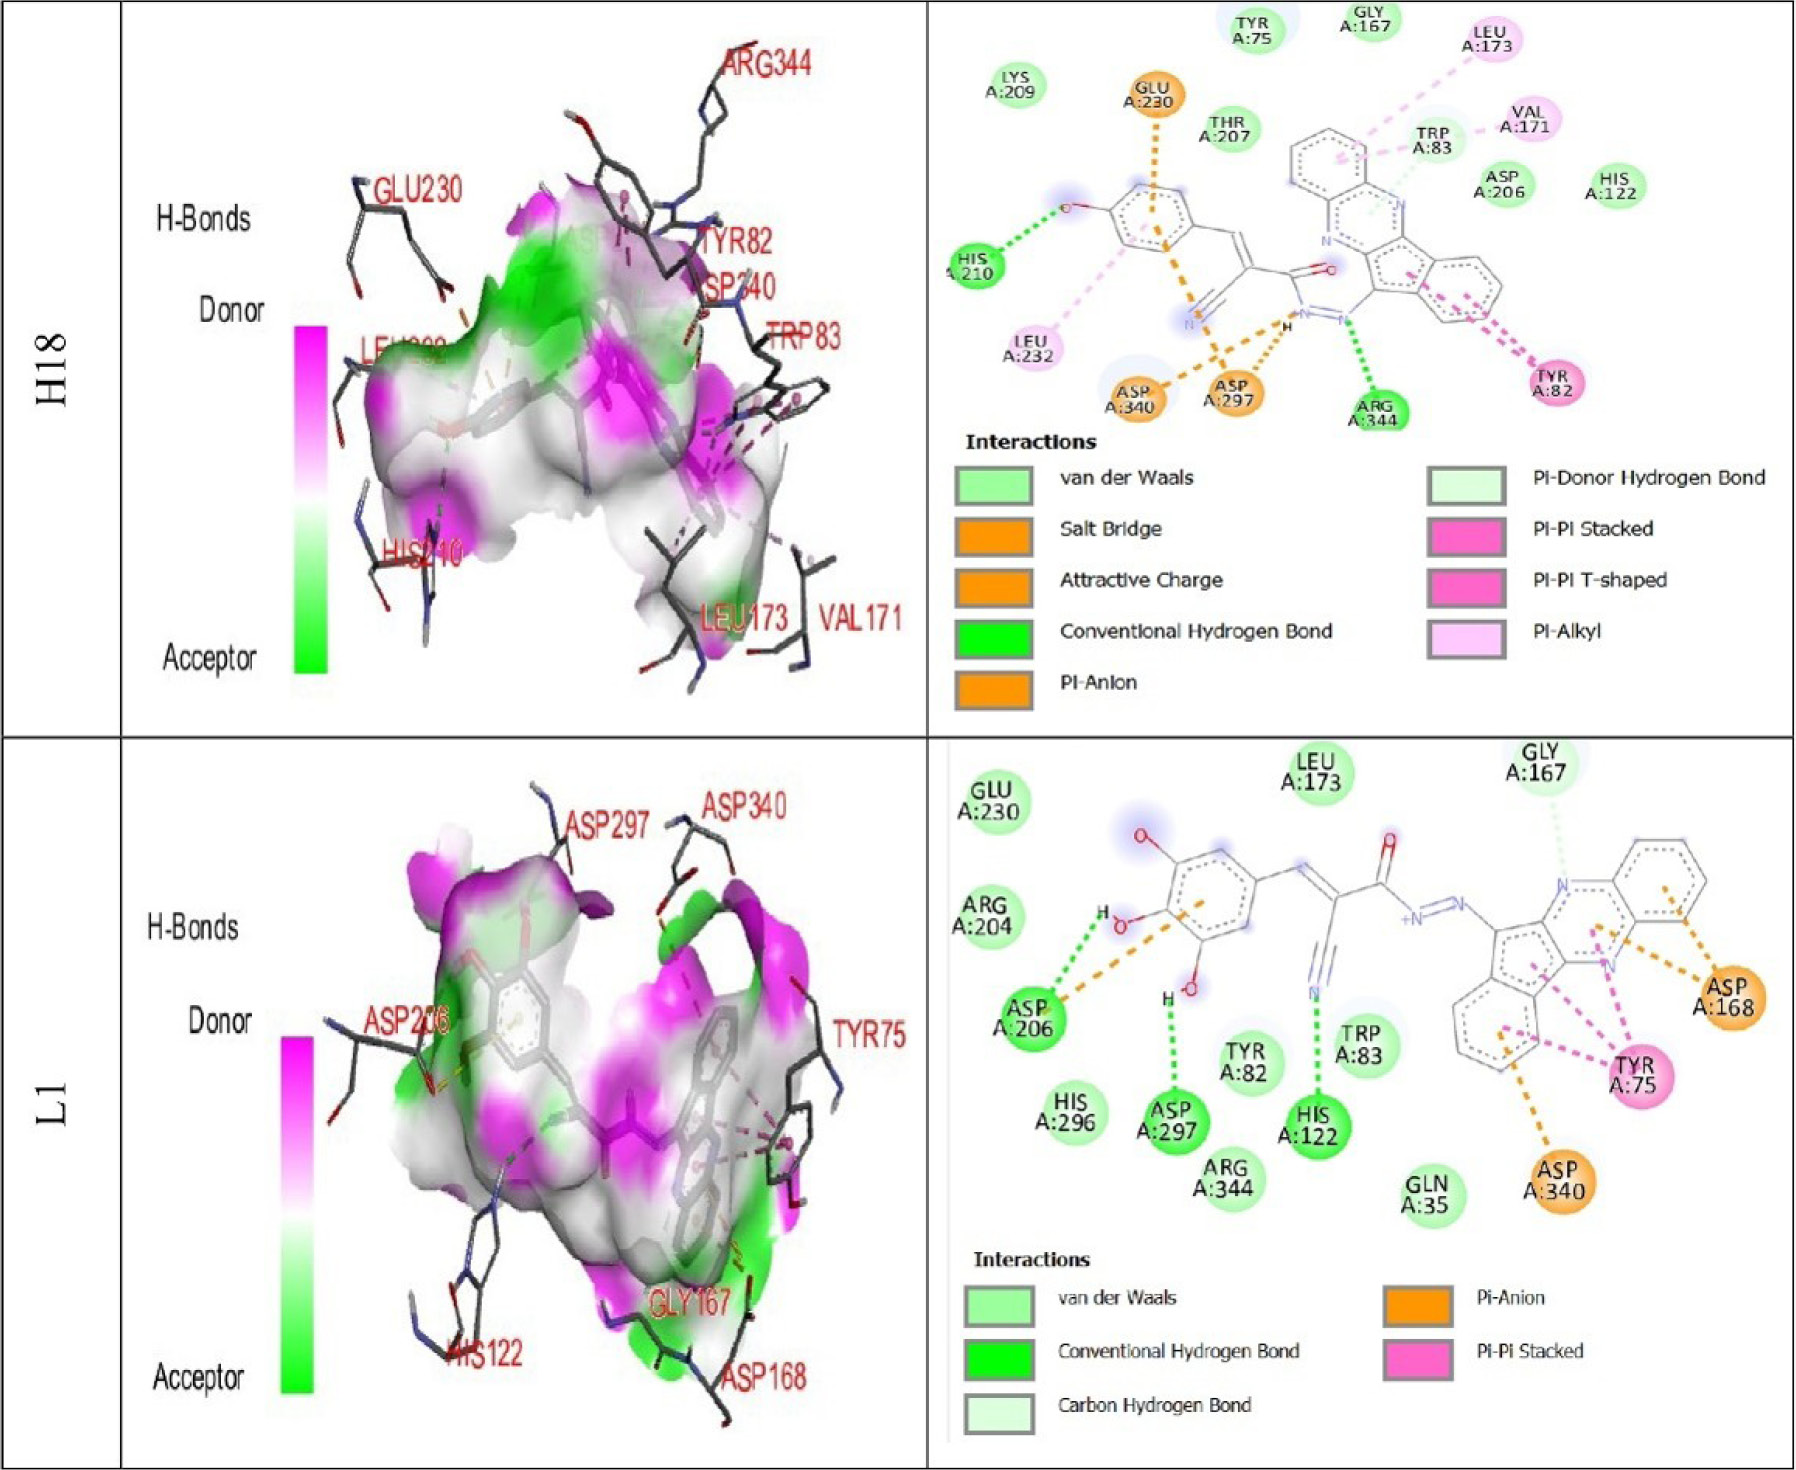
Fig. 5.
2D and 3D interactions of Ligand H18 and predicted compound (L1) with α-amylase.
.
2D and 3D interactions of Ligand H18 and predicted compound (L1) with α-amylase.
The most active designed ligand (L1; pIC50 = 7.062) binds to the active site via conventional interactions such as His 122, Asp 206, and Asp 297. It also makes electrostatic interactions with residues Asp 168, Asp 297, Asp 340 and a hydrophobics interactions with amino acid Tyr 75. Furthermore, the precise kind and quantity of interactions formed with the amylase active site may be connected to the strong anti-diabetic effects of these molecules. Indeed, there are notable conventional hydrogen bond, hydrophobic, and electrostatic interactions between the most active ligands (L1, L2, L3, and L4) and the therapeutic target being studied. These findings are entirely consistent with earlier research, such as 3D-QSAR and molecular docking evaluations that compare the most active compound in the series under study, which serve as the experimental data set for this study.
MD simulation
Temperature and total energy
The protein-ligand complex underwent a constant temperature of 300 K and total energy of over 100 ns of MD simulation (Table S6 and Fig. S3). The MD simulations for both L1, H18 and acarbose demonstrate excellent thermodynamic stability, with consistent temperatures and stable total energies over the 100 ns simulation period. These results validate the reliability of the simulations and suggest that the systems are well-equilibrated.
Molecular dynamics analysis of structural stability and flexibility
RMSD, RMSF, Rg and SASA are critical metrics for assessing protein stability during MD simulations. RMSD provides insight into the overall structural stability of protein-ligand complexes, indicating global fluctuations over time.50 Upon 100 ns MD simulation, both complexes, L1 and H18, stabilize within the first 40 ns. However, the protein destabilizes with a minimal spike observed after 50 ns upon binding with H18. In contrast, the L1 complex exhibits protein destabilization after 60 ns and restabilizes after 80 ns as shown in Fig. 6. Conversely, the L1 complex demonstrates greater stability throughout the simulation, with RMSD values staying close to 0.2 nm and exhibiting only slight variations. In comparison to the standard pharmaceutical agent acarbose, the designed ligands exhibit enhanced stability. The acarbose complex demonstrates a gradual increase in RMSD, reaching 0.5-0.6 nm at approximately 70 ns, before partially restabilizing at around 0.3-0.4 nm. This observation suggests that L1 and H18 form more stable complexes with the protein than acarbose (Table S7).
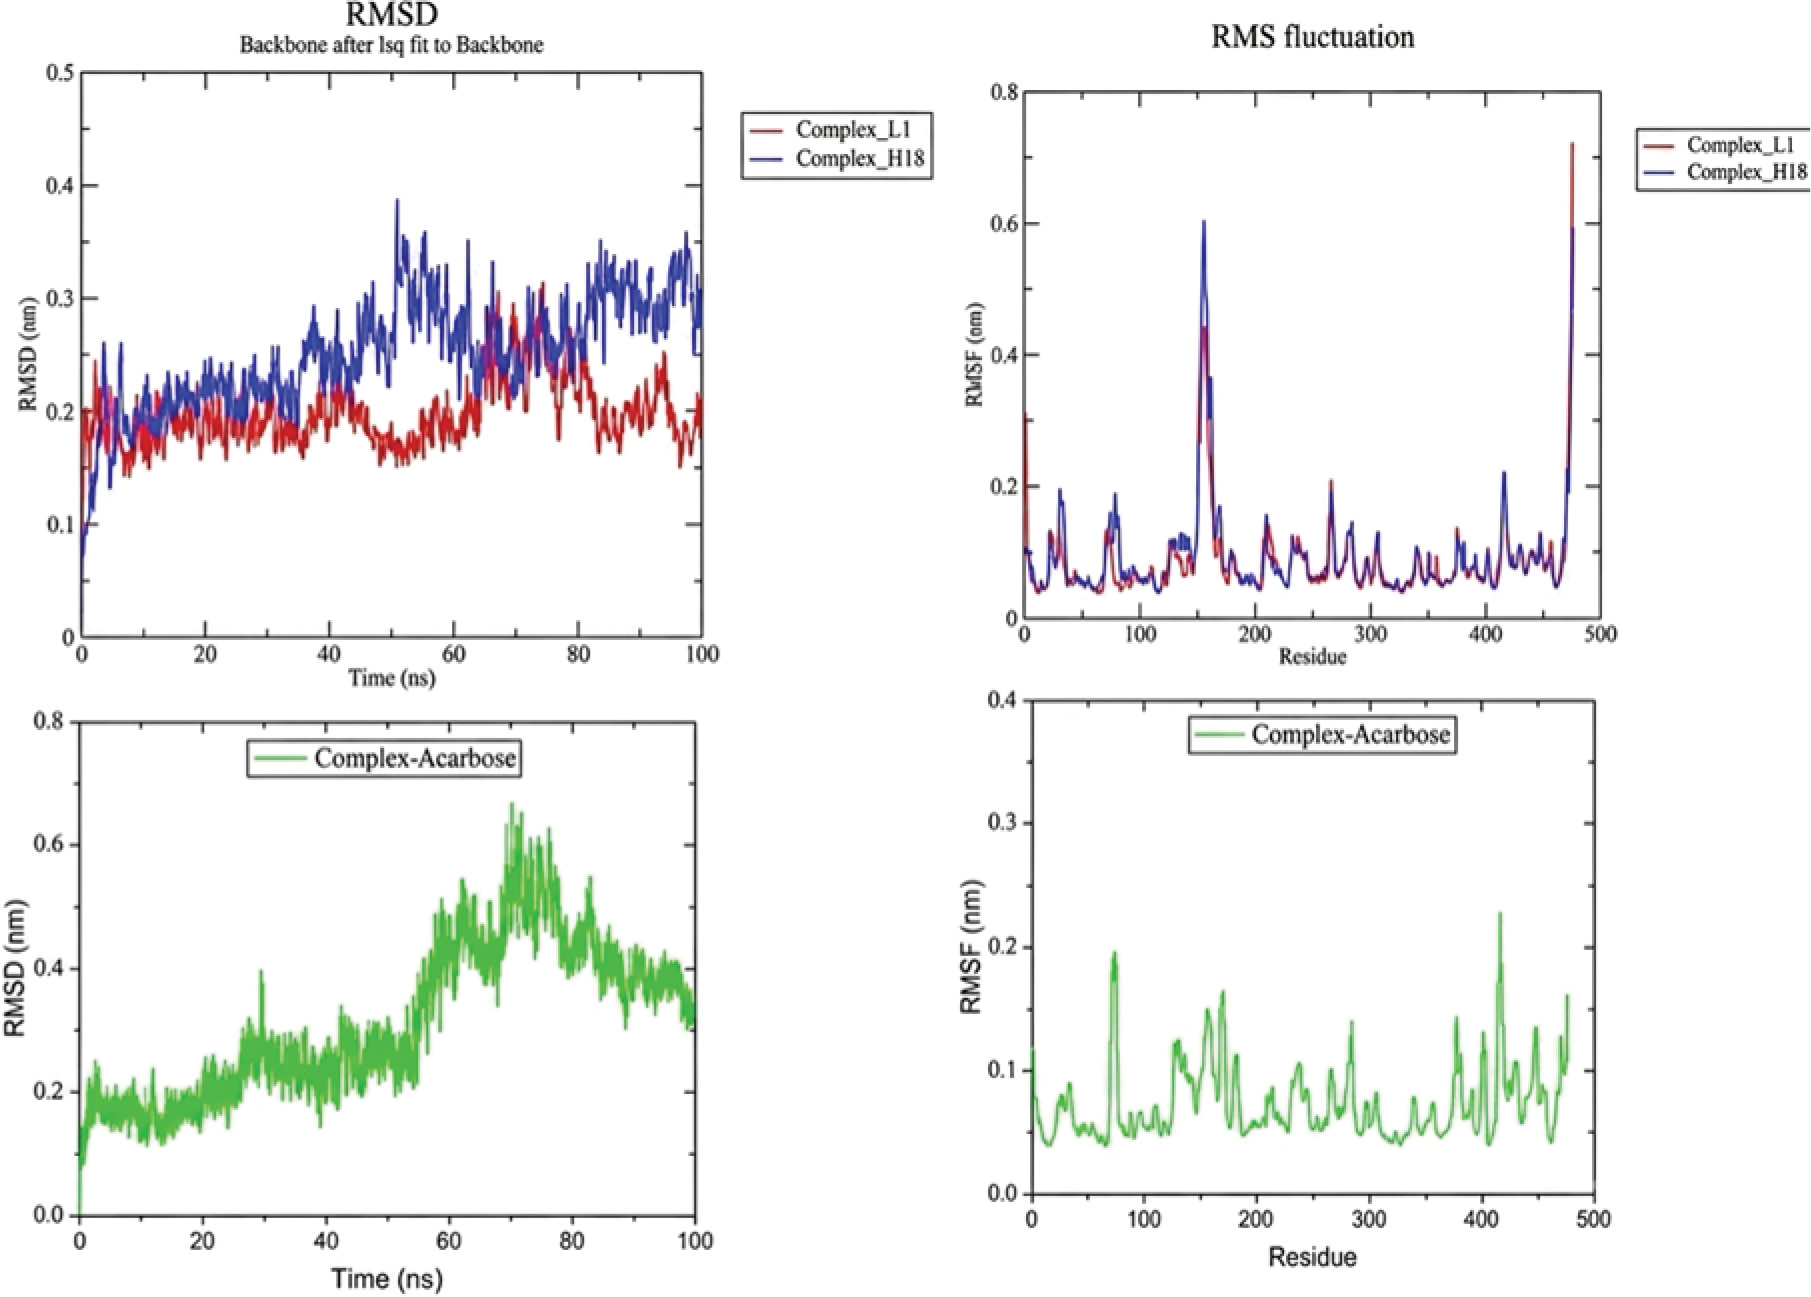
Fig. 6.
RMSD and RMSF of studied complexes
.
RMSD and RMSF of studied complexes
RMSF on the other hand, complements this by measuring the flexibility of specific residues, thereby highlighting regions of dynamic behavior within the protein.51 Both the L1 and H18 complexes demonstrated protein flexibility at residues 150- 160, with the H18 complex showing the highest RMSF value of 0.6 nm, while the L1 complex had an RMSF of 0.45 nm (Fig. 6). In addition, the acarbose complex exhibits a distinct flexibility pattern compared to the L1 and H18 complexes, characterized by moderate peaks across different residues and a maximum RMSF of about 0.2 to 0.25 nm. This can be attributed to the extensive network of hydrogen bonds formed with the active site residues, which impose stress on various protein parts, resulting in generalized moderate fluctuations rather than localized movements of high intensity.
The radius of gyration is particularly useful in assessing the overall folding and compactness of proteins. A decrease in Rg during an MD simulation typically indicates that the protein is folding into a more compact structure, which is often associated with increased stability.52 The binding of the protein with L1 and H18 leads to a decrease in protein compactness, as evidenced by the increase in the Rg value throughout the 100 ns MD simulation. This suggests potential conformational changes in the protein when bound to L1 and H18. In contrast, for the acarbose complex, the Rg values remained remarkably constant around 3.94 nm throughout the simulation. This indicates that acarbose keeps the protein in a very compact and stable conformation without significant structural rearrangements.
SASA, on the other hand, provides insights into the protein's interaction with its environment and can indicate changes in protein stability. A decrease in SASA during MD simulations suggests that the protein is adopting a more folded and stable conformation, as less surface area is exposed to the solvent.53 Similar to the Rg graph, the SASA of the protein when bound to L1 and H18 exhibits a similar behavior, showing an increase in the SASA value (Fig. S4). This suggests that the protein may undergo unfolding, allowing more water to access the exposed surface area of the protein. In contrast to the designed ligands, the acarbose complex exhibits moderate SASA fluctuations (175-190 nm2) with a slight upward trend, indicating better structural integrity and reduced protein unfolding.
Protein-ligand distance, hydrogen bond and binding free energy
Protein-ligand distance, hydrogen bonding, and the molecular mechanics Poisson-Boltzmann surface area (MM/PBSA) method provide insights into the binding characteristics of ligands to their target proteins. Protein-ligand distance is a fundamental parameter that reflects the proximity of the ligand to the active site of the protein. A shorter distance between the ligand and specific residues often correlates with stronger binding interactions. Besides maintaining distance of less than 3.5 Å between hydrogen bond donors and acceptors is indicative of significant interactions, which are crucial for the stability of the protein-ligand complex.54 Overall, both ligands, L1 and H18, bind tightly to the protein, with less than 0.35 nm, which is below the maximum distance required for hydrogen bond formation.
Hydrogen bonds play a pivotal role in stabilizing protein-ligand complexes. The occupancy of hydrogen bonds throughout MD simulations can be indicative of the binding strength; a higher occupancy suggests a more stable interaction.54 Hydrogen bond analysis indicates that L1 binds more stably to the protein compared to H18, due to a higher number of hydrogen bonds formed throughout the 100 ns MD simulation (Fig. S5). The acarbose complex initially forms a large number of hydrogen bonds during the first 30 ns, then stabilizes at 5–7 bonds, which is attributed to its polyhydroxylated structure. In contrast, the L1 ligand, although smaller, establishes a stable network of hydrogen bonds (4 to 6 bonds) during the 30 to 100 ns phase, with no initial fluctuations. This consistent binding for L1 matches RMSD and Rg data, indicating its robustness and stability, making it comparable to acarbose and significantly better than the H18 model.
The gmx_MMPBSA tool is a computational method used for estimating the binding free energy of protein-ligand complexes within the GROMACS molecular dynamics simulation framework. This tool employs the MM/PBSA methodology, which integrates molecular mechanics with continuum solvation models to provide estimates of binding affinities. The MM/PBSA approach calculates the free energy of binding by considering the energy contributions from both the ligand and the protein, effectively bridging the gap between molecular dynamics simulations and thermodynamic calculations.38 During the 100 ns MD simulation, H18 bound more strongly to the protein compared to L1, exhibiting a higher binding affinity with binding free energies of -21.45 and -15.45 kcal/mol, respectively (Table 4 and Fig. S6). The traditional drug acarbose showed the lowest binding affinity among all the compounds tested, with a total binding free energy of only -6.953 kcal/mol. This lower affinity is due to its electrostatic (-4.79 kcal/mol) and van der Waals (-9.32 kcal/mol) contributions, which are much lower than those of the selected ligands. Overall, these results confirm the potential of the suggested ligands (L1 and H18) as effective inhibitors, as they exhibit a much higher binding affinity for the enzyme α-amylase than acarbose.
Table 4.
Energetic Components of Protein-Ligand Complexes (L1 and H18)
|
Complex
|
|
kcal/mol
|
|
VDWAALS
|
EEL
|
EPB
|
ENPOLAR
|
GGAS
|
GSOLV
|
Total
|
| L1 Complex |
Average |
-39.66 |
-25.64 |
54.16 |
-4.3 |
-65.31 |
49.86 |
-15.45 |
| SD |
3.15 |
12.42 |
8.6 |
0.1 |
10.87 |
8.59 |
6.09 |
| SEM |
0.22 |
0.88 |
0.61 |
0.01 |
0.77 |
0.61 |
0.43 |
| H18 complex |
Average |
-33.26 |
-8.89 |
24.06 |
-3.36 |
-42.15 |
20.7 |
-21.45 |
| SD |
4.04 |
6.17 |
6.07 |
0.36 |
7.27 |
5.88 |
4.21 |
| SEM |
0.28 |
0.44 |
0.43 |
0.03 |
0.51 |
0.41 |
0.3 |
Acarbose
complex |
Average |
-9.32 |
-4.79 |
8.48 |
-1.31 |
-14.12 |
7.17 |
-6.95 |
| SD |
0.65 |
1.00 |
0.96 |
0.07 |
1.20 |
0.94 |
0.61 |
| SEM |
0.09 |
0.13 |
0.13 |
0.01 |
0.16 |
0.12 |
0.08 |
Analysis of predicted tunnels and biological efficacy
The structural details of the tunnels
This study analyzes predicted molecular tunnels within a protein receptor called 7TAA, focusing on their structural characteristics and biological efficacy in relation to ligand transport and inhibition. Three distinct tunnels are identified and characterized based on geometric and energetic parameters, which influence the passage of designed ligands (L1-L4) and the reference drug acarbose. Tunnel 1 and Tunnel 2 exhibit the largest bottleneck radius at 3.70 Å, indicating a relatively wide entrance that may facilitate easier ligand entry compared to Tunnel 3 which has a narrower bottleneck of 3.00 Å. The distance from the tunnel entrance to the protein surface is shortest for Tunnel 1 at 3.60 Å and longest for Tunnel 2 and Tunnel 3 both exceeding 4.90 Å, suggesting that Tunnel 1 may allow more direct access to the active site (Table S8).
Fig. 7 visually represents the three predicted tunnels with Tunnel 1 in blue Tunnel 2 in green and Tunnel 3 in red providing a spatial context for their location within the receptor structure. Fig. S7 plots the radius of each tunnel along its length revealing regions of constriction particularly in Tunnel 3 where the bottleneck is clearly evident. This graphical representation supports the numerical data indicating that Tunnel 3 may pose greater steric hindrance to ligand diffusion.
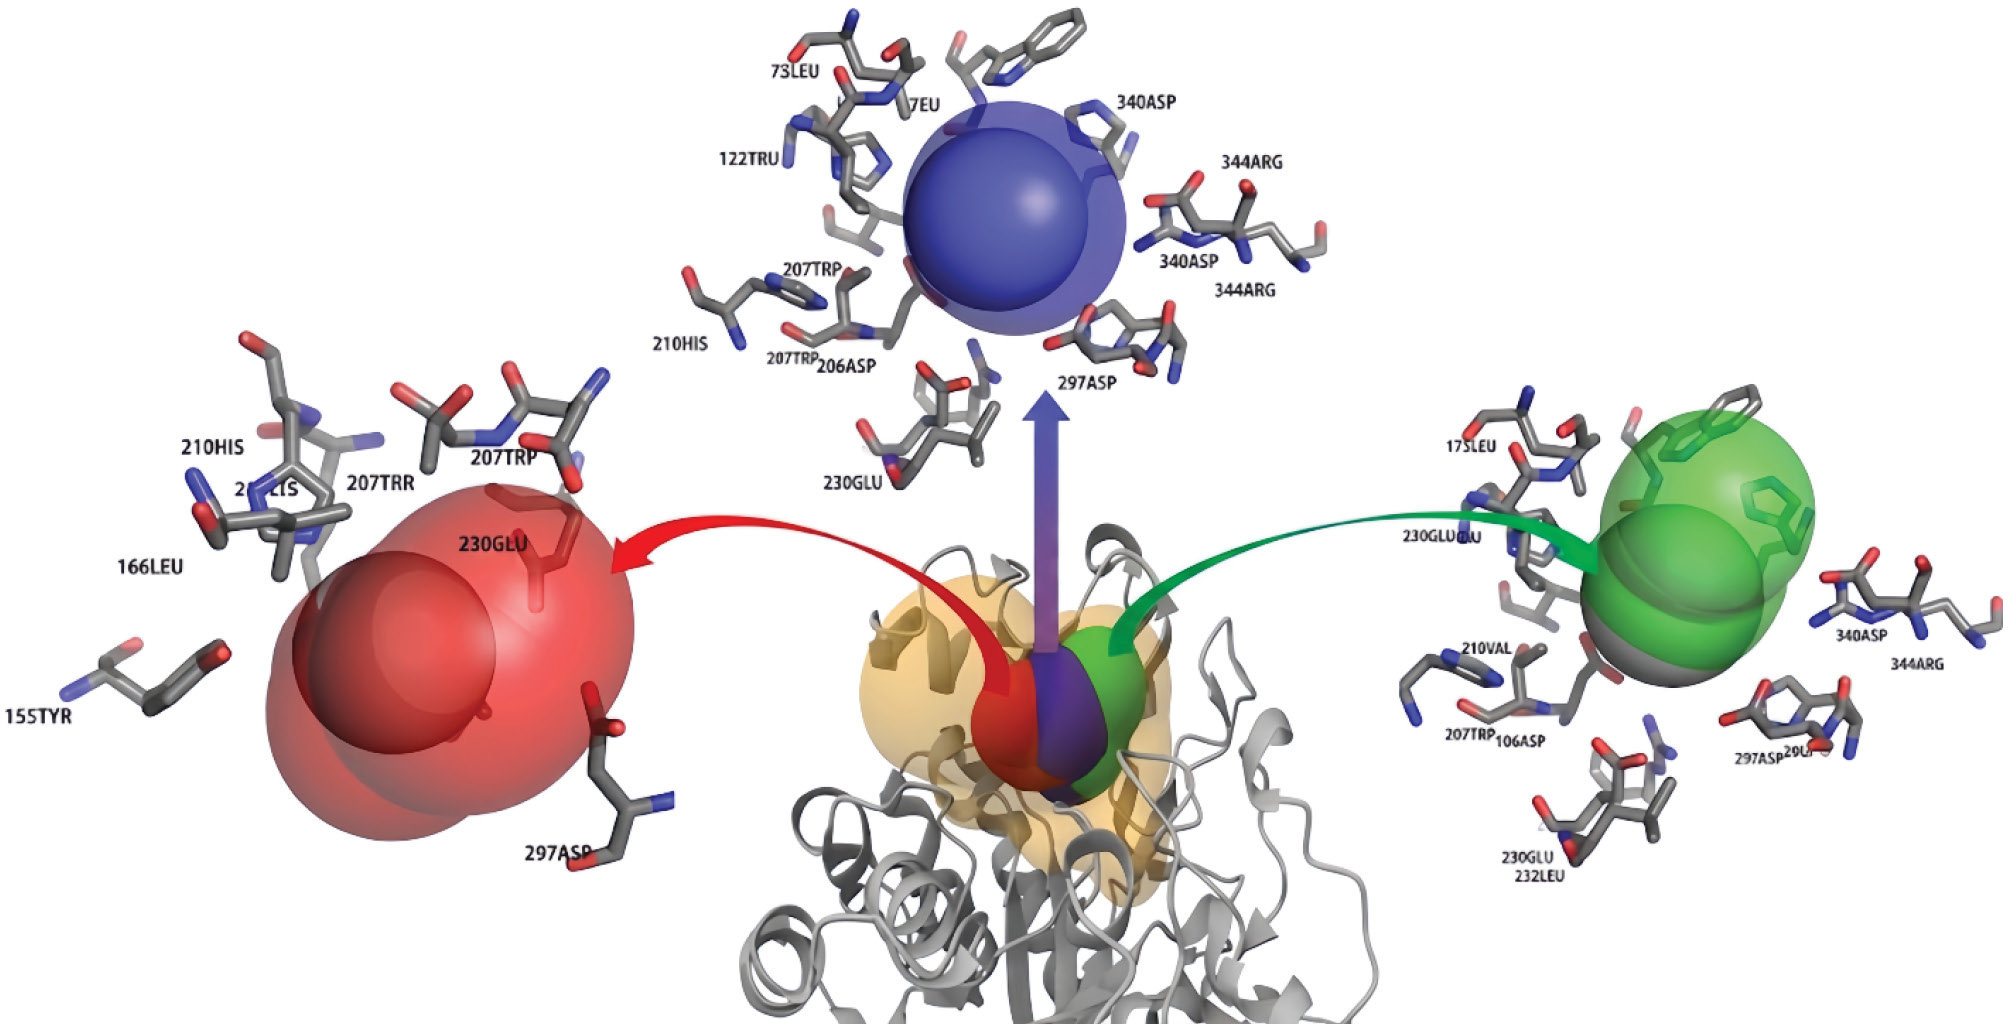
Fig. 7.
Generated tunnels 1 (blue), 2 (green) and 3 (red)
.
Generated tunnels 1 (blue), 2 (green) and 3 (red)
Table S9 details the energetic landscapes of the ligands as they pass through the different tunnels. The parameters of interest for determining the viability and kinetics of ligand passage are the binding energy Emax and Ea the activation energy. L1 for example demonstrates favorable Emax for all tunnels with the lowest value of -7.3 kcal/mol in Tunnel 3 demonstrating strong binding. Moreover, Ea is very low at 0.1 kcal/mol in Tunnel 1 suggesting a very low energy barrier for entry. L3 also shows strong binding in Tunnel 1 but with a very high Ea of 2.6 kcal/mol which may slow its transport despite strong binding. The reference inhibitor, acarbose, has the most favorable Emax of -8.4 kcal/mol in Tunnel 1 which indicates the best binding of all ligands, but then Ea increases significantly in Tunnel 2 and Tunnel 3 where it is 5.1 kcal/mol which may obstruct access through these pathways. Acarbose and the developed inhibitors' activation energies in each of the three tunnels are contrasted in Fig. S8, which shows that Tunnel 1 always provides the lowest energy barrier for the majority of ligands. This implies that the most kinetically advantageous path for ligand entry is Tunnel 1.
Biological efficacy
The analysis of the activation energies shows that tunnel 1 consistently has the lowest energy barrier. This makes it the most favorable path for ligand entry. Evaluating the data using Ea, Ki, IC50, and BE supports this finding (Table S10). L1 and L2 ligands perform best in tunnel 1, with very low Ea values and high BE values. However, their effectiveness decreases in tunnels 2 and 3. L4 also shows significant biological efficacy in the three tunnels. In contrast, L3 has limited effectiveness in tunnel 1 due to high Ea, but it performs best in tunnel 3, where Ea is low and BE is high, making this tunnel its preferred route. Compared to engineered ligands, acarbose has lower inhibition potential. It shows higher Ea values, higher IC50, and lower BE values in all tunnels. Although it binds strongly, its ability to inhibit is reduced by kinetic barriers, particularly in longer or more curved tunnels.
Overall, the results suggest that tunnel 1 is the best transport path for most ligands. This is due to its short length, wide bottleneck, and low curvature. Tunnel 3 may be ideal for specific compounds like L3. The findings also demonstrate that the geometric features of the tunnels and the activation energy affect transport efficiency and inhibition. Biological activity comes from a combination of these factors. Notably, the designed ligands, especially L1, outperform acarbose in biological effectiveness across all tunnels. This emphasizes their potential as more effective antidiabetic agents and highlights the importance of tunnel dynamics in drug design.
(Tunnel 1:
Tunnel 2:
Tunnel 3:
Ligand design retrosynthesis
The study describes the RXN for Chemistry platform (https://rxn.app.accelerate.science/rxn/home), which uses artificial intelligence to predict synthetic pathways. This tool helped design a practical route for the candidate drug L1 by breaking down the target molecule into accessible and affordable precursors. Among the proposed pathways, researchers chose the one with the highest computational score, which involves four steps backed by literature (Fig. 8). In the first step, a substituted benzaldehyde and an active methylene compound undergo Knoevenagel condensation to begin synthesis. To obtain the α, β-unsaturated system needed for the final scaffold, this reaction is usually carried out in ethanol under reflux (or at room temperature for highly reactive substrates) using a soft base such as piperidine or ammonium acetate.
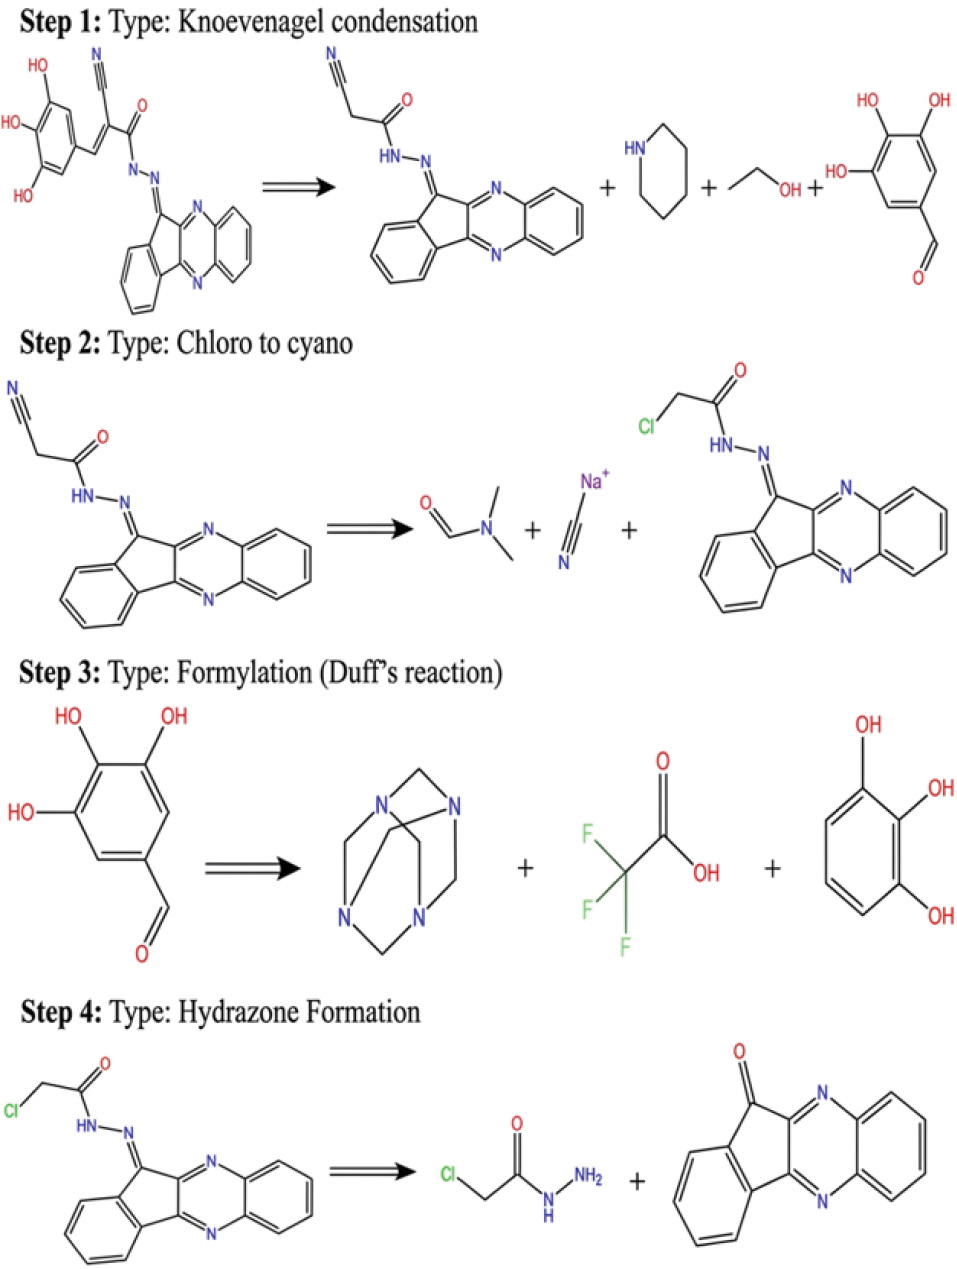
Fig. 8.
Steps generated by L1 molecule retrosynthesis
.
Steps generated by L1 molecule retrosynthesis
The second step is a nucleophilic substitution (SN2), in which a cyano group replaces the chloro substituent. By adding sodium or potassium cyanide (NaCN or KCN) to the reaction mixture in an aprotic polar solvent (such as DMF or DMSO) at a moderate temperature (50–80°C), the cyano-acetamide derivative can be formed more easily.
The third step is a formylation that introduces a formyl group (–CHO) on the aromatic ring. This is specifically the Duff reaction, which uses hexamethylenetetramine (HMTA) in an acidic medium (trifluoroacetic acid) to perform an ortho-selective aromatic electrophilic substitution on a phenol. This step creates a responsive site that is essential for future changes. The final step shows the formation of a hydrazone by condensation between a hydrazine derivative (chlorinated hydrazide) and a polycyclic ketone. The mechanism involves the nucleophilic attack of hydrazine on the carbonyl group of the ketone, followed by water removal to form the characteristic C = N bond of hydrazone. This synthetic route not only allows laboratory preparation of L1 but also sets the stage for structural improvement. By changing reaction conditions or different substituents, researchers can make analogs with better potency, solubility, stability, or selectivity, making it easier to evaluate them in biological studies. Combining AI-driven retrosynthesis with reliable organic transformations offers a clear and scalable approach for developing new antidiabetic agents.
Conclusion
In this study, virtual simulation techniques including 3D-QSAR modeling, ADMET profiling, molecular docking molecular dynamics, biological efficacy and retrosynthesis were employed to investigate a series of Indenoquinoxaline-phenylacrylohydrazide hybrids as potential α-amylase inhibitors. By incorporating descriptors such as steric effects, hydrogen bond donor/acceptor properties, and hydrophobic domains, the partial least squares (PLS) method combined with CoMSIA yielded robust statistical performance, demonstrating strong correlation and predictive capacity (Q2 = 0.541, R2 = 0.973, SEE = 0.076). The pharmacokinetic behavior of designed compounds was further evaluated using ADMET analyses. Molecular docking studies elucidated the binding interactions between these ligands and the active site of the α-amylase enzyme, identifying key residues namely Gln35, Trp83, His122, Asp206, Asp297, Asp340, and Arg344 as critical contributors to ligand affinity and potential inhibitory activity. Furthermore, MD simulations over 100 nanoseconds revealed that the optimized ligand L1 exhibited enhanced binding stability, supported by a greater number of hydrogen bonds and a notable binding free energy of −15.45 kcal/mol. Analysis of ligand diffusion pathways within the receptor provided insights into potential release mechanisms and the relative bioactivity of each candidate. Retrosynthetic analysis further proposed viable synthetic routes for L1, highlighting its potential as a lead compound in the development of potent α-amylase inhibitors. Collectively, these findings underscore the promising therapeutic relevance of L1, offering a compelling foundation for future drug discovery efforts targeting diabetes mellitus.
Research Highlights
What is the current knowledge?
-
α-Amylase inhibition is a proven therapeutic strategy for managing postprandial glucose levels in type 2 diabetes.
-
Indenoquinoxaline-phenylacrylohydrazide hybrids are known scaffolds with potential biological activity against metabolic enzymes.
-
Conventional drug discovery relies on experimental screening, which is often time-consuming and resource-intensive.
-
Standard docking studies provide initial binding insights but often lack dynamic stability and transport path data.
What is new here?
-
A robust 3D-QSAR CoMSIA model (R2 = 0.973) was developed to predict potent α-amylase inhibitory activity.
-
Integration of 100 ns molecular dynamics and MM-PBSA confirmed the structural stability of the new ligand-enzyme complexes.
-
CaverDock analysis successfully tracked the ligand's transport trajectory from the α-amylase active site to the protein surface.
-
Specific ADMET profiling and retrosynthetic pathways were established to ensure the synthetic feasibility of the lead compounds.
Competing Interests
No potential conflict of interest was reported by the authors.
Ethical Approval
Not applicable.
Supplementary files
Supplementary file 1 contains Figs. S1-S8 and Tables S1-S10.
(pdf)
References
- Sun X, Yu W, Hu C. Genetics of type 2 diabetes: insights into the pathogenesis and its clinical application. Biomed Res Int 2014; 2014:926713. doi: 10.1155/2014/926713 [Crossref] [ Google Scholar]
- Wolde HF, Atsedeweyen A, Jember A, Awoke T, Mequanent M, Tsegaye AT, et al. Predictors of vascular complications among type 2 diabetes mellitus patients at University of Gondar Referral Hospital: a retrospective follow-up study. BMC Endocr Disord 2018. 18: 52. doi: 10.1186/s12902-018-0280-0.
- Hong H, Zheng Y, Song S, Zhang Y, Zhang C, Liu J. Identification and characterization of DPP-IV inhibitory peptides from silver carp swim bladder hydrolysates. Food Biosci 2020; 38:100748. doi: 10.1016/j.fbio.2020.100748 [Crossref] [ Google Scholar]
- Ghani U. Re-exploring promising α-glucosidase inhibitors for potential development into oral anti-diabetic drugs: finding needle in the haystack. Eur J Med Chem 2015; 103:133-62. doi: 10.1016/j.ejmech.2015.08.043 [Crossref] [ Google Scholar]
- Derosa G, Maffioli P. α-Glucosidase inhibitors and their use in clinical practice. Arch Med Sci 2012; 8:899-906. doi: 10.5114/aoms.2012.31621 [Crossref] [ Google Scholar]
- Lakshmana Senthil S, Raghu C, Arjun H A, Anantharaman P. In vitro and in silico inhibition properties of fucoidan against α-amylase and α-D-glucosidase with relevance to type 2 diabetes mellitus. Carbohydr Polym 2019; 209:350-5. doi: 10.1016/j.carbpol.2019.01.039 [Crossref] [ Google Scholar]
- Villaño D, Fernández-Pachón MS, Moyá ML, Troncoso AM, García-Parrilla MC. Radical scavenging ability of polyphenolic compounds towards DPPH free radical. Talanta 2007; 71:230-5. doi: 10.1016/j.talanta.2006.03.050 [Crossref] [ Google Scholar]
- Pereira JA, Pessoa AM, Cordeiro MN, Fernandes R, Prudêncio C, Noronha JP. Quinoxaline, its derivatives and applications: a state-of-the-art review. Eur J Med Chem 2015; 97:664-72. doi: 10.1016/j.ejmech.2014.06.058 [Crossref] [ Google Scholar]
- Watanabe K, Oguri H, Oikawa H. Diversification of echinomycin molecular structure by way of chemoenzymatic synthesis and heterologous expression of the engineered echinomycin biosynthetic pathway. Curr Opin Chem Biol 2009; 13:189-96. doi: 10.1016/j.cbpa.2009.02.012 [Crossref] [ Google Scholar]
- Dietrich B, Diederichsen U. Synthesis of cyclopeptidic analogues of triostin A with quinoxalines or nucleobases as chromophores. European J Org Chem 2005; 2005:147-53. doi: 10.1002/ejoc.200400548 [Crossref] [ Google Scholar]
- Hajri M, Esteve MA, Khoumeri O, Abderrahim R, Terme T, Montana M. Synthesis and evaluation of invitro antiproliferative activity of new ethyl 3-(arylethynyl)quinoxaline-2-carboxylate and pyrido[4,3-b]quinoxalin-1(2H)-one derivatives. Eur J Med Chem 2016; 124:959-66. doi: 10.1016/j.ejmech.2016.10.025 [Crossref] [ Google Scholar]
- Quiliano M, Pabón A, Ramirez-Calderon G, Barea C, Deharo E, Galiano S. New hydrazine and hydrazide quinoxaline 1,4-di-N-oxide derivatives: in silico ADMET, antiplasmodial and antileishmanial activity. Bioorg Med Chem Lett 2017; 27:1820-5. doi: 10.1016/j.bmcl.2017.02.049 [Crossref] [ Google Scholar]
- Patel HM, Bhardwaj V, Sharma P, Noolvi MN, Lohan S, Bansal S. Quinoxaline-PABA bipartite hybrid derivatization approach: design and search for antimicrobial agents. J Mol Struct 2019; 1184:562-8. doi: 10.1016/j.molstruc.2019.02.074 [Crossref] [ Google Scholar]
- Suwanhom P, Saetang J, Khongkow P, Nualnoi T, Tipmanee V, Lomlim L. Synthesis, biological evaluation, and in silico studies of new acetylcholinesterase inhibitors based on quinoxaline scaffold. Molecules 2021; 26:4895. doi: 10.3390/molecules26164895 [Crossref] [ Google Scholar]
- Peraman R, Kuppusamy R, Killi SK, Reddy YP. New conjugates of quinoxaline as potent antitubercular and antibacterial agents. Int J Med Chem 2016; 2016:6471352. doi: 10.1155/2016/6471352 [Crossref] [ Google Scholar]
- Achutha L, Parameshwar R, Reddy BM, Babu VH. Microwave-assisted synthesis of some quinoxaline-incorporated Schiff bases and their biological evaluation. J Chem 2013; 2013:578438. doi: 10.1155/2013/578438 [Crossref] [ Google Scholar]
- Guan S, Wang G. Drug discovery and development in the era of artificial intelligence: from machine learning to large language models. Artif Intell Chem 2024; 2:100070. doi: 10.1016/j.aichem.2024.100070 [Crossref] [ Google Scholar]
- Han R, Yoon H, Kim G, Lee H, Lee Y. Revolutionizing medicinal chemistry: the application of artificial intelligence (AI) in early drug discovery. Pharmaceuticals (Basel) 2023; 16:1259. doi: 10.3390/ph16091259 [Crossref] [ Google Scholar]
-
Garg S, Arora K, Singh S, Nagarajan K. Artificial intelligence and machine learning in drug discovery and development. In: Artificial Intelligence in the Age of Nanotechnology. IGI Global Scientific Publishing. 2024. p. 42-61. doi: 10.4018/979-8-3693-0368-9.ch003.
- Pourseif MM, Baradaran Hosseini SA, Khoshraftar SH, Omidi Y. The role of bioinformatics algorithms in modern biopharmaceutical design: progress, challenges, and future perspectives. Bioimpacts 2025; 15:33072. doi: 10.34172/bi.33072 [Crossref] [ Google Scholar]
- Masoudi-Sobhanzadeh Y, Jafari B, Parvizpour S, Pourseif MM, Omidi Y. A novel multi-objective metaheuristic algorithm for protein-peptide docking and benchmarking on the LEADS-PEP dataset. Comput Biol Med 2021; 138:104896. doi: 10.1016/j.compbiomed.2021.104896 [Crossref] [ Google Scholar]
- Naanaai L, Aissouq AE, Zaitan H, Bouachrine M, Khalil F. Computational study of 2-aryl quinoxaline derivatives as α-amylase inhibitors. Chem Data Collect 2023; 47:101079. doi: 10.1016/j.cdc.2023.101079 [Crossref] [ Google Scholar]
- Khaldan A, Bouamrane S, El-mernissi R, Ouabane M, Alaqarbeh M, Maghat H. Design of new α-glucosidase inhibitors through a combination of 3D-QSAR, ADMET screening, molecular docking, molecular dynamics simulations and quantum studies. Arab J Chem 2024; 17:105656. doi: 10.1016/j.arabjc.2024.105656 [Crossref] [ Google Scholar]
- Gupta S, Baweja GS, Singh S, Irani M, Singh R, Asati V. Integrated fragment-based drug design and virtual screening techniques for exploring the antidiabetic potential of thiazolidine-2,4-diones: design, synthesis and in vivo studies. Eur J Med Chem 2023; 261:115826. doi: 10.1016/j.ejmech.2023.115826 [Crossref] [ Google Scholar]
- Hameed S, Saleem F, Özil M, Baltaş N, Salar U, Ashraf S. Indenoquinoxaline-phenylacrylohydrazide hybrids as promising drug candidates for the treatment of type 2 diabetes: in vitro and in silico evaluation of enzyme inhibition and antioxidant activity. Int J Biol Macromol 2024; 263:129517. doi: 10.1016/j.ijbiomac.2024.129517 [Crossref] [ Google Scholar]
- Tong J, Zhan P, Wang XS, Wu Y. Quionolone carboxylic acid derivatives as HIV-1 integrase inhibitors: docking-based HQSAR and topomer CoMFA analyses. J Chemom 2017; 31:e2934. doi: 10.1002/cem.2934 [Crossref] [ Google Scholar]
- Caballero J, Saavedra M, Fernández M, González-Nilo FD. Quantitative structure-activity relationship of rubiscolin analogues as delta opioid peptides using comparative molecular field analysis (CoMFA) and comparative molecular similarity indices analysis (CoMSIA). J Agric Food Chem 2007; 55:8101-4. doi: 10.1021/jf071031h [Crossref] [ Google Scholar]
- Naanaai L, Ouabane M, El Aissouq A, Guendouzi A, Zaitan H, Bouachrine M. Indole-pyridine carbonitriles as potential anti-diabetic agents: a computational study using 3D-QSAR, molecular docking, ADME-Tox and molecular dynamics simulations. Chem Afr 2025; 8:1405-25. doi: 10.1007/s42250-025-01244-w [Crossref] [ Google Scholar]
-
Roy K, Kar S, Das RN. QSAR/QSPR modeling: introduction. In: Roy K, S Kar, RN Das, eds. A Primer on QSAR/QSPR Modeling: Fundamental Concepts. Cham: Springer International Publishing. 2015. p. 1-36. doi: 10.1007/978-3-319-17281-1_1.
- Frey A, Di Canzio J, Zurakowski D. A statistically defined endpoint titer determination method for immunoassays. J Immunol Methods 1998; 221:35-41. doi: 10.1016/s0022-1759(98)00170-7 [Crossref] [ Google Scholar]
- Eriksson L, Jaworska J, Worth AP, Cronin MT, McDowell RM, Gramatica P. Methods for reliability and uncertainty assessment and for applicability evaluations of classification- and regression-based QSARs. Environ Health Perspect 2003; 111:1361-75. doi: 10.1289/ehp.5758 [Crossref] [ Google Scholar]
- Pires DE, Blundell TL, Ascher DB. pkCSM: predicting small-molecule pharmacokinetic and toxicity properties using graph-based signatures. J Med Chem 2015; 58:4066-72. doi: 10.1021/acs.jmedchem.5b00104 [Crossref] [ Google Scholar]
- Trott O, Olson AJ. AutoDock Vina: improving the speed and accuracy of docking with a new scoring function, efficient optimization, and multithreading. J Comput Chem 2010; 31:455-61. doi: 10.1002/jcc.21334 [Crossref] [ Google Scholar]
- Brzozowski AM, Davies GJ. Structure of the Aspergillus oryzae α-amylase complexed with the inhibitor acarbose at 20 A resolution. Biochemistry 1997; 36:10837-45. doi: 10.1021/bi970539i [Crossref] [ Google Scholar]
- Wang Q, He J, Wu D, Wang J, Yan J, Li H. Interaction of α-cyperone with human serum albumin: determination of the binding site by using Discovery Studio and via spectroscopic methods. J Lumin 2015; 164:81-5. doi: 10.1016/j.jlumin.2015.03.025 [Crossref] [ Google Scholar]
- Jo S, Kim T, Iyer VG, Im W. CHARMM-GUI: a web-based graphical user interface for CHARMM. J Comput Chem 2008; 29:1859-65. doi: 10.1002/jcc.20945 [Crossref] [ Google Scholar]
- Van Der Spoel D, Lindahl E, Hess B, Groenhof G, Mark AE, Berendsen HJ. GROMACS: fast, flexible, and free. J Comput Chem 2005; 26:1701-18. doi: 10.1002/jcc.20291 [Crossref] [ Google Scholar]
- Valdés-Tresanco MS, Valdés-Tresanco ME, Valiente PA, Moreno E. gmx_MMPBSA: a new tool to perform end-state free energy calculations with GROMACS. J Chem Theory Comput 2021; 17:6281-91. doi: 10.1021/acs.jctc.1c00645 [Crossref] [ Google Scholar]
- Dong L, Li P, Wang B. Enhancing MM/P(G)BSA methods: integration of formulaic entropy for improved binding free energy calculations. J Comput Chem 2025; 46:e70093. doi: 10.1002/jcc.70093 [Crossref] [ Google Scholar]
- Moukhliss Y, Koubi Y, Zafar I, Alaqarbeh M, Maghat H, Sbai A. Design of novel isoxazole derivatives as tubulin inhibitors using computer-aided techniques: QSAR modeling, in silico ADMETox, molecular docking, molecular dynamics, biological efficacy, and retrosynthesis. J Biomol Struct Dyn 2025; 43:4997-5008. doi: 10.1080/07391102.2024.2306493 [Crossref] [ Google Scholar]
- Filipovic J, Vavra O, Plhak J, Bednar D, Marques SM, Brezovsky J. CaverDock: a novel method for the fast analysis of ligand transport. IEEE/ACM Trans Comput Biol Bioinform 2020; 17:1625-38. doi: 10.1109/tcbb.2019.2907492 [Crossref] [ Google Scholar]
- Naanaai L, Ouabane M, Moukhliss Y, El Aissouq A, Zaitan H, Bouachrine M. Design of novel thiazole-based Schiff analogs as α-amylase inhibitors using 3D-QSAR, ADME-Tox, molecular docking, molecular dynamics, biological efficacy, and retrosynthesis. ChemistrySelect 2024; 9:e202404972. doi: 10.1002/slct.202404972 [Crossref] [ Google Scholar]
- Brezovsky J, Babkova P, Degtjarik O, Fortova A, Gora A, Iermak I. Engineering a de novo transport tunnel. ACS Catal 2016; 6:7597-610. doi: 10.1021/acscatal.6b02081 [Crossref] [ Google Scholar]
- Wang L, Wang N, Zhang W, Cheng X, Yan Z, Shao G. Therapeutic peptides: current applications and future directions. Signal Transduct Target Ther 2022; 7:48. doi: 10.1038/s41392-022-00904-4 [Crossref] [ Google Scholar]
- Gómez-Bombarelli R, Wei JN, Duvenaud D, Hernández-Lobato JM, Sánchez-Lengeling B, Sheberla D. Automatic chemical design using a data-driven continuous representation of molecules. ACS Cent Sci 2018; 4:268-76. doi: 10.1021/acscentsci.7b00572 [Crossref] [ Google Scholar]
- Segler MHS, Preuss M, Waller MP. Planning chemical syntheses with deep neural networks and symbolic AI. Nature 2018; 555:604-10. doi: 10.1038/nature25978 [Crossref] [ Google Scholar]
- Han Y, Zhang J, Hu CQ, Zhang X, Ma B, Zhang P. In silico ADME and toxicity prediction of ceftazidime and its impurities. Front Pharmacol 2019; 10:434. doi: 10.3389/fphar.2019.00434 [Crossref] [ Google Scholar]
- Speciale A, Muscarà C, Molonia MS, Cimino F, Saija A, Giofrè SV. Silibinin as potential tool against SARS-Cov-2: in silico spike receptor-binding domain and main protease molecular docking analysis, and in vitro endothelial protective effects. Phytother Res 2021; 35:4616-25. doi: 10.1002/ptr.7107 [Crossref] [ Google Scholar]
- Khenifi ML, Serseg T, Migas P, Krauze-Baranowska M, Özdemir S, Bensouici C. HPLC-DAD-MS characterization, antioxidant activity, α-amylase inhibition, molecular docking, and ADMET of flavonoids from fenugreek seeds. Molecules 2023; 28:7798. doi: 10.3390/molecules28237798 [Crossref] [ Google Scholar]
- Kashyap P, Bhardwaj VK, Chauhan M, Chauhan V, Kumar A, Purohit R. A ricin-based peptide BRIP from Hordeum vulgare inhibits M(pro) of SARS-CoV-2. Sci Rep 2022; 12:12802. doi: 10.1038/s41598-022-15977-y [Crossref] [ Google Scholar]
- Choi K, Lee Y, Kim C. An in silico study for expanding the utility of cannabidiol in Alzheimer's disease therapeutic development. Int J Mol Sci 2023; 24:16013. doi: 10.3390/ijms242116013 [Crossref] [ Google Scholar]
- Ahmed FZ, Ahmad AA, Kharazian B. A molecular dynamics study of the interaction between graphene as a carrier and gemcitabine as a chemotherapy. Zanco J Pure Appl Sci 2023; 35:23-9. doi: 10.21271/ZJPAS.35.1.3 [Crossref] [ Google Scholar]
- Raju L, Javan Nikkhah S, MosaChristas K, Vandichel M, Eswaran R. Anticancer potential of dendritic poly(aryl ether)-substituted polypyridyl ligand-based ruthenium(II) coordination entities. ACS Appl Bio Mater 2023; 6:4226-39. doi: 10.1021/acsabm.3c00452 [Crossref] [ Google Scholar]
- Sarker DK, Ray P, Rouf R, Shilpi JA, Uddin SJ. In silico molecular docking and dynamic investigations of bioactive phytoconstituents from fenugreek seeds as a potent drug against DPP-IV enzyme. ACS Food Sci Technol 2023; 3:1423-39. doi: 10.1021/acsfoodscitech.3c00102 [Crossref] [ Google Scholar]