Bioimpacts. 16:33372.
doi: 10.34172/bi.33372
Original Article
Classification of recurrent implantation failure patients using peripheral blood immunological and metabolic markers
Sina Baharaghdam Conceptualization, Data curation, Investigation, Methodology, Visualization, Writing – original draft, 1, 2 
Özkan Yildirim Formal analysis, Software, Writing – review & editing, 3
Mohammadbagher Pirouzpanah Formal analysis, Software, Writing – review & editing, 4
Danial Abbas Kabiri Software, Writing – review & editing, 3
Shima Karimi Data curation, Writing – original draft, 1, 2
Mohammad Esfini Farahani Data curation, Writing – original draft, 5
Amirhossein Aghapour Software, 1, 2
Ali Hassanzadeh Investigation, 6
Amin Kamrani Investigation, 1, 2
Reza Mousavi Ardehaie Formal analysis, Writing – review & editing, 4
Amir Mehdizadeh Investigation, 7
Parvin Hakimi Resources, Validation, 8
Javad Ahmadian Heris Resources, Validation, 9
Leili Aghebati-Maleki Methodology, Project administration, Validation, 1, 2
Mehdi Yousefi Conceptualization, Funding acquisition, Methodology, Project administration, Supervision, Validation, Visualization, 4, 2, *
Author information:
1Immunology Research Center, Tabriz University of Medical Sciences, Tabriz, Iran
2Department of Immunology, Faculty of Medicine, Tabriz University of Medical Sciences, Tabriz, Iran
3Department of Histology and Embryology, Institute of Health Sciences, Atatürk University, Erzurum, Türkiye
4Molecular Medicine Research Center, Tabriz University of Medical Sciences, Tabriz, Iran
5Department of Toxicology and Cancer Biology, University of Kentucky, Lexington, USA
6Department of Applied Cell Sciences, School of Advanced Technologies in Medicine, Tehran University of Medical Sciences, Tehran, Iran
7Hematology and Oncology Research Center, Tabriz University of Medical Sciences, Tabriz, Iran
8Women’s Reproductive Health Research Center, Tabriz University of Medical Sciences, Tabriz, Iran
9Department of Allergy and Clinical Immunology, Pediatric Hospital, Tabriz University of Medical Sciences, Tabriz, Iran
Abstract
Introduction:
Recurrent implantation failure (RIF) is a complex condition that makes it one of the most challenging cases in the field of infertility. The diagnosis of this condition with the immunological etiology may be aided by determining the endometrial immune profile for the classification of these patients. Current diagnostic approaches are based on invasive endometrial biopsies to classify patients into balanced, low, or over-immune activation profiles, which have limitations for routine use and serial monitoring. This study aimed to develop and validate a minimally invasive peripheral blood-based classification system using immunological and metabolic markers to mirror endometrial immune profiles in RIF patients.
Methods:
Endometrial tissue and peripheral blood samples were collected during the mid-luteal phase from 163 RIF patients and 28 fertile controls. Endometrial immune profiles were determined via RT-qPCR for IL-18, IL-15, TWEAK, Fn-14, and CD56, classifying RIF into balanced, low, and over-immune activation subgroups, with sample sizes of 32, 47, and 84 women, respectively. Peripheral blood was analyzed by flow cytometry to determine the Th1/Th2 ratio and NK cell percentage; by ELISA to measure nuclear antibodies (ANA, anti-dsDNA), phospholipid-related antibodies (anticardiolipin, anti-β2-glycoprotein I, antiphospholipid antibodies), thyroid-related antibodies (anti-TPO, anti-TG), anti-tissue transglutaminase (anti-TTG), and metabolites (S1P, adiponectin, leptin, PGE2, phosphatidylserine, IGF-1); and by spectrophotometry to quantify total phospholipids.
Results:
The over-immune activation group showed significantly elevated Th1/Th2 ratios, NK-cell percentages, and autoantibodies (ANA, anti-phospholipid, anti-β2-glycoprotein I, anti-TG, anti-TPO) compared to balanced and low-immune activation groups. Metabolic profiles revealed higher leptin, and total phospholipids but lower adiponectin, S1P, and PGE2 in over-immune activation group. The low-activation group exhibited lower Th1/Th2 ratios, reduced leptin, but elevated adiponectin, S1P, and PGE2 versus balanced and over-immune activation groups. No significant differences were found in phosphatidylserine or IGF-1 across groups.
Conclusion:
Our results demonstrate that peripheral blood immunological and metabolic markers can effectively distinguish RIF immune endotypes, offering a non-invasive alternative to endometrial biopsy for personalized assisted reproductive technology (ART) management and potentially improving implantation success through targeted therapies.
Graphical Abstract
Keywords: Recurrent implantation failure, Immune profile, Infertility, Personalized treatment
Copyright and License Information
© 2026 The Author(s).
This work is published by BioImpacts as an open access article distributed under the terms of the Creative Commons Attribution Non-Commercial License (
http://creativecommons.org/licenses/by-nc/4.0/). Non-commercial uses of the work are permitted, provided the original work is properly cited.
Funding Statement
This study was supported by the Tabriz University of Medical Sciences. (Grant number: 73119)
Introduction
The preimplantation genetic testing (PGT) consortium of European Society of Human Reproduction and Embryology (ESHRE) currently considers recurrent implantation failure (RIF) to be present when implantation does not occur after the transfer of three or more morphologically high-quality embryos in women younger than 40 years, or after fewer transfers in older patients. This complicated condition, which affects 10–15% of couples undergoing in vitro fertilization (IVF), continues to be one of the most challenging problems in assisted reproductive technologies.1,2 Although fetal chromosomal abnormalities are the main cause of implantation failure, a significant proportion of them persist despite the transfer of euploid embryos, highlighting the critical role of maternal factors—particularly altered endometrial receptivity and dysregulated local immune regulation—in the pathogenesis of this disorder.3
During the window of implantation (WOI), the endometrium undergoes precisely orchestrated immunological remodeling to establish selective maternal tolerance toward the semi-allogeneic embryo while maintaining effective defense against pathogens.4 This finely tuned equilibrium is maintained through dynamic changes in the composition and function of uterine natural killer (uNK) cells, regulatory T (Treg) cells, and various T-cell subsets, together with a complex network of cytokines and chemokines. Both excessive pro-inflammatory states, such as a dominance of T-helper (Th)1 or Th17 cells, and overly immunosuppressive profiles characterized by Th2 deviation or an overrepresentation of Treg cells have consistently been associated with implantation failure and recurrent pregnancy loss (RPL).5,6 Accordingly, detailed characterization of the endometrial immune profile has emerged as a powerful diagnostic and therapeutic tool, enabling the identification of specific immune dysregulations and facilitating tailored immunomodulatory interventions in affected patients.7,8
Recent advances have shifted the focus from static histological assessments to analyzing the immune profile of the endometrium as a strategy to better understand RIF heterogeneity. Notably, using RT-qPCR analysis of CD56 + uNK levels, IL-15/Fn-14 (Interleukin-15/Fibroblast growth factor-inducible molecule) ratios, and IL-18/TWEAK (Interleukin-18/Tumor necrosis factor-like weak inducer of apoptosis) ratios, the researchers have developed an endometrial-based molecular classification system to classify RIF patients into distinct immune endotypes including balanced immune activation (no immune dysregulation), low immune activation (hypofunction), and excessive immune activation (hyperfunction), enabling personalized immune modulatory interventions.7,9 While this approach has demonstrated clinical promise, it relies on invasive endometrial biopsy, limiting its feasibility for routine screening, repeated monitoring, or use in early-cycle risk stratification.10
Given the limitations and challenges associated with invasive methods like endometrial tissue biopsy, there is a clear clinical need for non- or minimally invasive biomarkers that can reflect endometrial immune status and facilitate repeated assessments.7,11 In this context, peripheral blood offers a minimally invasive, accessible surrogate for systemic and, to some extent, uterine immune status.12 Although peripheral NK (pNK) cells and circulating Th subsets do not fully represent their uterine counterparts, emerging evidence indicates that immune and metabolic markers in peripheral blood may reflect endometrial immune activity in RIF patients.13 Altered circulating Th1/Th2 ratios, elevated NK-cell cytotoxicity, and abnormal autoantibody profiles such as anti-phospholipid and anti-thyroid antibodies, as well as dysregulation of adipokines and phospholipid metabolism, have all been associated with RIF and RPL.14-16 These observations raise the possibility that a comprehensive peripheral blood immune-metabolic signature could serve as a surrogate for assessing local endometrial immune dysregulation.
The present study aimed to develop and validate a minimally invasive classification system for RIF patients based exclusively on peripheral blood immunological and metabolic markers. Accordingly, we sought to identify distinct immune–metabolic clusters in RIF patients and examine their association with previously validated endometrial immune profiles by analyzing the Th1/Th2 ratio, NK cell percentages, a panel of autoantibodies, metabolites, and total phospholipid levels. Ultimately, this blood-based diagnostic approach intends to provide a patient-friendly, repeatable, and clinically actionable tool for personalized management in assisted reproductive technology (ART) for patients with RIF.
Materials and Methods
Participants
Collection and use of all samples were conducted only after obtaining written informed consent from all participants. Samples were collected during the WOI from 191 women (aged 20–40 years), comprising 163 with RIF and 28 fertile controls (FC). Participants were consecutively recruited over a period spanning February 2024 to November 2025. Concurrently, 10 cc peripheral blood samples were taken from all participants. The FC group consisted of volunteer women who had at least one previous live birth and had not undergone fertility treatment.17 All participants, recruited from infertility centers in Tabriz (East Azerbaijan, Iran), exhibited normal menstrual cycles, lacked a history of endometrial pathology (verified by ultrasound), and had not used hormonal medications for three months before sampling. Women were included in the RIF cohort after undergoing three or more embryo transfers without achieving a positive pregnancy test.2 Participants with underlying conditions such as autoimmune, rheumatologic, or chronic systemic disorders, or those taking immunomodulatory medications (e.g., corticosteroids or disease-modifying antirheumatic drugs [DMARDs]), were excluded wherever this information was available.
Samples collection and analysis
Endometrial tissue and peripheral blood sampling were done by the referring clinicians during the mid-luteal phase, in a simulated substitution cycle after 5 to 9 days of progesterone administration or in a natural cycle under monitoring. In natural cycles, ovulation was monitored by transvaginal ultrasound to track follicle development and confirm ovulation. Endometrial biopsies were obtained in the mid-luteal phase, specifically 7 days after ovulation (equivalent to LH + 7), corresponding to the WOI. The endometrial fragment was carefully aspirated by rotating a Pipelle de Cornier inside the endometrial cavity.18 We divided the Pipelle-obtained endometrial tissue into two portions. For the histological test to determine the phase of the cycle, one portion was placed in 4% formaldehyde (Merck, Germany; Cat. No. 1.00496), and the other portion was put in RNAlater stabilization solution for immunological analysis (Yekta Tajhiz Azma, Tehran, Iran; Cat. No. YT9085). After confirming the mid-luteal phase through histological analysis and extracting RNA using RNX‐PLUS solution (Sina Clone, Tehran, Iran; Cat. No. EX6101), complementary DNA (cDNA) synthesis was performed utilizing the RevertAid First Strand cDNA Synthesis Kit (Yekta Tajhiz Azma, Tehran, Iran; Cat. No. YT4500), according to the manufacturer's protocol. Oligo Primer Analysis Software v. 7.60 (Molecular Biology Insights, Inc., CA, USA) was used to design specific primers (Table S1). Then, five targeted biomarkers (IL-18, IL-15, TWEAK, Fn-14, and CD56), along with the internal control GAPDH, were determined by quantitative real-time PCR with SYBR Green in a Roche Light Cycler® 96 Instrument (Roche, Germany).7
Diagnosis of endometrial immune profile
The local immune profile definition according to the balance of the IL-18/ TWEAK and IL-15/Fn-14 ratio, as well as CD56 mRNA expression is a patent untitled “METHOD FOR INCREASING IMPLANTATION SUCCESS IN ASSISTED FERTILIZATION” registered by Lédée et al, which is described as a procedure for determining uterine receptivity profiles to promote the success of implantation in assisted reproduction (PCT/EP2013/065355).7
Based on this method, three endometrial immune profiles are distinguished: a balanced profile, characterized by IL-18/TWEAK and IL-15/Fn-14 mRNA ratios as well as CD56 + mRNA expression in the same range as previously defined by Lédée et al. in the FC group; a low activation immune profile, defined by low mRNA ratios for IL-15/Fn-14 (reflecting immature uNK cells) and/or IL-18/TWEAK or an absence of uNK recruitment; and a immune profile with over activation, marked by high mRNA ratios of IL-18/ TWEAK and/or IL-15/Fn-14 and/or a high CD56 + mRNA expression.7
Immunologic and metabolic biomarkers
After defining the subgroups of RIF patients based on this patent, we analyzed our designed panel derived from peripheral blood. This panel includes the percentage of NK cells, the Th1/Th2 cell ratio, a range of autoantibodies (such as Anti-Nuclear antibody, Anti-cardiolipin, Anti-dsDNA, Anti-Phospholipid, Anti-TG, Anti-TPO, Anti-TTG, and Anti-β2-Glycoprotein), and various metabolites (including sphingosine-1-phosphate [S1P], adiponectin, leptin, phosphatidylserine, prostaglandin E2 [PGE2], total phospholipid, and IGF-1) relevant to these subgroups.
Flow cytometric analysis of Th1/Th2 ratio and NK cells
Peripheral blood mononuclear cells (PBMCs) were isolated by density-gradient centrifugation using Ficoll-Paque (Yekta Tajhiz Azma, Tehran, Iran; Cat. No. YT3000) within 4 h of collection. One hundred microliters of whole blood or 1 × 10⁶ PBMCs were stained with the following fluorochrome-conjugated monoclonal antibodies: CD3-PerCP (clone UCHT1), CD4-PerCP (clone RPA-T4), IFN-γ- FITC (clone 4S.B3) for Th1, IL-4-PE (clone MP4-25D2) for Th2, CD56-PE (clone HCD56), and CD16-FITC (clone B73.1).
All antibodies were obtained from Biolegend (San Diego, CA, USA; Cat. No. 300428, 300528, 502506, 500808, 318306, 360716). For intracellular cytokine staining, cells were stimulated for 4-6 h with 50 ng/mL phorbol 12-myristate 13-acetate (PMA) and 1 μg/mL ionomycin in the presence of brefeldin A (Biolegend, San Diego, CA, USA; Cat. No. 423303). First, surface staining was performed, followed by fixation and permeabilization using the Fixation/Permeabilization Solution Kit (Biolegend, San Diego, CA, USA; Cat. No. 426803), in accordance with the manufacturer’s protocol. On a BD FACSCalibur (BD Biosciences), at least 50,000 lymphocyte events were recorded. Single-colour controls and BD CompBeads were used for Compensation. Data were analyzed with FlowJo software version 10.10 (Ashland, OR, USA). Th1 cells were defined as CD4⁺IFN-γ⁺IL-4⁻, Th2 as CD4⁺IFN-γ⁻IL-4⁺. The Th1/Th2 ratio was calculated as the percentage of Th1 cells divided by the percentage of Th2 cells. NK cells were identified as CD3- CD16+ CD56+ and expressed as a percentage.
Measurement of autoantibodies by enzyme-linked immunosorbent assay (ELISA)
Serum autoantibody levels were quantified using commercial ELISA kits following the manufacturer's instructions. The kits for anticardiolipin, anti-β2-glycoprotein, antiphospholipid, and anti-TTG were provided by MyBioSource (San Diego, California, USA; Cat. No. MBS3804816, MBS3803458, MBS8820989). Additionally, the kits for ANA, anti-dsDNA, anti-TG, and anti-TPO were supplied by Pishtazteb (Tehran, Iran; Cat. No. PT-ANA-SCIgG-96, PT-Anti-dsDNA-96, PT-Anti-TG-96, PT-Anti-TPO-96). Samples were assayed in duplicate. Optical density was measured at 450 nm using a microplate ELISA reader (Stat Fax 4200). Concentrations were calculated from the standard curve using four-parameter logistic regression. The cut-off values were based on the recommendations provided by each manufacturer.
Quantification of metabolites and total phospholipids by ELISA and spectrophotometer
Serum concentrations of the metabolites were determined using commercial ELISA kits according to the manufacturers’ protocols. The kits for S1P, Adiponectin, Leptin, IGF-1, PGE2, and Phosphatidylserine were provided by MyBioSource) San Diego, California, USA; Cat. No. MBS766091, MBS283065, MBS9425103, MBS726411, MBS721434, MBS731866) Additionally, serum total lipid was extracted by the method of Bligh/Dyer with a 2:1 chloroform: methanol solution and several washes.19 Then, using 70% perchloric acid, 2.5% ammonium molybdate solution, and 0.5 ml of 10% ascorbic acid, the necessary standards (10 mg/dL, 20 mg/dL, 30 mg/dL, 40 mg/dL) were prepared. After following the specified steps, 2.5% ammonium molybdate solution and 10% ascorbic acid were added to the standards and samples. Finally, the optical density of the standards and samples was measured using a Pharmacia LKB Novaspec II spectrophotometer at 800 nm wavelength.
Statistical analysis
GraphPad Prism version 10.6.0 (GraphPad Software, La Jolla, California, United States) was utilized in order to carry out the analyses. Normality of continuous variables was assessed using the Shapiro–Wilk test. Data were expressed as mean ± standard deviation (SD) for normally distributed variables, and differences between groups were analyzed using one-way analysis of variance (ANOVA) and a t-test, depending on the circumstances. The statistical significance of a P value less than 0.05 was considered to be met. Power analysis for the primary outcome (Th1/Th2 ratio) was conducted post hoc. Given the observed group means (Balanced: 8.60 ± 3.54, Low: 6.92 ± 2.33, Over-activation: 21.03 ± 5.40) and sample sizes (Balanced: 32, Low: 47, Over: 84), the effect size for one-way ANOVA was very large, indicating a statistical power > 99% at α = 0.05. Therefore, the sample sizes were adequate to detect differences between groups.
Results
Baseline characteristics
Baseline demographic and clinical characteristics of the study participants are presented in Table S2. No statistically significant differences were observed between RIF patients and FC regarding age (P = 0.080), BMI (P = 0.072), serum FSH (P = 0.163), LH (P = 0.081), endometrial thickness (P = 0.061), AMH levels (P = 0.564), or number of smoking patients (P = 0.554). However, a significantly higher proportion of smoking partners was observed in the RIF group compared to controls (46% vs. 35.7%, P = 0.048).
Determination of the interpretation norm
Based on the previous study protocol (Lédée et al patent)20 and our data, cutoff values were derived from the FC group using the mean ± SD for each biomarker (Table 1). All biomarkers were normally distributed.
Table 1.
Endometrial biomarker comparison in control and RIF subgroups based on their immune profiles
|
|
Control group
|
RIF patients’ subgroups
|
|
|
Endometrial immune profile
|
Normal
|
Over activation
|
P
value
|
Low activation
|
P
value
|
Balanced
|
P
value
|
|
|
Number of participants |
28 |
84 (51.5%) |
|
47 (28.8%) |
|
32 (19.6%) |
|
| Biomarkers |
IL18/TWEAK |
Range of interpretation |
0.02-0.135 |
> 0.135 |
|
< 0.02 |
|
0.02-0.135 |
|
| Mean |
0.071 |
0.494 |
< 0.0001* |
0.045 |
0.0257* |
0.065 |
0.926 |
| IL15/Fn14 |
Range of interpretation |
0.36-3.4 |
> 3.4 |
|
< 0.36 |
|
0.36-3.4 |
|
| Mean |
1.399 |
3.058 |
0.0021* |
0.480 |
0.0002* |
1.431 |
0.998 |
| CD56+ cells |
Range of interpretation |
0.5-1.5 |
> 1.5 |
|
< 0.5 |
|
0.5-1.5 |
|
| Mean |
1.008 |
0.929 |
0.762 |
0.210 |
< 0.0001* |
0.984 |
0.987 |
A group of 28 fertile women served as the norms for each biomarker. Data for each RIF group were compared to data for the FC and analyzed with ANOVA. A *P value < 0.05 was considered statistically significant. Abbreviations: RIF, Recurrent implantation failure; TWEAK, Tumor necrosis factor-like weak inducer of apoptosis; Fn14, Fibroblast growth factor-inducible molecule 14; IL, Interleukin; CD, Cluster of differentiation. Percentages indicate the proportion of patients in each RIF subgroup relative to the total RIF cohort (n = 163).
The mean ± SD for the IL-18/TWEAK mRNA ratio was 0.071 ± 0.036; values < 0.02 (mean − 1 SD) were classified as low-activation and values > 0.135 (mean + 1 SD) as over-activation. For the IL-15/Fn-14 mRNA ratio, the mean ± SD was 1.39 ± 0.87; values < 0.36 (mean − 1 SD) were classified as low-activation and values > 3.4 (mean + 2 SD) as over-activation. For CD56⁺ mRNA expression, the mean ± SD was 1.008 ± 0.303 cells per field; values < 0.5 (mean − 2 SD) were classified as low-activation and values > 1.5 (mean + 2 SD) as over-activation. These reference thresholds were subsequently applied to classify RIF patients into balanced, low-activation, and over-activation immune subgroups.
Fig. 1 illustrates the dispersion of the raw data for the mRNA ratios of IL-18/TWEAK and IL-15/Fn-14, as well as the CD56 mRNA expression in both the FC and the RIF group.
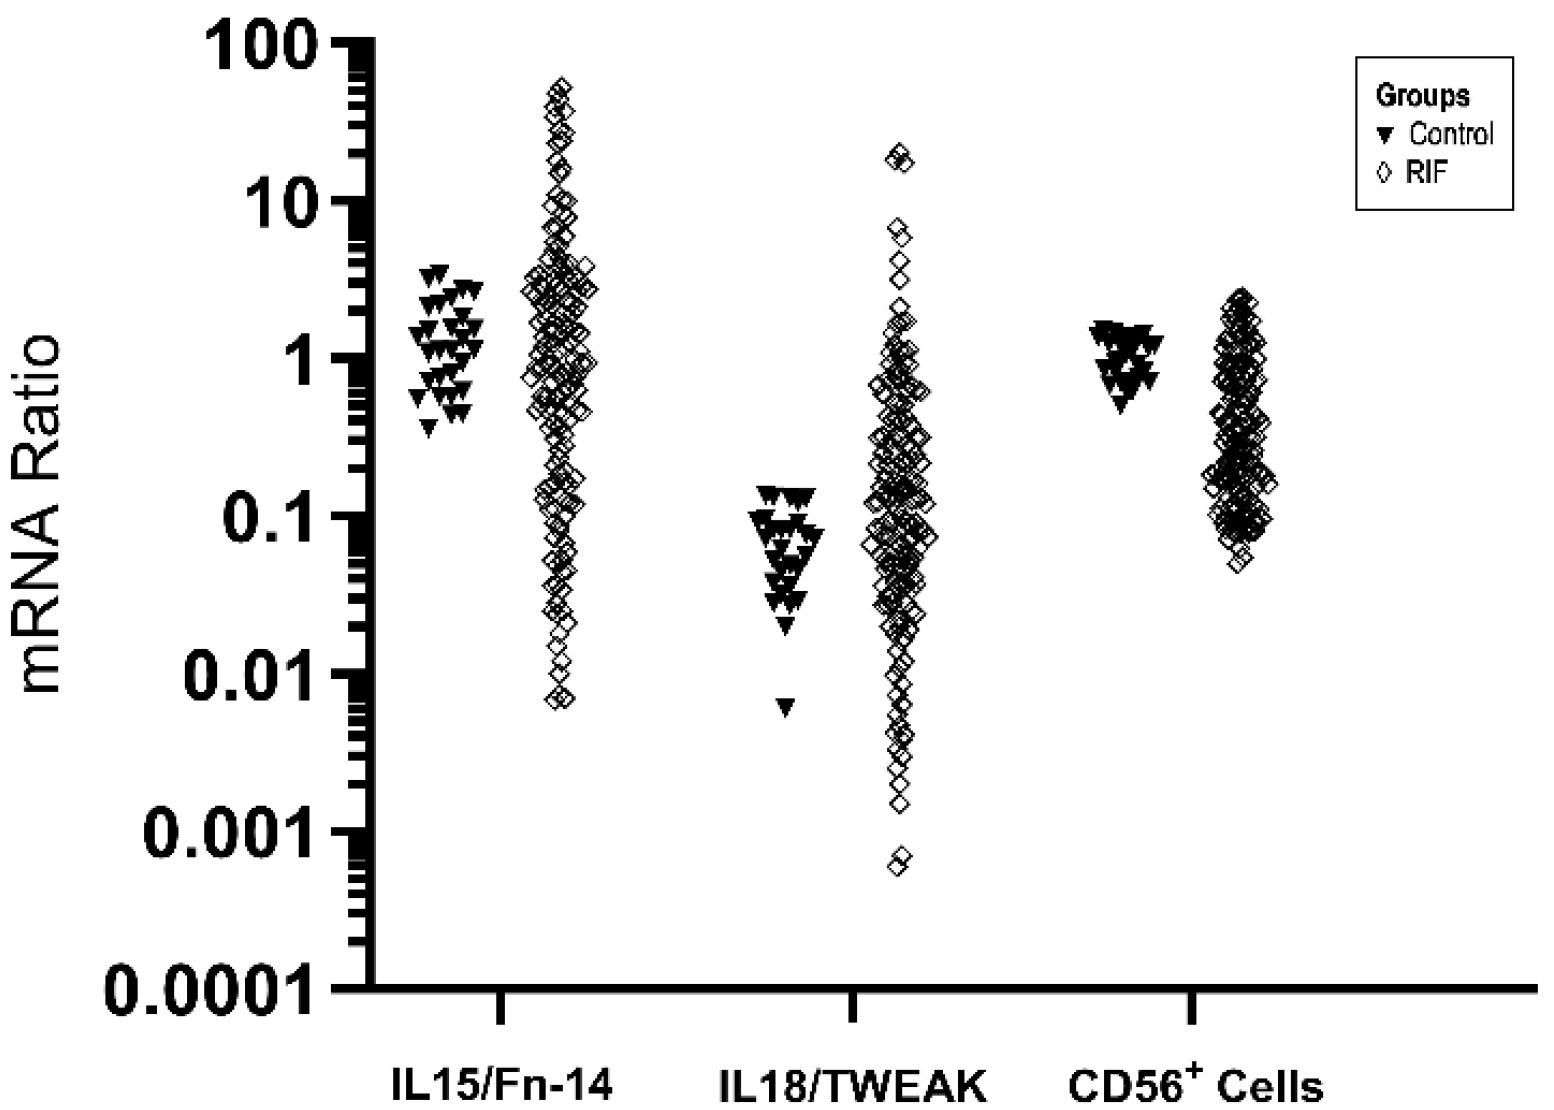
Fig. 1.
Distribution of the IL-15/Fn-14 and IL-18/TWEAK ratio, along with CD56 mRNA expression, in the control and the RIF group. The data dispersion is log-transformed. Abbreviations: RIF, Recurrent implantation failure; TWEAK, Tumor necrosis factor-like weak inducer of apoptosis; Fn14, Fibroblast growth factor-inducible molecule 14; IL, Interleukin; CD, Cluster of differentiation.
.
Distribution of the IL-15/Fn-14 and IL-18/TWEAK ratio, along with CD56 mRNA expression, in the control and the RIF group. The data dispersion is log-transformed. Abbreviations: RIF, Recurrent implantation failure; TWEAK, Tumor necrosis factor-like weak inducer of apoptosis; Fn14, Fibroblast growth factor-inducible molecule 14; IL, Interleukin; CD, Cluster of differentiation.
The Th1/Th2 ratio and the NK cell percentage were altered in three subgroups of RIF
In the current study, flow cytometry was used to investigate Th1 and Th2 cells by detecting the percentages of CD4⁺IFN-γ⁺IL-4⁻ and CD4⁺IFN-γ⁻IL-4⁺ cells, as well as NK cells detecting the percentages of CD3- CD16 + CD56 + in RIF patients’ groups. As shown in Fig. 2, patients in three RIF groups had an altered of Th1/Th2 cells ratio compared with each other (balanced: 8.597 ± 3.537, low: 6.920 ± 2.325, over: 21.03 ± 5.395). These changes were not significant for balanced vs. low (P = 0.2180), On the other hand, it was significant for balanced vs. over and low vs. over (P < 0.0001). We also observed similar changes in NK cells (balanced: 6.553 ± 3.563, low: 7.445 ± 2.652, over: 17.56 ± 3.969; Fig. 3). Alterations for this cell also just in balanced vs. over and low vs. over (P < 0.0001) was significant. Table 2 indicate the comparison of flow cytometric parameters in three RIF subgroups.
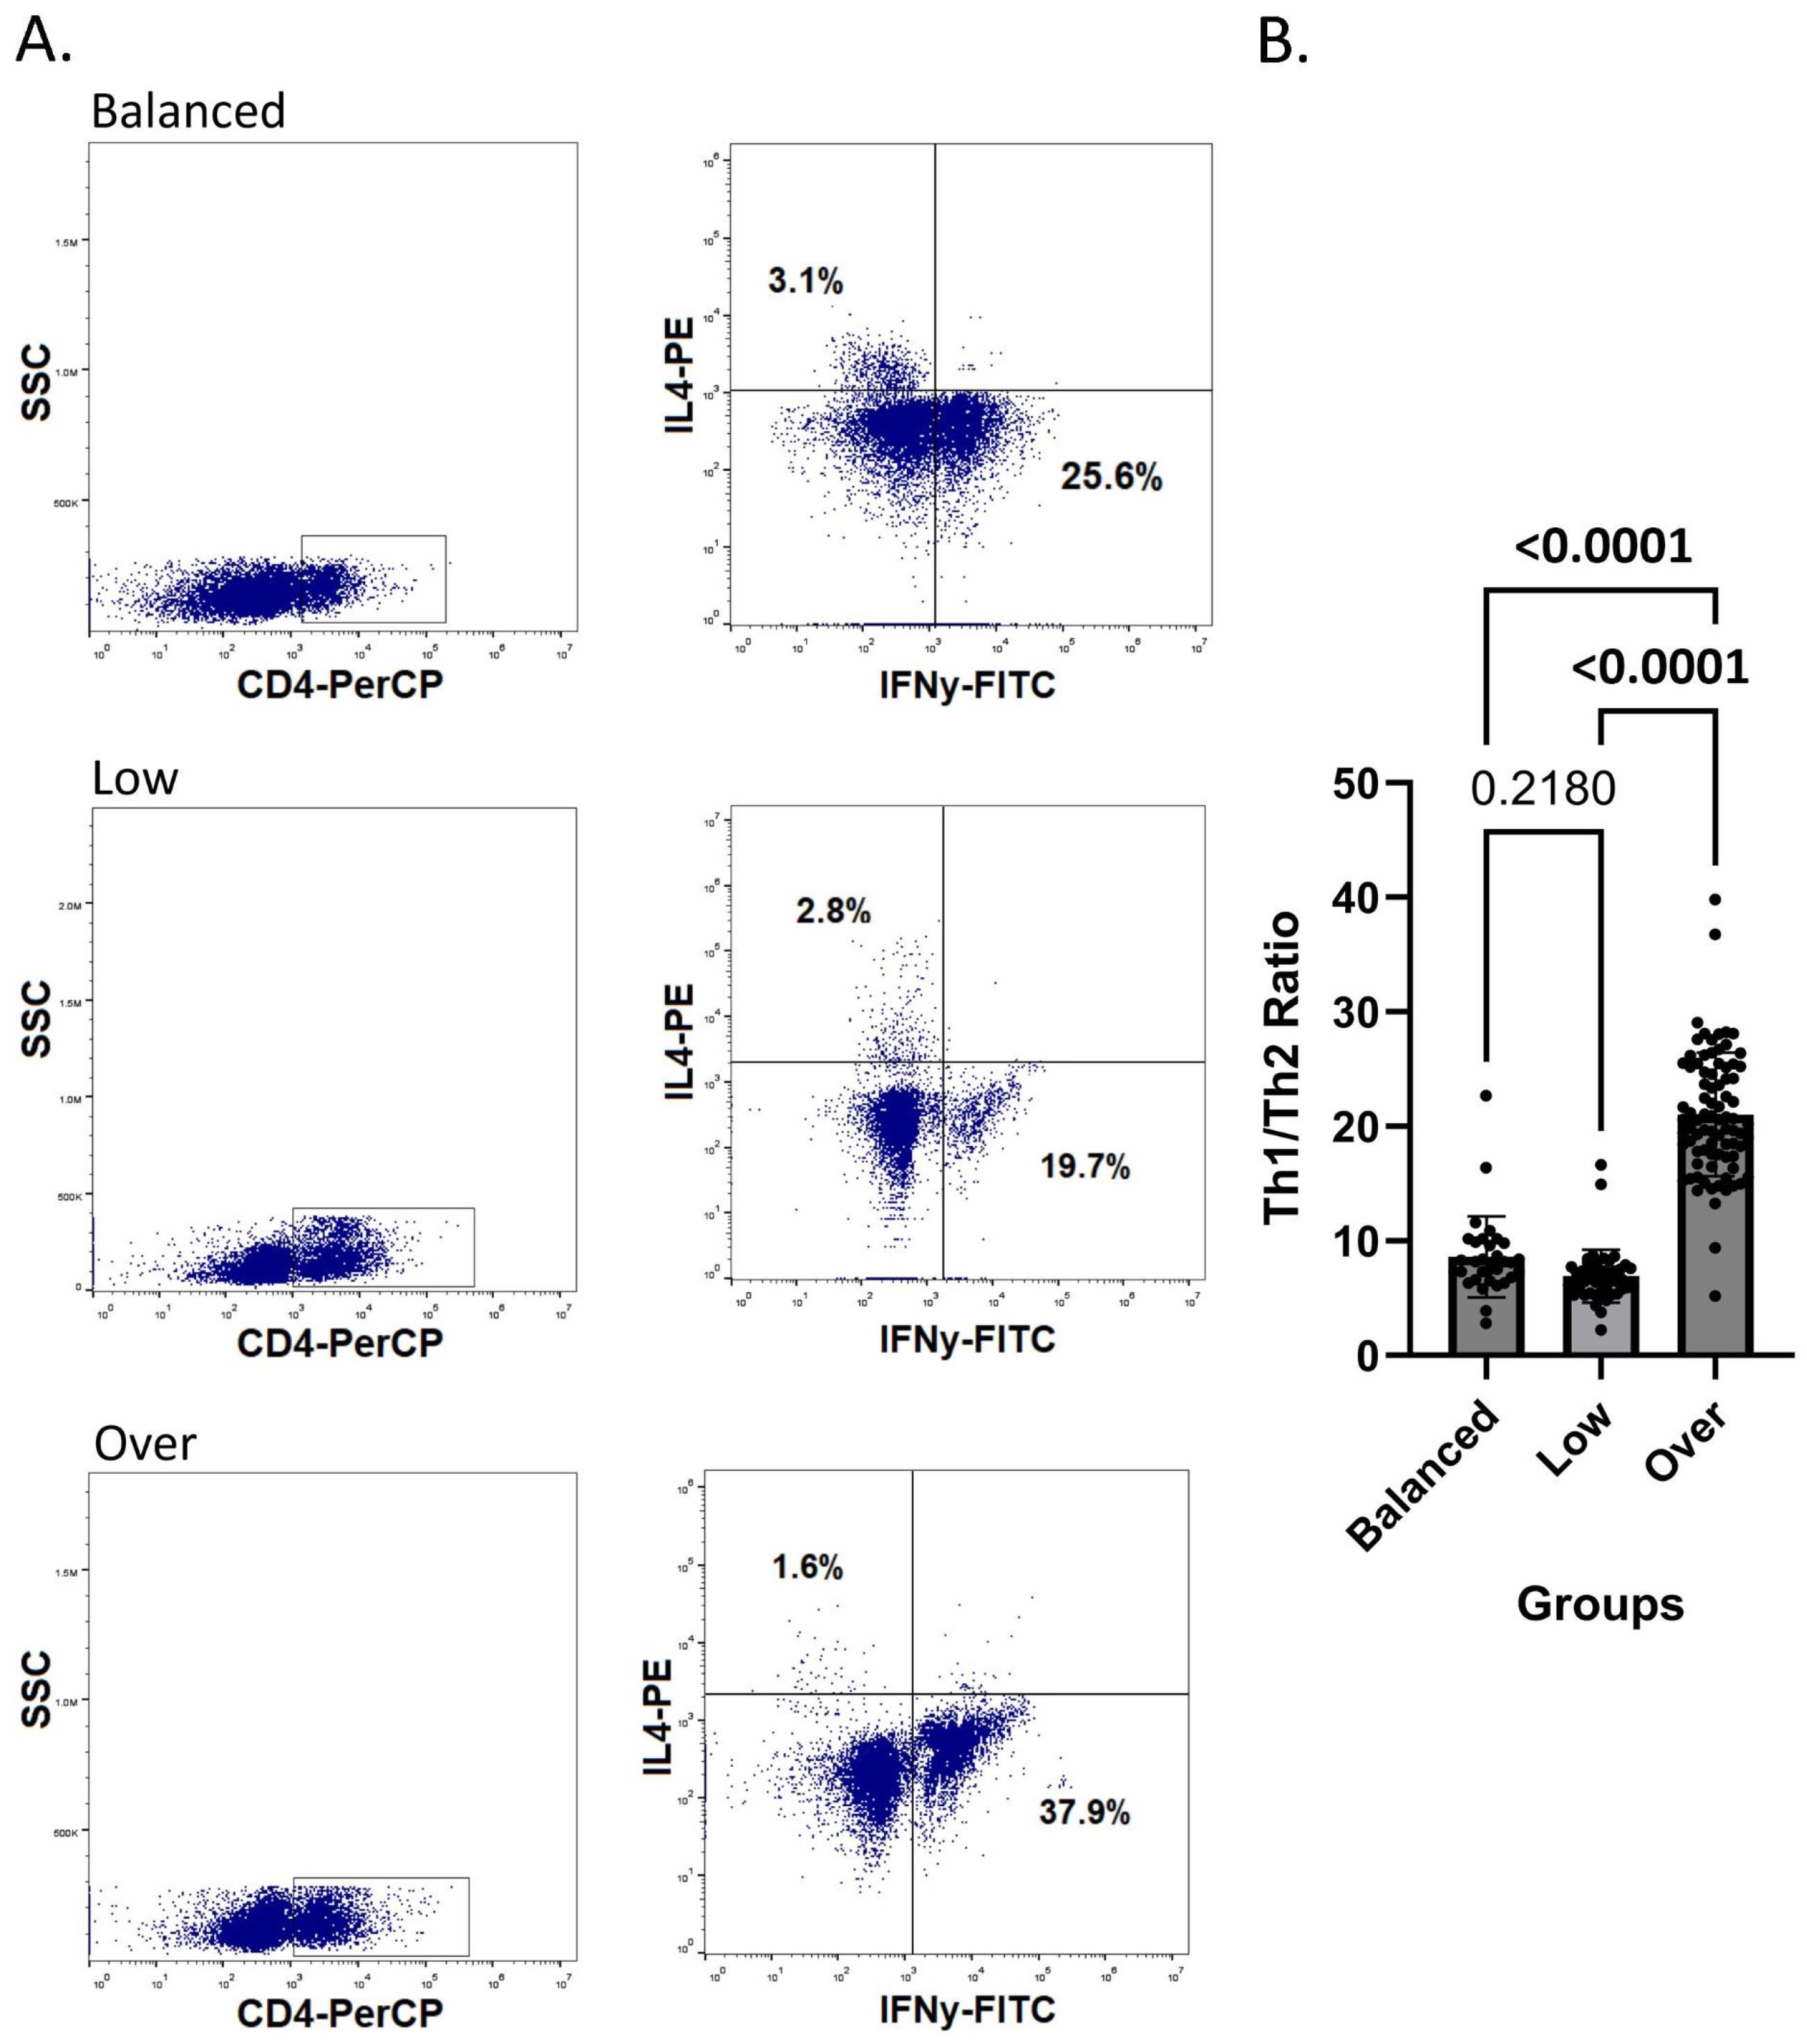
Fig. 2.
Cell frequency by flow cytometry technique in RIF subgroups. A. Dot blot of lymphocytes gated to identify Th1/Th2 ratio (IFN-γ + /IL-4 + ) in three RIF patients’ subgroups (balanced, low, and over). B. Comparing the Th1/Th2 ratio in the three groups considered. P < 0.05 considered as significant. (N = 32 for balanced, N = 47 for low and N = 84 for over-immune activation group). Abbreviations: Th, T-helper lymphocytes; CD, Cluster of differentiation; SSC, Side scatter; IL, Interleukin; FITC, Fluorescein isothiocyanate; PE, Phycoerythrin; IFN𝝲, Interferon gamma; PerCP, Peridinin-chlorophyll-protein.
.
Cell frequency by flow cytometry technique in RIF subgroups. A. Dot blot of lymphocytes gated to identify Th1/Th2 ratio (IFN-γ + /IL-4 + ) in three RIF patients’ subgroups (balanced, low, and over). B. Comparing the Th1/Th2 ratio in the three groups considered. P < 0.05 considered as significant. (N = 32 for balanced, N = 47 for low and N = 84 for over-immune activation group). Abbreviations: Th, T-helper lymphocytes; CD, Cluster of differentiation; SSC, Side scatter; IL, Interleukin; FITC, Fluorescein isothiocyanate; PE, Phycoerythrin; IFN𝝲, Interferon gamma; PerCP, Peridinin-chlorophyll-protein.
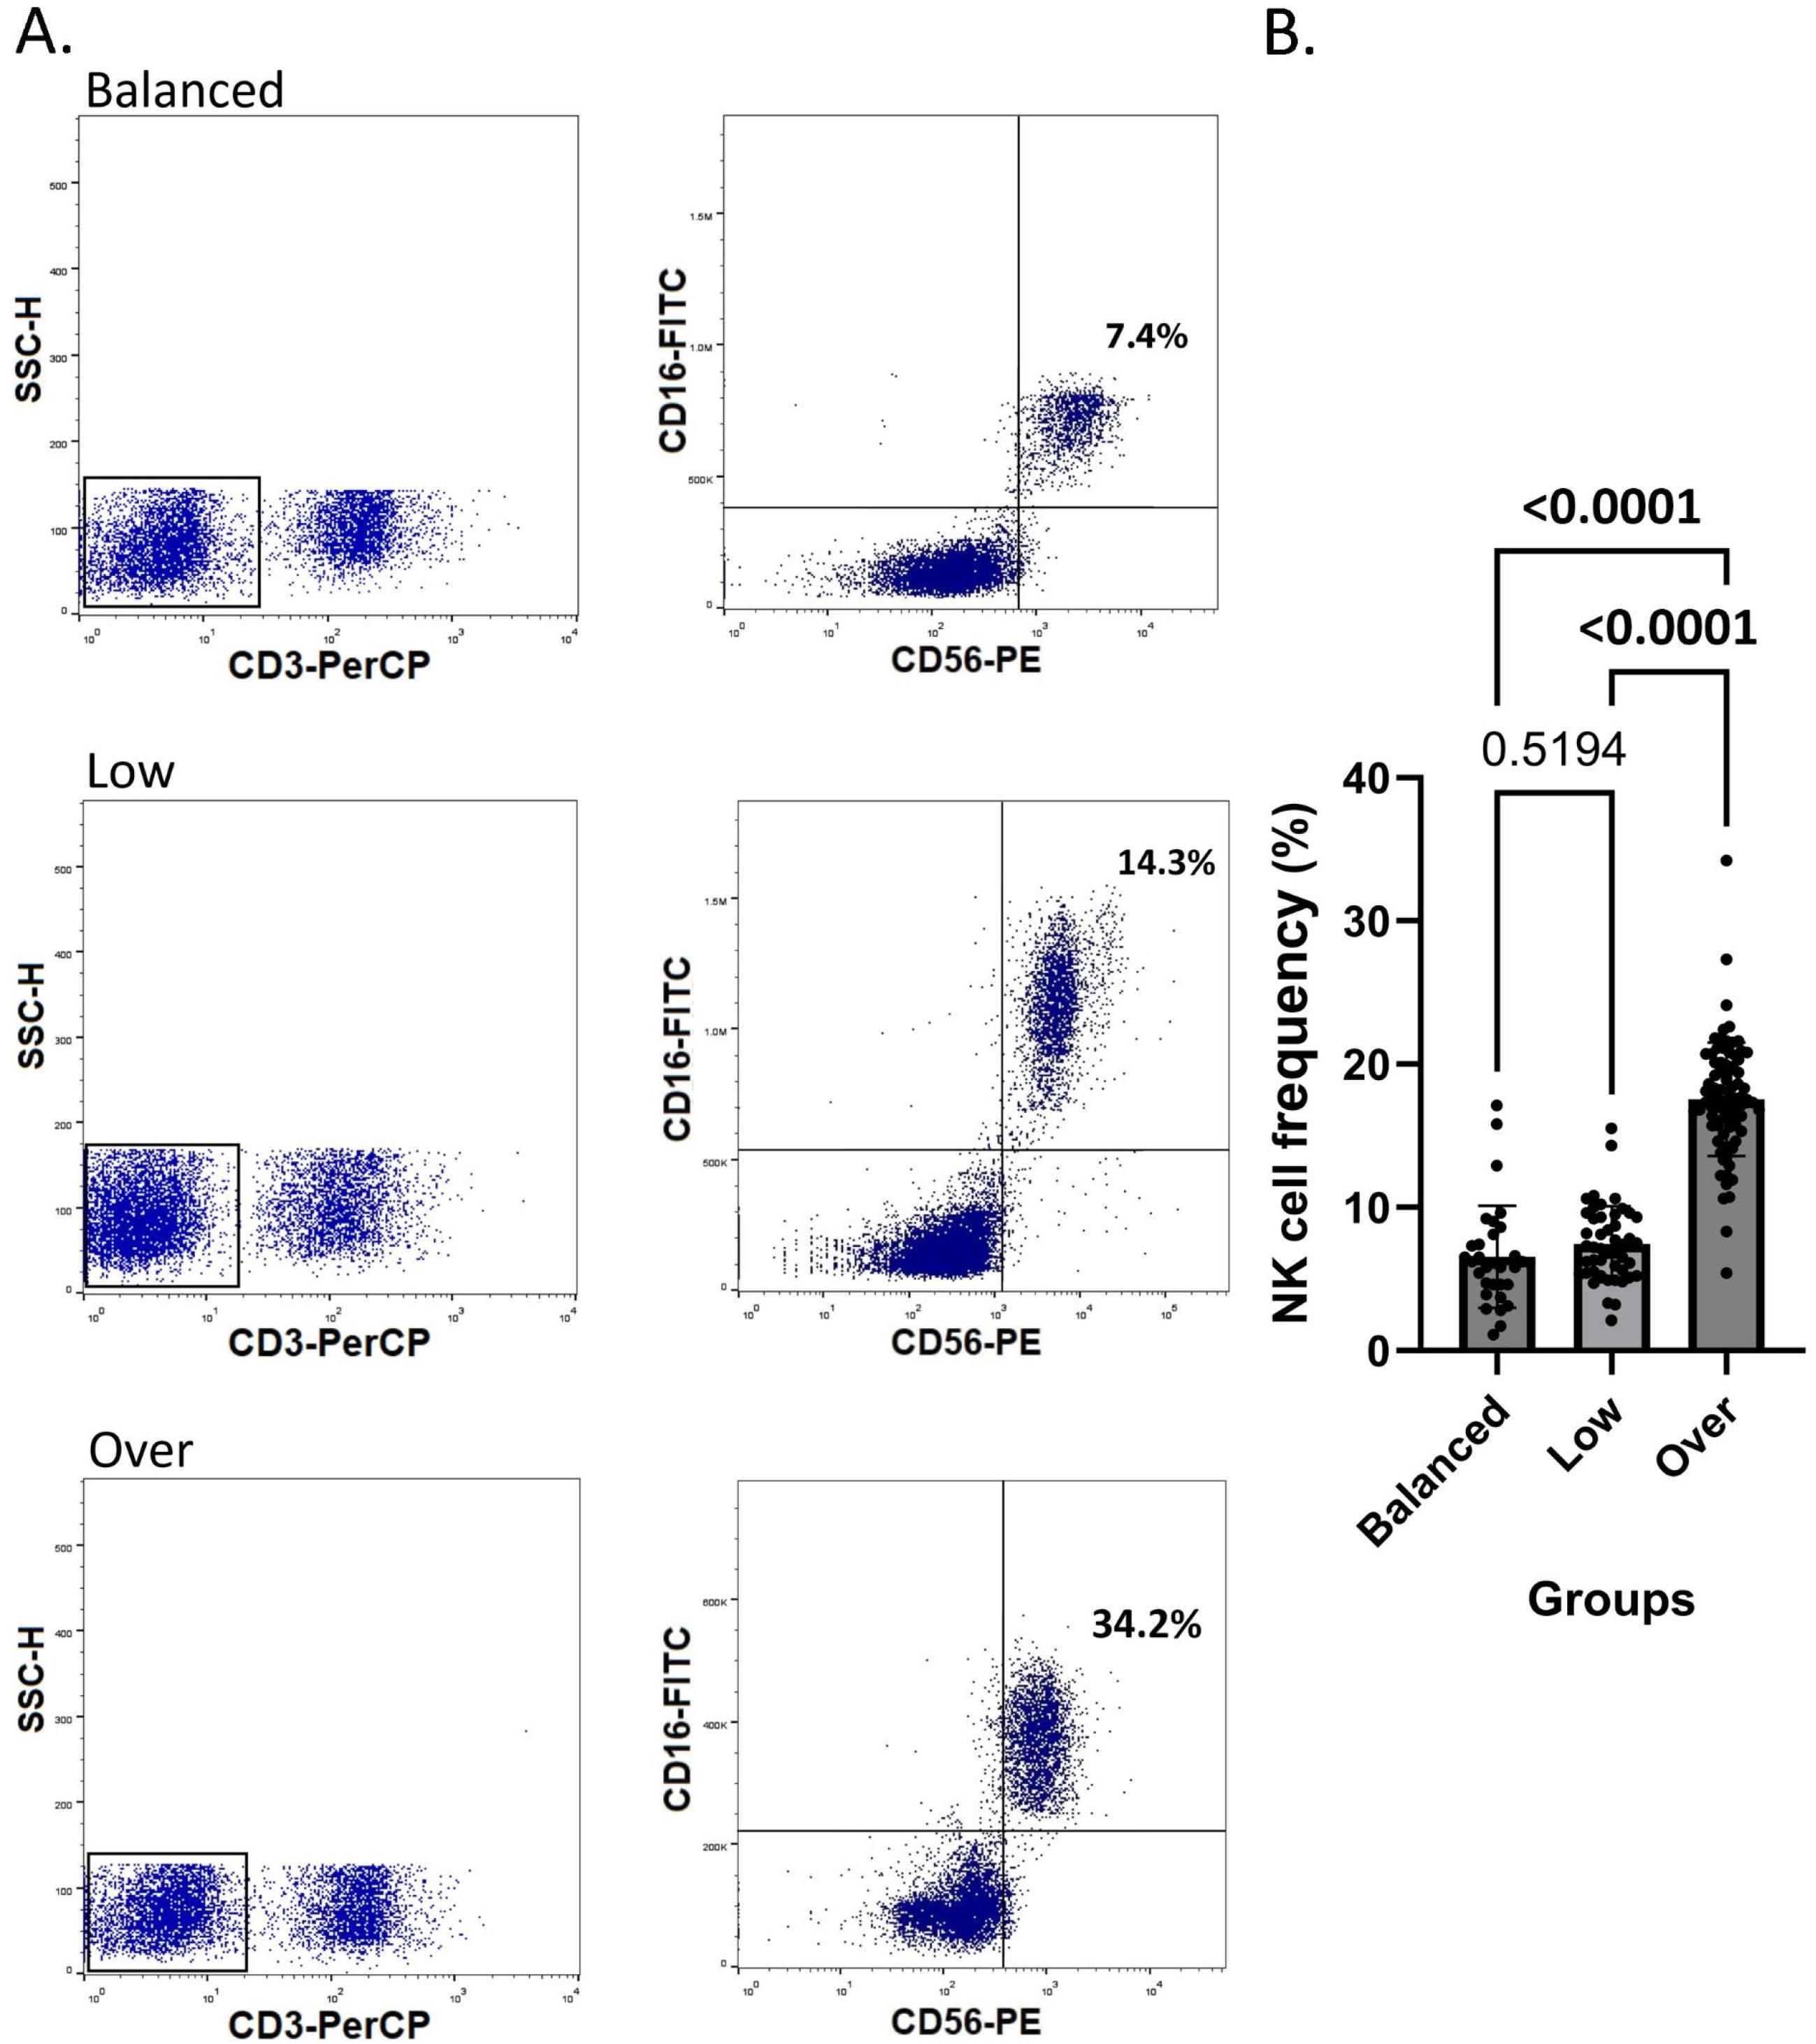
Fig. 3.
NK cell frequency by flow cytometry technique in RIF subgroups. A. Dot blot of lymphocytes gated to identify NK cells (CD3- CD16+ CD56+) in three RIF patients’ subgroups (balanced, low, and over). B. Comparing the NK cells frequency in the three groups considered. P < 0.05 considered as significant. (N = 32 for balanced, N = 47 for low and N = 84 for over-immune activation group). Abbreviations: NK cell, Natural killer cell; CD, Cluster of differentiation; SSC-H, Side scatter histogram; FITC, Fluorescein isothiocyanate; PE, Phycoerythrin; PerCP, Peridinin-chlorophyll-protein.
.
NK cell frequency by flow cytometry technique in RIF subgroups. A. Dot blot of lymphocytes gated to identify NK cells (CD3- CD16+ CD56+) in three RIF patients’ subgroups (balanced, low, and over). B. Comparing the NK cells frequency in the three groups considered. P < 0.05 considered as significant. (N = 32 for balanced, N = 47 for low and N = 84 for over-immune activation group). Abbreviations: NK cell, Natural killer cell; CD, Cluster of differentiation; SSC-H, Side scatter histogram; FITC, Fluorescein isothiocyanate; PE, Phycoerythrin; PerCP, Peridinin-chlorophyll-protein.
Table 2.
The comparison of flow cytometric parameters in three RIF subgroups
|
Variables
|
Balanced group
(Mean ± SD)
|
Low activation group
(Mean ± SD)
|
Over activation group
(Mean ± SD)
|
Balanced vs. Low
(
P
value)
|
Balanced vs. Over
(
P
value)
|
Low vs. Over
(
P
value)
|
NK cells
(CD3- CD16+ D56+) |
6.553 ± 3.563 |
7.445 ± 2.652 |
17.56 ± 3.969 |
0.5194 |
< 0.0001 |
< 0.0001 |
Th1/Th2
(CD4+ IFN-γ+/CD4+ IL4+) |
8.597 ± 3.537 |
6.920 ± 2.325 |
21.03 ± 5.395 |
0.2180 |
< 0.0001 |
< 0.0001 |
Abbreviations: RIF, Recurrent implantation failure; NK cells, natural killer cells; IL, Interleukin; IFN-γ, Interferon gamma; Th 1, T helper 1 lymphocytes; Th 2, T helper 2 lymphocytes; CD, Cluster of differentiation. Data are presented as mean ± SD. A P value < 0.05 was considered statistically significant.
Autoantibodies measurement in RIF patients
Serum autoantibody levels were determined by ELISA in RIF patients classified into balanced, low, and over-immune activation groups. No significant differences were observed between the balanced and low-immune activation groups for any of the measured autoantibodies. In contrast, patients in the over group displayed significantly higher levels of several autoantibodies when compared to both the balanced and low-immune activation groups.
Specifically, ANA levels were significantly elevated in the over-immune activation group compared with the balanced (P = 0.0025) and low-immune activation (P = 0.0152) groups. Similarly, anti-phospholipid antibody concentrations were markedly increased in the over-immune activation group versus the balanced (P = 0.0002) and low-immune activation (P = 0.0048) groups. Anti-β2-glycoprotein I antibodies were also significantly higher in the over-immune activation group than in the balanced (P = 0.0036) and low-immune activation (P = 0.0032) groups. Thyroid-related autoantibodies followed the same pattern: both anti-TG and anti-TPO levels were significantly greater in the over-immune activation group compared with the balanced (P = 0.0126 and P = 0.0092, respectively) and low-immune activation (P = 0.0305 and P = 0.0251, respectively) groups.
In contrast, serum levels of anti-cardiolipin, anti-dsDNA, and anti-TTG antibodies showed no significant differences across any of the pairwise comparisons (all p-values were greater than 0.05 and were not considered statistically significant). Table 3 illustrates the comparison of autoantibody measurement results in the RIF subgroups.
Table 3.
The comparison of autoantibody measurement results in the three RIF subgroups
|
Variables
|
Balanced group
Pos/Total
(%)
|
Low activation group
Pos/Total
(%)
|
Over activation group
Pos/Total
(%)
|
Balanced vs. Low
(
P
value)
|
Balanced vs. Over
(
P
value)
|
Low vs. Over
(
P
value)
|
| ANA |
0/32 (0%) |
3/47 (6.4%) |
24/84 (28.6%) |
0.9989 |
0.0025 |
0.0152 |
| Anti-cardiolipin |
0/32 (0%) |
3/47 (6.4%) |
4/84 (4.76%) |
0.7243 |
0.7307 |
0.9996 |
| Anti-dsDNA |
0/32 (0%) |
6/47 (12.8%) |
4/84 (4.76%) |
0.6851 |
0.5598 |
0.9998 |
| Anti-Phospholipid |
0/32 (0%) |
3/47 (6.4%) |
28/84 (33.3%) |
0.9845 |
0.0002 |
0.0048 |
| Anti-TG |
0/32 (0%) |
0/47 (0%) |
20/84 (23.8%) |
0.9999 |
0.0126 |
0.0305 |
| Anti-TPO |
0/32 (0%) |
0/47 (0%) |
32/84 (38.09%) |
> 0.9999 |
0.0092 |
0.0251 |
| Anti-TTG |
1/32 (3.1%) |
3/47 (6.4%) |
8/84 (9.52%) |
0.9981 |
0.3110 |
0.3359 |
| Anti-β2GPI |
0/32 (0%) |
0/47 (0%) |
20/84 (23.8%) |
0.9586 |
0.0036 |
0.0032 |
Abbreviations: RIF, Recurrent implantation failure; ANA, Anti-nuclear antibody; Anti-dsDNA, anti-double stranded DNA antibody; Anti-TG, anti-thyroglobulin antibody; Anti-TPO, anti-thyroid peroxidase antibody; Anti-TTG, anti-tissue transglutaminase antibody; Th 2, T helper 2 lymphocytes; Anti-B2GPI, Anti- β2-glycoprotein I. Pos/Total: Positive cases/Total cases (represents the proportion of individuals who tested positive for a specific autoantibody relative to the total number of individuals tested for that antibody within each group). Immune profile classification: Balanced = gene expression within ± 1 SD of fertile controls; Low = below this range; Over = above this range (based on IL-15, IL-18, TWEAK, and Fn-14 RT-qPCR analysis). Data are presented as a ratio of the number of positive people in each group (%). A P value < 0.05 was considered statistically significant.
Serum metabolite levels
Serum concentrations of a panel of metabolites and lipids were assessed in peripheral blood samples from patients with RIF, categorized into three immunological subgroups. Adiponectin, leptin, S1P, PGE2, phosphatidylserine, and IGF-1 were quantified using ELISA, while total phospholipid levels were confirmed by spectrophotometric analysis. Serum concentrations were reported in ng/mL for S1P, adiponectin, leptin, phosphatidylserine, and IGF-1; in pg/mL for PGE2; and in mg/dL for total phospholipids.
Statistical analysis revealed significant alterations in the serum concentrations of several metabolites across the experimental groups. S1P levels showed a highly significant variation across the three groups (balanced: 75.62 ± 6.689; low: 137.5 ± 10.15; over: 17.44 ± 3.093; P < 0.0001), with each group differing significantly from the others. A similar pattern was observed for adiponectin (balanced: 14.16 ± 4.88; low: 45.28 ± 3.11; over: 1.461 ± 0.76; P < 0.0001) and leptin (balanced: 11.90 ± 1.83; low: 0.96 ± 0.65; over: 37.13 ± 2.77; P < 0.0001), where all pairwise comparisons demonstrated statistically significant differences. PGE2 levels also differed significantly between all groups (balanced: 287.1 ± 23.48; low: 475.7 ± 23.31; over: 87.12 ± 10.21; P < 0.0001). Additionally, total phospholipid concentration exhibited a strong group-dependent variation (balanced: 215.4 ± 22.29; low: 76.76 ± 12.55; over: 454.4 ± 22.23; P < 0.0001), with significant differences observed among all comparisons. In contrast, phosphatidylserine (balanced: 66.20 ± 9.42; low: 60.29 ± 11.35; over: 69.77 ± 15.26) did not show significant differences between balanced vs. low (P = 0.5317), balanced vs. over (P = 0.8018), or low vs. over (P = 0.1619). Similarly, IGF-1 (balanced: 254.7 ± 29.12; low: 227.6 ± 59.21; over: 265.8 ± 91.80) demonstrated no statistically significant changes among the groups (P = 0.4034, 0.8268, and 0.1898, respectively) (Table 4). Data are presented as mean ± SD. Fig. 4 shows the serum level of metabolites difference between the three RIF subgroups.
Table 4.
The comparison of serum levels of metabolites in RIF subgroups
|
Variables
|
Balanced group
(Mean ± SD)
|
Low activation group
(Mean ± SD)
|
Over activation group
(Mean ± SD)
|
Balanced vs. Low
(
P
value)
|
Balanced vs. Over
(
P
value)
|
Low vs. Over
(
P
value)
|
| S1P |
75.62 ± 6.689 |
137.5 ± 10.15 |
17.44 ± 3.093 |
< 0.0001 |
< 0.0001 |
< 0.0001 |
| Adiponectin |
14.16 ± 4.88 |
45.28 ± 3.11 |
1.461 ± 0.76 |
< 0.0001 |
< 0.0001 |
< 0.0001 |
| Leptin |
11.90 ± 1.831 |
0.9605 ± 0.6492 |
37.13 ± 2.773 |
< 0.0001 |
< 0.0001 |
< 0.0001 |
| Phosphatidylserine |
66.20 ± 9.424 |
60.29 ± 11.35 |
69.77 ± 15.26 |
0.5317 |
0.8018 |
0.1619 |
| PGE2 |
287.1 ± 23.48 |
475.7 ± 23.31 |
87.12 ± 10.21 |
< 0.0001 |
< 0.0001 |
< 0.0001 |
| Total phospholipid |
215.4 ± 22.29 |
76.76 ± 12.55 |
454.4 ± 22.23 |
< 0.0001 |
< 0.0001 |
< 0.0001 |
| IGF1 |
254.7 ± 29.12 |
227.6 ± 59.21 |
265.8 ± 91.80 |
0.4034 |
0.8268 |
0.1898 |
Abbreviations: RIF, Recurrent implantation failure; IGF-1, insulin-like growth factor 1; PGE2, prostaglandin E2; S1P, sphingosine 1 phosphate. Immune profile classification: Balanced = gene expression within ± 1 SD of fertile controls; Low = below this range; Over = above this range (based on IL-15, IL-18, TWEAK, and Fn-14 RT-qPCR analysis). All values are expressed in the following units: S1P (ng/mL), Adiponectin (ng/mL), Leptin (ng/mL), Phosphatidylserine (ng/mL), PGE2 (pg/mL), Total phospholipid (mg/dL), and IGF-1 (ng/mL). Data are presented as mean ± SD. A P value < 0.05 was considered statistically significant.
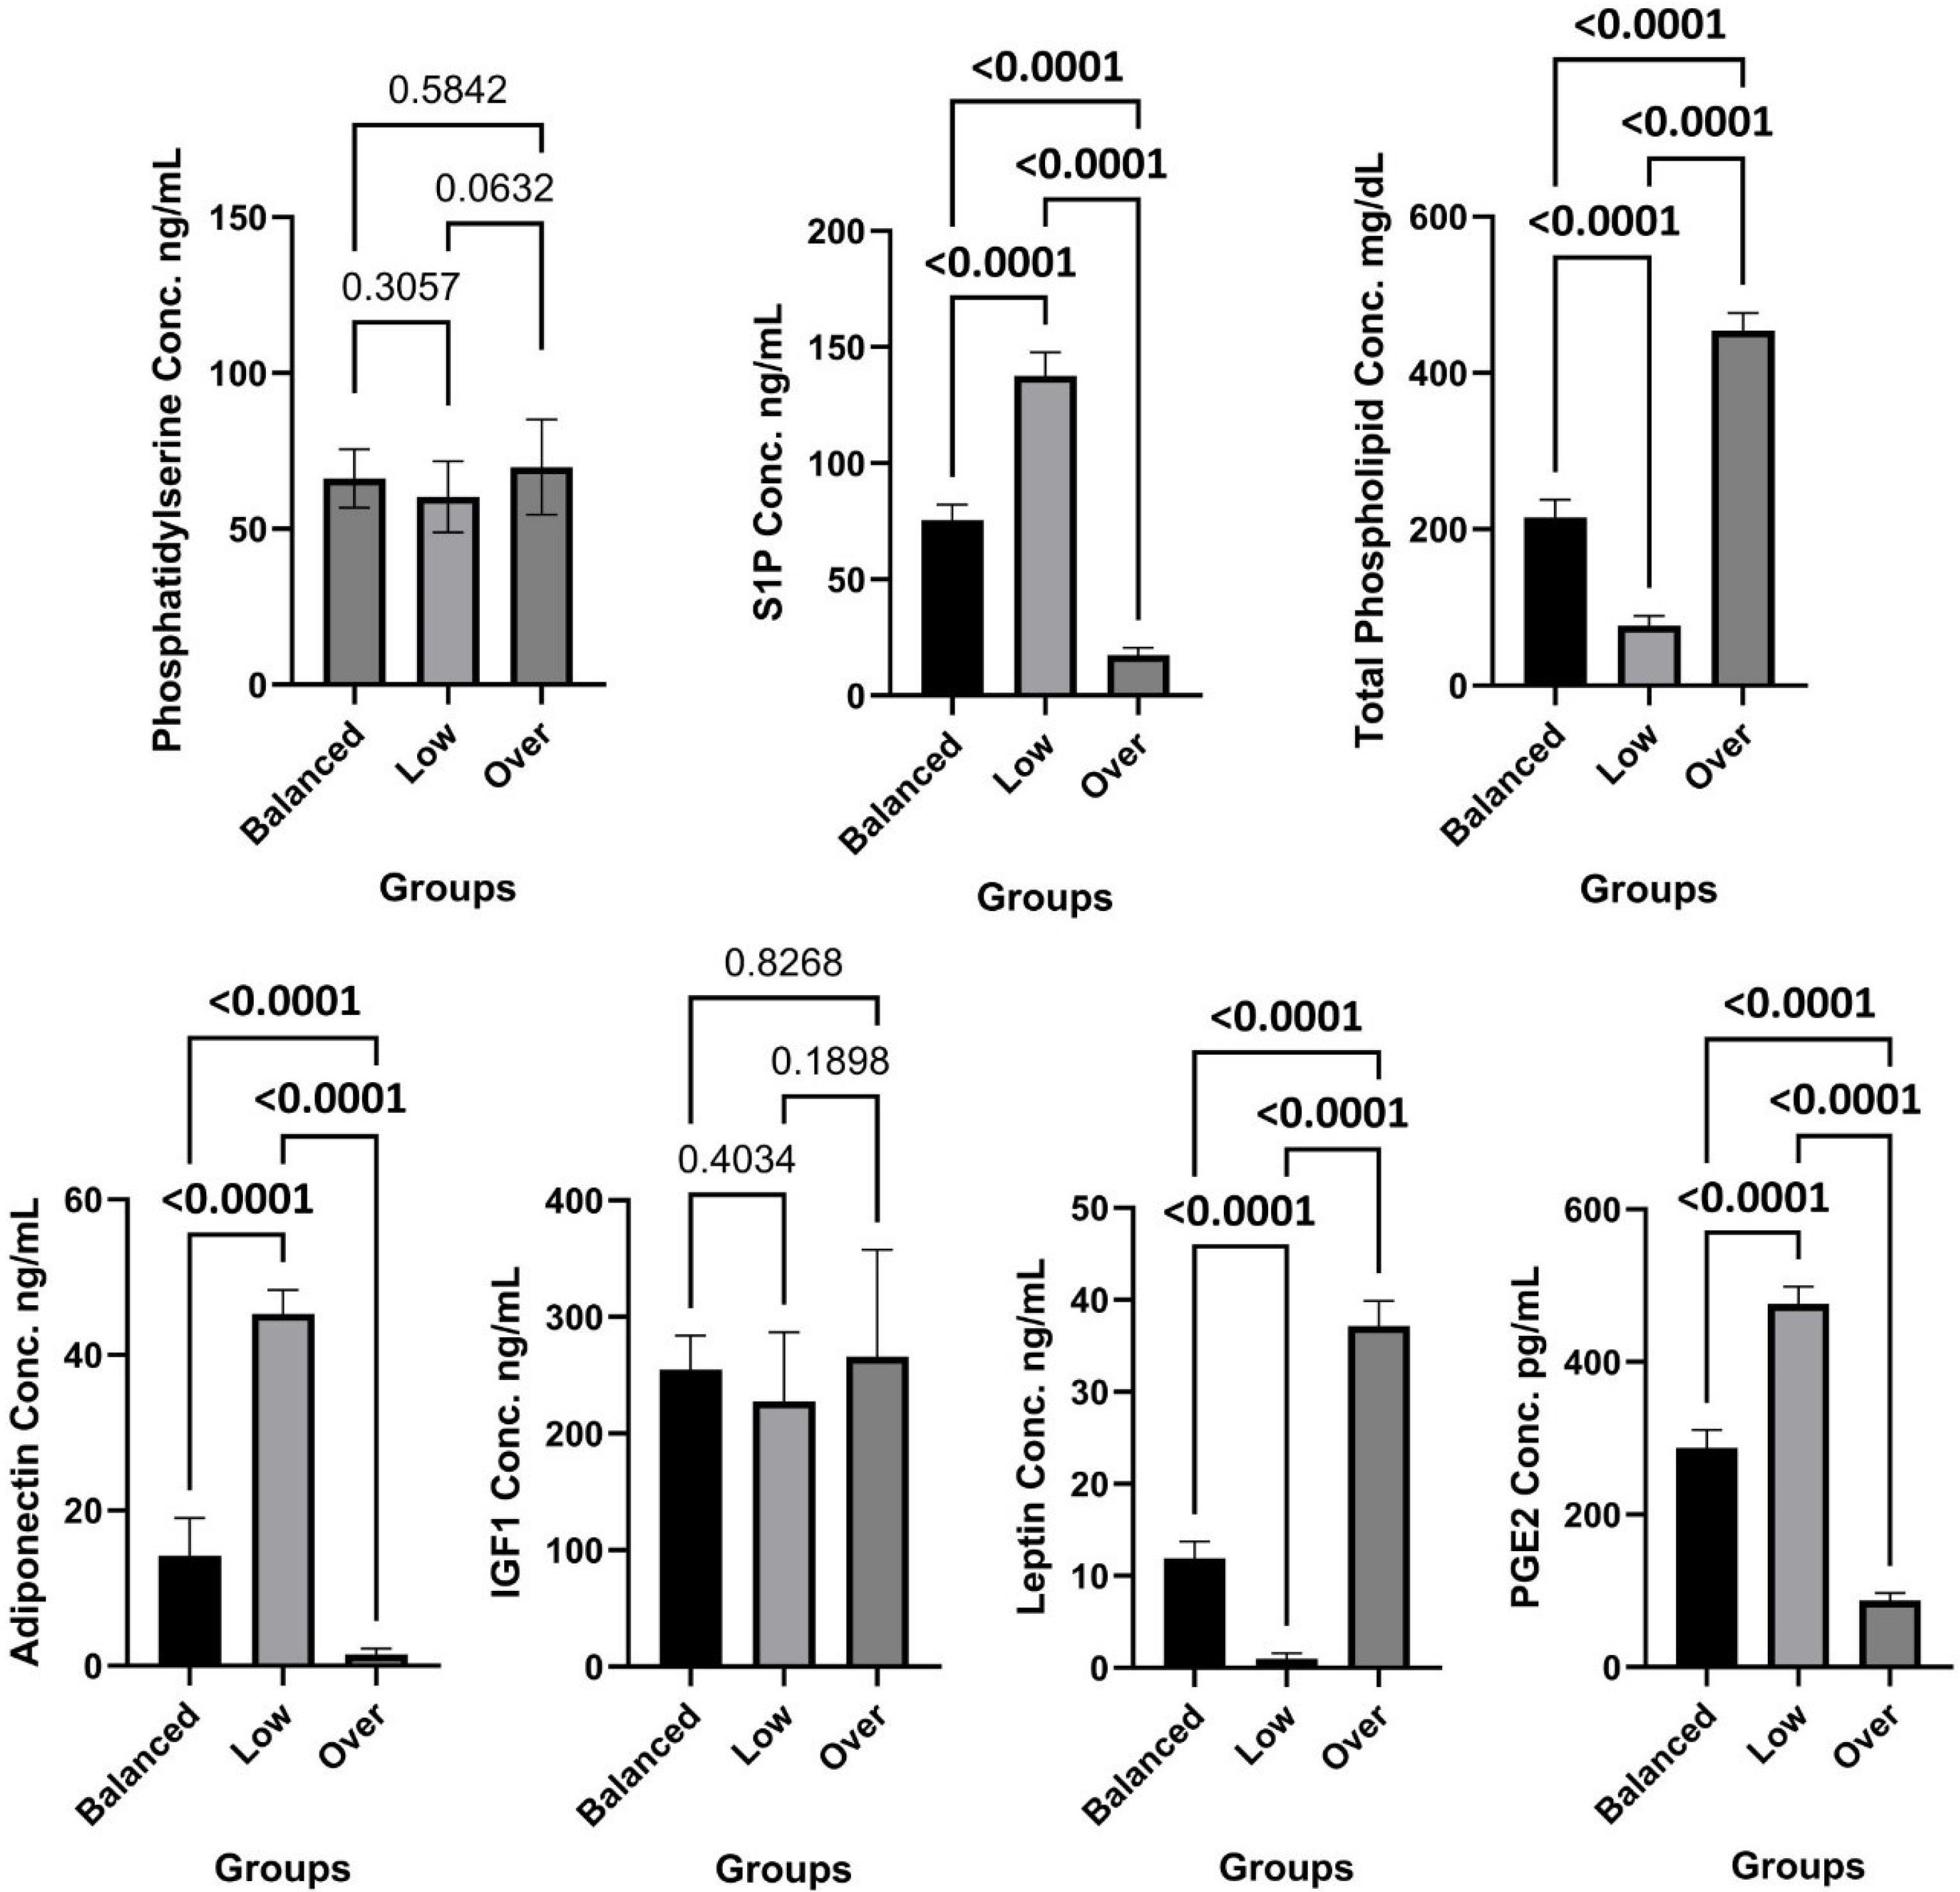
Fig. 4.
The serum level of metabolites in three RIF subgroups. Abbreviations: RIF, Recurrent implantation failure; IGF-1, insulin-like growth factor 1; PGE2, prostaglandin E2; S1P, sphingosine 1 phosphate; Conc, concentration. P < 0.05 considered as significant. (N = 32 for balanced, N = 47 for low and N = 84 for over-immune activation group).
.
The serum level of metabolites in three RIF subgroups. Abbreviations: RIF, Recurrent implantation failure; IGF-1, insulin-like growth factor 1; PGE2, prostaglandin E2; S1P, sphingosine 1 phosphate; Conc, concentration. P < 0.05 considered as significant. (N = 32 for balanced, N = 47 for low and N = 84 for over-immune activation group).
Discussion
RIF continues to be a highly challenging condition in assisted reproduction, with live-birth rates per cycle frequently falling below 25–35% even with improved laboratory and clinical protocols.21 Despite advancements in embryo selection, particularly with preimplantation genetic testing for aneuploidy (PGT-A), a significant number of RIF cases continue to occur even after the transfer of euploid embryos.22 This suggests that maternal factors, particularly endometrial and systemic immune dysregulation, can play a crucial role in these failures.23,24 Although the classification of RIF into immune endotypes—Balanced, Low, and Over—has been made possible by endometrial immune profiling using molecular biomarkers (IL-15/Fn-14, IL-18/TWEAK ratios, and CD56 expression), this method necessitates an invasive endometrial biopsy, which presents several limitations.7,25 However, this method, introduced by Lédée et al. for classifying RIF patients, has proven to be highly beneficial for developing personalized treatment plans.7,20 Treatment approaches vary based on the type of endometrial immune profile identified.26 For instance, patients categorized with low-immune activation may receive treatments such as endometrial scratching and luteal hCG.27,28 In contrast, those with excessive immune activation may be treated with high concentrations of estrogens during the proliferative phase, along with immunotherapy.29,30 It is noteworthy that patients classified as having balanced immune activation (no dysregulation) are unlikely to benefit from therapies based on immune system regulation.7 therefore, a comprehensive evaluation of other factors is essential to determine the most appropriate treatment options. Considering the usefulness of the method of classifying RIF patients based on endometrial immune profiling, in this study, we sought to develop a practical, minimally invasive peripheral blood-based classification system capable of mirroring the established endometrial immune profiles previously defined by molecular biomarkers in biopsied tissue.12 By incorporating peripheral Th1/Th2 balance, NK-cell expression, autoantibody signatures, and a panel of circulating metabolites, we aimed to capture an integrated systemic reflective of endometrial immune misregulation.31,32 The results demonstrate that peripheral blood parameters are highly informative for distinguishing low, balanced, and over-active immune endotypes in RIF patients, providing a compelling foundation for the development of an accessible diagnostic tool to guide personalized clinical intervention.
Our data suggest a tripartite systemic immune-metabolic perspective that could correspond to three types of endometrial immune activation (low, balanced, and over). The over-immune activation group exhibited a pronounced pro-inflammatory and autoimmune phenotype.33 This pattern is evidenced by a significantly increased Th1/Th2 ratio, a higher percentage of NK cells, and elevated levels of various autoimmune antibodies, including ANA, antiphospholipid, anti-β2-glycoprotein I, anti-TG, and anti-TPO. The presence of these autoimmune antibodies indicates an expanded autoreactive phenotype commonly linked to thrombophilia, uterine vascular dysfunction, and inflammatory activation, all of which are recognized as contributing factors in implantation failure.34,35 These findings align with existing literature linking excessive Th1 polarization and autoimmunity to impaired endometrial receptivity and embryo rejection.36 Increased Th1-dominance has previously been reported in women with RIF and RPL, reflecting a skew toward pro-inflammatory cytokines such as IFN-γ and TNF-α that disrupt implantation-associated tolerance.33,37,38 Similarly, heightened systemic NK-cell cytotoxicity has been linked to inadequate remodeling of spiral arteries, insufficient trophoblast invasion, and increased risk of reproductive failure.39,40 Our data confirm that these immune characteristics are not only present locally in the endometrium—as shown by the elevated IL-15/Fn-14 and IL-18/TWEAK ratios in this subgroup—but are also significantly detectable in peripheral circulation. Notably, the absence of significant differences in anti-cardiolipin, anti-dsDNA, and anti-TTG levels suggests a selective, rather than generalized, autoimmune activation in RIF—likely reflecting localized immune perturbations rather than systemic autoimmune disease.33 This selectivity reinforces the clinical relevance of our panel: it discriminates pathogenic autoimmunity relevant to implantation from incidental seropositivity.
In parallel, the Over-immune activation group displayed a striking metabolic signature: elevated leptin, and total phospholipids, alongside markedly reduced adiponectin, S1P, and PGE2. S1P, a bioactive sphingolipid, is a potent regulator of immune cell trafficking, vascular permeability, and endothelial barrier function.41 Its dramatic elevation in the low-immune activation group may promote excessive leukocyte infiltration into the endometrium, disrupt vascular remodeling, and foster a pro-thrombotic milieu—all detrimental to embryo implantation.42 The high leptin-to-adiponectin ratio mirrors a state of chronic low-grade inflammation and insulin resistance, both of which are known to impair endometrial decidualization and embryo–endometrial dialogue.43 The suppression of PGE2—a key lipid mediator that supports implantation by modulating uNK cell function, vascular tone, and immunosuppressive Treg differentiation—further exacerbates this hostile endometrial environment.44 Together, these metabolic alterations suggest a feed-forward loop between immune hyperactivation and metabolic dysregulation.
The Low-immune activation group displayed noticeably reduced Th1/Th2 ratios, consistent with insufficient inflammatory priming and impaired recruitment or maturation of uNK cells, both of which are critical for the orchestration of decidualization and angiogenesis during the WOI.45 This finding aligns with earlier reports indicating that overly immunosuppressed endometrial states are equally detrimental for implantation as excessive inflammation.46 The differences in most autoantibodies and flow cytometric parameters between the balanced and low subgroups did not reach statistical significance. This suggests that metabolic biomarkers may be particularly important for distinguishing these endotypes. Additionally, the similarity in autoantibody profiles between the balanced and low subgroups supports the idea that reduced immune activation is mechanistically different from hyperactivation and does not involve overt autoreactivity.47
While Th1/Th2 ratios and NK-cell percentages were comparable to the balanced group, so the results for this group exhibited significantly lower leptin and total phospholipids, but strikingly elevated adiponectin, S1P, and PGE2. Adiponectin, typically viewed as anti-inflammatory and insulin-sensitizing, may, in this context, reflect an excessively immunosuppressive state that fails to mount the controlled inflammatory response required for successful implantation.48,49 Similarly, while PGE2 is generally pro-implantation, its extreme elevation in the absence of adequate Th1-driven cytokine signaling (e.g., IFN-γ) may disrupt the delicate cytokine balance necessary for trophoblast invasion and vascular transformation.50 The lack of significant differences in phosphatidylserine and IGF-1 across groups further refines our understanding. Phosphatidylserine, an “eat-me” signal exposed on apoptotic cells, did not vary, suggesting that systemic apoptotic tone is not a major discriminator in RIF subtypes.51 Similarly, stable IGF-1 levels imply that major disruptions in the growth hormone–IGF axis are not central to the immune endotypes we describe, redirecting focus toward adipokines, and bioactive lipids.52
Direct research on total phospholipid levels and their singular effect on trophoblast invasion is limited, as most studies focus on specific phospholipid classes, metabolites, or signaling pathways.53 However, a strong and clear mechanistic link exists: disruptions in phospholipid metabolism—whether through overall depletion, imbalance, or specific alterations—can significantly impair trophoblast invasion.54 In this study, Total phospholipid levels displayed a similarly strong triphasic separation, supporting a broader lipidomic disruption underlying implantation failure. These lipids contribute directly to membrane fluidity, cell signaling, and trophoblast invasion capacity, suggesting a structural and biochemical dimension of dysfunction in both low and over-immune states.53,55 This paradox—where both excessive and insufficient immune-metabolic activity impair implantation—underscores the “Goldilocks principle” of endometrial receptivity: successful implantation requires immune and metabolic responses that are neither too strong nor too weak, but precisely calibrated.56
These insights strengthen the rationale for applying targeted, mechanism-specific interventions rather than empirical, one-size-fits-all treatment strategies in ART patients. The convergence of immune, autoimmune, and metabolic abnormalities observed exclusively in the over-immune activation group highlights an especially high-risk endotype that may benefit most from aggressive immunomodulatory treatment strategies.7 In contrast, patients in the low-immune activation group would be more appropriately treated with immune-activating approaches (e.g., endometrial scratching, hCG-triggered immune activation, or intralipid/PRP strategies) rather than the suppressive interventions sometimes used empirically in RIF.7 The noteworthy point is that, balanced-profile patients— who are likely to be in the normal situation in terms of their immune system profile—may avoid unnecessary and potentially harmful immunotherapies entirely.7,57 Thus, a non-invasive blood-based algorithm could not only reduce the need for endometrial biopsies but also streamline clinical decision-making by enabling earlier, safer, and repeated profiling throughout treatment cycles.
Our study can be significant in several respects. First, it integrates multi-omic peripheral markers—immune cells, autoantibodies, and metabolites—into a unified classification framework validated against a pre-registered endometrial molecular assay. On the other hand, the use of standardized, commercially available assays enhances reproducibility and clinical translatability. Furthermore, the segregation of RIF subtypes by systemic signatures supports the biological plausibility of endometrial–systemic immune crosstalk, likely mediated by shared cytokine networks, hormonal signals, and circulating immune cells.
However, several limitations warrant consideration. First of all, while peripheral blood partially reflects uterine immune function, discordance may occur due to the tissue-specific specialization of uNK and endometrial T cells. Additionally, our cross-sectional design only captures a single point in time during the mid-luteal phase; longitudinal studies examining both pre-implantation and peri-implantation periods would enhance predictive biological resolution. Moreover, including additional controls—such as women facing unexplained infertility without a history of repeated implantation failures—would bolster the validity of our findings. Information on participants’ concurrent medications and comorbid conditions, including autoimmune and rheumatologic disorders, was considered as part of the study exclusion criteria wherever possible; however, complete data were not available for all participants, which can be considered a study limitation. Lastly, expanding our approach to include multiple omics analyses, such as detailed lipidomics, proteomics, and cytokine profiling, could further refine subgroup classifications.
Future studies should investigate whether blood-based immune-metabolic signatures can predict ART outcomes prospectively and evaluate whether targeted immunotherapy guided by this classification improves live-birth rates. Validation in larger, independent cohorts and across centres is also necessary before broad clinical implementation.
Conclusion
In conclusion, this study, in line with previous research, demonstrates that RIF is not a single entity but a syndrome comprising distinct immune-metabolic endotypes, each identifiable through a minimally invasive peripheral blood test. The over phenotype is marked by autoimmune activation, Th1 skewing, and a pro-inflammatory metabolic milieu, whereas the low phenotype exhibits insufficient immune activation coupled with an exaggerated anti-inflammatory metabolic state. These findings support the development of a non-invasive diagnostic platform for personalized management of RIF, with the potential to transform clinical decision-making and reduce unnecessary biopsy procedures. Furthermore, by classifying patients based on peripheral blood biomarkers, clinicians can move beyond empiric, one-size-fits-all protocols toward rationally targeted, mechanism-based therapies that address the root cause of implantation failure in each individual.
Research Highlights
What is the current knowledge?
-
RIF is a complex issue in the field of infertility, influenced by several kinds of variables such as anatomical, genetic, and immunological factors.
-
Assessing the endometrial immune profile and classifying patients accordingly for personalized treatment is highly beneficial.
-
Endometrial biopsy is an invasive procedure for this purpose that has various limitations.
What is new here?
-
RIF patients can be classified according to variables present in their peripheral blood.
-
Immunologic and metabolic factors in peripheral blood can reflect conditions in the endometrium.
-
The use of peripheral blood rather than endometrial tissue provides a less invasive method that is reproducible and appropriate for routine diagnostic and therapeutic procedures.
Competing Interests
None to be declared.
Ethical Approval
Collection and use of all samples were approved by the Ethics Committee of the Research Council of the Faculty of Medicine, Tabriz University of Medical Sciences (IR.TBZMED.REC.1403.158).
Supplementary Files
Supplementary file 1 contains Tables S1 and S2.
(pdf)
References
- Mrozikiewicz AE, Ożarowski M, Jędrzejczak P. Biomolecular markers of recurrent implantation failure-a review. Int J Mol Sci 2021; 22:10082. doi: 10.3390/ijms221810082 [Crossref] [ Google Scholar]
- Garmendia JV, De Sanctis CV, Hajdúch M, De Sanctis JB. Exploring the immunological aspects and treatments of recurrent pregnancy loss and recurrent implantation failure. Int J Mol Sci 2025; 26:1295. doi: 10.3390/ijms26031295 [Crossref] [ Google Scholar]
- Opuchlik K, Pankiewicz K, Pierzyński P, Sierdziński J, Aleksejeva E, Salumets A. Factors influencing endometrial receptivity in women with recurrent implantation failure. BMC Womens Health 2025; 25:15. doi: 10.1186/s12905-024-03531-z [Crossref] [ Google Scholar]
- Feng X, Meng X, Guo S, Li K, Wang L, Ai J. Identification of key genes and immune cell infiltration in recurrent implantation failure: a study based on integrated analysis of multiple microarray studies. Am J Reprod Immunol 2022; 88:e13607. doi: 10.1111/aji.13607 [Crossref] [ Google Scholar]
- Esparvarinha M, Madadi S, Aslanian-Kalkhoran L, Nickho H, Dolati S, Pia H. Dominant immune cells in pregnancy and pregnancy complications: T helper cells (TH1/TH2, TH17/Treg cells), NK cells, MDSCs, and the immune checkpoints. Cell Biol Int 2023; 47:507-19. doi: 10.1002/cbin.11955 [Crossref] [ Google Scholar]
- Tang C, Hu W. The role of Th17 and Treg cells in normal pregnancy and unexplained recurrent spontaneous abortion (URSA): new insights into immune mechanisms. Placenta 2023; 142:18-26. doi: 10.1016/j.placenta.2023.08.065 [Crossref] [ Google Scholar]
- Cheloufi M, Kazhalawi A, Pinton A, Rahmati M, Chevrier L, Prat-Ellenberg L. The endometrial immune profiling may positively affect the management of recurrent pregnancy loss. Front Immunol 2021; 12:656701. doi: 10.3389/fimmu.2021.656701 [Crossref] [ Google Scholar]
- Dashti M, Ghasemzadeh A, Doustfateme S, Daraei M, Danaii S, Najdi N. Immunological risk factors for recurrent implantation failure using a deep learning model: a multicenter retrospective cohort study. Sci Rep 2025; 15:42822. doi: 10.1038/s41598-025-27561-1 [Crossref] [ Google Scholar]
- Lee S, Arffman RK, Komsi EK, Lindgren O, Kemppainen J, Kask K. Dynamic changes in AI-based analysis of endometrial cellular composition: analysis of PCOS and RIF endometrium. J Pathol Inform 2024; 15:100364. doi: 10.1016/j.jpi.2024.100364 [Crossref] [ Google Scholar]
- Vitale SG, Buzzaccarini G, Riemma G, Pacheco LA, Di Spiezio Sardo A, Carugno J. Endometrial biopsy: indications, techniques and recommendations An evidence-based guideline for clinical practice. J GynecolObstet Hum Reprod 2023; 52:102588. doi: 10.1016/j.jogoh.2023.102588 [Crossref] [ Google Scholar]
- Shen Y, Yang W, Liu J, Zhang Y. Minimally invasive approaches for the early detection of endometrial cancer. Mol Cancer 2023; 22:53. doi: 10.1186/s12943-023-01757-3 [Crossref] [ Google Scholar]
- Marron K, Harrity C. Correlation of peripheral blood and endometrial immunophenotyping in ART: is peripheral blood sampling useful?. J Assist Reprod Genet 2023; 40:381-7. doi: 10.1007/s10815-022-02696-6 [Crossref] [ Google Scholar]
- Cai JY, Tang YY, Deng XH, Li YJ, Liang G, Meng YQ. Recurrent implantation failure may be identified by a combination of diagnostic biomarkers: an analysis of peripheral blood lymphocyte subsets. Front Endocrinol (Lausanne) 2022; 13:865807. doi: 10.3389/fendo.2022.865807 [Crossref] [ Google Scholar]
- Jarne-Borràs M, Miró-Mur F, Anunciación-Llunell A, Alijotas-Reig J. Antiphospholipid antibodies in women with recurrent embryo implantation failure: a systematic review and meta-analysis. Autoimmun Rev 2022; 21:103101. doi: 10.1016/j.autrev.2022.103101 [Crossref] [ Google Scholar]
- Guo L, Wang X, Wang Y, Sun F, Song Y, Chen C. Impact of thyroid autoimmunity on pregnancy outcomes in euthyroid patients with recurrent implantation failure. Reprod Biomed Online 2023; 47:103229. doi: 10.1016/j.rbmo.2023.05.001 [Crossref] [ Google Scholar]
- Vera-Montoya M, Andrés Calvache J, Geber S. Growth hormone administration to improve reproductive outcomes in women with recurrent implantation failure (RIF): a systematic review. Reprod Sci 2023; 30:1712-23. doi: 10.1007/s43032-022-01124-5 [Crossref] [ Google Scholar]
- Barcroft JF, Galazis N, Jones BP, Getreu N, Bracewell-Milnes T, Grewal KJ. Fertility treatment and cancers-the eternal conundrum: a systematic review and meta-analysis. Hum Reprod 2021; 36:1093-107. doi: 10.1093/humrep/deaa293 [Crossref] [ Google Scholar]
- Mishra S, Rathoria R, Parihar A, Singh S, Agrawal S, Chaudhary E. Pipelle endometrial biopsy versus conventional dilation and curettage for the diagnosis of endometrial pathology in abnormal uterine bleeding. Cureus 2025; 17:e91794. doi: 10.7759/cureus.91794 [Crossref] [ Google Scholar]
- Saini RK, Prasad P, Shang X, Keum YS. Advances in lipid extraction methods-a review. Int J Mol Sci 2021; 22:13643. doi: 10.3390/ijms222413643 [Crossref] [ Google Scholar]
- Lédée N, Petitbarat M, Chevrier L, Vitoux D, Vezmar K, Rahmati M. The uterine immune profile may help women with repeated unexplained embryo implantation failure after in vitro fertilization. Am J Reprod Immunol 2016; 75:388-401. doi: 10.1111/aji.12483 [Crossref] [ Google Scholar]
- Stevens Brentjens L, Roumen RJE, Smits L, Derhaag J, Romano A, van Golde RJT. Pregnancy rate and time to pregnancy after recurrent implantation failure (RIF)-a prospective cohort follow-up study. J Assist Reprod Genet 2024; 41:3061-70. doi: 10.1007/s10815-024-03257-9 [Crossref] [ Google Scholar]
- Nair J, Shetty S, Kasi CI, Thondehalmath N, Ganesh D, Bhat VR. Preimplantation genetic testing for aneuploidy (PGT-A)-a single-center experience. J Assist Reprod Genet 2022; 39:729-38. doi: 10.1007/s10815-022-02413-3 [Crossref] [ Google Scholar]
- Basatvat S, Russell JM, Saare M, Thurston LM, Salumets A, Fazeli A. Potential innate immunity-related markers of endometrial receptivity and recurrent implantation failure (RIF). Reprod Biol 2021; 21:100569. doi: 10.1016/j.repbio.2021.100569 [Crossref] [ Google Scholar]
- Tempest N, Soul J, Hill CJ, Caamaño Gutierrez E, Hapangama DK. Cell type and region-specific transcriptional changes in the endometrium of women with RIF identify potential treatment targets. Proc Natl Acad Sci U S A 2025; 122:e2421254122. doi: 10.1073/pnas.2421254122 [Crossref] [ Google Scholar]
- Lédée N, Kazhalawi A, Prat-Ellenberg L, Dray G, El Banna N, Marie P. 15:00-15:20 the endometrial immune profiling: where are we after 10 years?. J Reprod Immunol 2023; 158:103574. doi: 10.1016/j.jri.2022.103574 [Crossref] [ Google Scholar]
- Lédée N, Petitbarat M, Prat-Ellenberg L, Dray G, Vaucoret V, Kazhalawi A. The next frontier in ART: harnessing the uterine immune profile for improved performance. Int J Mol Sci 2023; 24:11322. doi: 10.3390/ijms241411322 [Crossref] [ Google Scholar]
- Aghajanpour S, Mehraein F, Amjadi F, Zandieh Z, Ghaffari F, Aflatoonian K. Endometrial scratching in unexplained repeated implantation failure causes two competing forces, angiogenesis and anti-angiogenesis: an RCT study. Int J Reprod Biomed 2024; 22:253-68. doi: 10.18502/ijrm.v22i4.16387 [Crossref] [ Google Scholar]
- Luo X, Wu Y, Xu Y, Rong L, Liu X, Zhou X. Meta-analysis of intrauterine hCG perfusion efficacy in recurrent implantation failure as defined by ESHRE guidelines. BMC Pregnancy Childbirth 2024; 24:468. doi: 10.1186/s12884-024-06662-1 [Crossref] [ Google Scholar]
- Al-Lamee H, Ellison A, Drury J, Hill CJ, Drakeley AJ, Hapangama DK. Altered endometrial oestrogen-responsiveness and recurrent reproductive failure. ReprodFertil 2022; 3:30-8. doi: 10.1530/raf-21-0093 [Crossref] [ Google Scholar]
- Sarkesh A, Daei Sorkhabi A, Parhizkar F, Soltani-Zangbar MS, Yousefi M, Aghebati-Maleki L. The immunomodulatory effect of intradermal allogeneic PBMC therapy in patients with recurrent spontaneous abortion. J Reprod Immunol 2023; 156:103818. doi: 10.1016/j.jri.2023.103818 [Crossref] [ Google Scholar]
- Abdolmohammadi-Vahid S, Soltani-Zangbar MS, Aghebati-Maleki A, Nouri N, Ahmadi H, Danaii S. The effect of intrauterine autologous peripheral blood mononuclear cells (PBMCs) administration in modulating the immunologic profile aberrations in repeated implantation failure (RIF) women. Reprod Med Biol 2025; 24:e12686. doi: 10.1002/rmb2.12686 [Crossref] [ Google Scholar]
- Gao J, Guo H, Zhu L, Yang B, Zhang J, Xu K. Analysis of blocking antibodies and lymphocyte subsets in patients with recurrent reproductive failure. Hum Fertil (Camb) 2022; 25:569-74. doi: 10.1080/14647273.2021.1903099 [Crossref] [ Google Scholar]
- Wang Q, Sun Y, Fan R, Wang M, Ren C, Jiang A. Role of inflammatory factors in the etiology and treatment of recurrent implantation failure. Reprod Biol 2022; 22:100698. doi: 10.1016/j.repbio.2022.100698 [Crossref] [ Google Scholar]
- Di Donato G, d'Angelo DM, Breda L, Chiarelli F. Monogenic autoinflammatory diseases: state of the art and future perspectives. Int J Mol Sci 2021; 22:6360. doi: 10.3390/ijms22126360 [Crossref] [ Google Scholar]
- Kuroda K. A review of the optimization of thyroid function, thrombophilia, immunity and uterine milieu treatment strategy for recurrent implantation failure and recurrent pregnancy loss. Reprod Med Biol 2024; 23:e12561. doi: 10.1002/rmb2.12561 [Crossref] [ Google Scholar]
- Dong Z, Chen F, Peng S, Liu X, Liu X, Guo L. Identification of the key immune-related genes and immune cell infiltration changes in renal interstitial fibrosis. Front Endocrinol (Lausanne) 2023; 14:1207444. doi: 10.3389/fendo.2023.1207444 [Crossref] [ Google Scholar]
- Kamrani A, Motlagh Asghari K, Zafarani Y, Rahmanzad F, Soltani-Zangbar MS, Badihi E. The role of probiotics in restoring the Th1 to Th2 ratio in women experiencing recurrent implantation failure; a double-blind randomized clinical trial. Hum Immunol 2025; 86:111220. doi: 10.1016/j.humimm.2024.111220 [Crossref] [ Google Scholar]
- Guo L, Guo A, Yang F, Li L, Yan J, Deng X. Alterations of cytokine profiles in patients with recurrent implantation failure. Front Endocrinol (Lausanne) 2022; 13:949123. doi: 10.3389/fendo.2022.949123 [Crossref] [ Google Scholar]
-
Fukui A, Yamaya A, Saeki S, Takeyama R, Kato T, Wakimoto Y, et al. Natural killer cell pathology and repeated implantation failures. In: Kwak-Kim J, ed. Immunology of Recurrent Pregnancy Loss and Implantation Failure. Academic Press; 2022. p. 259-72. doi: 10.1016/b978-0-323-90805-4.00007-9.
- Ahmadi M, Ghaebi M, Abdolmohammadi-Vahid S, Abbaspour-Aghdam S, Hamdi K, Abdollahi-Fard S. NK cell frequency and cytotoxicity in correlation to pregnancy outcome and response to IVIG therapy among women with recurrent pregnancy loss. J Cell Physiol 2019; 234:9428-37. doi: 10.1002/jcp.27627 [Crossref] [ Google Scholar]
- Sun G, Wang B, Wu X, Cheng J, Ye J, Wang C. How do sphingosine-1-phosphate affect immune cells to resolve inflammation?. Front Immunol 2024; 15:1362459. doi: 10.3389/fimmu.2024.1362459 [Crossref] [ Google Scholar]
- Zhang F, Lu Y. The sphingosine 1-phosphate axis: an emerging therapeutic opportunity for endometriosis. Reprod Sci 2023; 30:2040-59. doi: 10.1007/s43032-023-01167-2 [Crossref] [ Google Scholar]
- Engin A. Adiponectin resistance in obesity: adiponectin leptin/insulin interaction. Adv Exp Med Biol 2024; 1460:431-62. doi: 10.1007/978-3-031-63657-8_15 [Crossref] [ Google Scholar]
- Satué K, La Fauci D, Medica P, Damiá Gímenez E, Cravana C, Fazio E. Shifts between pro-inflammatory and anti-inflammatory profiles in pregnant mares: a review of physiological functions. Front Vet Sci 2025; 12:1660759. doi: 10.3389/fvets.2025.1660759 [Crossref] [ Google Scholar]
- Llorca T, Ruiz-Magaña MJ, Martinez-Aguilar R, García-Valdeavero OM, Rodríguez-Doña L, Abadia-Molina AC. Decidualized human decidual stromal cells inhibit chemotaxis of activated T cells: a potential mechanism of maternal-fetal immune tolerance. Front Immunol 2023; 14:1223539. doi: 10.3389/fimmu.2023.1223539 [Crossref] [ Google Scholar]
- Gurbanova JF, Amirova AF, Huseynova İİ. The role of the immune state of the endometrium in the recurrent implantation disorders and miscarriages. MüasirGinekologiyavəPerinatologiyanınAktualMəsələləri 2025; 12:9-16. doi: 10.28942/mgpam.v12i1.158 [Crossref] [ Google Scholar]
- Dai H, Fan Q, Wang C. Recent applications of immunomodulatory biomaterials for disease immunotherapy. Exploration (Beijing) 2022; 2:20210157. doi: 10.1002/exp.20210157 [Crossref] [ Google Scholar]
- Jung HN, Jung CH. The role of anti-inflammatory adipokines in cardiometabolic disorders: moving beyond adiponectin. Int J Mol Sci 2021; 22:13529. doi: 10.3390/ijms222413529 [Crossref] [ Google Scholar]
-
Braun LM, Giesler S, Andrieux G, Riemer R, Talvard-Balland N, Duquesne S, et al. Adiponectin reduces immune checkpoint inhibitor-induced inflammation without blocking anti-tumor immunity. Cancer Cell 2025; 43: 269-91.e19. doi: 10.1016/j.ccell.2025.01.004.
-
Yu J, Qin R, Huang P, Hang F, Guo Y, Li Y, et al. Hormonal imbalance-mediated immune inflammation in endometrial decidualization disorder. Placenta 2025. doi: 10.1016/j.placenta.2025.06.025.
- Zhuang J, Zhang Y, Shu H, Zhang S, Zhao W, Ward N. Phosphatidylserine in the nervous system: cytoplasmic regulator of the AKT and PKC signaling pathways and extracellular "eat-me" signal in microglial phagocytosis. Mol Neurobiol 2023; 60:1050-66. doi: 10.1007/s12035-022-03133-6 [Crossref] [ Google Scholar]
- Salminen A, Kaarniranta K, Kauppinen A. Insulin/IGF-1 signaling promotes immunosuppression via the STAT3 pathway: impact on the aging process and age-related diseases. Inflamm Res 2021; 70:1043-61. doi: 10.1007/s00011-021-01498-3 [Crossref] [ Google Scholar]
- Aikawa S, Hirota Y. Roles of lipid mediators in early pregnancy events. Reprod Med Biol 2024; 23:e12597. doi: 10.1002/rmb2.12597 [Crossref] [ Google Scholar]
- Yang N, Sun Y, Han B, Deng N, Li G, Han Q. Trophoblastic signals facilitate endometrial interferon response and lipid metabolism, ensuring normal decidualization. Cell Rep 2024; 43:114246. doi: 10.1016/j.celrep.2024.114246 [Crossref] [ Google Scholar]
- Lim SA, Su W, Chapman NM, Chi H. Lipid metabolism in T cell signaling and function. Nat Chem Biol 2022; 18:470-81. doi: 10.1038/s41589-022-01017-3 [Crossref] [ Google Scholar]
- Lédée N, Petitbarat M, Dray G, Chevrier L, Kazhalawi A, Rahmati M. Endometrial immune profiling and precision therapy increase live birth rate after embryo transfer: a randomised controlled trial. Front Immunol 2025; 16:1523871. doi: 10.3389/fimmu.2025.1523871 [Crossref] [ Google Scholar]
-
Abdolmohammadi-Vahid S, Aghebati-Maleki L, Ahmadian-Heris J, Danaii S, Yousefi M. Immunotherapeutic approaches for recurrent reproductive failure. In: Vladimirov IK, ed. IVF Technologies and Infertility: Current Practices and New Perspectives. IntechOpen; 2022. doi: 10.5772/intechopen.108869.