Bioimpacts. 16:33527.
doi: 10.34172/bi.33527
Original Article
Transcriptomics and single-cell RNA sequencing uncover prognostic characteristics and immune regulatory mechanisms of lactylation in cervical cancer
Yunuo Zheng Data curation, Investigation, Methodology, Visualization, Writing – original draft, Writing – review & editing, 1, † 
Yue Li Data curation, Investigation, Methodology, Visualization, Writing – original draft, 2, †
Shenghan Zhang Data curation, Methodology, 1
Qian Lv Data curation, Methodology, Writing – original draft, 1
Jingbo Zhang Data curation, Methodology, 3
Bei Zhang Conceptualization, Funding acquisition, Methodology, Project administration, Resources, Supervision, Validation, 3, *
Yanyu Li Conceptualization, Formal analysis, Investigation, Methodology, Supervision, Validation, Writing – original draft, Writing – review & editing, 3, 4, *
Author information:
1Department of Central Laboratory, Xuzhou Central Hospital Southeast University, Xuzhou Central Hospital, Xuzhou, China
2Department of Intensive Care Unit, The Affiliated Xuzhou Municipal Hospital of Xuzhou Medical University, The First People's Hospital of Xuzhou, Xuzhou, China
3Department of Obstetrics and Gynecology, Xuzhou Clinical School of Xuzhou Medical University, Xuzhou Central Hospital, Xuzhou, China
4Suzhou Medical College of Soochow University, Suzhou, China
†These authors contributed equally to this work.
Abstract
Introduction:
Lactylation, an emerging post-translational modification, modulates tumor metabolism and gene expression, thereby influencing the initiation and progression of cervical squamous cell carcinoma (CESC). This study aims to identify lactylation-associated prognostic features in CESC through the integration of transcriptomic data and single-cell RNA sequencing (scRNA-seq).
Methods:
Publicly available datasets were utilized for this study. Lactylation-related genes (LRGs) linked to CESC prognosis were found through analysis. Key prognostic genes include PGK1, PFKP, DDX39A, RFC4, WAS, and PFKM, with PFKP identified as a risk factor.
Results:
The risk model demonstrated strong predictive performance, and immune infiltration analysis revealed elevated levels of immune cells, with CD8+ T cells negatively correlating with risk. ScRNA-seq analysis identified three distinct cell types, with CD8+ T cells showing a distinct developmental trajectory, marked by a reduction in early-stage cells and an accumulation of late-stage cells within the CESC microenvironment. Moreover, the expression of prognostic genes was elevated during the later stages of CD8+ T cell differentiation.
Conclusion:
LRGs demonstrated significant prognostic value in CESC and accurately predicted patient outcomes. Furthermore, the study underscored the pivotal role of CD8+ T cells in the progression of CESC.
Graphical Abstract
Keywords: Cervical cancer, Lactylation, Mendelian randomization, Single-cell RNA sequencing
Copyright and License Information
© 2026 The Author(s).
This work is published by BioImpacts as an open access article distributed under the terms of the Creative Commons Attribution Non-Commercial License (
http://creativecommons.org/licenses/by-nc/4.0/). Non-commercial uses of the work are permitted, provided the original work is properly cited.
Funding Statement
This work was supported by the Xuzhou Science and Technology Project (No. KC23181), and the Xuzhou Medical University Affiliated Hospital Development Fund Surface Project (No. XYFM202206).
Introduction
Cervical squamous cell carcinoma (CESC) represents a major public health concern worldwide, ranking as the fourth most common malignancy of the female reproductive system. Alarmingly, the age of onset has been decreasing, posing an increasing threat to younger populations.1 The 2023 ICO/IARC China HPV and related diseases report indicated that, in 2020, CESC ranked third in both incidence and mortality among Chinese women aged 15 to 44, with 109,741 new cases and 59,060 deaths. These figures accounted for approximately 18.2% and 17.3% of the global incidence and mortality, respectively. CESC symptoms include abnormal vaginal bleeding, pelvic pain, and pain during intercourse. Early diagnosis improves survival rates. Treatment for early-stage disease involves surgery and adjuvant therapy, whereas advanced-stage disease is primarily managed with palliative care.2,3 Given the suboptimal cure rates for advanced CESC and the considerable side effects of existing treatments, there is an urgent need for innovative strategies in screening, prevention, and therapy. Identifying novel genetic markers for predicting disease progression and optimizing treatment regimens is essential for improving clinical outcomes.
Lactate is recognized for its important roles in cancer metabolism, acting as a dynamic metabolite that shuttles between cells and participates in signaling.4 This glycolysis-dependent metabolic reprogramming is pivotal in tumors, where lactate serves as a key component, facilitating rapid energy acquisition for tumor cells.5 In the tumor microenvironment, lactate promotes acidity, supporting tumor growth, invasion, metastasis, and angiogenesis. Lactylation, driven by lactate, enhances these tumorigenic processes and also modulates the function of immune cells such as T cells, NK cells, dendritic cells, and macrophages.6 Lactate's role is especially prominent in shaping immune responses within the tumor microenvironment (TME). High lactate concentrations induce local acidosis, which impairs the metabolic activity of both innate and adaptive immune cells. This results in the inhibition of cytotoxic CD8+ T cell and NK cell activation and proliferation, while simultaneously promoting the immunosuppressive functions of regulatory T cells (Tregs).7 Additionally, lactate promotes macrophage polarization toward an M2-like phenotype, contributing to an anti-inflammatory microenvironment that favors tumor progression.7 Recent studies on CESC have further elucidated lactate's influence on tumor biology. Meng et al demonstrated that lactylation significantly impacts the activity of glucose-6-phosphate dehydrogenase (G6PD), a key enzyme in the pentose phosphate pathway (PPP), suggesting that G6PD could serve as a potential therapeutic target for CESC.8 Furthermore, lactylation stabilizes the Discoidin, CUB and LCCL domain-containing protein 1 (DCBLD1) protein, thereby enhancing PPP activity, which has been linked to CESC progression.9 The extensive role of lactate and its derivatives in regulating the TME underscores their profound impact on therapeutic strategies and prognosis,10 not only in CESC but also in other malignancies such as liver cancer11 and breast cancer.12 Therefore, exploring the implications of lactylation in tumor biology and therapeutic response is essential for improving patient outcomes and advancing precise, targeted treatment strategies.
This study utilized transcriptomic and single-cell RNA sequencing data to identify lactylation-related genes (LRGs) as prognostic biomarkers for CESC. Comprehensive statistical and Mendelian randomization (MR) analyses were performed to assess their prognostic potential and explore causal links with CESC, providing insights into molecular mechanisms and potential therapeutic strategies.
Materials and Methods
Data source
The expression matrix and clinical data for CESC were obtained from The Cancer Genome Atlas (TCGA) database (https://www.cancer.gov/tcga), encompassing 296 tumor tissue samples. Similarly, expression matrices and clinical information for 10 normal cervical tissue samples were retrieved from the Genotype-Tissue Expression (GTEx) Project database. Data from TCGA and GTEx were combined to form a training cohort, while Gene Expression Omnibus (GEO) datasets GSE44001 and GSE168652 provided transcriptional and single-cell RNA sequencing data for validation. GSE44001 included 300 CESC tumor samples, and GSE183904 contained scRNA-seq data from 11,422 normal and 14,220 CESC cells. Additionally, 332 LRGs were retrieved from previously published literature, and 330 unique LRGs were identified after removing duplicates.13,14
Differential expression analysis
Using DESeq2 (version 1.40.2), differential expression analysis was performed to identify differentially expressed genes (DEGs) between tumor and normal tissues in the training cohort.15,16 A threshold of |log2Fold Change (FC)| > 1 and an adjusted *P < 0.05 was applied. DEGs were visualized using a volcano plot and heatmap, generated with ggplot2 (version 3.3.6)17 and pheatmap (version 1.0.12),18 respectively. The ggvenn program (version 0.1.9) was then used to map these DEGs against the 330 LRGs to identify differentially expressed LRGs (DE-LRGs).19
Enrichment analysis of DE-LRGs and construction of protein-protein interaction (PPI) network
Gene Ontology (GO) and Kyoto Encyclopedia of Genes and Genomes (KEGG) enrichment studies (*P <0.05) were performed on the DE-LRGs using the cluster profiler tool (version 4.7.1.001).20 The ggpubr tool (version 0.5.0) was used to show the top ten most pertinent KEGG pathways and the top five most significant phrases from each GO category.21 Protein-protein interactions (PPIs) between DE-LRGs were evaluated using STRING (https://string-db.org/) with a minimum confidence score of 0.4. Cystoscope software (version 3.8.2) was used to show the PPI network.22,23
Construction and validation of a risk model
Univariate Cox regression analysis was performed on DE-LRGs from the training cohort to identify genes associated with CESC survival, utilizing the survival package (version 3.5-3).24 Genes were classified as survival-related if their P value was less than 0.05 and their hazard ratio (HR) was not equal to 1. The best gene set for multivariate Cox regression was then chosen by doing least absolute shrinkage and selection operator (LASSO) analysis on these genes using the glmnet package (version 4.1.4).25 The final regression equation and prognostic genes for CESC were found using stepwise regression.
Stepwise regression was utilized to create a risk model in the training cohort using prognostic gene expression and survival data. Based on median risk scores, patients were divided into high-risk and low-risk groups. Risk curves and a heatmap were used to depict risk distributions. Kaplan-Meier survival analysis evaluated how the two groups' overall survival differed.26 In order to assess the prediction efficacy of the risk model, receiver operating characteristic (ROC) curves were created using the survival ROC software (version 1.0.3) to compute area under the curve (AUC) values at 1, 3, and 5 years.27 An independent cohort provided additional validation of the model's resilience.
Construction of a nomogram
Clinical parameters (age, stage, M stage, N stage, T stage) were included in univariate and multivariate Cox regression analyses (HR ≠ 1 and *P < 0.05) within the training cohort in order to find independent predictive markers for CESC. This procedure revealed independent variables affecting the prognosis of CESC. The prediction of survival rates was then made possible by integrating these independent prognostic indicators and the risk scores into a nomogram created with the rms program (version 6.5-1).28 To assess the nomogram's performance, calibration and ROC curves were also generated.
Functional and annotation analyses
The psych package (version 2.3.12) was used to perform a Spearman correlation study between each prognostic gene and other genes, and the findings were sorted accordingly. The top 10 enriched pathways were displayed after pathway enrichment analysis was carried out using gene set enrichment analysis (GSEA) with the cluster profiler program (*P < 0.05). Gene set variation analysis (GSVA) was performed using GSVA (version 1.42.0)29 and limma (version 3.52.4)30 packages to compare high-risk group (HRG) and low-risk group (LRG), with a threshold of |t| > 2 and *P < 0.05. The top 5 upregulated and downregulated pathways, ranked by |t|, were presented.
Immune infiltration, mutation landscape, and drug sensitivity analysis
To assess the immune cell composition within the TME of patients with CESC, the proportions of 22 immune cell types31 were estimated and compared between tumor and normal samples in the training cohort using the CIBERSORT algorithm (version 1.03).32 The association between immune cell proportions and risk scores was evaluated using Spearman correlation, and the maftools software (version 2.17.10) was used to analyze the genomic mutations of CESC patients in the training cohort.33 Furthermore, half maximum inhibitory concentration (IC50) values were calculated using the onco predict package (version 0.2), and frequently used chemotherapeutic drugs for CESC were obtained from the Genomics of Drug Sensitivity in Cancer (GDSC) database (http://cancerrxgene.org).34 Next, a comparison was made between the IC50 values of high-risk and low-risk cohorts.
ScRNA -seq analysis
The GSE168652 dataset was subjected to scRNA-seq after transcriptome analysis in order to examine cellular processes in CESC. The Seurat software (version 5.1.0) was used for all analyses, beginning with strict quality control (QC) protocols to eliminate cells having nFeature_RNA > 6000, nCount_RNA ≥ 30,000, or mitochondrial content ≥ 25%.35 The top 2,000 most variable genes were selected for additional analysis using variance-stabilizing transformation (VST) following log-normalization. To choose the right principal components for further analysis, principal component analysis (PCA) was carried out using Jack Straw Plot and Jack Straw functions. The FindNeighbors and FindClusters functions were used to cluster the cells, and t-distributed stochastic neighbor embedding (t-SNE) with a resolution of 0.4 was used to show the results. Clusters were annotated by marker genes to identify CESC-specific cell types, and their developmental trajectories were analyzed via pseudo-time analysis using the monocle package,36 and intercellular communication was examined using the cell chat package (version 1.6.1)37 to explore cellular interactions.
Selection of instrumental variables (IVs) for MR analysis
Using prognostic genes as exposure variables and CESC as the outcome, MR analysis was carried out using the two-sample MR program (version 0.56) to examine the causal link between prognostic genes and CESC.38 The integrative epidemiology unit (IEU) open genome-wide association study (GWAS) database (https://gwas.mrcieu.ac.uk/) provided expression quantitative trait loci (eQTL) data for prognostic genes, whereas the FinnGen R11 database (https://r11.finngen.fi/) provided GWAS data for CESC. The dataset, 'finngen_R11_CD2_INSITU_CERVIX_UTERI_EXALLC,' comprised 21,295,319 single-nucleotide polymorphisms (SNPs) from 202,101 European individuals, comprising 198,767 controls and 3,334 cases. MR analysis relied on three core assumptions: IVs must be strongly associated with the exposure, independent of confounders, and affect the outcome only through the exposure. Linkage disequilibrium was reduced (r2 = 0.001, kb = 10,000) and IVs with significant connections (P < 5 × 10⁻¹) were chosen. The instrument strength was evaluated using F-statistics, and alleles and effect estimates were aligned for consistent effect directions using harmonize_data.
Exploring the causal association between prognostic genes and CESC
MR analysis was performed using the MR function, incorporating five distinct methods: MR-Egger,39 Weighted median,40 Inverse variance weighted (IVW),41 Simple mode,38 and Weighted mode.42 The identification of significant connections (*P < 0.05) was made possible by the IVW method's robustness in determining causal linkages. A risk factor for CESC was indicated by an odds ratio (OR) larger than 1, whereas a protective effect was suggested by an OR less than 1. The robustness of the MR results was further evaluated through sensitivity analyses, including tests for heterogeneity,43 horizontal pleiotropy,44 and the leave-one-out (LOO) test.45
Statistical analysis
R software (version 4.2.2) was used for all analyses, and the Wilcoxon test was used to evaluate group differences. For every statistical test, a significance level of *P < 0.05 was used.
Results
Selection and enrichment analysis of DE-LRGs
In the training cohort, 6,791 DEGs were identified between tumor and normal tissues, with 3,573 upregulated and 3,218 downregulated. Intersection with 330 LRGs yielded 83 DE-LRGs, which were enriched in 204 GO terms (BP, CC, MF) and 128 KEGG pathways, including focal adhesion, cadherin binding, nucleocytoplasmic transport, and carbon metabolism. The PPI network revealed 340 interactions, with Glyceraldehyde-3-phosphate dehydrogenase (GAPDH) and Tumor Protein P53 (TP53) as key hubs (Fig. 1).
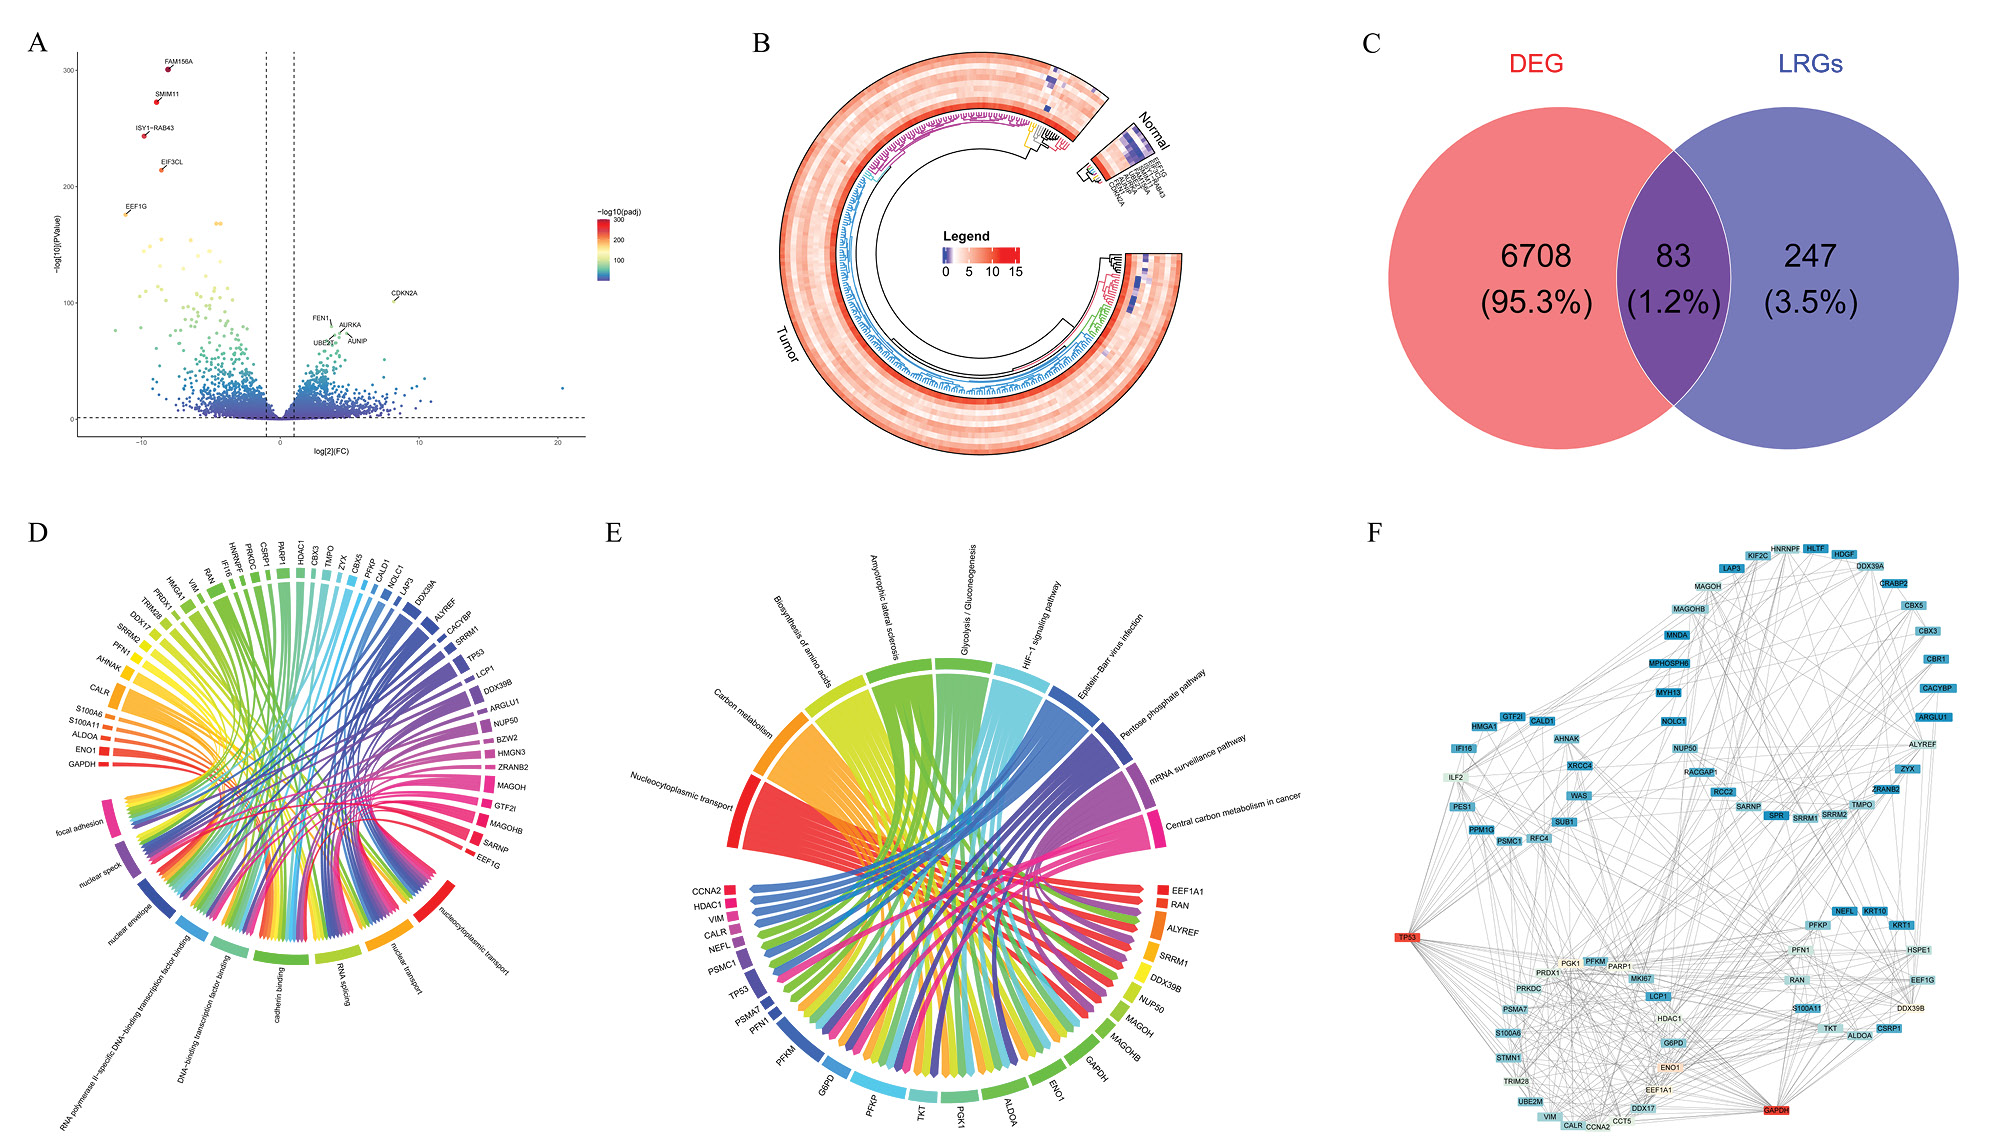
Fig. 1.
Identification and pathway analysis of DE-LRGs in TCGA combined with the GTEx dataset (training cohort).(A-B) Volcano plot and heatmap depicting the expression patterns of DEGs between CESC and normal tissues. (C) Venn diagram illustrating the intersection of DEGs with LRGs to identify DE-LRGs. (D-E) GO and KEGG pathway analyses highlighting the biological functions and signaling pathways enriched among the identified DE-LRGs. (F) Visualization of the PPI network for DE-LRGs, illustrating key molecular interactions and connectivity. DE-LRGs: differentially expressed lactylation-related genes; TCGA: The Cancer Genome Atlas; GTEx: Genotype-Tissue Expression Project; DEGs: differentially expressed genes; CESC: cervical cancer; GO: Gene Ontology; KEGG: Kyoto Encyclopedia of Genes and Genomes; PPI: protein-protein interaction.
.
Identification and pathway analysis of DE-LRGs in TCGA combined with the GTEx dataset (training cohort).(A-B) Volcano plot and heatmap depicting the expression patterns of DEGs between CESC and normal tissues. (C) Venn diagram illustrating the intersection of DEGs with LRGs to identify DE-LRGs. (D-E) GO and KEGG pathway analyses highlighting the biological functions and signaling pathways enriched among the identified DE-LRGs. (F) Visualization of the PPI network for DE-LRGs, illustrating key molecular interactions and connectivity. DE-LRGs: differentially expressed lactylation-related genes; TCGA: The Cancer Genome Atlas; GTEx: Genotype-Tissue Expression Project; DEGs: differentially expressed genes; CESC: cervical cancer; GO: Gene Ontology; KEGG: Kyoto Encyclopedia of Genes and Genomes; PPI: protein-protein interaction.
Recognition of prognostic genes and construction of a risk model
Using univariate cox regression, 17 survival-associated genes were found among 83 DE-LRGs. Phosphoglycerate kinase 1 (PGK1), phosphofructokinase platelet (PFKP), DEAD-box helicase 39A (DDX39A), replication factor C subunit 4 (RFC4), Wiskott-Aldrich syndrome (WAS), and phosphofructokinase muscle (PFKM) (Fig. 2B) are the six prognostic genes for CESC that were identified by stepwise regression. With risk curves (Figs. 2C–2D) and heatmaps (Figs. 2E–2F) demonstrating higher PGK1, PFKP, and PFKM in HRC, the developed risk model classified patients into HRC (high risk cluster) and LRC (low risk cluster).
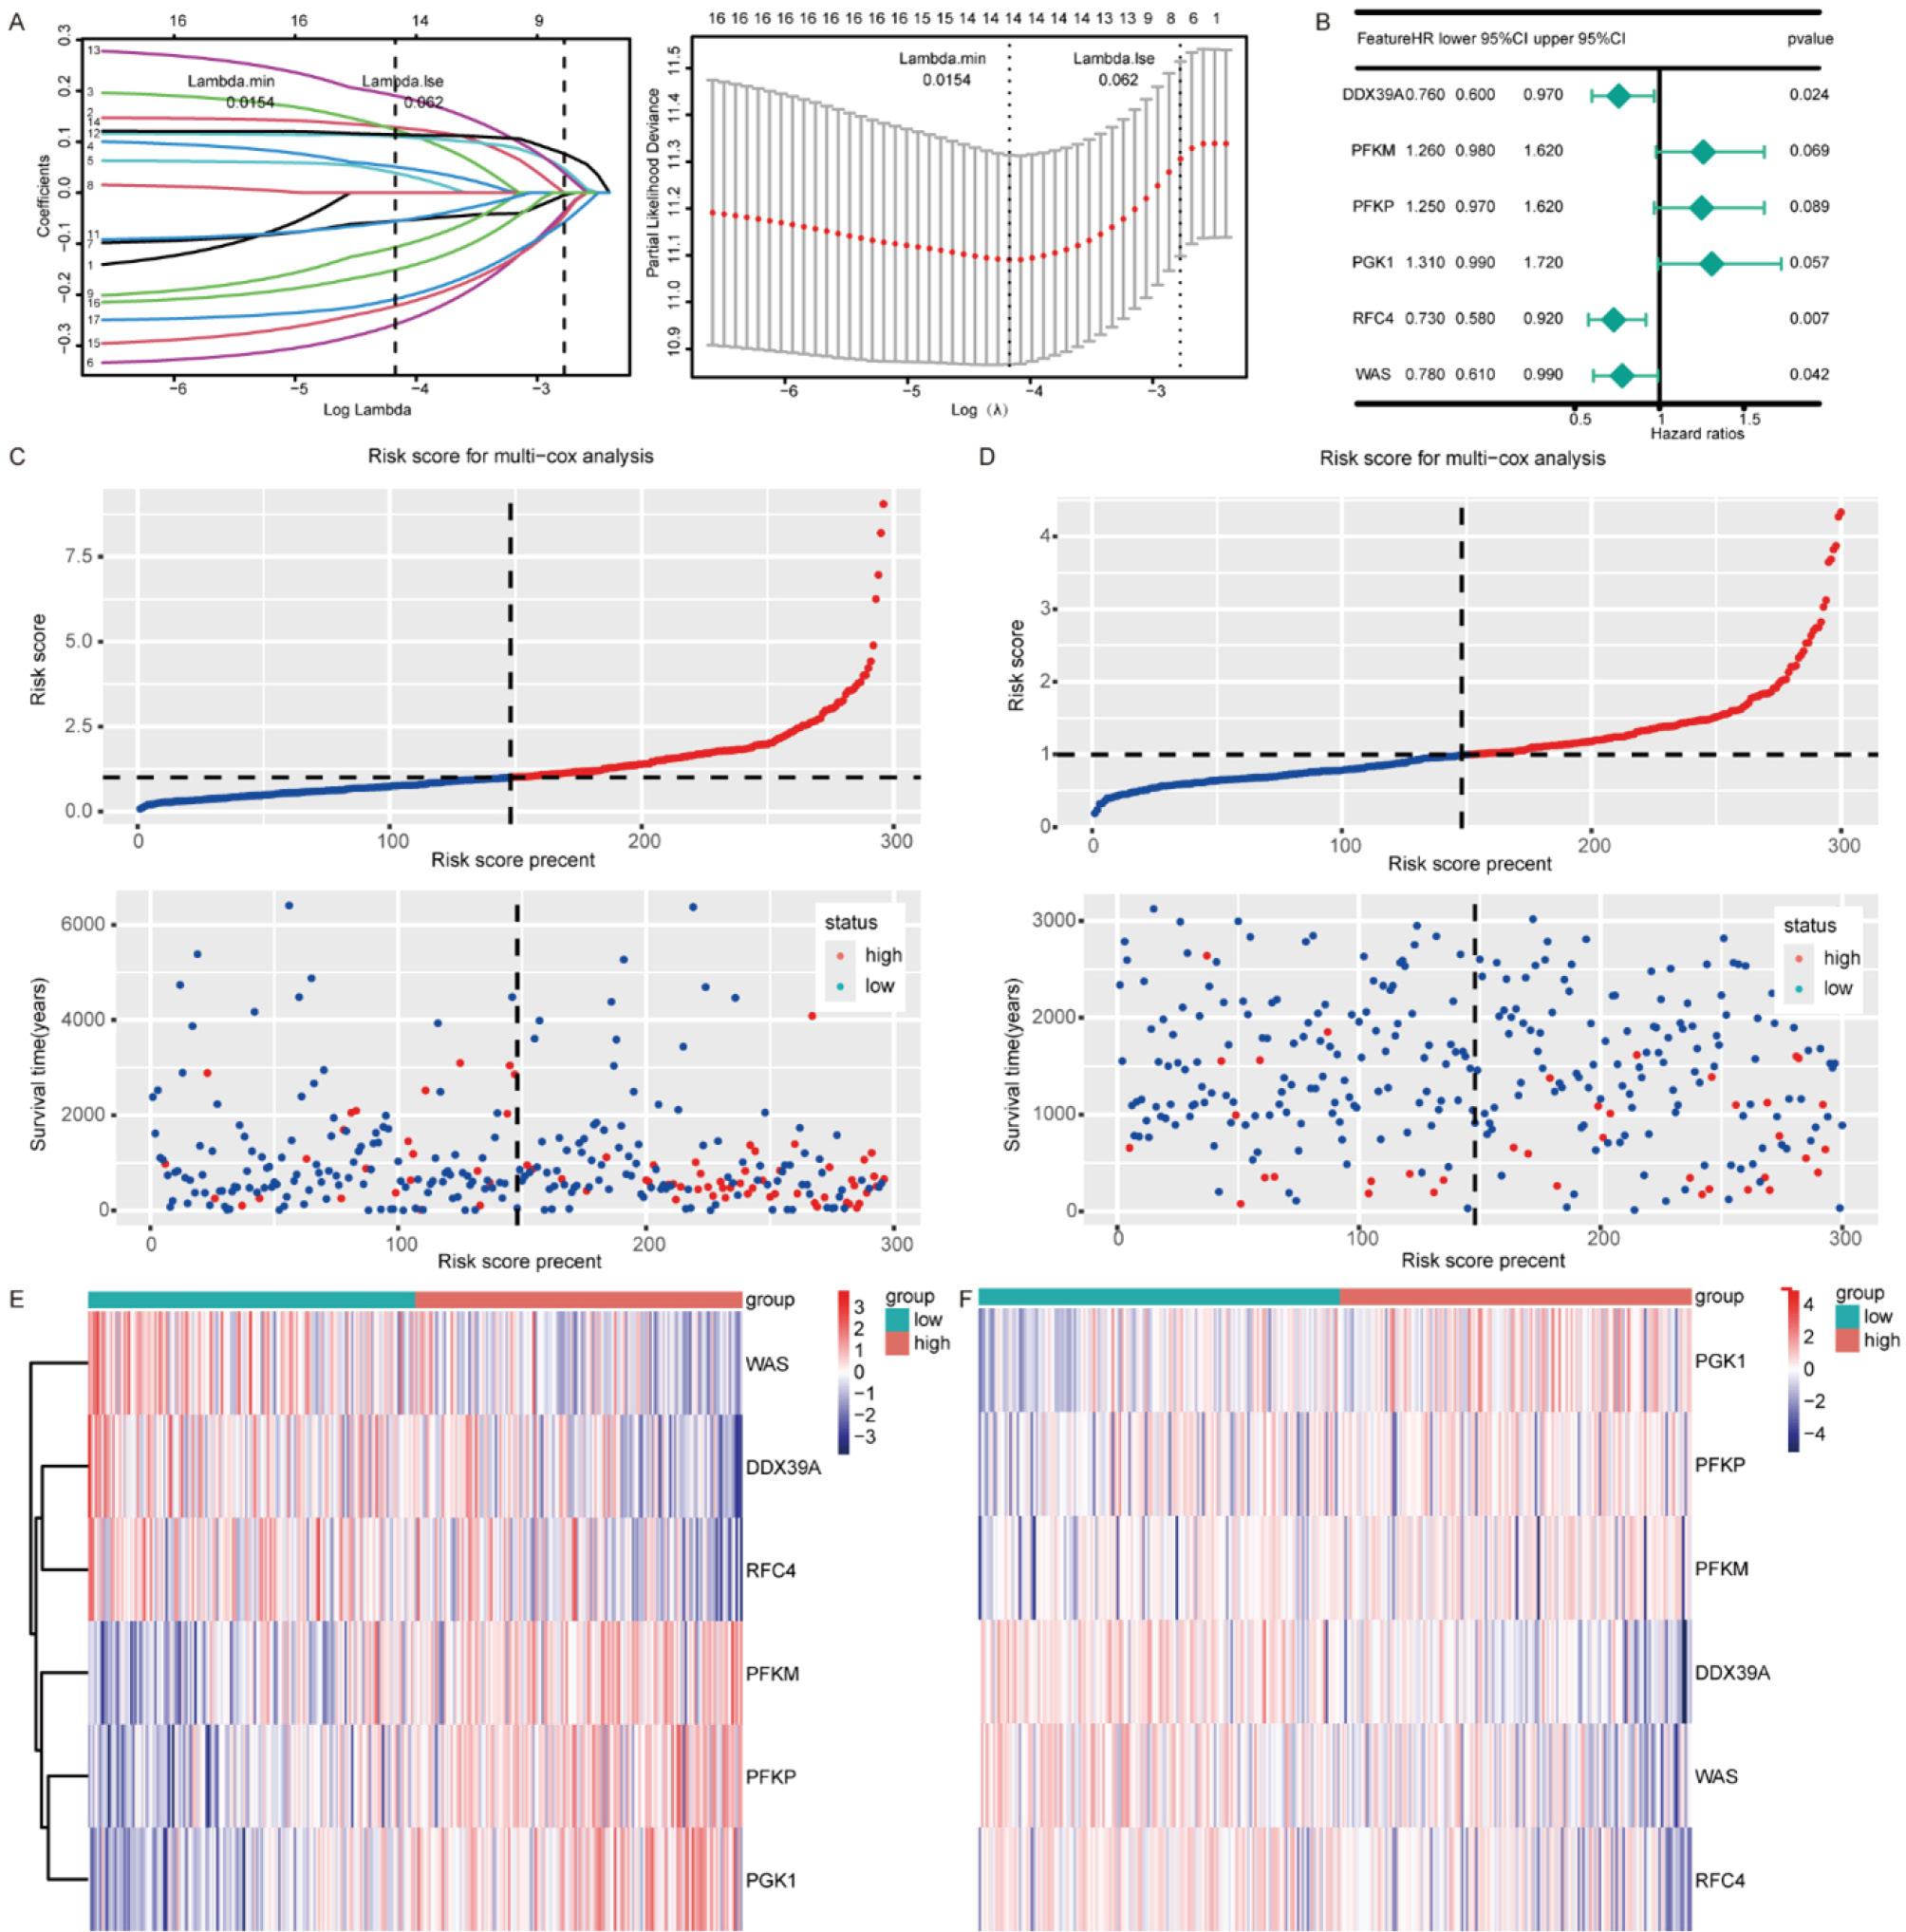
Fig. 2.
Identification of prognostic genes in CESC. (A) LASSO regression analysis applied to survival-related genes identified through univariate Cox regression in the training cohort. (B) Multivariate Cox regression analysis incorporating LASSO-selected genes to identify prognostic genes in the training cohort. (C-D) Risk curves illustrating the distribution of risk scores and survival status among high-risk and low-risk groups (HRG and LRG) in the training (C) and validation (GSE44001) (D) cohorts. (E-F) Heatmaps displaying the expression patterns of prognostic genes across HRG and LRG in the training (E) and validation (F) cohorts. LASSO: Least Absolute Shrinkage and Selection Operator.
.
Identification of prognostic genes in CESC. (A) LASSO regression analysis applied to survival-related genes identified through univariate Cox regression in the training cohort. (B) Multivariate Cox regression analysis incorporating LASSO-selected genes to identify prognostic genes in the training cohort. (C-D) Risk curves illustrating the distribution of risk scores and survival status among high-risk and low-risk groups (HRG and LRG) in the training (C) and validation (GSE44001) (D) cohorts. (E-F) Heatmaps displaying the expression patterns of prognostic genes across HRG and LRG in the training (E) and validation (F) cohorts. LASSO: Least Absolute Shrinkage and Selection Operator.
K-M curves indicated lower OS in HRC (Fig. 3A) with similar trends in the validation cohort (Fig. 3B). ROC analysis showed robust predictive performance with AUCs of 0.70–0.76 in the training cohort (Fig. 3C) and > 0.60 in the validation cohort (Fig. 3D).Construction of a nomogram for predicting 1-, 3-, and 5-year survival rates for patients with CESC.
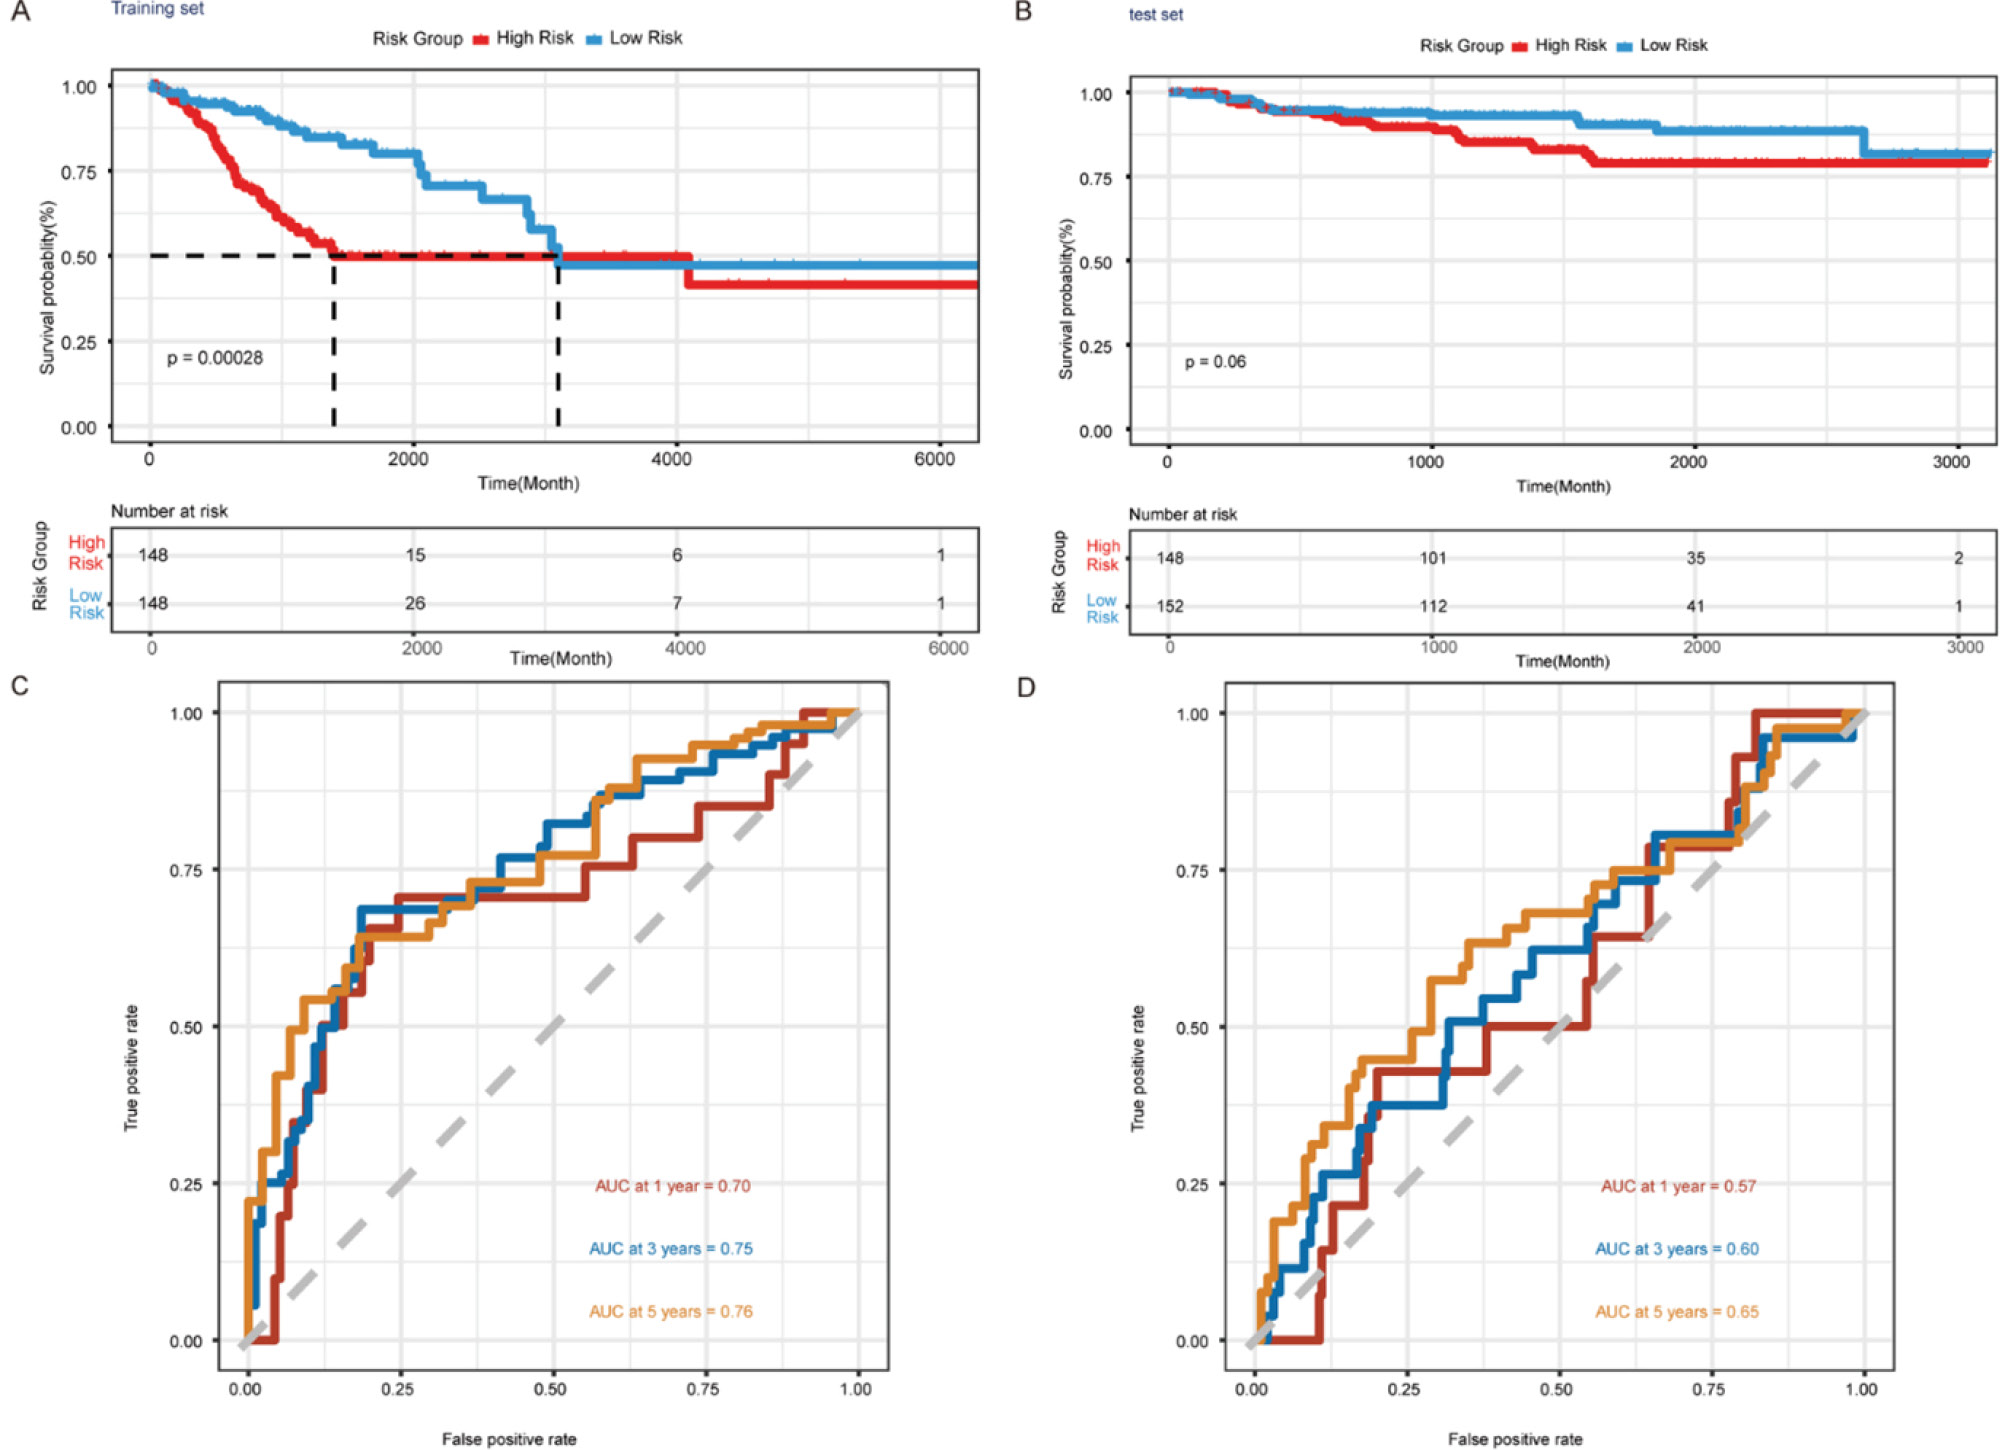
Fig. 3.
Construction of a risk model for CESC. (A-B) K-M survival curves in the training (A) and validation (B) cohorts that illustrate variations in overall survival (OS) between HRG and LRG. (C-D) ROC curves for the risk model, with AUC computations for the training (C) and validation (D) cohorts at 1, 3, and 5 years. AUC: area under the curve; ROC: receiver operating characteristic; OS: overall survival.
.
Construction of a risk model for CESC. (A-B) K-M survival curves in the training (A) and validation (B) cohorts that illustrate variations in overall survival (OS) between HRG and LRG. (C-D) ROC curves for the risk model, with AUC computations for the training (C) and validation (D) cohorts at 1, 3, and 5 years. AUC: area under the curve; ROC: receiver operating characteristic; OS: overall survival.
Five parameters were included in a univariate Cox regression analysis to evaluate the independent predictive importance of clinical features in CESC patients. This analysis revealed significant associations for stage, N stage, and T stage (HR ≠ 1, *P < 0.05). These factors were subsequently included in a multivariate Cox regression analysis, which further confirmed stage, N stage, and T stage as independent prognostic factors (HR ≠ 1, *P < 0.05) (Fig. 4A). Based on these findings, a nomogram was created to predict the 1-, 3-, and 5-year survival rates for patients with CESC by combining the risk scores with these three independent prognostic markers (Fig. 4B). Lower survival rates were correlated with higher nomogram scores. The nomogram demonstrated a notable degree of predictive accuracy, according to the calibration curve (Fig. 4C). Notably, the nomogram achieved AUC values of 0.805, 0.820, and 0.815 for 1-, 3-, and 5-year predictions, respectively, outperforming analyses using only the risk scores (Fig. 4D). As a result, the nomogram that was created performed better while evaluating the prognosis of CESC patients.
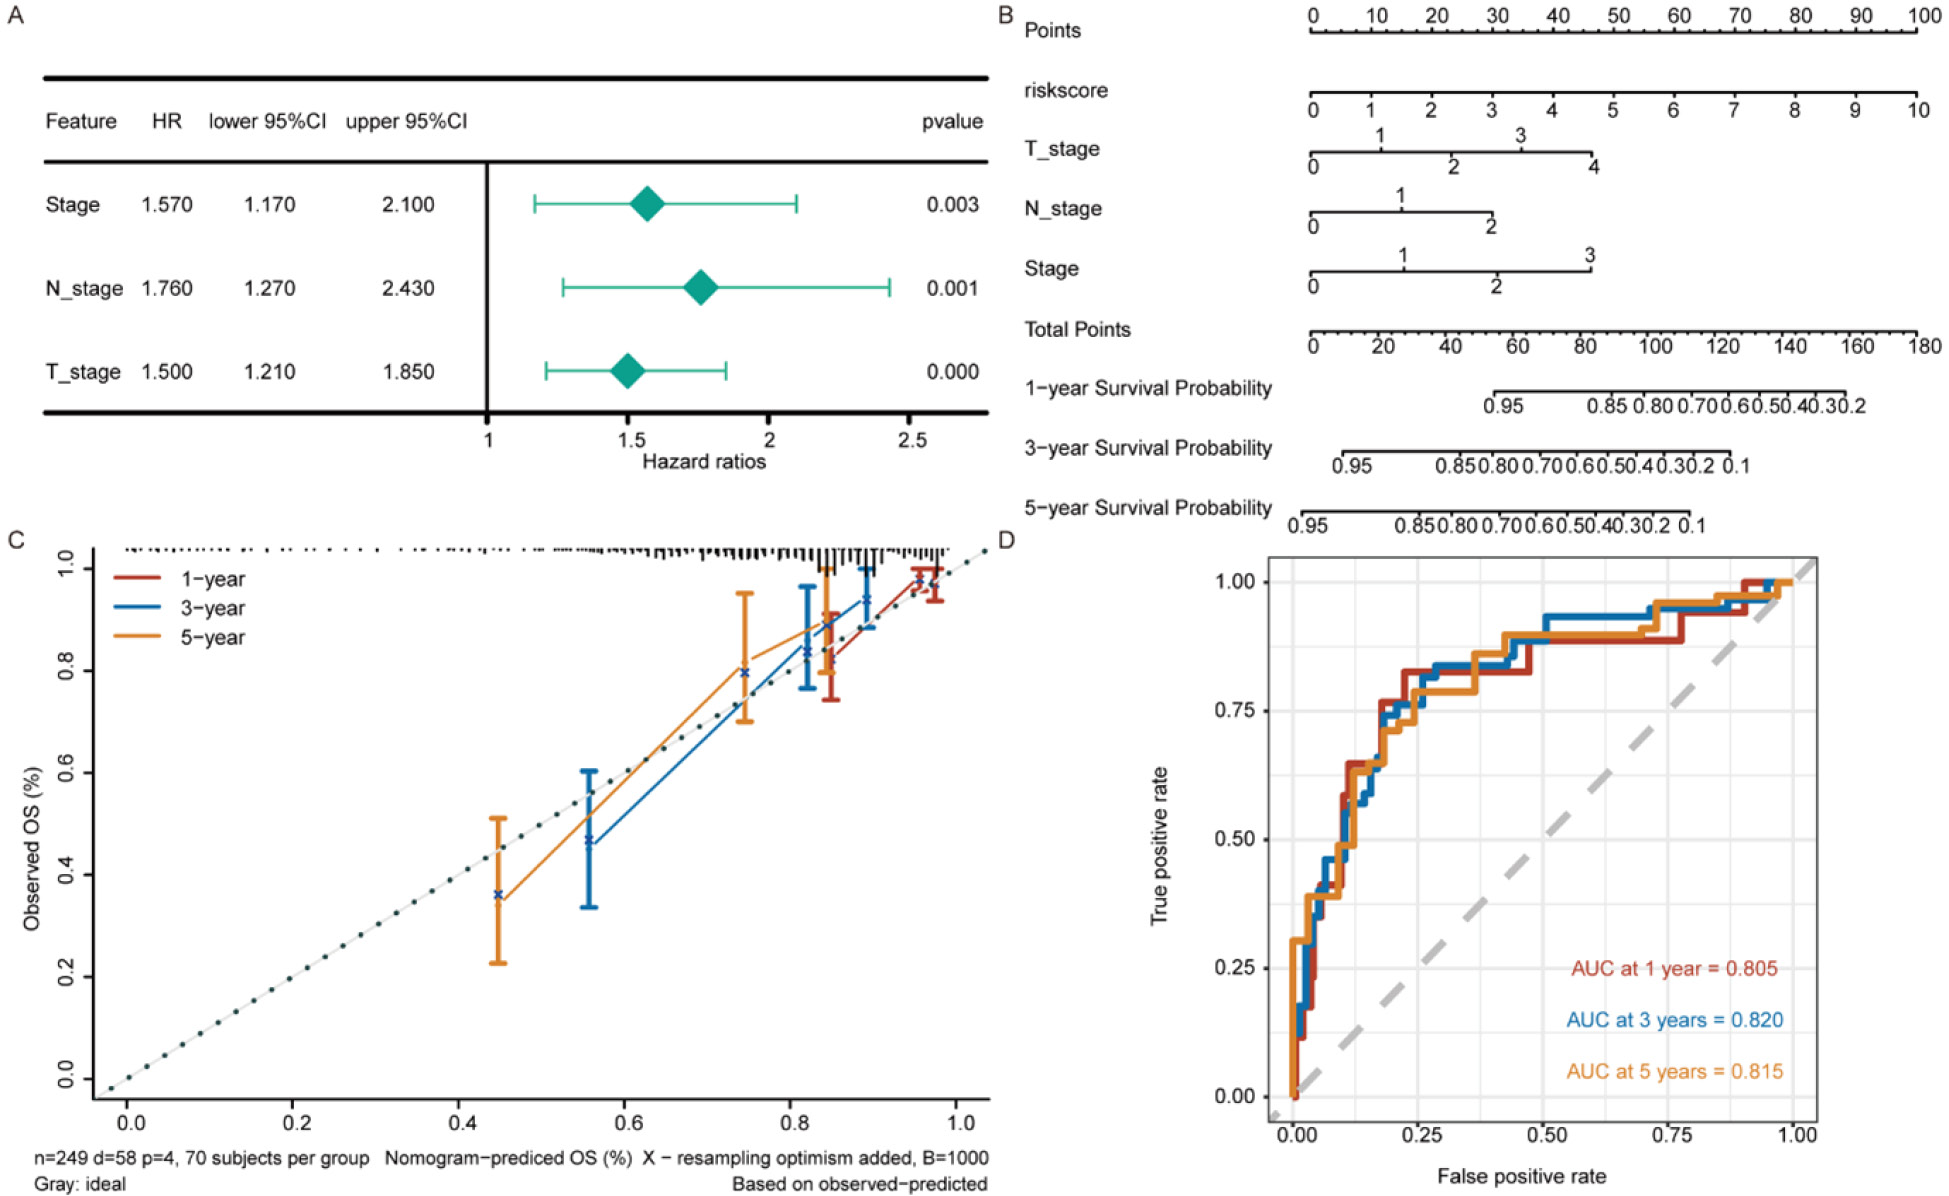
Fig. 4.
Identification of independent prognostic factors and construction of a nomogram in the training cohort. (A) Multivariate Cox regression analysis to identify independent prognostic factors for CESC. (B) Construction of a nomogram integrating the identified independent prognostic factors and risk scores. (C) Calibration curve for the nomogram assessing the accuracy of the model’s predictions. (D) ROC curve for the nomogram, with AUC calculations to evaluate its predictive performance.
.
Identification of independent prognostic factors and construction of a nomogram in the training cohort. (A) Multivariate Cox regression analysis to identify independent prognostic factors for CESC. (B) Construction of a nomogram integrating the identified independent prognostic factors and risk scores. (C) Calibration curve for the nomogram assessing the accuracy of the model’s predictions. (D) ROC curve for the nomogram, with AUC calculations to evaluate its predictive performance.
Enrichment analysis to explore the potential mechanisms of CESC
GSEA revealed that prognostic genes in CESC were significantly enriched in pathways such as "interleukin-6 (IL-6) Janus kinase/signal transducer and activator of transcription (JAK/STAT3) signaling," "inflammatory response," and "glycolysis" (Figs. 5A–5F), highlighting key metabolic, inflammatory, and signaling processes. GSVA showed pathway differences between HRC and LRC: "retinol metabolism" and "estradiol–estrogen receptor (E2 ER) Ras extracellular signal–regulated kinase (ERK) signaling" were activated in HRC, while "HTT to TNF JNK" and "FAS-JNK" pathways were suppressed (Fig. 5G). These findings suggest that patients in the HRC group exhibit enhanced proliferative capacity and survival, accompanied by reduced apoptotic signaling, contributing to higher tumor progression risk and poorer prognosis, informing potential targeted therapies revealing differences in the immune microenvironment of patients with CESC exhibiting different risk levels.
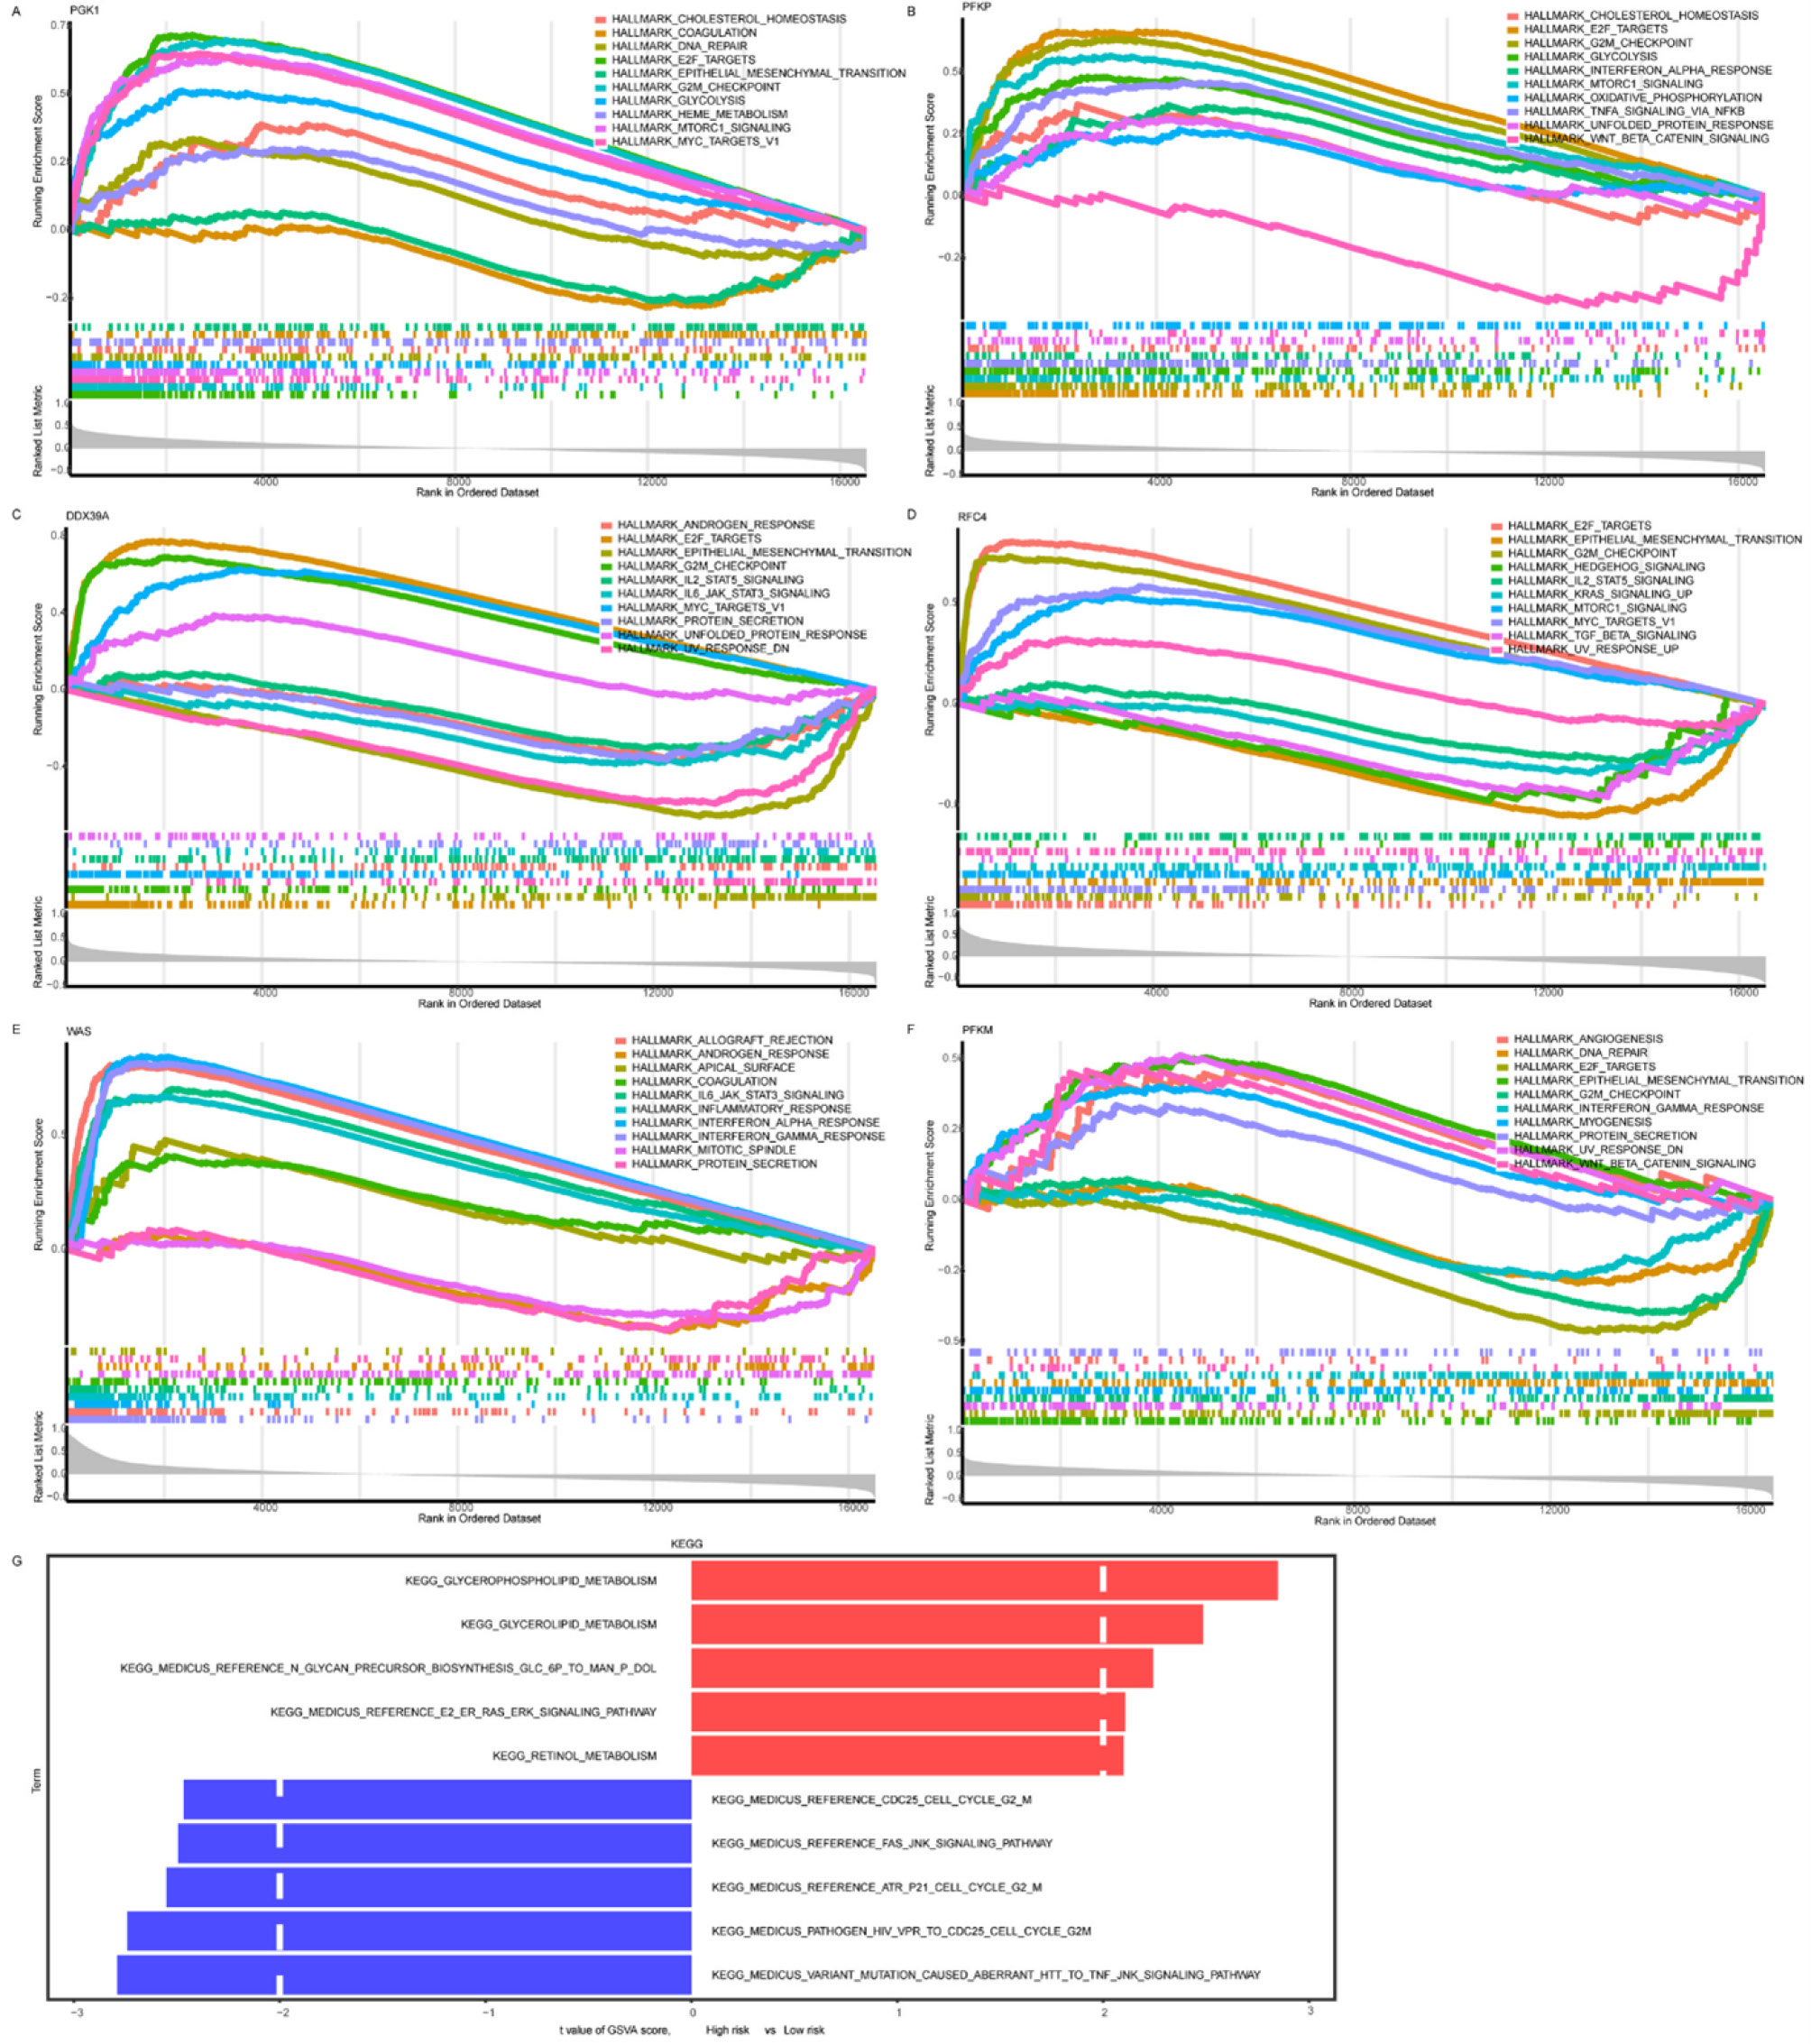
Fig. 5.
Gene Set Enrichment Analysis (GSEA) and Gene Set Variation Analysis (GSVA) in the training cohort. (A-F) GSEA for PGK1 (A), PFKP (B), DDX39A (C), RFC4 (D), WAS (E), and PFKM (F), showing the top 10 most enriched pathways for each gene. (G) GSVA compares HRG and LRG, displaying the top 5 upregulated and downregulated pathways, ranked by absolute t-value.
.
Gene Set Enrichment Analysis (GSEA) and Gene Set Variation Analysis (GSVA) in the training cohort. (A-F) GSEA for PGK1 (A), PFKP (B), DDX39A (C), RFC4 (D), WAS (E), and PFKM (F), showing the top 10 most enriched pathways for each gene. (G) GSVA compares HRG and LRG, displaying the top 5 upregulated and downregulated pathways, ranked by absolute t-value.
Immune infiltration analysis revealed significant differences in the infiltration levels of 12 out of 22 immune cell types between tumor and normal tissues (*P < 0.05) (Figs. 6A and B). In particular, CD8+ T cells, activated memory CD4+ T cells, follicular helper T cells, Tregs, M0 and M1 macrophages, resting and active dendritic cells, and other immune cells were more prevalent in tumor tissues (*P < 0.05). On the other hand, there was less infiltration of naive B cells, resting memory CD4+ T cells, M2 macrophages, and resting mast cells in tumor tissues. According to correlation analysis, CD8+ T cells showed the largest negative association (COR = -0.33) with the risk score, but activated mast cells had the strongest positive correlation (COR = 0.32) (Fig. 6C). These results suggest that activated mast cells may facilitate tumor progression and increase patient risk, whereas CD8+ T cells might exert a tumor-suppressive effect, thereby reducing patient risk.
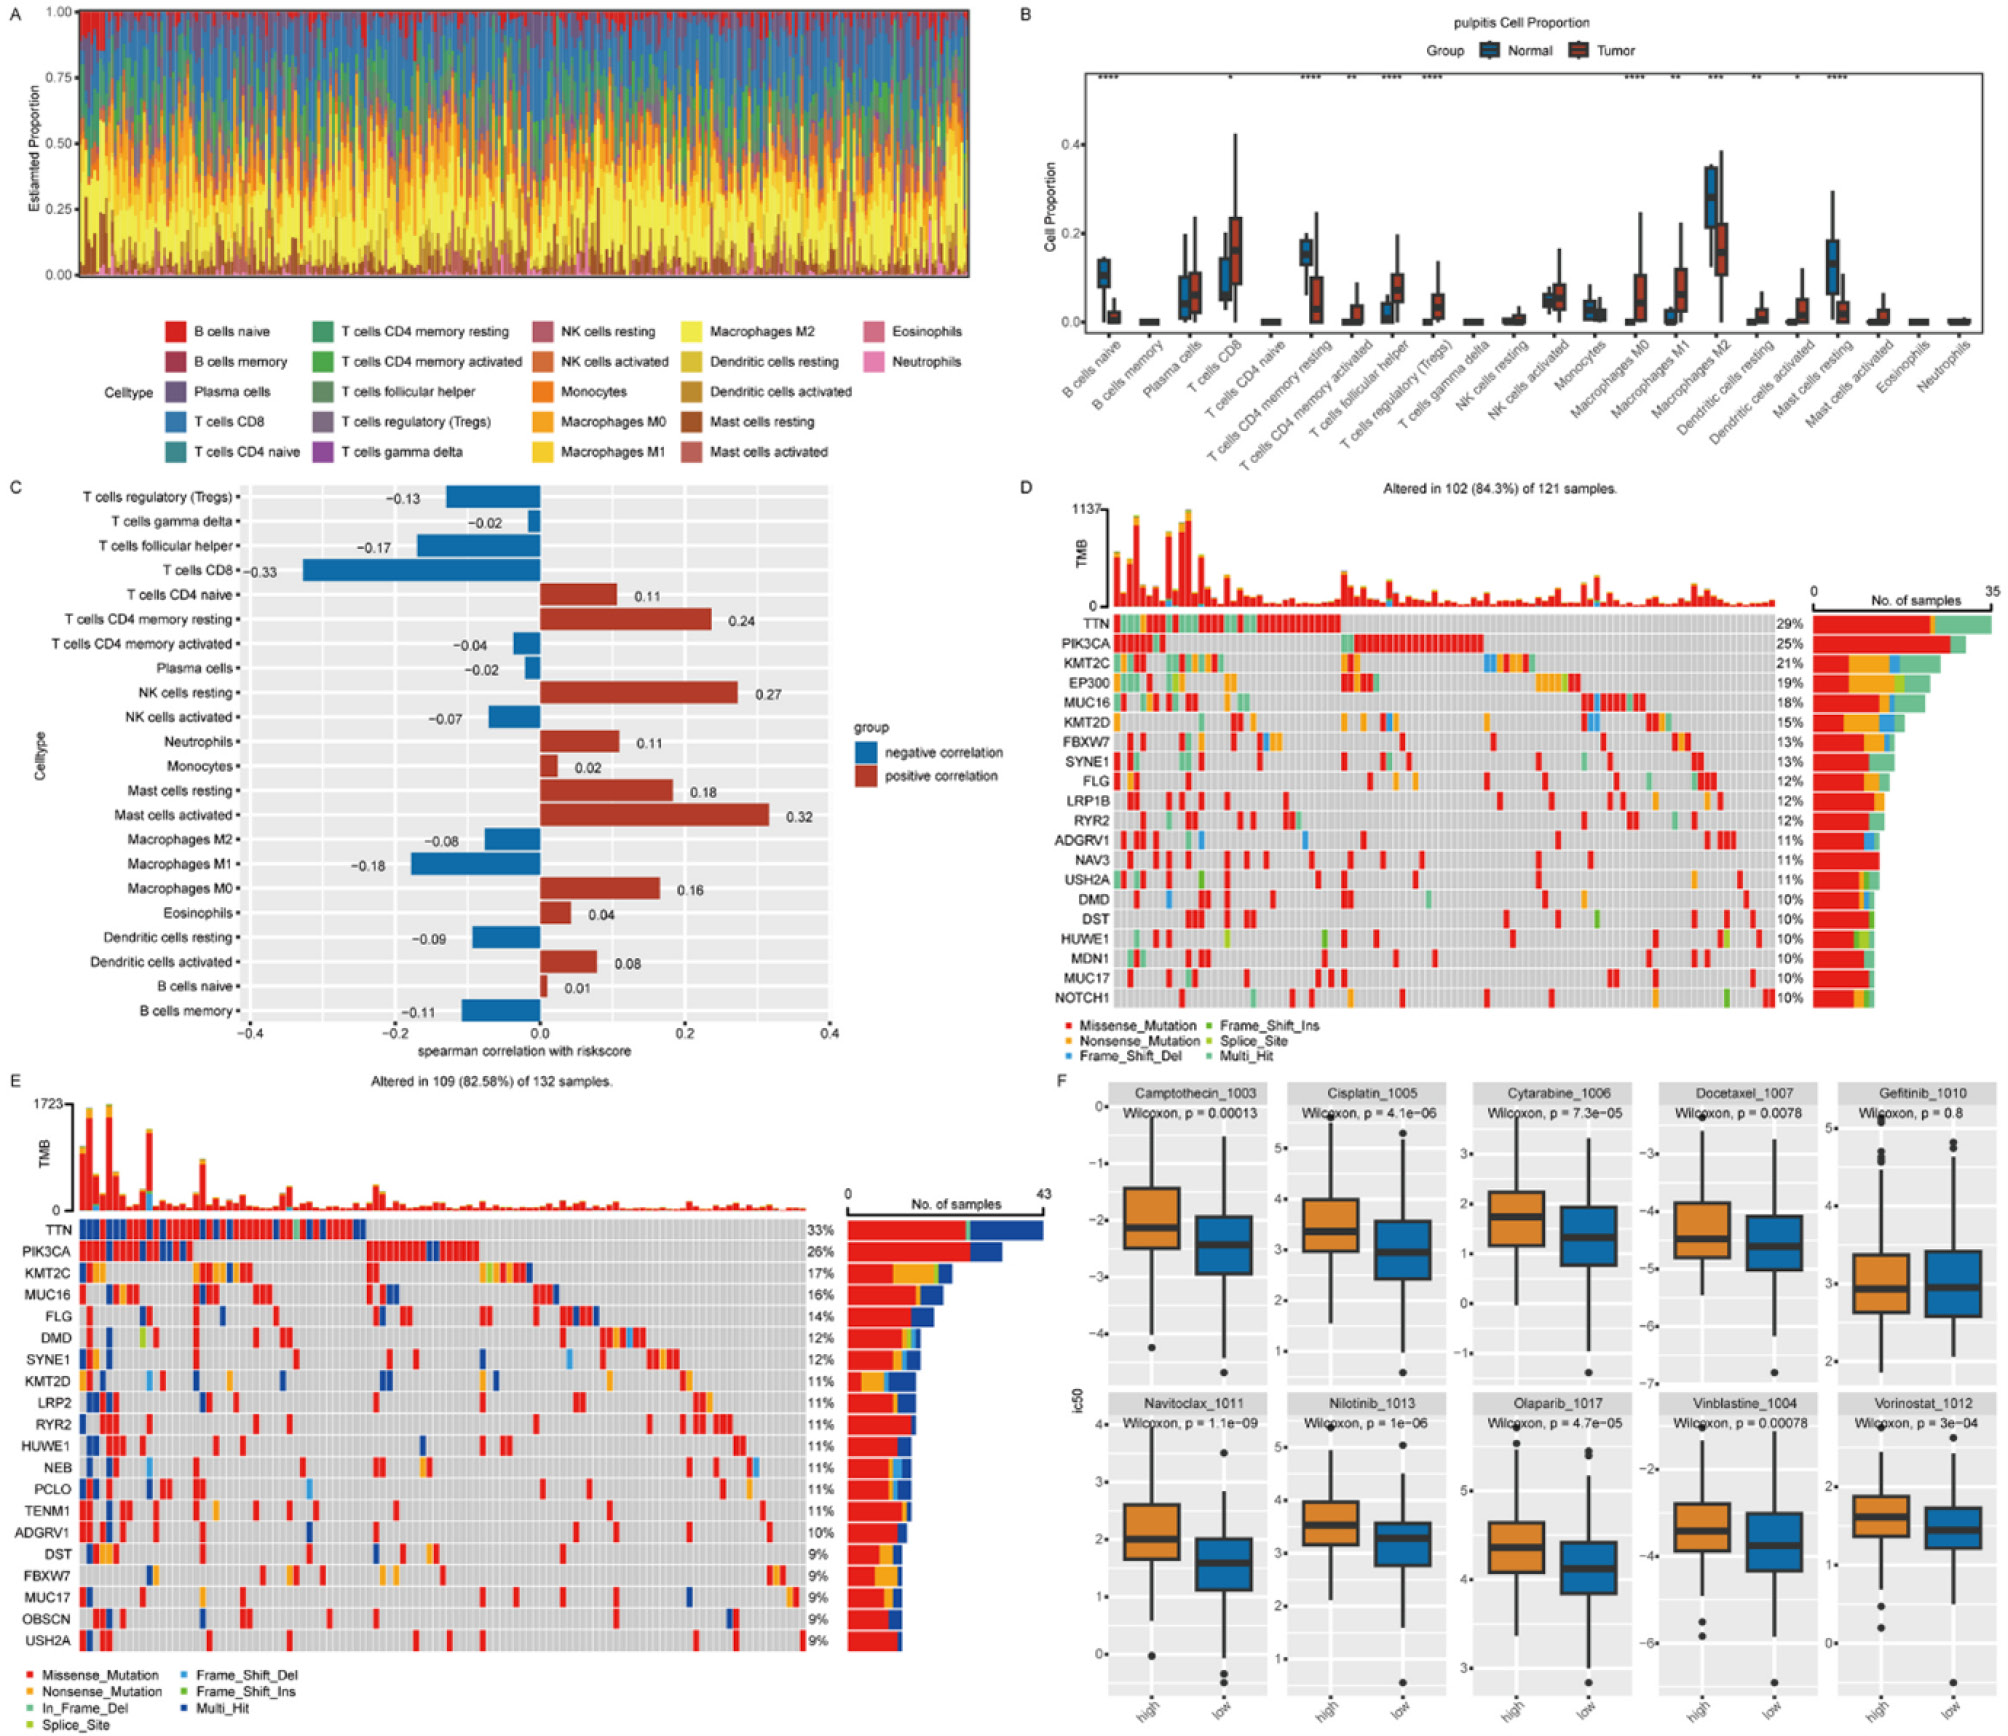
Fig. 6.
Immune infiltration, somatic mutations, and drug sensitivity in the training cohort. (A) Infiltration abundance of 22 immune cell types in CESC and normal tissues. (B) Comparative analysis of the infiltration abundance of 22 immune cell types between CESC and normal tissues. (C) Correlation analysis between the infiltration of 22 immune cell types and the risk score. (D-E) Somatic mutation profiles in HRG (D) and LRG (E). (F) Differences in half-maximal inhibitory concentration (IC50) values of commonly used chemotherapeutic drugs between HRG and LRG (*P < 0.05, **P < 0.01, ***P < 0.001, ****P < 0.0001, ns: P > 0.05).
.
Immune infiltration, somatic mutations, and drug sensitivity in the training cohort. (A) Infiltration abundance of 22 immune cell types in CESC and normal tissues. (B) Comparative analysis of the infiltration abundance of 22 immune cell types between CESC and normal tissues. (C) Correlation analysis between the infiltration of 22 immune cell types and the risk score. (D-E) Somatic mutation profiles in HRG (D) and LRG (E). (F) Differences in half-maximal inhibitory concentration (IC50) values of commonly used chemotherapeutic drugs between HRG and LRG (*P < 0.05, **P < 0.01, ***P < 0.001, ****P < 0.0001, ns: P > 0.05).
The mutational landscape showed missense mutations as the most common type in both HRC and LRC, with TTN being the most frequently mutated gene. Somatic mutations were detected in 84.3% of HRC (102/121) and 82.58% of LRC (109/132) individuals (Figs. 6D–6E), suggesting higher immune evasion and potentially more challenging treatment in high-risk patients. Additionally, differences in the IC50 values of targeted drugs for CESC were analyzed between HRC and LRC. Drugs such as Camptothecin, cisplatin, and cytarabine exhibited significantly higher IC50 values in the HRC group (*P < 0.05) (Fig. 6F), suggesting that patients in this group may display enhanced resistance or poorer responses to these therapies. Therefore, higher drug concentrations may be required to achieve comparable therapeutic outcomes in high-risk patients.
Identification of three cell types in CESC
The GSE168652 dataset was subjected to scRNA-seq analysis in order to explore possible cellular processes in CESC. A dataset of 22,120 cells and 22,405 genes was created after quality control. For additional examination, the top 2,000 most variable genes were chosen. PCA revealed stabilization at 30 PCs, which were selected for further investigation. Ten different cellular groupings were identified by clustering analysis (Fig. 7A). The specificity of marker genes for cell type annotation was highlighted by a bubble plot (Fig. 7B), which ultimately identified three main cell types: macrophages, CD8+ T cells, and epithelial cells (Fig. 7C). Notably, epithelial cells constituted a substantial proportion of the sample, potentially indicating a gradual disruption of normal growth regulation during carcinogenesis and directly implicating these cells in tumor progression and development. CD8+ T cells are critical effector cells in anti-tumor immunity, recognizing and eliminating tumor cells expressing aberrant antigens.46 Despite their tumor-suppressive potential, immunosuppressive mechanisms within the TME can hinder their function, contributing to tumor immune evasion.47 To elucidate the functional changes and developmental trajectories of CD8+ T cells during tumor progression, a pseudo-time analysis was conducted. The developmental trajectory of CD8+ T cells was distinctly segmented into four stages, characterized by two roots and three branching events during mid-development (Fig. 7D), highlighting the specificity of CD8+ T cells and their capacity to follow diverse developmental pathways. Compared to normal conditions, the CESC environment significantly reduced CD8+ T cell populations in the early stages while increasing them in the mid-to-late stages (Fig. 7E), suggesting the presence of immune regulatory mechanisms that may enhance tumor immune evasion during the initial immune response. Moreover, the analysis of prognostic gene expression within CESC showed higher expression levels in the later stages of CD8+ T cell differentiation (Fig. 7F), implying that these genes are essential for the maturation and functional efficacy of CD8+ T cells. This could reflect the cells' adaptation to the TME, ultimately influencing patient prognosis. Finally, cell-cell communication analysis revealed the interactive relationships among the three identified cell types, showing mutual interactions between each pair (Fig. 7G).
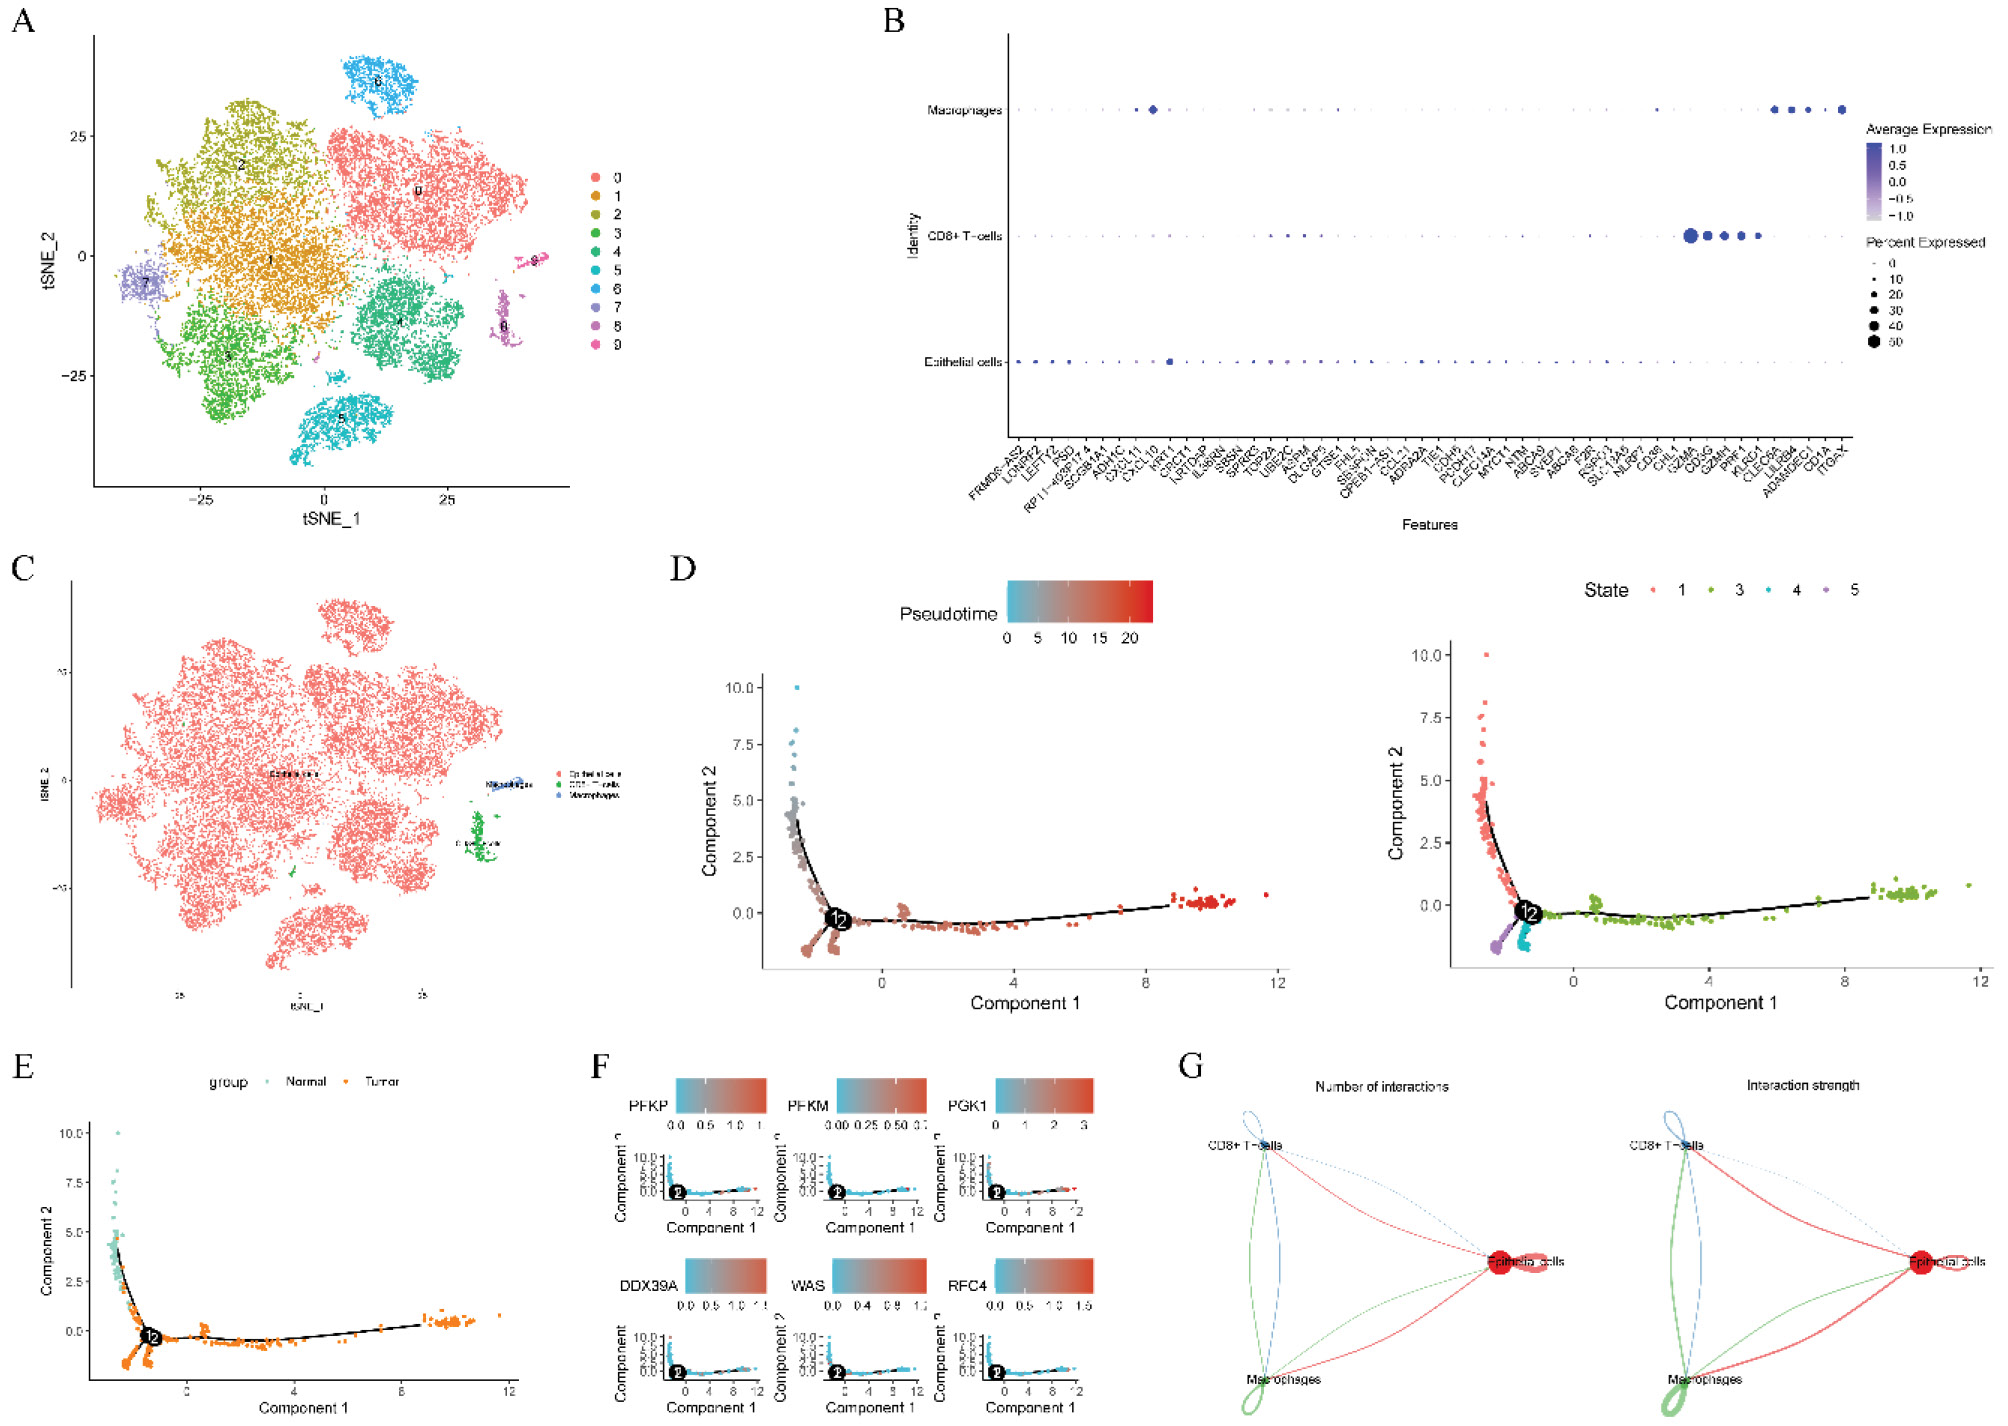
Fig. 7.
Single-cell RNA sequencing (scRNA-seq) analysis of the GSE168652 dataset. (A) t-distributed stochastic neighbor embedding (t-SNE) visualization of 10 cell clusters identified through clustering analysis. (B) Bubble plot illustrating marker genes associated with the annotated cell types. (C) t-SNE visualization highlighting three annotated cell types. (D) Pseudo-time trajectory analysis showing the differentiation pathway of CD8+T cells. (E) Comparison of CD8+T cell trajectories in CESC and normal tissues. (F) Distribution of prognostic gene expression across the developmental trajectory of CD8+T cells. (G) Cellular communication network depicting the number (left) and strength (right) of interactions among annotated cell types.
.
Single-cell RNA sequencing (scRNA-seq) analysis of the GSE168652 dataset. (A) t-distributed stochastic neighbor embedding (t-SNE) visualization of 10 cell clusters identified through clustering analysis. (B) Bubble plot illustrating marker genes associated with the annotated cell types. (C) t-SNE visualization highlighting three annotated cell types. (D) Pseudo-time trajectory analysis showing the differentiation pathway of CD8+T cells. (E) Comparison of CD8+T cell trajectories in CESC and normal tissues. (F) Distribution of prognostic gene expression across the developmental trajectory of CD8+T cells. (G) Cellular communication network depicting the number (left) and strength (right) of interactions among annotated cell types.
PFKP was identified as a risk factor for CESC
MR analysis was performed to assess causal links between prognostic genes and CESC. After filtering, PFKP and PFKM were analyzed, with IVW revealing a significant causal association for PFKP as a risk factor (OR = 1.1028, 95% CI: 1.0335–1.1768, P = 0.0031) (Table 1).
Table 1.
Exploring the causal association between prognostic genes and cervical cancer (CESC) among Mendelian randomization (MR) analysis
|
Outcome
|
Exposure
|
Gene
|
Method
|
SNP
|
P
value
|
OR
|
OR_LCI95
|
OR_UCI95
|
Cervical cancer
(finngen_R11_CD2_INSITU_CERVIX_UTERI_EXALLC) |
eqtl-a-ENSG00000067057 |
PFKP |
MR Egger |
7 |
0.0753 |
1.1194 |
1.0141 |
1.2356 |
| Weighted median |
0.0120 |
1.1073 |
1.0226 |
1.1989 |
| Inverse variance weighted (fixed effects) |
0.0031 |
1.1028 |
1.0335 |
1.1768 |
| Simple mode |
0.9203 |
1.0073 |
0.8788 |
1.1546 |
| Weighted mode |
0.0256 |
1.1062 |
1.0345 |
1.183 |
Cervical cancer
(finngen_R11_CD2_INSITU_CERVIX_UTERI_EXALLC) |
eqtl-a-ENSG00000152556 |
PFKP |
MR Egger |
3 |
0.7931 |
0.8983 |
0.4814 |
1.6763 |
| Weighted median |
0.3111 |
1.1111 |
0.9062 |
1.3624 |
| Inverse variance weighted (fixed effects) |
0.2580 |
1.1203 |
0.9201 |
1.3640 |
| Simple mode |
0.2063 |
1.5264 |
0.9741 |
2.3919 |
| Weighted mode |
0.6722 |
1.0535 |
0.8555 |
1.2974 |
Cervical cancer
(finngen_R11_CD2_INSITU_CERVIX_UTERI_EXALLC) |
eqtl-a-ENSG00000163918 |
RFC4 |
MR Egger |
3 |
0.4410 |
1.1774 |
0.9027 |
1.5358 |
| Weighted median |
0.3260 |
1.0485 |
0.9539 |
1.1525 |
| Inverse variance weighted (fixed effects) |
0.6424 |
1.0390 |
0.8840 |
1.2213 |
| Simple mode |
0.3207 |
1.1716 |
0.9243 |
1.4850 |
| Weighted mode |
0.4434 |
1.0474 |
0.9517 |
1.1526 |
SNP: single nucleotide polymorphism; OR: odds ratio.
Scatter, forest, and funnel plots illustrated a positive correlation of PFKP with CESC risk and confirmed consistency with Mendel’s second law (Figs. 8A–8C). Sensitivity analyses confirmed the MR results' dependability. The robustness of the MR results was demonstrated by the fact that Cochran's Q test showed no heterogeneity in the results (P > 0.05), pleiotropy tests showed no evidence of confounding bias (P > 0.05), and LOO analysis showed only slight changes in the effect on CESC when each SNP was sequentially excluded (Fig. 8D).
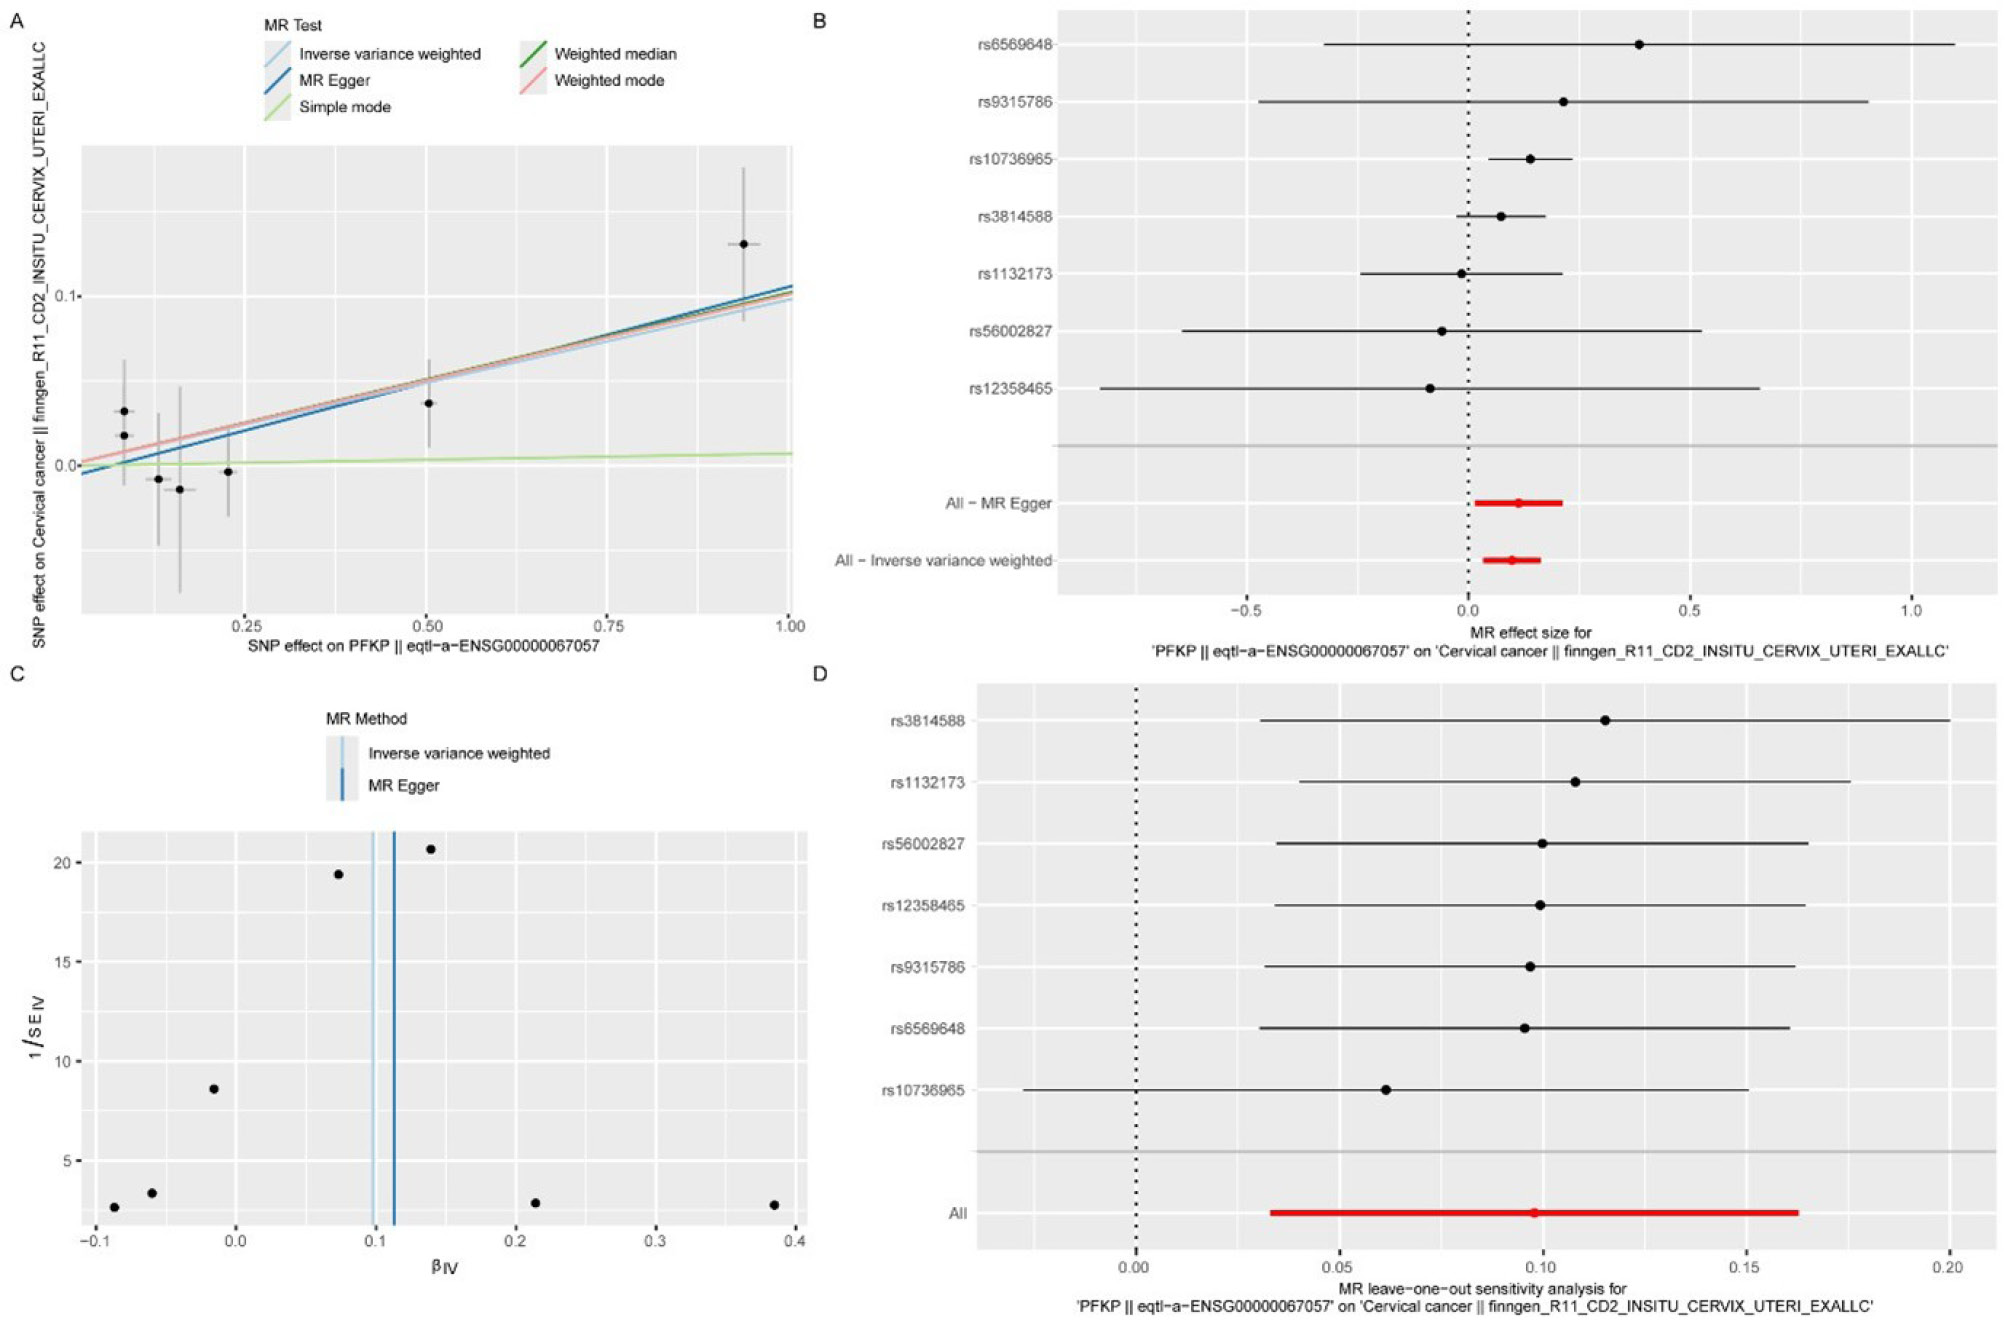
Fig. 8.
Mendelian randomization (MR) analysis of PFKP and CESC. (A) Scatter plot showing a positive correlation between PFKP expression and increased risk of CESC. (B) Forest plot indicating that the effect size of PFKP on CESC consistently remains above zero. (C) Funnel plot confirming adherence to Mendel’s second law, supporting the absence of directional pleiotropy. (D) Leave-One-Out (LOO) analysis showing minimal variation in the impact on CESC when individual single-nucleotide polymorphisms (SNPs) are sequentially excluded.
.
Mendelian randomization (MR) analysis of PFKP and CESC. (A) Scatter plot showing a positive correlation between PFKP expression and increased risk of CESC. (B) Forest plot indicating that the effect size of PFKP on CESC consistently remains above zero. (C) Funnel plot confirming adherence to Mendel’s second law, supporting the absence of directional pleiotropy. (D) Leave-One-Out (LOO) analysis showing minimal variation in the impact on CESC when individual single-nucleotide polymorphisms (SNPs) are sequentially excluded.
Discussion
CESC is a major global health concern and a prevalent female reproductive malignancy, driven by complex genetic and molecular alterations.48 This study focuses on lactylation, a post-translational modification implicated in tumor progression, highlighting the importance of investigating the prognostic role of LRGs in CESC.49
By leveraging transcriptomic and scRNA-seq data, this study systematically explored the prognostic role of LRGs in CESC. Through comprehensive bioinformatics analyses, six LRGs, including PGK1, PFKP, PFKM, DDX39A, RFC4, and WAS, were identified as significant prognostic markers for CESC. PGK1, a critical glycolytic enzyme, has been implicated in promoting cancer cell metabolism and proliferation across various tumor types, including breast and lung cancers.50 Similarly, glycolytic enzymes PFKP and PFKM are well-documented as regulators of cancer cell growth, with their expression levels linked to survival, recurrence, and mortality in patients with CESC.51,52 PGK1 expression has the potential to serve as a prognostic biomarker for CESC, as its upregulation promotes aerobic glycolysis and enhances both migration and invasion of CESC cells.53 Elevated PGK1 levels in CESC cells, as determined by RT-qPCR and corroborated by the human protein atlas (HPA), have been shown to facilitate the conversion of M1 macrophages to M2 macrophages and inhibit necroptosis in CESC cells.54 Recent investigations have also indicated that PFKP mRNA and protein levels are reliable predictors of survival, recurrence, and mortality risk in patients with CESC.55 Furthermore, a study validated that a panel of six glycolytic genes, including PFKP, accurately predicts the prognosis of patients with CESC.56 Notably, Our MR analysis confirmed a significant causal relationship between PFKP expression and CESC, with an odds ratio (OR) exceeding 1, thereby positioning PFKP as a potential risk factor for CESC. WAS, primarily known for its role in immune function and hematopoietic system diseases, influences the differentiation and migration of immune cells by regulating cell adhesion. Studies have shown that neural Wiskott-Aldrich syndrome protein (N-WASP), a member of the WASP family, is markedly upregulated in CESC tissues and cell lines.57 The overexpression of N-WASP enhances the migratory and invasive capabilities of CESC cells, while suppression of N-WASP expression effectively reduces these cellular behaviors.58 Furthermore, N-WASP is likely to promote the invasion and migration of CESC cells by activating the p38 (mitogen-activated protein kinase) MAPK signaling pathway.58 This finding suggests a pivotal role for N-WASP in the progression of CESC, offering potential therapeutic targets for intervention. In the context of DNA replication, RFC4 has been associated with genomic instability and cancer development. A recent study identified RFC4 as a novel diagnostic and prognostic biomarker for CESC, highlighting its expression during cervical malignant transformation.59 Lastly, DDX39A, a helicase involved in RNA metabolism, has been closely linked to the prognosis of liver,60 pancreatic,61 and bladder cancers.62 However, its direct association with CESC prognosis remains underexplored, presenting an opportunity for further investigation. Our findings reveal that PGK1, PFKP, and PFKM are overexpressed in HRC, suggesting their active involvement in disease progression. Conversely, DDX39A, RFC4, and WAS exhibit higher expression in LRC, potentially reflecting their roles in protective mechanisms or more favorable disease outcomes. In summary, this study not only validates the prognostic value of these LRGs in CESC but also provides new insights into their underlying biological mechanisms. The observed differential expression patterns of these genes between HRC and LRC patients underscore their clinical relevance and could inform future therapeutic strategies tailored to individual patient risk profiles.
The development of risk models is critical for early risk assessment and personalized treatment strategies in patients with CESC. Utilizing a panel of six prognostic genes, a risk model that demonstrated strong predictive power was constructed. In the training cohort, the model achieved AUC values of 0.70, 0.75, and 0.76 at 1, 3, and 5 years, respectively, indicating its robustness in assessing patient risk. To further evaluate the model’s performance, a comparative analysis was conducted with previous studies on CESC prognosis. For instance, a model based on four ferroptosis-related genes reported AUC values of 0.737, 0.734, and 0.706 at 1, 3, and 5 years, respectively.63 Another study, using a model based on 12 heat shock protein-related genes, achieved AUC values of 0.79, 0.73, and 0.77 for the same time points.64 These findings highlight the prognostic potential of our selected LRG markers in CESC. Furthermore, our study identified stage, nodal involvement (N stage), and tumor size (T stage) as critical independent prognostic factors for CESC. Notably, these prognostic factors remained significant even after adjusting for other potential confounding variables, underscoring their robustness and pivotal role in determining survival outcomes. Specifically, advanced disease stage, increased regional lymph node involvement, and larger primary tumor size were all significantly associated with poorer survival rates.65 To leverage these insights, stage, N stage, T stage, and the derived risk score were integrated into a comprehensive nomogram. This tool demonstrated enhanced predictive accuracy, with AUC values of 0.805, 0.820, and 0.815 at 1, 3, and 5 years, respectively, reflecting superior prognostic capabilities compared to the risk model alone. The incorporation of these clinical variables into our risk model has not only improved its precision but also facilitated a more nuanced assessment of each patient’s risk profile. This, in turn, enables clinicians to tailor therapeutic approaches more effectively—employing more aggressive treatments for high-risk patients to potentially improve survival outcomes, while lower-risk patients may benefit from less intensive interventions.
In enrichment analysis, GSEA and GSVA have highlighted important biological pathways in cancer progression, particularly "IL-6 JAK STAT3 signaling," "inflammatory response," and "glycolysis," which are crucial for tumor biology.66 This pathway has been well-established in its association with tumor progression and metabolic reprogramming in cancer cells, potentially involving lactylation as a modulating factor.67 The inflammatory response pathway is directly implicated in tumorigenesis, where inflammation-associated genes may drive progression and influence the TME of CESC. This includes potential impacts on lactic acidification-related pathways, emphasizing the interconnectedness of inflammation and cellular metabolic responses.68 Glycolysis, a central metabolic process for cellular energy production, is especially relevant under the pressures of tumor growth. The post-translational modification lactylation, often observed in cancer cells—particularly under hypoxic conditions or altered glucose metabolism—suggests a significant interplay between glycolysis and regulatory mechanisms influenced by or affecting lactylation.69 GSVA results further highlighted marked differences in pathway activation between HRC and LRC. Pathways such as "retinol metabolism" and "E2 ER Ras Erk signaling" were notably activated in HRC. The E2 ER Ras Erk signaling pathway, related to ER activation, involves a series of downstream signaling events, potentially involving Ras and ERK, which may drive cancer progression and worsen the prognosis in high-risk patients.70 Retinol metabolism, which impacts cell proliferation and differentiation, further contributes to the aggressive nature of cancer in HRC.71 However, in HRC, pathways that are essential for cellular response and apoptosis, like "variant mutation-caused aberrant HTT to TNF JNK signaling" and "FAS-JNK signaling," were inhibited. By avoiding regular apoptotic processes, this suppression probably promotes tumor survival by increasing tumor cell growth and resistance to cell death.72 These findings classify HRC patients as high-risk and suggest that targeted therapies aimed at these pathways may inhibit tumor growth and promote apoptosis. Notable immune cell infiltration was observed in tumor tissues, with elevated levels of CD8+ T cells, activated memory CD4+ T cells, follicular helper T cells, Tregs, M0 and M1 macrophages, and both resting and activated dendritic cells.73 This diverse infiltration pattern suggests an active attempt by the immune system to mount an antitumor response. Among these immune cells, CD8+ T cells, recognized as key effector cells capable of directly targeting and eliminating tumor cells,74 exhibited a marked negative correlation with the risk score, indicating that higher infiltration of CD8+ T cells is associated with reduced tumor risk and improved prognosis. In contrast, the concurrent increase in Tregs and M0 macrophages—both of which possess immunosuppressive properties indicates a tumor-driven strategy to evade immune clearance.75,76 The immunosuppressive functions of Tregs lead to weak immune responses and faster tumor growth in many cancers. Fewer naive B cells and other immune cells may allow tumors to grow unchecked.77 Correlation analysis of immune infiltration further clarifies the TME, revealing a strong positive correlation between activated mast cells and the risk score. This finding aligns with previous studies suggesting that while activated mast cells contribute to immune responses, they may also promote inflammation and tumor angiogenesis and foster tumor growth and metastasis within the TME.78 Tumors can establish an immunosuppressive microenvironment while simultaneously activating certain immune cells, thereby suggesting potential targets for improving immunotherapy. Given the critical role of CD8+ T cells in antitumor immunity, future research should focus on strategies to augment their infiltration and activity within the TME, potentially improving clinical outcomes for patients with CESC.
In scRNA-seq analysis, three distinct cell types were annotated: epithelial cells, CD8+ T cells, and macrophages, each playing a pivotal role in the context of CESC. Epithelial cells, as the primary cellular component of cervical tissue, are directly involved in the initiation and progression of CESC. Genetic and epigenetic alterations in these cells drive dysregulated proliferation and differentiation, key hallmarks of oncogenesis.79 In addition to being the origin of tumorigenesis, epithelial cells significantly influence the tumor immune microenvironment through the expression of surface molecules and the secretion of cytokines. These activities modulate immune responses, thereby affecting tumor growth and metastatic potential.80 CD8+ T cells, as essential effectors of the adaptive immune system, target CESC by recognizing and responding to tumor-specific antigens presented on cancer cells.81 Upon activation, these cells differentiate into effector T cells, which are capable of eliminating tumor cells through cytotoxic molecules. This process is critical for limiting tumor expansion and preventing metastasis. Additionally, CD8+ T cells orchestrate a broader antitumor immune response by secreting cytokines that activate other immune cells, such as macrophages, thereby amplifying their antitumor effects. Macrophages, another critical cell type identified in this study, exhibit either pro-inflammatory, antitumor (M1) or anti-inflammatory, protumor (M2) phenotypes.49 The dynamic interplay between these macrophage phenotypes plays a key role in either promoting or suppressing CESC progression. Pseudo-time trajectory analysis of CD8+ T cells revealed a critical differentiation pathway from naïve to effector and subsequently to memory T cells. This differentiation process is essential for a robust antitumor response, where effector CD8+ T cells directly participate in tumor eradication, and memory T cells provide long-term surveillance to prevent recurrence.82 The presence and activity of CD8+ T cells within the TME have been shown to correlate with better prognosis and lower tumor risk, emphasizing their central role in controlling CESC progression.
This study identified six LRGs as key prognostic markers and constructed a predictive model that demonstrated robust performance. Through MR analysis, PFKP was established as a risk factor for CESC. Further investigation illuminated the critical role of the immune microenvironment, particularly highlighting the influence of CD8+ T cells in shaping tumor immunity. scRNA-seq analysis revealed intricate cellular heterogeneity and detailed the differentiation trajectories of CD8+ T cells, enhancing our understanding of their role in combating cancer. Despite these insights, the study is limited by its relatively small sample size, which may affect the generalizability of the findings. Future research should focus on validating these prognostic markers in more diverse populations and further exploring the mechanistic roles of LRGs and CD8+ T cells in CESC. Furthermore, the retrospective nature of this study and the lack of in vitro or in vivo validation of the lactylation mechanism represent additional limitations that should be addressed in future work.
Conclusion
In summary, this study identifies lactylation-related genes, particularly PFKP, as promising prognostic biomarkers in cervical cancer. The robust risk model highlights CD8+ T cell dynamics as key to tumor progression, revealing their differentiation-linked abundance changes in the microenvironment. These findings provide new insights into lactylation-mediated immune-metabolic regulation and potential therapeutic targets for CESC.
Research Highlights
What is the current knowledge?
-
Lactylation is a post-translational modification that modulates tumor metabolism and gene expression; its role in cervical squamous cell carcinoma (CESC) remains unclear.
-
Six lactylation-related genes (PGK1, PFKP, DDX39A, RFC4, WAS, PFKM) are prognostic for CESC, with PFKP as a risk factor.
-
The prognostic model is strongly predictive, and CD8 + T cells are central to CESC progression.
What is new here?
-
The study links lactylation-related genes to prognosis in CESC by integrating bulk transcriptomics and single-cell data, identifying six prognostic genes with PFKP as a risk factor and a strong predictive model.
-
It also connects CD8 + T cell dynamics and immune infiltration to lactylation, suggesting therapeutic targets and improved risk stratification.
Competing Interests
The author declares that no conflict of interest.
Data Availability Statement
The datasets used in this study can be downloaded from The Cancer Genome Atlas (TCGA) database (http://cancergenome.nih.gov/), the Genotype-Tissue Expression Project (GTEx) database (https://www.genome.gov/Funded-Programs-Projects/Genotype-Tissue-Expression-Project), and the Gene Expression Omnibus (GEO) database (https://www.ncbi.nlm.nih.gov/gds).
Declaration of AI-assisted Tools in the Writing Procedure
The authors declare that no AI-assisted tools were used in the writing, drafting, or editing of this manuscript.
Ethical Approval
Not applicable.
References
- Xia WT, Qiu WR, Yu WK, Xu ZC, Zhang SH. Identifying TME signatures for cervical cancer prognosis based on GEO and TCGA databases. Heliyon 2023; 9:e15096. doi: 10.1016/j.heliyon.2023.e15096 [Crossref] [ Google Scholar]
- Jiang P, Yuan Z, Wei L, Zhao F, Yuan X, Song Y. Treatment consensus for locally advanced cervical cancer. Adv RadiotherNucl Med 2025; 3:17-27. doi: 10.36922/arnm.4032 [Crossref] [ Google Scholar]
- Zhou K, Chen J, Zhao J, An X, Yin Y, Li Z. Dosimetric differences between online adapt-to-position and offline adapt-to-shape plans for adaptive radiotherapy in cervical cancer. Adv RadiotherNucl Med 2024; 2:4919. doi: 10.36922/arnm.4919 [Crossref] [ Google Scholar]
- Chen AN, Luo Y, Yang YH, Fu JT, Geng XM, Shi JP. Lactylation, a novel metabolic reprogramming code: current status and prospects. Front Immunol 2021; 12:688910. doi: 10.3389/fimmu.2021.688910 [Crossref] [ Google Scholar]
- Wang T, Ye Z, Li Z, Jing DS, Fan GX, Liu MQ. Lactate-induced protein lactylation: a bridge between epigenetics and metabolic reprogramming in cancer. Cell Prolif 2023; 56:e13478. doi: 10.1111/cpr.13478 [Crossref] [ Google Scholar]
- Jedlička M, Feglarová T, Janstová L, Hortová-Kohoutková M, Frič J. Lactate from the tumor microenvironment - a key obstacle in NK cell-based immunotherapies. Front Immunol 2022; 13:932055. doi: 10.3389/fimmu.2022.932055 [Crossref] [ Google Scholar]
- Hu Y, He Z, Li Z, Wang Y, Wu N, Sun H. Lactylation: the novel histone modification influence on gene expression, protein function, and disease. Clin Epigenetics 2024; 16:72. doi: 10.1186/s13148-024-01682-2 [Crossref] [ Google Scholar]
- Meng Q, Zhang Y, Sun H, Yang X, Hao S, Liu B. Human papillomavirus-16 E6 activates the pentose phosphate pathway to promote cervical cancer cell proliferation by inhibiting G6PD lactylation. Redox Biol 2024; 71:103108. doi: 10.1016/j.redox.2024.103108 [Crossref] [ Google Scholar]
- Meng Q, Sun H, Zhang Y, Yang X, Hao S, Liu B. Lactylation stabilizes DCBLD1 activating the pentose phosphate pathway to promote cervical cancer progression. J Exp Clin Cancer Res 2024; 43:36. doi: 10.1186/s13046-024-02943-x [Crossref] [ Google Scholar]
- de la Cruz-López KG, Castro-Muñoz LJ, Reyes-Hernández DO, García-Carrancá A, Manzo-Merino J. Lactate in the regulation of tumor microenvironment and therapeutic approaches. Front Oncol 2019; 9:1143. doi: 10.3389/fonc.2019.01143 [Crossref] [ Google Scholar]
- Yang Z, Yan C, Ma J, Peng P, Ren X, Cai S. Lactylome analysis suggests lactylation-dependent mechanisms of metabolic adaptation in hepatocellular carcinoma. Nat Metab 2023; 5:61-79. doi: 10.1038/s42255-022-00710-w [Crossref] [ Google Scholar]
- Pandkar MR, Sinha S, Samaiya A, Shukla S. Oncometabolite lactate enhances breast cancer progression by orchestrating histone lactylation-dependent c-Myc expression. Transl Oncol 2023; 37:101758. doi: 10.1016/j.tranon.2023.101758 [Crossref] [ Google Scholar]
- Cheng Z, Huang H, Li M, Liang X, Tan Y, Chen Y. Lactylation-related gene signature effectively predicts prognosis and treatment responsiveness in hepatocellular carcinoma. Pharmaceuticals (Basel) 2023; 16:644. doi: 10.3390/ph16050644 [Crossref] [ Google Scholar]
- Xu J, Cui L, Zhuang J, Meng Y, Bing P, He B. Evaluating the performance of dropout imputation and clustering methods for single-cell RNA sequencing data. Comput Biol Med 2022; 146:105697. doi: 10.1016/j.compbiomed.2022.105697 [Crossref] [ Google Scholar]
- Love MI, Huber W, Anders S. Moderated estimation of fold change and dispersion for RNA-seq data with DESeq2. Genome Biol 2014; 15:550. doi: 10.1186/s13059-014-0550-8 [Crossref] [ Google Scholar]
- Zhu M, Li C, Lv K, Guo H, Hou R, Tian G. MLSpatial: a machine-learning method to reconstruct the spatial distribution of cells from scRNA-seq by extracting spatial features. Comput Biol Med 2023; 159:106873. doi: 10.1016/j.compbiomed.2023.106873 [Crossref] [ Google Scholar]
- Gustavsson EK, Zhang D, Reynolds RH, Garcia-Ruiz S, Ryten M. ggtranscript: an R package for the visualization and interpretation of transcript isoforms using ggplot2. Bioinformatics 2022; 38:3844-6. doi: 10.1093/bioinformatics/btac409 [Crossref] [ Google Scholar]
- Gu Z, Hübschmann D. Make interactive complex heatmaps in R. Bioinformatics 2022; 38:1460-2. doi: 10.1093/bioinformatics/btab806 [Crossref] [ Google Scholar]
- Chen H, Boutros PC. VennDiagram: a package for the generation of highly-customizable Venn and Euler diagrams in R. BMC Bioinformatics 2011; 12:35. doi: 10.1186/1471-2105-12-35 [Crossref] [ Google Scholar]
- Yu G, Wang LG, Han Y, He QY. clusterProfiler: an R package for comparing biological themes among gene clusters. OMICS 2012; 16:284-7. doi: 10.1089/omi.2011.0118 [Crossref] [ Google Scholar]
- Cheng Q, Chen X, Wu H, Du Y. Three hematologic/immune system-specific expressed genes are considered as the potential biomarkers for the diagnosis of early rheumatoid arthritis through bioinformatics analysis. J Transl Med 2021; 19:18. doi: 10.1186/s12967-020-02689-y [Crossref] [ Google Scholar]
- Liu P, Xu H, Shi Y, Deng L, Chen X. Potential molecular mechanisms of plantain in the treatment of gout and hyperuricemia based on network pharmacology. Evid Based Complement Alternat Med 2020; 2020:3023127. doi: 10.1155/2020/3023127 [Crossref] [ Google Scholar]
- Zhou J, Li H, Wu B, Zhu L, Huang Q, Guo Z. Network pharmacology combined with experimental verification to explore the potential mechanism of naringenin in the treatment of cervical cancer. Sci Rep 2024; 14:1860. doi: 10.1038/s41598-024-52413-9 [Crossref] [ Google Scholar]
- Lei J, Qu T, Cha L, Tian L, Qiu F, Guo W. Clinicopathological characteristics of pheochromocytoma/paraganglioma and screening of prognostic markers. J Surg Oncol 2023; 128:510-8. doi: 10.1002/jso.27358 [Crossref] [ Google Scholar]
- Li Y, Lu F, Yin Y. Applying logistic LASSO regression for the diagnosis of atypical Crohn's disease. Sci Rep 2022; 12:11340. doi: 10.1038/s41598-022-15609-5 [Crossref] [ Google Scholar]
- Ramsay IS, Ma S, Fisher M, Loewy RL, Ragland JD, Niendam T. Model selection and prediction of outcomes in recent onset schizophrenia patients who undergo cognitive training. Schizophr Res Cogn 2018; 11:1-5. doi: 10.1016/j.scog.2017.10.001 [Crossref] [ Google Scholar]
- Heagerty PJ, Lumley T, Pepe MS. Time-dependent ROC curves for censored survival data and a diagnostic marker. Biometrics 2000; 56:337-44. doi: 10.1111/j.0006-341x.2000.00337.x [Crossref] [ Google Scholar]
- Sachs MC. plotROC: a tool for plotting ROC curves. J Stat Softw 2017; 79:1-19. doi: 10.18637/jss.v079.c02 [Crossref] [ Google Scholar]
- Hänzelmann S, Castelo R, Guinney J. GSVA: gene set variation analysis for microarray and RNA-seq data. BMC Bioinformatics 2013; 14:7. doi: 10.1186/1471-2105-14-7 [Crossref] [ Google Scholar]
- Ritchie ME, Phipson B, Wu D, Hu Y, Law CW, Shi W. limma powers differential expression analyses for RNA-sequencing and microarray studies. Nucleic Acids Res 2015; 43:e47. doi: 10.1093/nar/gkv007 [Crossref] [ Google Scholar]
- Newman AM, Liu CL, Green MR, Gentles AJ, Feng W, Xu Y. Robust enumeration of cell subsets from tissue expression profiles. Nat Methods 2015; 12:453-7. doi: 10.1038/nmeth.3337 [Crossref] [ Google Scholar]
- Chen B, Khodadoust MS, Liu CL, Newman AM, Alizadeh AA. Profiling tumor infiltrating immune cells with CIBERSORT. Methods Mol Biol 2018; 1711:243-59. doi: 10.1007/978-1-4939-7493-1_12 [Crossref] [ Google Scholar]
- Mayakonda A, Lin DC, Assenov Y, Plass C, Koeffler HP. Maftools: efficient and comprehensive analysis of somatic variants in cancer. Genome Res 2018; 28:1747-56. doi: 10.1101/gr.239244.118 [Crossref] [ Google Scholar]
- Maeser D, Gruener RF, Huang RS. oncoPredict: an R package for predicting in vivo or cancer patient drug response and biomarkers from cell line screening data. Brief Bioinform 2021; 22:bbab260. doi: 10.1093/bib/bbab260 [Crossref] [ Google Scholar]
- Satija R, Farrell JA, Gennert D, Schier AF, Regev A. Spatial reconstruction of single-cell gene expression data. Nat Biotechnol 2015; 33:495-502. doi: 10.1038/nbt.3192 [Crossref] [ Google Scholar]
- Du J, Yuan X, Deng H, Huang R, Liu B, Xiong T. Single-cell and spatial heterogeneity landscapes of mature epicardial cells. J Pharm Anal 2023; 13:894-907. doi: 10.1016/j.jpha.2023.07.011 [Crossref] [ Google Scholar]
- Jin S, Guerrero-Juarez CF, Zhang L, Chang I, Ramos R, Kuan CH. Inference and analysis of cell-cell communication using CellChat. Nat Commun 2021; 12:1088. doi: 10.1038/s41467-021-21246-9 [Crossref] [ Google Scholar]
- Hemani G, Zheng J, Elsworth B, Wade KH, Haberland V, Baird D. The MR-Base platform supports systematic causal inference across the human phenome. Elife 2018; 7:e34408. doi: 10.7554/eLife.34408 [Crossref] [ Google Scholar]
- Davey Smith G, Hemani G. Mendelian randomization: genetic anchors for causal inference in epidemiological studies. Hum Mol Genet 2014; 23:R89-98. doi: 10.1093/hmg/ddu328 [Crossref] [ Google Scholar]
- Bowden J, Davey Smith G, Haycock PC, Burgess S. Consistent estimation in Mendelian randomization with some invalid instruments using a weighted median estimator. Genet Epidemiol 2016; 40:304-14. doi: 10.1002/gepi.21965 [Crossref] [ Google Scholar]
- Burgess S, Scott RA, Timpson NJ, Davey Smith G, Thompson SG. Using published data in Mendelian randomization: a blueprint for efficient identification of causal risk factors. Eur J Epidemiol 2015; 30:543-52. doi: 10.1007/s10654-015-0011-z [Crossref] [ Google Scholar]
- Hartwig FP, Davey Smith G, Bowden J. Robust inference in summary data Mendelian randomization via the zero modal pleiotropy assumption. Int J Epidemiol 2017; 46:1985-98. doi: 10.1093/ije/dyx102 [Crossref] [ Google Scholar]
- Qin Q, Zhao L, Ren A, Li W, Ma R, Peng Q. Systemic lupus erythematosus is causally associated with hypothyroidism, but not hyperthyroidism: a Mendelian randomization study. Front Immunol 2023; 14:1125415. doi: 10.3389/fimmu.2023.1125415 [Crossref] [ Google Scholar]
- Bowden J, Davey Smith G, Burgess S. Mendelian randomization with invalid instruments: effect estimation and bias detection through Egger regression. Int J Epidemiol 2015; 44:512-25. doi: 10.1093/ije/dyv080 [Crossref] [ Google Scholar]
- Cui Z, Feng H, He B, He J, Tian Y. Relationship between serum amino acid levels and bone mineral density: a Mendelian randomization study. Front Endocrinol (Lausanne) 2021; 12:763538. doi: 10.3389/fendo.2021.763538 [Crossref] [ Google Scholar]
- Wu Z, Zheng Y, Sheng J, Han Y, Yang Y, Pan H. CD3 + CD4- CD8- (double-negative) T cells in inflammation, immune disorders and cancer. Front Immunol 2022; 13:816005. doi: 10.3389/fimmu.2022.816005 [Crossref] [ Google Scholar]
- Dolina JS, Van Braeckel-Budimir N, Thomas GD, Salek-Ardakani S. CD8 + T cell exhaustion in cancer. Front Immunol 2021; 12:715234. doi: 10.3389/fimmu.2021.715234 [Crossref] [ Google Scholar]
- Zhou J, Guo Z, Peng X, Wu B, Meng Q, Lu X. Chrysotoxine regulates ferroptosis and the PI3K/AKT/mTOR pathway to prevent cervical cancer. J Ethnopharmacol 2025; 338:119126. doi: 10.1016/j.jep.2024.119126 [Crossref] [ Google Scholar]
- Stone SC, Rossetti RA, Alvarez KL, Carvalho JP, Margarido PF, Baracat EC. Lactate secreted by cervical cancer cells modulates macrophage phenotype. J Leukoc Biol 2019; 105:1041-54. doi: 10.1002/jlb.3a0718-274rr [Crossref] [ Google Scholar]
- Li X, Jiang Y, Meisenhelder J, Yang W, Hawke DH, Zheng Y. Mitochondria-translocated PGK1 functions as a protein kinase to coordinate glycolysis and the TCA cycle in tumorigenesis. Mol Cell 2016; 61:705-19. doi: 10.1016/j.molcel.2016.02.009 [Crossref] [ Google Scholar]
- Chen C, Zhang X. Glycolysis regulator PFKP induces human melanoma cell proliferation and tumor growth. Clin Transl Oncol 2023; 25:2183-91. doi: 10.1007/s12094-023-03096-7 [Crossref] [ Google Scholar]
- Zhou M, Sun X, Wang C, Wang F, Fang C, Hu Z. PFKM inhibits doxorubicin-induced cardiotoxicity by enhancing oxidative phosphorylation and glycolysis. Sci Rep 2022; 12:11684. doi: 10.1038/s41598-022-15743-0 [Crossref] [ Google Scholar]
- Liu S, Song L, Yao H, Zhang L. HPV16 E6/E7 stabilize PGK1 protein by reducing its poly-ubiquitination in cervical cancer. Cell Biol Int 2022; 46:370-80. doi: 10.1002/cbin.11744 [Crossref] [ Google Scholar]
- Xu T, Jiang J, Xiang X, Jahanshahi H, Zhang Y, Chen X. Conduction and validation of a novel prognostic signature in cervical cancer based on the necroptosis characteristic genes via integrating of multiomics data. Comput Biol Med 2024; 168:107656. doi: 10.1016/j.compbiomed.2023.107656 [Crossref] [ Google Scholar]
- Bolaños-Suárez V, Alfaro A, Espinosa AM, Medina-Martínez I, Juárez E, Villegas-Sepúlveda N. The mRNA and protein levels of the glycolytic enzymes lactate dehydrogenase A (LDHA) and phosphofructokinase platelet (PFKP) are good predictors of survival time, recurrence, and risk of death in cervical cancer patients. Cancer Med 2023; 12:15632-49. doi: 10.1002/cam4.6123 [Crossref] [ Google Scholar]
- Cai L, Hu C, Yu S, Liu L, Yu X, Chen J. Identification and validation of a six-gene signature associated with glycolysis to predict the prognosis of patients with cervical cancer. BMC Cancer 2020; 20:1133. doi: 10.1186/s12885-020-07598-3 [Crossref] [ Google Scholar]
- Chuong HQ, Xinh PT, Tram DB, Ha NT, Nguyen TM, Anh PN. Spectrum of WAS gene mutations in Vietnamese patients with Wiskott-Aldrich syndrome. Pediatr Int 2024; 66:e15770. doi: 10.1111/ped.15770 [Crossref] [ Google Scholar]
- Hou J, Yang H, Huang X, Leng X, Zhou F, Xie C. N-WASP promotes invasion and migration of cervical cancer cells through regulating p38 MAPKs signaling pathway. Am J Transl Res 2017; 9:403-15. [ Google Scholar]
- Zhang J, Meng S, Wang X, Wang J, Fan X, Sun H. Sequential gene expression analysis of cervical malignant transformation identifies RFC4 as a novel diagnostic and prognostic biomarker. BMC Med 2022; 20:437. doi: 10.1186/s12916-022-02630-8 [Crossref] [ Google Scholar]
- Chang C, Li L, Su L, Yang F, Zha Q, Sun M. Intron retention of DDX39A driven by SNRPD2 is a crucial splicing axis for oncogenic MYC/spliceosome program in hepatocellular carcinoma. Adv Sci (Weinh) 2024; 11:e2403387. doi: 10.1002/advs.202403387 [Crossref] [ Google Scholar]
- Kuramitsu Y, Suenaga S, Wang Y, Tokuda K, Kitagawa T, Tanaka T. Up-regulation of DDX39 in human pancreatic cancer cells with acquired gemcitabine resistance compared to gemcitabine-sensitive parental cells. Anticancer Res 2013; 33:3133-6. [ Google Scholar]
- Kato M, Wei M, Yamano S, Kakehashi A, Tamada S, Nakatani T. DDX39 acts as a suppressor of invasion for bladder cancer. Cancer Sci 2012; 103:1363-9. doi: 10.1111/j.1349-7006.2012.02298.x [Crossref] [ Google Scholar]
- Qin W, He C, Jiang D, Gao Y, Chen Y, Su M. Systematic construction and validation of a novel ferroptosis-related gene model for predicting prognosis in cervical cancer. J Immunol Res 2022; 2022:2148215. doi: 10.1155/2022/2148215 [Crossref] [ Google Scholar]
- Wang M, Li Z. Prediction of prognosis and immune landscape in cervical cancer based on heat shock protein-related genes. Int J Hyperthermia 2023; 40:2259140. doi: 10.1080/02656736.2023.2259140 [Crossref] [ Google Scholar]
- Chabab G, Boissière-Michot F, Mollevi C, Ramos J, Lopez-Crapez E, Colombo PE. Diversity of tumor-infiltrating, γδ T-cell abundance in solid cancers. Cells 2020; 9:1537. doi: 10.3390/cells9061537 [Crossref] [ Google Scholar]
- Mohamed AH, Ahmed AT, Al Abdulmonem W, Bokov DO, Shafie A, Al-Hetty H. Interleukin-6 serves as a critical factor in various cancer progression and therapy. Med Oncol 2024; 41:182. doi: 10.1007/s12032-024-02422-5 [Crossref] [ Google Scholar]
- Johnson DE, O'Keefe RA, Grandis JR. Targeting the IL-6/JAK/STAT3 signalling axis in cancer. Nat Rev Clin Oncol 2018; 15:234-48. doi: 10.1038/nrclinonc.2018.8 [Crossref] [ Google Scholar]
- Coussens LM, Werb Z. Inflammation and cancer. Nature 2002; 420:860-7. doi: 10.1038/nature01322 [Crossref] [ Google Scholar]
- Fendt SM. 100 years of the Warburg effect: a cancer metabolism endeavor. Cell 2024; 187:3824-8. doi: 10.1016/j.cell.2024.06.026 [Crossref] [ Google Scholar]
- Yarden Y, Sliwkowski MX. Untangling the ErbB signalling network. Nat Rev Mol Cell Biol 2001; 2:127-37. doi: 10.1038/35052073 [Crossref] [ Google Scholar]
- Osanai M, Takasawa A, Takasawa K, Kyuno D, Ono Y, Magara K. Retinoic acid metabolism in cancer: potential feasibility of retinoic acid metabolism blocking therapy. Med Mol Morphol 2023; 56:1-10. doi: 10.1007/s00795-022-00345-6 [Crossref] [ Google Scholar]
- Dhanasekaran DN, Reddy EP. JNK-signaling: a multiplexing hub in programmed cell death. Genes Cancer 2017; 8:682-94. doi: 10.18632/genesandcancer.155 [Crossref] [ Google Scholar]
- Kang S, Jin S, Mao X, He B, Wu C. CD4 + T and CD8 + T cells in uterus exhibit both selective dysfunction and residency signatures. J Immunol Res 2024; 2024:5582151. doi: 10.1155/2024/5582151 [Crossref] [ Google Scholar]
- Chen Y, Yu D, Qian H, Shi Y, Tao Z. CD8 + T cell-based cancer immunotherapy. J Transl Med 2024; 22:394. doi: 10.1186/s12967-024-05134-6 [Crossref] [ Google Scholar]
- Ohue Y, Nishikawa H. Regulatory T (Treg) cells in cancer: Can Treg cells be a new therapeutic target?. Cancer Sci 2019; 110:2080-9. doi: 10.1111/cas.14069 [Crossref] [ Google Scholar]
- Gustafson HH, Pun SH. Instructing macrophages to fight cancer. Nat Biomed Eng 2018; 2:559-61. doi: 10.1038/s41551-018-0276-0 [Crossref] [ Google Scholar]
- Zhang J, An L, Zhou X, Shi R, Wang H. Analysis of tumor mutation burden combined with immune infiltrates in endometrial cancer. Ann Transl Med 2021; 9:551. doi: 10.21037/atm-20-6049 [Crossref] [ Google Scholar]
- Lichterman JN, Reddy SM. Mast cells: a new frontier for cancer immunotherapy. Cells 2021; 10:1270. doi: 10.3390/cells10061270 [Crossref] [ Google Scholar]
- Liu C, Zhang M, Yan X, Ni Y, Gong Y, Wang C. Single-cell dissection of cellular and molecular features underlying human cervical squamous cell carcinoma initiation and progression. Sci Adv 2023; 9:eadd8977. doi: 10.1126/sciadv.add8977 [Crossref] [ Google Scholar]
- Qiu J, Qu X, Wang Y, Guo C, Lv B, Jiang Q. Single-cell landscape highlights heterogenous microenvironment, novel immune reaction patterns, potential biomarkers and unique therapeutic strategies of cervical squamous carcinoma, human papillomavirus-associated (HPVA) and non-HPVA adenocarcinoma. Adv Sci (Weinh) 2023; 10:e2204951. doi: 10.1002/advs.202204951 [Crossref] [ Google Scholar]
- Zhang S, Wan J, Chen M, Cai D, Xu J, Chen Q. Tumor-infiltrating CD8 + T cells driven by the immune checkpoint-associated gene IDO1 are associated with cervical cancer prognosis. Front Oncol 2021; 11:720447. doi: 10.3389/fonc.2021.720447 [Crossref] [ Google Scholar]
- Guo A, Huang H, Zhu Z, Chen MJ, Shi H, Yuan S. cBAF complex components and MYC cooperate early in CD8 + T cell fate. Nature 2022; 607:135-41. doi: 10.1038/s41586-022-04849-0 [Crossref] [ Google Scholar]